Article

The Cumulative Effect of Gene-Gene and Gene-Environment Interactions on the Risk of Prostate Cancer in Chinese Men

1
Department of Cell Biology and Genetics, School of Basic Medical Science, Shanxi Medical University, Taiyuan 030001, China
2
The Key Laboratory of Geriatrics, Beijing Hospital & Beijing Institute of Geriatrics, Ministry of Health, Beijing 100730, China
3
Graduate School, Peking Union Medical College and Chinese Academy of Medical Sciences, Beijing 100005, China
4
Department of Urology and Beijing Hospital, Chinese Ministry of Health, Beijing 100730, China
5
Department of Urology, The Second Hospital of Tianjin Medical University, Tianjin 300211, China
6
Medical Examination Centre, Beijing Hospital, Ministry of Health, Beijing 100730, China
7
Guangxi Zhuang Autonomous Region Women and Children Care Hospital, Nanning, Guangxi 530003, China
*
Authors to whom correspondence should be addressed.
These authors contributed equally to this work.
Int. J. Environ. Res. Public Health 2016, 13(2), 162; https://doi.org/10.3390/ijerph13020162
Submission received: 24 November 2015 / Revised: 15 January 2016 / Accepted: 18 January 2016 / Published: 27 January 2016

Abstract

:
Prostate cancer (PCa) is a multifactorial disease involving complex genetic and environmental factors interactions. Gene-gene and gene-environment interactions associated with PCa in Chinese men are less studied. We explored the association between 36 SNPs and PCa in 574 subjects from northern China. Body mass index (BMI), smoking, and alcohol consumption were determined through self-administered questionnaires in 134 PCa patients. Then gene-gene and gene-environment interactions among the PCa-associated SNPs were analyzed using the generalized multifactor dimensionality reduction (GMDR) and logistic regression methods. Allelic and genotypic association analyses showed that six variants were associated with PCa and the cumulative effect suggested men who carried any combination of 1, 2, or ≥3 risk genotypes had a gradually increased PCa risk (odds ratios (ORs) = 1.79–4.41). GMDR analysis identified the best gene-gene interaction model with scores of 10 for both the cross-validation consistency and sign tests. For gene-environment interactions, rs6983561 CC and rs16901966 GG in individuals with a BMI ≥ 28 had ORs of 7.66 (p = 0.032) and 5.33 (p = 0.046), respectively. rs7679673 CC + CA and rs12653946 TT in individuals that smoked had ORs of 2.77 (p = 0.007) and 3.11 (p = 0.024), respectively. rs7679673 CC in individuals that consumed alcohol had an OR of 4.37 (p = 0.041). These results suggest that polymorphisms, either individually or by interacting with other genes or environmental factors, contribute to an increased risk of PCa.

1. Introduction

Prostate cancer (PCa) is a complex multifactorial disease. A twin study suggested that genetic factors may explain 42% of the etiological risk of PCa [1]. Genome-wide association studies (GWAS) identified over 70 PCa susceptibility variants, providing evidence of genetic susceptibility in the development of PCa. However, these polymorphic loci were common variants, mostly with low penetrance [2]. The odds ratios (ORs) of these PCa-associated single nucleotide polymorphisms (SNPs) were modest (1.02–1.66) and no one locus contributed highly to the risk of PCa [3].
Gene-gene interactions play a role in potential mechanisms of the missing heritability in human genetics, and research has identified the phenomenon in PCa. For example, Tao et al. identified 1325 pairs of SNP–SNP interactions with a P cutoff of 1.0 × 10⁻⁸ in 1176 PCa cases and 1101 control subjects from the National Cancer Institute Cancer Genetic Markers of Susceptibility study, although no SNP-SNP interaction reached a genome-wide significance level of 4.4 × 10⁻¹³ [4]. A study by Ciampa et al. showed that two biologically interesting interactions, one between rs748120 of NR2C2 and subregions of 8q24 and that between rs4810671 of SULF2 and both JAZF1 and HNF1B, were associated with PCa [5]. In cases of Italian heredo-familial PCa, VDR1 T/T genotypes coupled with the VDR2 T/T genotype exhibited a five-fold higher probability of PCa [6]. Additionally, some studies showed that the cumulative effect of such interactions could increase the ORs of PCa. Specifically, the risk of PCa in men with six or more risk alleles was higher than in men with two or fewer risk alleles (OR = 6.22) [7]. In a Swedish population, the OR for PCa was 9.46 in men who had five or more SNPs associated with PCa, compared with men without any of these SNPs [8].
Environmental factors play a significant role and perhaps can modify the genetic risk of PCa [9]. Body mass index (BMI), smoking, and alcohol consumption are PCa-related environmental factors that affect the risk of this disease. A meta-analysis of prospective studies indicated that obesity may have a dual effect on the risk of PCa: a decreased risk for localized PCa and an increased risk for advanced PCa [10]. Smoking cessation can reduce the risk of developing PCa [11]. Alcohol consumption is related to an increased risk of PCa in a Chinese population [12].
Despite identifying dozens of PCa risk variants using GWAS, as well as the emergence of evidence of environmental risk factors that contribute to PCa, the effect of gene-gene and gene-environment interactions on the risk of PCa is largely unknown. In the current study, 36 SNPs were selected from a GWAS and used to estimate their association with PCa in 286 cases and 288 control subjects. We determined the gene-gene interactions and cumulative effects between the confirmed PCa risk SNPs. Finally, the gene-environment interactions in 134 PCa patients were analyzed to identify the combination of factors yielding the greatest risk of PCa in Chinese men.

2. Materials and Methods

2.1. Study Population

This was a case-control study including 286 PCa patients and 288 healthy geographically matched controls. All subjects were unrelated Northern Han Chinese men, and were permanent residents of Beijing or Tianjin (Jingjin area). Detailed inclusion criteria of cases and controls were described previously [13]. The age at diagnosis, the Gleason score, tumour stage, serum PSA levels of PCa patients were obtained and aggressive PCa was defined as tumours with a PSA level > 20 ng/mL, and/or a Gleason score ≥8 or higher, and/or a pathological stage ≥III [14]. This study was approved by the ethics committee of the two participating hospitals (ethical approval number: 2013BJYYEC-047-01), and informed consent was obtained from all study participants.
Height and body weight were measured in 134 Beijing PCa cases, and information about smoking and alcohol consumption were collected. BMI was calculated using the individual’s height and weight (kilograms per square meter), and categorized according to standard cut-off points for the Chinese population (underweight <18.5, normal weight 18.5–24.0, overweight 24.0–28.0, and obese ≥28.0) [15]. In our study, all patients were classified into normal, overweight, or obese groups.
Questionnaire data collected about smoking included addiction (current, past, or never smoked), age of smoking initiation, years of smoking, number of cigarettes smoked per day, and years since quitting smoking. Individuals smoking every day, or some days, were classified as current smokers. Those who responded “not at all” were classified as never smokers, and individuals with a smoking history but who had quit were classified as past smokers [16]. Because of the small sample size in our study, the number of smoking classifications was reduced. Past smokers who had smoked more than 100 cigarettes in their lifetime were classified as current smokers and those who had smoked fewer than 100 cigarettes in their lifetime were classified as never smokers.
Individuals that consumed alcohol were grouped into four categories: non-drinking, drinking on special occasions only, often drinking, and drinking every day [17]. Non-drinking and drinking occasionally individuals were classified as “seldom”. Drinking every day and drinking often were classified as “often”.

2.2. Selection of SNPs for Genotyping

Thirty-six PCa-associated SNPs, identified in a GWAS from 2007 to 2010 and a Multiethnic Cohort study of a functional locus, were selected for genotyping [18,19,20,21,22,23,24,25,26,27]. Blood genomic DNA was extracted and the selected loci were genotyped as described previously [13]. rs11986220 was genotyped by sequencing while the other 36 SNPs were determined by using polymerase chain reaction-high resolution melting curves (PCR-HRM) of small amplicons and sequencing methods. Briefly, a final reaction volume of 10 µL included 1 µL of 1× LC-green PLUS fluorescent dye and 0.05 µL of each pair of low and high temperature calibrators (10 pmol/µL). After the PCR reaction, products were transferred into matching 96-well plates to be genotyped automatically and verified manually using a Lightscanner TMHR-I 96 (Idaho Technology, Inc., Salt Lake City, UT, USA). To validate the accuracy of genotyping, about 10% of the samples were selected randomly for duplicate analysis. In addition, five samples were selected randomly from the three different verified genotypes of each risk variant to be sequenced (Beijing Genomics Institute, Beijing, China) to confirm the genotyping results. All primers used for both PCR-HRM and PCR sequencing were designed using Oligo (version 6.0; Molecular Biology Insights, Inc., Cascade, CO, USA). Tables S1 and S2 list the information about the primers that were used.

2.3. Gene-Gene Interaction Analyses

The Generalized Multifactor Dimensionality Reduction (GMDR) (GMDR Software, Beta version 0.7; Department of Biostatistics, University of Alabama, Birmingham, AL, USA) method, with age adjustment, was used to determine gene-gene interactions between PCa-associated SNPs [28,29]. Ten-fold cross-validation (CV) was set when running the software. The age-adjusted model with the smallest prediction error (the greatest testing balanced accuracy), the highest CV consistency, and 
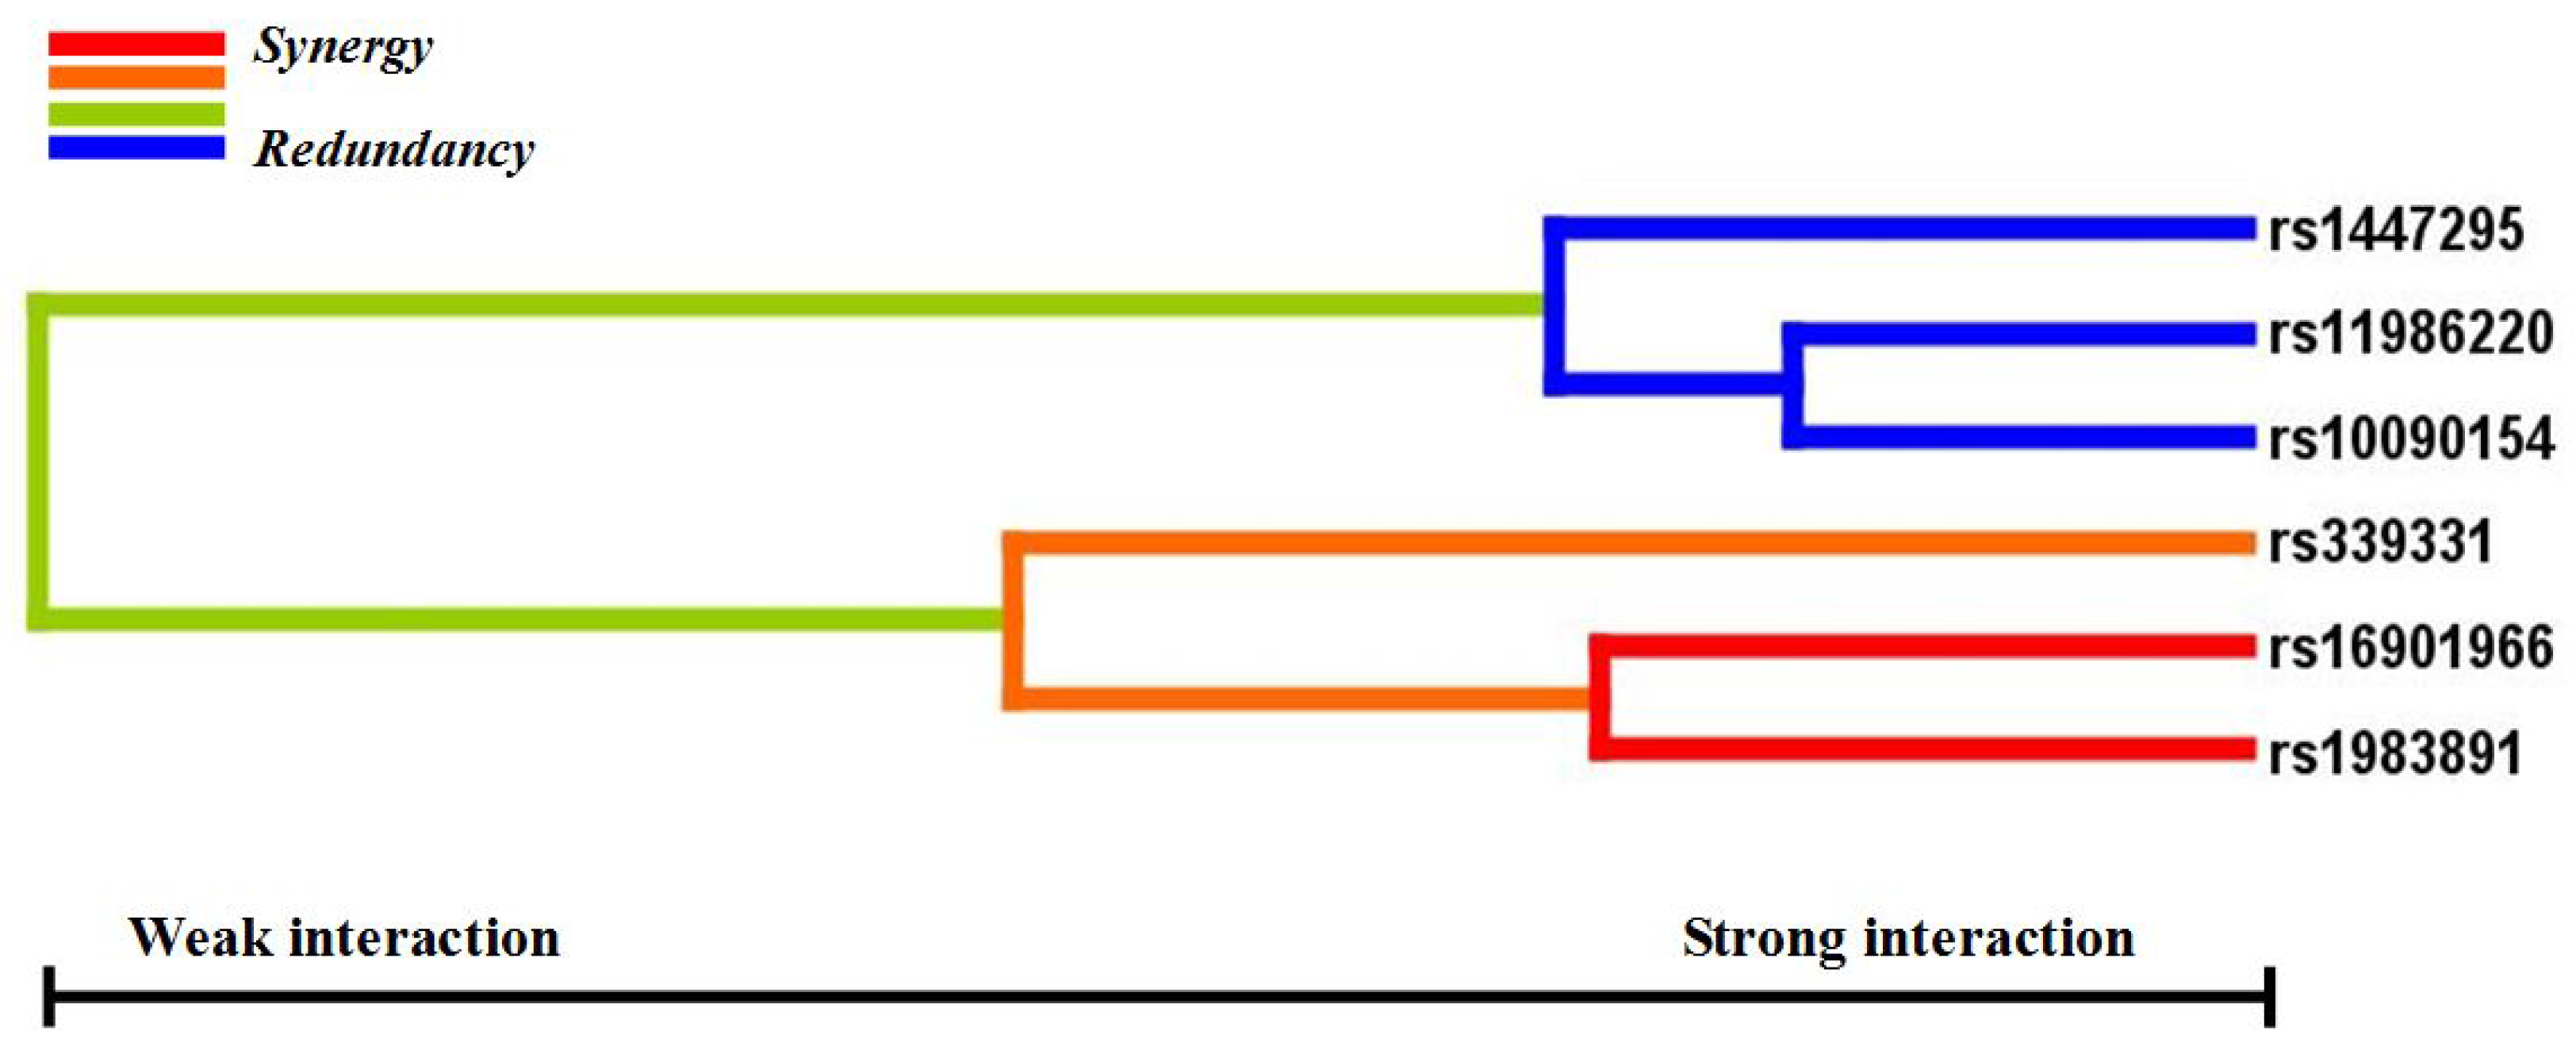
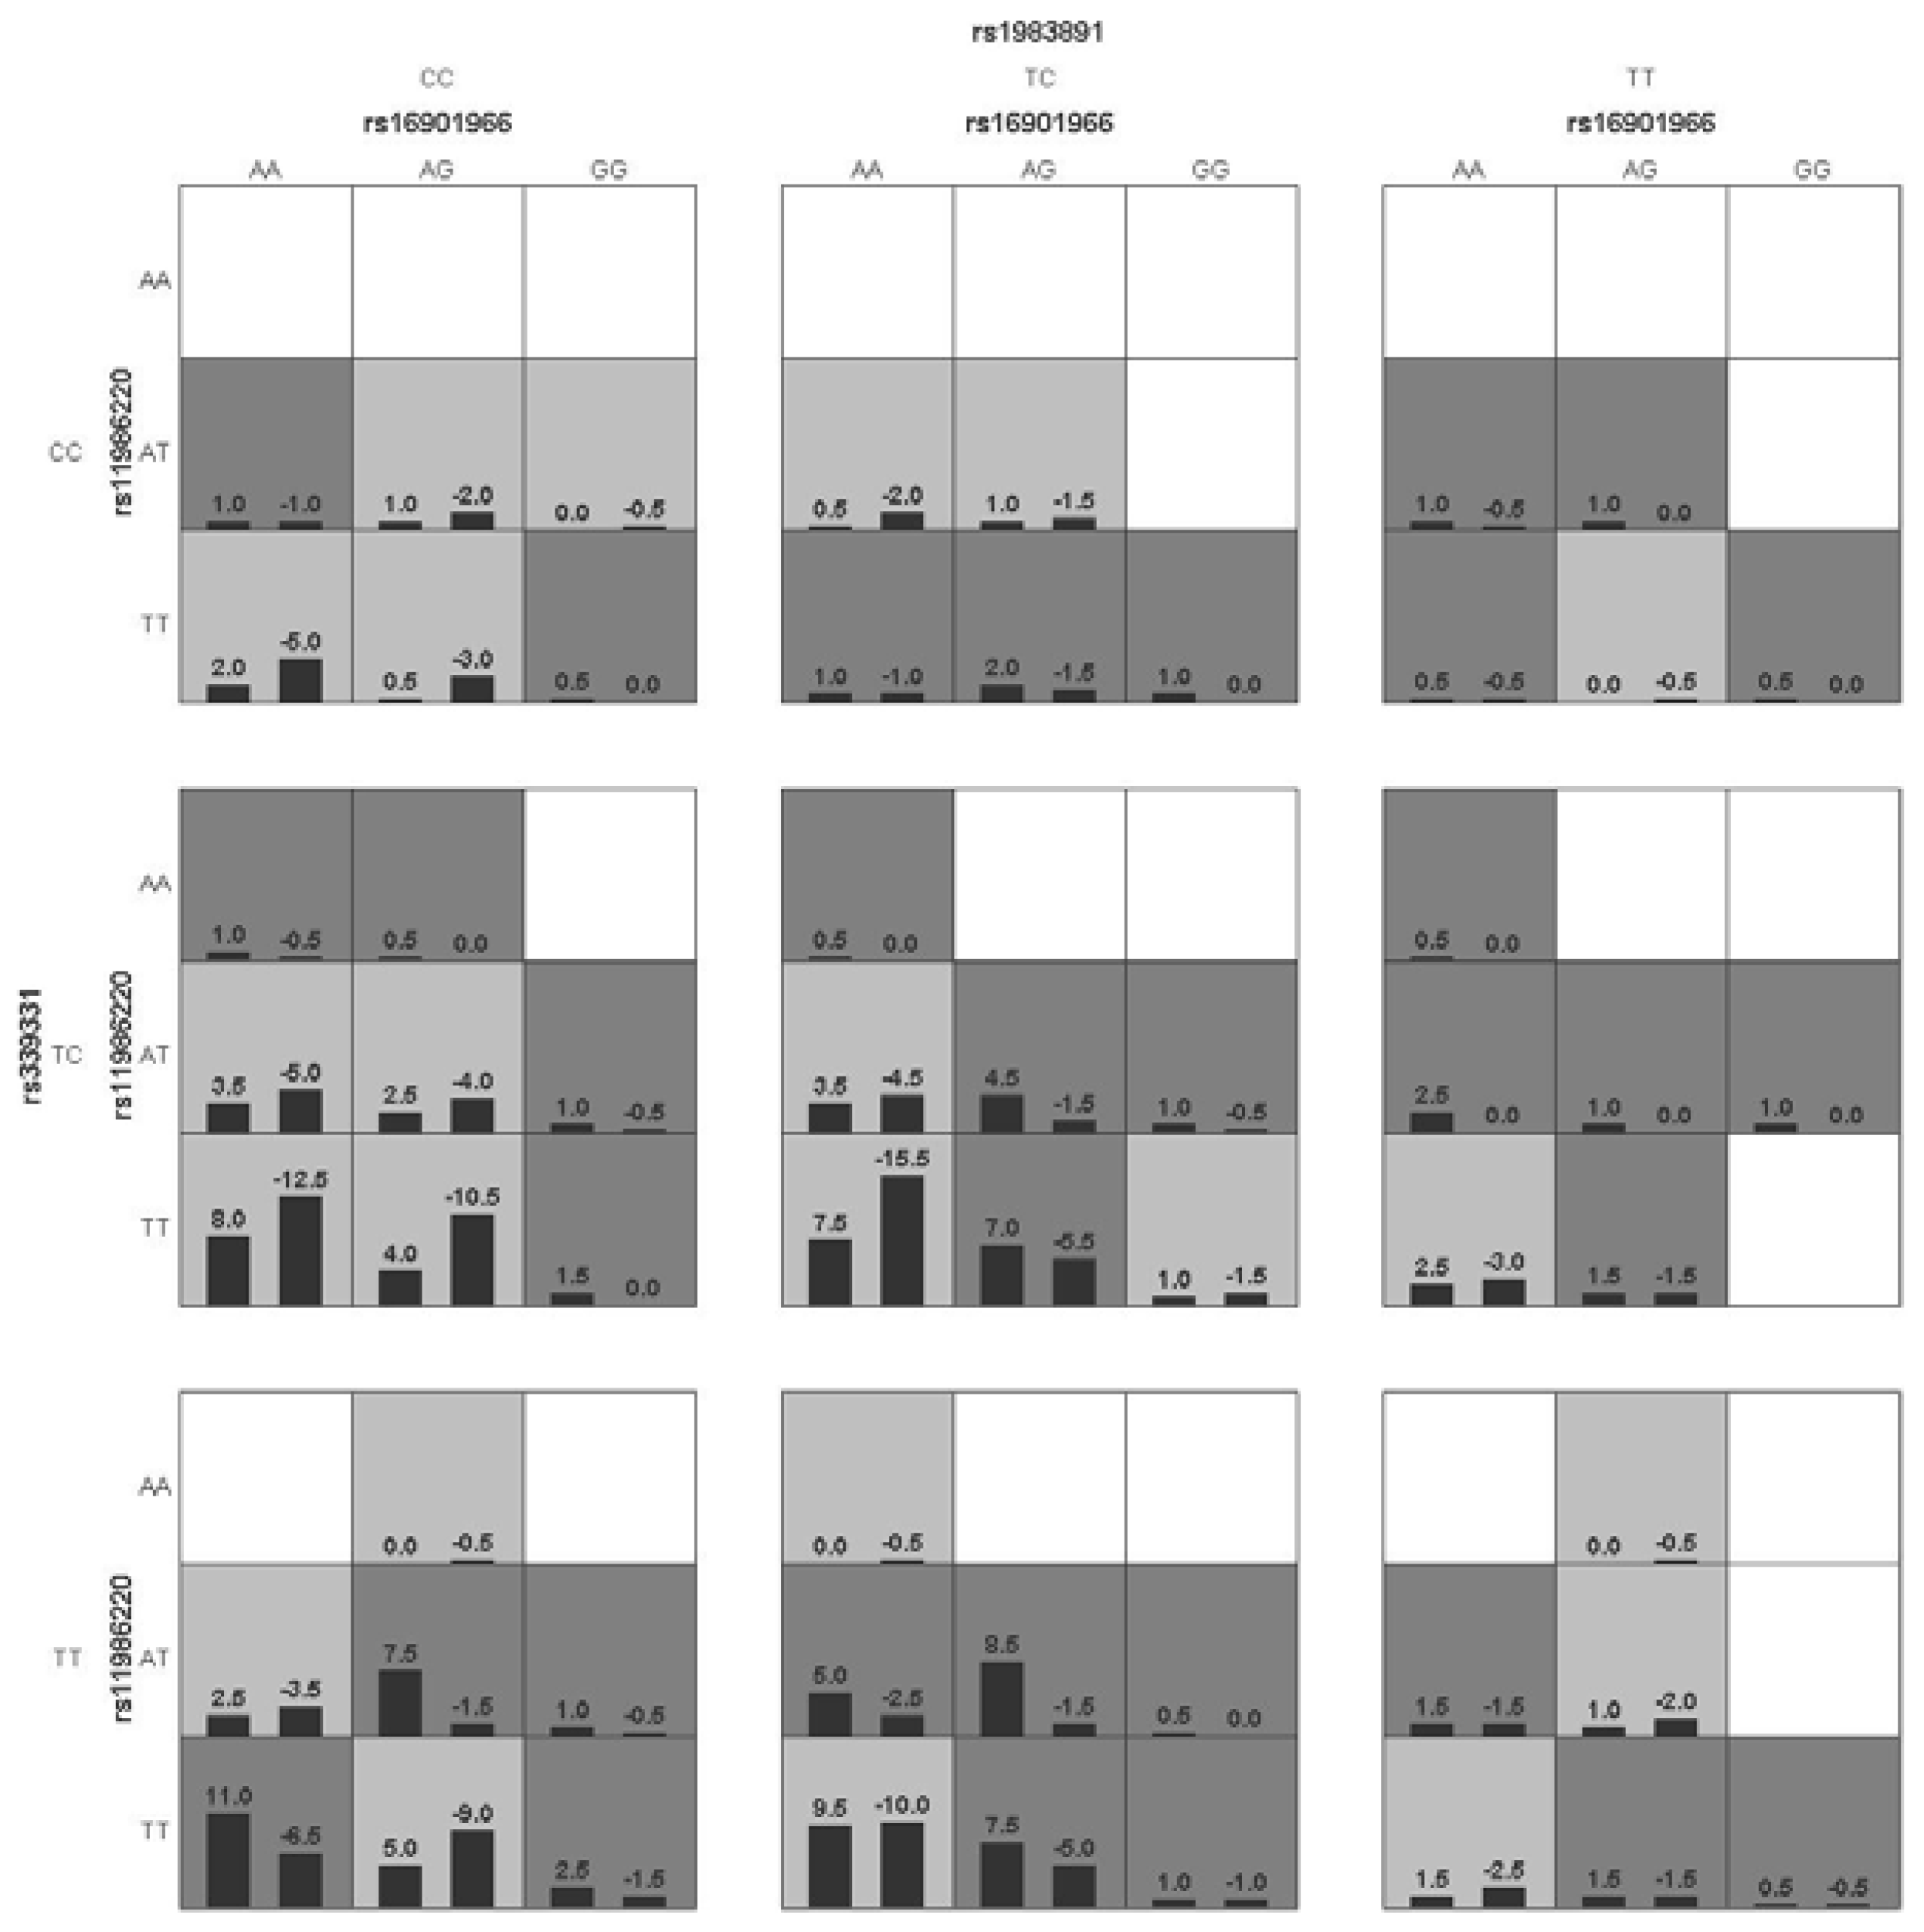
p < 0.05 in the sign test was selected as the best n-loci model. In this study, we analyzed the interaction among six SNPs associated with a risk for PCa (rs16901966, rs11986220, rs1447295, and rs10090154 at 8q24; rs1983891 at FOXP4; rs339331 at GPRC6A) by using a GMDR model that adjusted for age. Entropy-based interaction dendrograms were built by using Multifactor Dimensionality Reduction (MDR) to better confirm and visualize the interaction models identified by GMDR [30].

2.4. Cumulative Effect Analysis

Based on the results of the association analyses between 36 SNPs and PCa, the cumulative effect was determined among five confirmed PCa risk loci, excluding rs11986220, which is linked with rs10090154. Combined with genotyping data, samples that carried none, one, two, or more than two of the risk genotypes were labeled 0, 1, 2, and ≥3, respectively. Risk genotypes were defined from the genetic model analyses of rs1983891 TT/TC, rs339331 TT, rs16901966 GG, rs11986220 AA/AT, rs1447295 AA/AC, and rs10090154 TC/TT. ORs and 95% confidence intervals (CIs) were calculated to compare the frequency of risk genotypes between PCa cases and controls. The logistic regression method was used to calculate the ORs and 95% CIs (or the age-adjusted ORs and 95% CIs).

2.5. Gene-Environment Interaction Analyses

A logistic regression test was used for the gene-environment interaction analyses. For gene-BMI interactions, BMI < 24.0, BMI = 24.0–28.0, and BMI ≥ 28.0 were defined as 1, 2, and 3, respectively. For gene-smoking interactions, never smokers and current smokers were defined as 1 and 2, respectively. For gene-drinking interactions, seldom and often were defined as 1 and 2, respectively. During multinomial logistic regression calculations, independent genotypes of the 36 SNPs were categorized as “dependent” and environmental factors were categorized as “factor”, while age was selected as “covariate” when adjusting the regression. In general, the non-risk genotypes and those in an unexposed environment (BMI < 24.0, never smoking, and seldom drinking) were used as the control group, and compared with the risk genotype and those in an exposed environment (BMI = 24.0–28.0, BMI ≥ 28.0, current smoking, and often drinking).

2.6. Statistical Analyses

Pearson’s χ2 was used to test the Hardy-Weinberg equilibrium (HWE) for each SNP separately among the control subjects. Logistic regression was used to estimate the unadjusted and age-adjusted ORs and 95% CIs for each risk allele (designated as “1”) versus each non-risk allele (designated as “2”). Genotypes 11, 12, and 22 represented risk homozygotes, risk heterozygotes, and non-risk homozygotes, respectively. When ORs and 95% CIs were calculated by logistic regression in the different models, genotypes 11 + 12 were designated as “1” and genotype 22 was designated as “2” in a dominant mode, and genotype 11 was designated as “1” and genotypes 12 + 22 were designated as “2” in a recessive mode. Logistic regression analyses were also used to estimate ORs and 95% CIs, and age adjusted ORs and 95% CIs, of cumulative effects. Statistical analyses were performed using the Statistical Package for the Social Sciences software package (version 16.0; SPSS, Inc., Chicago, IL, USA), and p < 0.05 was considered significant.

3. Results

3.1. Demographics

Characteristics of the 286 PCa cases and 288 controls are shown in Table 1. The mean age ± SD of cases and controls were 72.3 ± 7.5 years (range from 46 to 93) and 70.5 ± 7.6 years (range from 59 to 89), respectively (p = 0.005). Within the 134 PCa cases, BMI < 24.0, BMI = 24–28, and BMI ≥ 28 were 57 (42.5%), 61 (45.5%), and 16 (11.9%) cases, respectively. Never and current smokers were 73 (54.7%) and 61 (45.3%) cases, respectively. Seldom and often drinkers were 116 (86.6%) and 18 (13.4%), respectively.
Table 1. Selected demographic characteristics of study subjects.
CharacteristicsCasesControlp
Number of subjects286288-
Age, years (mean [SD])72.30 (7.458)70.47 (7.604)0.005
Range46–9359–89-
PSA (ng/mL)
Range0.15–13380–4
<10102
10–2040
>2078
Gleason score146
4–651
750
8–1045
Tumor stage138
I9
II69
III46
IV14
Aggressiveness163
Nonaggressive PCa48
Aggressive PCa115
A positive family history of PCa8
BMI134
<24.057
24–2861
≥2816
Smoking134
Never73
Current61
Drinking134
Seldom116
Often18

3.2. Allelic and Genotypic Associations with PCa

Table 2 displays the allelic frequencies of the 36 SNPs. Analyses of the allelic frequencies of PCa cases and controls showed that rs1465618-A, rs1983891-T, rs339331-T, rs16901966-G, rs1447295-A, rs11986220-A, and rs10090154-T SNPs were associated with a 28%–57% increase in the risk of PCa (age-adjusted OR 1.28–1.57; p = 0.050–0.005).
Genotypic frequencies of all 36 SNPs among control subjects, except SNP rs2710646 (p < 0.05), did not deviate from the HWE (p > 0.05) (Table S3). The genotype distribution in genetic models showed that rs1983891, rs10086908, rs1447295, rs11986220, and rs10090154 were associated with a risk of PCa in the dominant model (age-adjusted ORs 1.44–1.71; p = 0.034–0.002). rs339331, rs1016343, rs16901966, rs7127900, and rs4430796 were associated with a risk of PCa in the recessive model (age-adjusted ORs 1.51–2.26; p = 0.025–0.007) (Table 3). Sequencing results were consistent with the genotypes of variants identified by HRM.
Based on these results, only rs16901966, rs11986220, rs1447295, and rs10090154 at 8q24, rs1983891 at FOXP4, and rs339331 at RFX6 of the 36 SNPs examined, were associated with PCa in the allele and genotype association analyses.
Table 2. Association analysis between the alleles of 36 SNPs and PCa in Chinese men.
Region AllelesRAFUnadjusted Allelic ORAge-adjusted Allelic ORPower
refSNP ID(1/2) *CaseControl
11OR (95% CI)pOR (95% CI)p
EHBP1rs721048A/G0.0380.0241.20 (0.65–2.19)0.5631.74 (0.84–3.62)0.1380.278
EHBP1rs2710646A/C0.0420.0351.61 (0.78–3.32)0.2011.30 (0.71–2.39)0.4020.380
THADArs1465618A/G0.6940.6461.25 (0.97–1.60)0.0851.31 (1.02–1.69)0.0340.408
ITGA6rs12621278A/G0.7200.7191.01 (0.78–1.30)0.9601.02 (0.78–1.32)0.8990.050
C2orf43rs13385191G/A0.4720.4441.12 (0.89–1.41)0.3411.11 (0.88–1.40)0.3840.159
3p12rs2660753A/G0.3380.3301.04 (0.80–1.34)0.7801.03 (0.80–1.34)0.8140.060
3q21rs10934853A/C0.4230.4320.97 (0.76–1.22)0.7720.97 (0.76–1.22)0.7670.060
PDLIM5rs17021918C/T0.6500.6670.93 (0.73–1.18)0.5350.93 (0.73–1.19)0.5730.093
TET2rs7679673C/A0.2250.2101.10 (0.82–1.46)0.5251.08 (0.81–1.44)0.5990.094
5p15rs12653946T/C0.4310.3981.15 (0.91–1.45)0.2521.12 (0.88–1.42)0.3440.206
SLC22A3rs9364554T/C0.3270.3420.94 (0.73–1.21)0.6190.93 (0.72–1.20)0.5960.084
FOXP4rs1983891T/C0.3550.3031.27 (1.00–1.63)0.0551.28 (1.00–1.65)0.0500.313
GPRC6A/RFX6rs339331T/C0.6900.6201.40 (1.10–1.79)0.0071.35 (1.06–1.74)0.0170.703
LMTK2rs6465657C/T0.8780.8631.15 (0.81–1.63)0.4261.11 (0.78–1.57)0.5570.117
NKX3-1rs1512268A/G0.3400.3121.14 (0.89–1.46)0.3041.17 (0.91–1.51)0.2120.173
8q24 (Block1)rs12543663C/A0.1010.0841.23 (0.82–1.83)0.3181.26 (0.84–1.9)0.2570.169
8q24 (Block1)rs10086908T/C0.7860.8030.89 (0.65–1.22)0.4730.89 (0.65–1.23)0.4990.110
8q24 (Block2/Region2)rs1016343T/C0.4290.3841.20 (0.95–1.52)0.1241.21 (0.95–1.54)0.1150.342
8q24 (Block2/Region2)rs13252298G/A0.2850.2871.01 (0.78–1.31)0.9541.00 (0.77–1.31)0.9880.051
8q24 (Block2/Region2)rs6983561C/A0.3000.2541.26 (0.97–1.63)0.0861.27 (0.98–1.66)0.0730.414
8q24 (Block2/Region2)rs16901966G/A0.2990.2441.32 (1.02–1.72)0.0371.33 (1.02–1.73)0.0350.554
8q24 (Block3/Region3)rs16902094G/A0.2880.2651.12 (0.86–1.46)0.3881.14 (0.88–1.49)0.3270.140
8q24 (Block3/Region3)rs445114T/C0.5460.5421.07 (0.71–1.60)0.7571.05 (0.70–1.58)0.8290.052
8q24 (Block3/Region5)rs620861C/T0.5590.5620.99 (0.79–1.26)0.9581.00 (0.79–1.27)0.9910.051
8q24 (Block4/Region3)rs6983267G/T0.4630.4241.17 (0.92–1.48)0.1961.15 (0.90–1.45)0.2610.265
8q24 (Block5/Region1)rs1447295A/C0.2240.1641.47 (1.09–1.98)0.0111.49 (1.10–2.01)0.0100.729
8q24 (Block 5/Region 1)rs11986220A/T0.2110.1451.59 (1.16–2.16)0.0041.57 (1.14–2.15)0.0050.832
8q24 (Block5/Region1)rs10090154T/C0.2080.1451.55 (1.14–2.12)0.0061.53 (1.12–2.10)0.0080.800
8q24 (Block5/Region1)rs7837688T/C0.2030.1631.3 (0.96–1.77)0.0881.28 (0.94–1.75)0.1120.418
MSMBrs10993994T/C0.5220.4911.13 (0.88–1.46)0.3281.12 (0.87–1.44)0.3850.183
11p15rs7127900G/A0.8470.9000.61 (0.41–0.92)0.0180.60 (0.40–0.90)0.0130.470
11q13rs7931342G/T0.2600.2830.89 (0.69–1.16)0.3880.90 (0.69–1.17)0.4360.141
13q22rs9600079T/G0.4640.4361.12 (0.89–1.41)0.3411.09 (0.86–1.38)0.4690.159
HNF1Brs4430796A/G0.7640.7091.33 (0.95–1.86)0.0991.31 (0.93–1.83)0.1230.562
17q24rs1859962G/T0.4530.4091.20 (0.94–1.52)0.1501.21 (0.94–1.54)0.1340.325
KLK2/KLK3rs2735839G/A0.5790.6070.89 (0.70–1.13)0.3350.88 (0.69–1.12)0.2900.162
Note: * Risk alleles are listed first (1) in the allele column. p < 0.05 are in bold.
Table 3. Association analysis between the different genetic models of 36 SNPs and PCa in Chinese men.
Unadjusted Genotypic ORAge-Adjusted Genotypic OR
Additive ModelDominant ModelRecessive ModelDominant ModelRecessive Model
refSNP ID(df = 2)(11 + 12 vs. 22)(11 vs. 12 + 22)(11 + 12 vs. 22)(11 vs. 12 + 22)
pOR (95%CI)pOR (95% CI)pOR (95% CI)pOR (95% CI)p
rs7210480.3101.46 (0.69–3.09)0.327--1.57 (0.74–3.36)0.242--
rs27106460.7841.24 (0.64–2.40)0.524--1.34 (0.69–2.6)0.396--
rs14656180.4801.53 (0.94–2.5)0.0851.36 (0.97–1.89)0.0721.55 (0.95–2.53)0.0811.32 (0.95–1.85)0.103
rs126212780.9490.94 (0.52–1.71)0.8391.03 (0.74–1.43)0.8610.95 (0.52–1.75)0.8770.99 (0.71–1.38)0.939
rs133851910.2931.02 (0.71–1.46)0.9061.37 (0.91–2.04)0.1311.01 (0.70–1.45)0.9551.35 (0.90–2.03)0.149
rs26607530.9151.02 (0.72–1.43)0.9171.12 (0.66–1.90)0.6761.00 (0.71–1.42)0.9831.13 (0.66–1.93)0.652
rs109348530.8490.92 (0.65–1.30)0.6151.02 (0.67–1.55)0.9310.90 (0.63–1.27)0.5391.05 (0.68–1.60)0.833
rs170219180.2891.15 (0.70–1.90)0.5780.82 (0.59–1.14)0.2281.12 (0.68–1.86)0.6490.83 (0.60–1.17)0.288
rs76796730.1790.99 (0.71–1.40)0.9672.00 (0.91–4.38)0.0840.98 (0.69–1.38)0.8851.96 (0.89–4.33)0.095
rs126539460.2100.97 (0.69–1.38)0.8811.35 (0.87–2.09)0.1870.94 (0.66–1.34)0.7251.33 (0.85–2.07)0.216
rs93645540.3690.84 (0.59–1.17)0.2991.18 (0.68–2.05)0.5510.81 (0.57–1.14)0.2231.26 (0.72–2.21)0.414
rs19838910.3121.40 (1.01–1.94)0.0461.31 (0.78–2.19)0.3101.44 (1.03–2.00)0.0341.28 (0.76–2.15)0.364
rs3393310.0291.33 (0.80–2.20)0.2661.57 (1.12–2.19)0.0081.30 (0.79–2.16)0.3071.51 (1.08–2.12)0.016
rs64656570.423--1.10 (0.75–1.61)0.628--1.06 (0.72–1.56)0.780
rs15122680.5631.18 (0.85–1.64)0.3361.24 (0.69–2.20)0.4721.22 (0.87–1.71)0.2451.30 (0.73–2.32)0.380
rs125436630.6311.25 (0.80–1.93)0.326--1.32 (0.85–2.06)0.215--
rs100869080.0460.38 (0.16–0.92)0.0321.06 (0.73–1.55)0.7540.38 (0.16–0.93)0.0331.07 (0.73–1.56)0.740
rs10163430.0811.08 (0.77–1.52)0.6581.62 (1.05–2.49)0.0281.08 (0.77–1.53)0.6471.65 (1.07–2.54)0.025
rs132522980.5590.92 (0.66–1.29)0.6191.26 (0.69–2.28)0.4550.90 (0.64–1.27)0.551.36 (0.75–2.48)0.313
rs69835610.1381.21 (0.87–1.69)0.2591.82 (0.98–3.40)0.0591.22 (0.87–1.71)0.2411.88 (1.00–3.52)0.048
rs169019660.0521.28 (0.92–1.78)0.1422.18 (1.10–4.32)0.0251.28 (0.91–1.78)0.1532.26 (1.14–4.5)0.020
rs169020940.6751.16 (0.83–1.61)0.3861.15 (0.61–2.15)0.6691.18 (0.85–1.65)0.3271.18 (0.62–2.22)0.619
rs4451140.7980.94 (0.63–1.41)0.7571.09 (0.76–1.56)0.6470.96 (0.64–1.44)0.8291.11 (0.77–1.6)0.583
rs6208610.9760.96 (0.64–1.45)0.8491.01 (0.71–1.44)0.9660.97 (0.64–1.48)0.8941.02 (0.72–1.47)0.895
rs69832670.2971.33 (0.93–1.91)0.1201.12 (0.74–1.71)0.5911.27 (0.88–1.83)0.1961.11 (0.73–1.71)0.622
rs14472950.0261.58 (1.12–2.23)0.010--1.59 (1.12–2.25)0.010--
rs119862200.0051.80 (1.26–2.56)0.001--1.76 (1.23–2.52)0.002--
rs100901540.0091.74 (1.22–2.49)0.002--1.71 (1.19–2.45)0.004--
rs78376880.1761.39 (0.98–1.97)0.0631.27 (0.34–4.77)0.7251.36 (0.96–1.94)0.0841.27 (0.34–4.79)0.727
rs109939940.5871.23 (0.82–1.85)0.3151.13 (0.75–1.68)0.5661.21 (0.8–1.83)0.3631.11 (0.74–1.66)0.624
rs71279000.034--0.56 (0.36–0.87)0.011--0.54 (0.34–0.84)0.007
rs79313420.0120.72 (0.52–1.01)0.0541.65 (0.88–3.10)0.1200.73 (0.52–1.01)0.0591.72 (0.91–3.24)0.094
rs96000790.6361.12 (0.79–1.59)0.5141.19 (0.81–1.77)0.3781.08 (0.76–1.53)0.6811.17 (0.78–1.75)0.443
rs44307960.0160.75 (0.33–1.69)0.4831.69 (1.11–2.58)0.0150.73 (0.32–1.67)0.4571.66 (1.08–2.54)0.020
rs18599620.3061.2 (0.83–1.74)0.3221.39 (0.89–2.17)0.1531.20 (0.83–1.74)0.3341.43 (0.91–2.25)0.118
rs27358390.0810.63 (0.40–0.98)0.0421.04 (0.73–1.46)0.8440.62 (0.4–0.98)0.0421.01 (0.71–1.43)0.954
Note: p < 0.05 are in bold. -The genetic models were not analyzed due to one of the genotype frequencies was less than 0.05.

3.3. GMDR Analyses Identified the Best Gene-Gene Interaction Model

Gene-gene interactions among rs16901966, rs11986220, rs1447295, rs10090154, rs1983891, and rs339331 showed that the sign test in four models had statistical significance (p < 0.05). However, only rs16901966, rs11986220, rs1983891, and rs339331 contributed to the best model with the smallest prediction error (1 − testing balanced accuracy [0.5785] = 0.4215) and the greatest CV consistency (10/10; sign test p = 0.001) (Table 4). Figure 1 shows the score distributions in the best model. The scores between case and control groups in different cells were different, indicating that patterns of high and low risk differ across each of the different multi-locus dimensions. This is evidence of gene-gene interactions. Entropy-based interaction dendrograms, built by MDR, showed the strongest synergy between rs1983891 at FOXP4 and rs16901966 at 8q24, followed by those two loci and rs339331 at RFX6 (Figure 2). The redundancy among rs11986220, rs10090154, and rs1447295 was consistent with their linkage degree [13].
Table 4. Age-adjusted GMDR models of gene-gene interactions among the six PCa associated SNPs.
ModelTraining Bal.Acc.Testing Bal.Acc.Sign Test (p)CV Consistency
rs119862200.56460.55569 (0.0107)9/10
rs1983891 rs3393310.59160.53298 (0.0547)5/10
rs16901966 rs1983891 rs3393310.61920.56268 (0.0547)5/10
rs16901966 rs11986220 rs1983891 rs3393310.65810.578510 (0.0010)10/10
rs16901966 rs1447295 rs11986220 rs1983891 rs3393310.68440.56909 (0.0107)10/10
rs16901966 rs1447295 rs11986220 rs10090154 rs1983891 rs3393310.68440.56639 (0.0107)10/10
Note: Training Bal. ACC: Training Balanced Accuracy; Testing Bal. ACC: Testing Balanced Accuracy; CV: Cross Validation; The best model speculated by GMDR is composed of rs16901966, rs11986220, rs1983891 and rs339331.
Figure 1. The best age-adjusted GMDR model for gene-gene interaction. The best model is composed of rs16901966, rs11986220, rs1983891, and rs339331. In each cell, the left bar represents a positive score, and the right bar a negative score. High-risk cells are indicated by dark shading, low-risk cells by light shading, and empty cells by no shading. The patterns of high-risk and low-risk cells differ across each of the different multilocus dimensions, presenting evidence of epistasis.
Ijerph 13 00162 g001
Figure 2. Gene-gene interaction dendrogram. The strongly interacting SNPs appear close together at the leaves of the tree (rs16901966 and 1983891), and the weakly interacting SNPs appear distant from each other.
Ijerph 13 00162 g002

3.4. Cumulative Effect of the SNPs that Increase the Risk of PCa

The cumulative effect of rs16901966, rs1447295, rs10090154, rs1983891, and rs339331 indicated that, compared to men without any of these risk variants, men who carried any combination of 1, 2, or ≥3 risk genotypes have a gradually increased risk of PCa. The OR (age-adjusted) was 4.14 (p = 2.22 × 10⁻⁶) (Table 5).
Table 5. Cumulative effects of risk variants on prostate cancer risk.
No. of Risk Genotypes *CaseControlUnadjusted ORAge-Adjusted OR
OR (95% CI)pOR (95% CI)p
026 (0.094)55 (0.199)1.00 (Reference) 1.00 (Reference)
180 (0.290)94 (0.339)1.80 (1.04–3.13)0.0361.79 (1.02–3.12)0.042
278 (0.284)82 (0.296)2.01 (1.15–3.52)0.0141.96 (1.11–3.46)0.020
≥391 (0.331)46 (0.166)4.19 (2.33–7.52)9.050 × 10−74.14 (2.30–7.46)2.220 × 10⁻⁶
Note: * Risk genotypes were defined from the genetic model analysis of rs1983891 (TT, TC), rs339331 (TT), rs16901966 (GG), rs1447295 (AA, AC) and rs10090154 (TC, TT). p < 0.05 are in bold.

3.5. Logistic Regression Analyses for Independent Environmental Effects on SNPs

Results from case-only gene-environment interactions suggested that the ORs of PCa risk were increased when combined with some environments, compared with the independent SNPs association analysis (Table 6). Two genotype-BMI interactions were statistically significant: (1) rs6983561 CC with BMI ≥ 28 compared with rs6983561 CC with BMI < 24.0 (age-adjusted OR = 7.66; 95% CI: 1.20–49.04; p = 0.032); and (2) rs16901966 GG with BMI ≥ 28 compared with rs16901966 GG with BMI < 24.0 (age-adjusted OR = 5.33; 95% CI: 1.03–26.63; p = 0.046). In current smokers, carriers of rs7679673-C (CC + CA) and risk homozygous rs12653946 TT had increased ORs compared with rs7679673 AA and non-carriers with rs12653946 TC + CC (age-adjusted ORs = 2.77 and 3.12; 95% CI: 1.32–5.80 and 1.16–8.31; p = 0.007 and 0.024, respectively). The risk of PCa in often drinking cases with risk homozygous rs7679673 CC was 4.37-fold higher than often drinking cases with non-risk allelic carriers (rs7679673 CA + AA).
Table 6. The case-only study result of gene-environment interaction.
Environments × GeneUnadjustedAge-Adjusted
OR95% CIpOR95% CIp
BMIrs6983561 CCCA + AA
<24.02 (0.036)53 (0.964)1 (Reference)1 (Reference)
24.0–<28.06 (0.107)50 (0.893)3.180.61–16.500.1493.400.64–18.100.151
≥284 (0.250)12 (0.750)8.831.45–53.940.0077.661.20–49.040.032
rs16901966 GGGA + AA
<24.03 (0.053)54 (0.947)1 (Reference)1 (Reference)
24.0–28.04 (0.068)55 (0.932)1.310.28–6.330.7321.360.29–6.430.697
≥284 (0.250)12 (0.750)6.001.19–30.390.0185.331.03–26.630.046
Smokingrs7679673 CC + CAAA
Never21 (0.309)47 (0.691)1 (Reference)1 (Reference)
Current32 (0.561)25 (43.90)2.871.38–5.970.0042.771.32–5.800.007
rs12653946 TTTC + CC
Never7 (0.100)63 (0.900)1 (Reference)1 (Reference)
Current15 (0.259)43 (0.741)3.141.18–8.340.0183.111.16–8.310.024
Drinkingrs7679673 CCCA + AA
Seldom5 (0.046)103 (0.954)1 (Reference)1 (Reference)
Often3 (0.188)13 (0.812)4.751.07–22.250.0324.371.27–20.090.041
Note: The risk allele of rs6983561, rs16901966, rs7679673, and rs12653946 are C, G, C, and T, respectively. Gene-environment interaction was analyzed by using the risk genotypes of SNPs.

4. Discussion

GWAS have identified over 70 loci associated with PCa. However, it is largely unknown which genes and environmental risk factors jointly affect the risk of this disease. The present study investigated the relationships between 36 GWAS identified PCa risk variants and the risk of PCa in a northern Chinese population. Based on allelic and genotypic association analyses, we explored the gene-gene interactions among six confirmed PCa risk variants and their cumulative effect on the risk of PCa in a case-control study. We also examined the gene-environment interaction between 36 SNPs and the environmental factors BMI, smoking, and alcohol consumption. The best gene-gene interaction model involved rs16901966 and rs11986220 at 8q24, rs1983891 at FOXP4, and rs339331 at RFX6. The cumulative effect of these six loci increased the risk of PCa about 3.2-fold. We observed that cases with BMI ≥ 28 had five to seven times higher risk of PCa with homozygous rs16901966 GG and rs6983561 CC than cases with BMI < 24.0. Cases that carried the risk allele C of rs7679673 (CC, CA) and homozygous rs7679673 CC, and were current smokers and often drinkers, had a 1.77 and 3.37-fold higher risk of PCa, respectively, compared to cases with identical genotypes but who never smoked and seldom drank. Current smokers with the rs12653946 TT genotype had 3.11 times the risk of PCa than never smokers.
After age adjustment, the confirmed PCa risk loci were rs16901966, rs11986220, rs1447295, and rs10090154 at 8q24, rs1983891 at FOXP4, and rs339331 at RFX6. In our previous study, rs16901966, rs1447295, rs11986220, and rs10090154 at 8q24 (Region 1, Region 2) were associated with PCa and PCa-related clinical covariates [13]. rs1983891 at FOXP4 and rs339331 at RFX6 were first identified as PCa risk loci in Japanese patients, and were further confirmed in subsequent studies [18,31,32]. Our result that only 6 of 36 SNPs were associated with PCa suggests that this discrepancy could result from gene-gene and gene-environment interactions that would alter the effect of some disease-associated genes or loci.
Gene-gene interaction analyses showed that there were significant joint interactions among rs16901966, and rs11986220 at 8q24, rs1983891 at FOXP4, and rs339331 at RFX6. rs16901966 (region 2), rs11986220 (region 1) at 8q24 on chromosome 8 were verified to have consistent associations in various populations [18,27,33,34,35]. rs1983891 is located in FOXP4, which belongs to subfamily P of the forkhead box (FOX) transcription factor family, and is associated with kidney tumors, larynx carcinoma, and breast tumors [36,37,38]. At present, the potential role for FOXP4 in prostate tumorigenesis has not been determined. rs339331 was located at RFX6, a member of the regulatory factor X (RFX) family of transcription factors. A recent study reported that rs339331 can affect the risk of PCa by altering the expression of RFX6 [39]. A family-based study reported an interaction between rs4242382 at 8q24 and rs10486567 at JAZF zinc finger1 gene (JAZF1), which encodes a transcriptional repressor, for non-aggressive PCa [40]. These two transcription factors, FOXP4 and RFX6, may also interact with 8q24 by some regulated loci.
GMDR can effectively eliminate noise from the covariate, can increase prediction accuracy, and is applicable to both dichotomous and continuous phenotypes in various population-based study designs [29]. The results of the GMDR analysis in our study established a biostatistical foundation for the study of functional epistasis between FOXP4, RFX6, and 8q24. To understand the cumulative effects of the confirmed six variants on the risk of PCa, we used a combined score of the total number of risk genotypes from the five SNPs that were independently associated with PCa (rs11986220 was excluded because of the linkage with rs10090154). Our data indicated that men who carried at least three risk genotypes had a three-fold increased risk of PCa compared with men who carried no risk genotypes. Because 33.1% of cases and 16.6% of control subjects carried three or more risk genotypes, the cumulative effects of these SNPs on PCa incidence in China are substantial. Furthermore, it has been verified that some variants at 8q24 are PCa-susceptible loci in different populations. Thus, confirming this cumulative effect in other populations is necessary.
PCa is a multifactorial process involving both genetic and environmental components. Studies on gene-environment interrelations can, therefore, provide a potentially powerful approach for identifying the causes of this disease [41]. Although the current work is a case-only study, analyses based only on cases are valid, and offer better precision for estimating gene-environment interactions than those based on full data [42]. Obesity, smoking, and alcohol consumption are associated with a moderate increase in the risk of PCa or aggressive PCa [43,44,45]. Gene-environment interactions could either decrease or increase the risk of the disease. However, which genes and factors jointly affect the risk of PCa is largely unknown. In our case-only study, we analyzed the interactions between 36 SNPs and BMI, smoking, and alcohol consumption. Our results showed that rs6983561 and rs16901966, that exhibit a high degree of linkage disequilibrium at 8q24, interacted with BMI ≥ 28 (obesity) and contributed to a higher risk of PCa (ORs = 7.66, 5.33, respectively). The homozygous and risk allele carriers of rs7679673 at TET2, that encode a protein involved in myelopoiesis, interact with smoking and drinking to increase the risk of PCa (ORs = 2.77, 4.37, respectively). Homozygous rs12653946 at 5p15 in current smokers can also increase the risk of PCa (OR = 3.11).
Although some significant risk factors were identified in our study, there are several limitations to the results. The largest limitation is the small sample size that lowers the statistical power of the study. Although the sample quality is higher, replicating these results in larger populations is desirable. Second, the small sample size and the number of SNP variants studied limited us to exploring the gene-gene interactions among only six confirmed PCa risk SNPs, thus ignoring some potential interactions among other SNPs. Third, the case-only study involved only 134 Beijing PCa cases, limiting the gene-environment-phenotype analysis (e.g., PSA level, Gleason score, tumor stage, and aggressive PCa). Furthermore, some valuable factors those associated with development PCa such as presence of diabetes or use of diabetic medication should be designed in the future study. The lack of family history or treatment methods (surgical operation or medications used) for adjustment is another major limitation of the analysis. Therefore, populations with detailed PCa-related environmental exposures should be examined in multiple centers of China to confirm the association between these SNPs-environment interactions and PCa. This would establish a PCa databank about gene-gene-phenotype and gene-environment-phenotype, and provide a more effective approach to evaluate the risk of PCa, and to provide recommendations for preventing this disease.

5. Conclusions

The results of the current case-control study demonstrated the effect of gene-gene interactions, and the cumulative effect among six PCa risk SNPs identified from 36 SNPs reported previously by GWAS, on the risk of PCa. These findings suggest an interaction exists among these six SNPs and that the cumulative effect can increase the risk of PCa. Additionally, a potential gene-environment interaction was found. The results indicated that several interactions between SNPs and BMI, smoking, or drinking contribute to the increased risk of PCa. Overall, these findings will be helpful for further epidemiological and functional investigations of the pathogenesis of PCa, as well as provide recommendations for preventing this disease.

Supplementary Materials

The following are available online at www.mdpi.com/www.mdpi.com/1660-4601/13/2/162/s1, Table S1: PCR primers of 36 SNPs and annealing temperature for HRM, Table S2: PCR primers of 37 SNPs for sequencing, Table S3: Distribution of the risk alleles and genotypes (n/fre) of 36 SNPs in PCa cases and control subjects, and the test result for HWE.

Acknowledgments

We thank all the patients and research workers for their participation. This study was funded by the natural science foundation of China (81061120527, 81241082, 81370445, 81472408, 81302220), National Department Public Benefit Research Foundation by Ministry of Health China (201302008) and 12th five year national program from the Ministry of Scientific Technology (2012BAI10B01), the Natural Science Foundation of Shanxi Province (2014021037-1) and the Doctoral Startup Research Fund of Shanxi Medical University (B03201204).

Author Contributions

The authors’ contributions are the following: Jianye Wang, Yong Xu, and Ze Yang contributed to protocol/project development; Liang Sun, Xiaoquan Zhu, and Ming Liu contributed to data analysis; Ming Liu and Fan Yang contributed to data collection or management; Ming Liu, Xiaohong Shi, and Ze Yang contributed to manuscript writing/editing, interpretation of findings, and critical revising of the manuscript; Dong Wei, Yaoguang Zhang, Kuo Yang, Xin Wang, Siying Liang, Xin Chen, Fan Yang, Chengxiao Zhao, Ling Zhu, Lei Tang, and Chenguang Zheng contributed to sample collection. All authors read, revised, and approved the final manuscript.

Conflicts of Interest

The authors declare no conflict of interest.

References

  1. Lichtenstein, P.; Holm, N.V.; Verkasalo, P.K.; Iliadou, A.; Kaprio, J.; Koskenvuo, M.; Pukkala, E.; Skytthe, A.; Hemminki, K. Environmental and heritable factors in the causation of cancer—Analyses of cohorts of twins from Sweden, Denmark, and Finland. N. Engl. J. Med. 2000, 343, 78–85. [Google Scholar] [CrossRef] [PubMed]
  2. Eeles, R.; Goh, C.; Castro, E.; Bancroft, E.; Guy, M.; al Olama, A.A.; Easton, D.; Kote-Jarai, Z. The genetic epidemiology of prostate cancer and its clinical implications. Nat. Rev. Urol. 2014, 11, 18–31. [Google Scholar] [CrossRef] [PubMed]
  3. Dean, M.; Lou, H. Genetics and genomics of prostate cancer. Asian J. Androl. 2013, 15, 309–313. [Google Scholar] [CrossRef] [PubMed]
  4. Tao, S.; Feng, J.; Webster, T.; Jin, G.; Hsu, F.C.; Chen, S.H.; Kim, S.T.; Wang, Z.; Zhang, Z.; Zheng, S.L.; et al. Genome-wide two-locus epistasis scans in prostate cancer using two European populations. Hum. Genet. 2012, 131, 1225–1234. [Google Scholar] [CrossRef] [PubMed]
  5. Ciampa, J.; Yeager, M.; Jacobs, K.; Thun, M.J.; Gapstur, S.; Albanes, D.; Virtamo, J.; Weinstein, S.J.; Giovannucci, E.; Willett, W.C.; et al. Application of a novel score test for genetic association incorporating gene-gene interaction suggests functionality for prostate cancer susceptibility regions. Hum. Hered. 2011, 72, 182–193. [Google Scholar] [CrossRef] [PubMed]
  6. Risio, M.; Venesio, T.; Kolomoets, E.; Armaroli, P.; Gallo, F.; Balsamo, A.; Muto, G.; D’Urso, L.; Puppo, P.; Naselli, A.; et al. Genetic polymorphisms of CYP17A1, vitamin D receptor and androgen receptor in Italian heredo-familial and sporadic prostate cancers. Cancer Epidemiol. 2011, 35, e18–e24. [Google Scholar] [CrossRef] [PubMed]
  7. Yamada, H.; Penney, K.L.; Takahashi, H.; Katoh, T.; Yamano, Y.; Yamakado, M.; Kimura, T.; Kuruma, H.; Kamata, Y.; Egawa, S.; et al. Replication of prostate cancer risk loci in a Japanese case-control association study. J. Natl. Cancer Inst. 2009, 101, 1330–1336. [Google Scholar] [CrossRef] [PubMed]
  8. Zheng, S.L.; Sun, J.; Wiklund, F.; Smith, S.; Stattin, P.; Li, G.; Adami, H.O.; Hsu, F.C.; Zhu, Y.; Bälter, K.; et al. Cumulative association of five genetic variants with prostate cancer. N. Engl. J. Med. 2008, 358, 910–919. [Google Scholar] [CrossRef] [PubMed]
  9. Loeb, S.; Peskoe, S.B.; Joshu, C.E.; Huang, W.Y.; Hayes, R.B.; Carter, H.B.; Isaacs, W.B.; Platz, E.A. Do environmental factors modify the genetic risk of prostate cancer? Cancer Epidemiol. Biomark. Prev. 2015, 24, 213–220. [Google Scholar] [CrossRef] [PubMed]
  10. Discacciati, A.; Orsini, N.; Wolk, A. Body mass index and incidence of localized and advanced prostate cancer—a dose-response meta-analysis of prospective studies. Ann. Oncol. 2012, 23, 1665–1671. [Google Scholar] [CrossRef] [PubMed]
  11. Cuzick, J.; Thorat, M.A.; Andriole, G.; Brawley, O.W.; Brown, P.H.; Culig, Z.; Eeles, R.A.; Ford, L.G.; Hamdy, F.C.; Holmberg, L.; et al. Prevention and early detection of prostate cancer. Lancet Oncol. 2014, 15, e484–e492. [Google Scholar] [CrossRef]
  12. Li, M.L.; Lin, J.; Hou, J.G.; Xu, L.; Cui, X.G.; Xu, X.X.; Yu, Y.W.; Han, X.; Wang, G.M.; Guo, J.M.; et al. Environmental and psycho-social factors related to prostate cancer risk in the Chinese population: A case-control study. Biomed. Environ. Sci. 2014, 27, 707–717. [Google Scholar] [PubMed]
  13. Liu, M.; Wang, J.; Xu, Y.; Wei, D.; Shi, X.; Yang, Z. Risk Loci on chromosome 8q24 are associated with prostate cancer in Northern Chinese men. J. Urol. 2012, 187, 315–321. [Google Scholar] [CrossRef] [PubMed]
  14. Chen, M.; Huang, Y.C.; Yang, S.; Hsu, J.M.; Chang, Y.H.; Huang, W.J.; Chen, Y.M. Common variants at 8q24 are associated with prostate cancer risk in Taiwanese men. Prostate 2010, 70, 502–507. [Google Scholar] [CrossRef] [PubMed]
  15. Fan, M.; Su, M.; Tan, Y.; Liu, Q.; Ren, Y.; Li, L.; Lv, J. Gender, age, and education level modify the association between body mass index and physical activity: A cross-sectional study in Hangzhou, China. PLoS ONE 2015, 10, e0125534. [Google Scholar] [CrossRef] [PubMed]
  16. Barry, S.A.; Tammemagi, M.C.; Penek, S.; Kassan, E.C.; Dorfman, C.S.; Riley, T.L.; Commin, J.; Taylor, K.L. Predictors of adverse smoking outcomes in the prostate.; lung.; colorectal and ovarian cancer screening trial. J. Natl. Cancer Inst. 2012, 104, 1647–1659. [Google Scholar] [CrossRef] [PubMed]
  17. Zuccolo, L.; Lewis, S.J.; Donovan, J.L.; Hamdy, F.C.; Neal, D.E.; Smith, G.D. Alcohol consumption and PSA-detected prostate cancer risk—A case-control nested in the ProtecT study. Int. J. Cancer 2013, 132, 2176–2185. [Google Scholar] [CrossRef] [PubMed]
  18. Takata, R.; Akamatsu, S.; Kubo, M.; Takahashi, A.; Hosono, N.; Kawaguchi, T.; Tsunoda, T.; Inazawa, J.; Kamatani, N.; Ogawa, O.; et al. Genome-wide association study identifies five new susceptibility loci for prostate cancer in the Japanese population. Nat. Genet. 2010, 42, 751–754. [Google Scholar] [CrossRef] [PubMed]
  19. Gudmundsson, J.; Sulem, P.; Rafnar, T.; Bergthorsson, J.T.; Manolescu, A.; Gudbjartsson, D.; Agnarsson, B.A.; Sigurdsson, A.; Benediktsdottir, K.R.; Blondal, T.; et al. Common sequence variants on 2p15 and Xp11.22 confer susceptibility to prostate cancer. Nat. Genet. 2008, 40, 281–283. [Google Scholar] [CrossRef] [PubMed]
  20. Eeles, R.A.; Kote-Jarai, Z.; Al Olama, A.A.; Giles, G.G.; Guy, M.; Severi, G.; Muir, K.; Hopper, J.L.; Henderson, B.E.; Haiman, C.A.; et al. Identification of seven new prostate cancer susceptibility loci through a genome-wide association study. Nat. Genet. 2009, 41, 1116–1121. [Google Scholar] [CrossRef] [PubMed]
  21. Eeles, R.A.; Kote-Jarai, Z.; Giles, G.G.; Olama, A.A.; Guy, M.; Jugurnauth, S.K.; Mulholland, S.; Leongamornlert, D.A.; Edwards, S.M.; Morrison, J.; et al. Multiple newly identified loci associated with prostate cancer susceptibility. Nat. Genet. 2008, 40, 316–321. [Google Scholar] [CrossRef] [PubMed]
  22. Thomas, G.; Jacobs, K.B.; Yeager, M.; Kraft, P.; Wacholder, S.; Orr, N.; Yu, K.; Chatterjee, N.; Welch, R.; Hutchinson, A.; et al. Multiple loci identified in a genome-wide association study of prostate cancer. Nat. Genet. 2008, 40, 310–315. [Google Scholar] [CrossRef] [PubMed]
  23. Gudmundsson, J.; Sulem, P.; Gudbjartsson, D.F.; Blondal, T.; Gylfason, A.; Agnarsson, B.A.; Benediktsdottir, K.R.; Magnusdottir, D.N.; Orlygsdottir, G.; Jakobsdottir, M.; et al. Genome-wide association and replication studies identify four variants associated with prostate cancer susceptibility. Nat. Genet. 2009, 41, 1022–1026. [Google Scholar] [CrossRef] [PubMed] [Green Version]
  24. Al Olama, A.A.; Kote-Jarai, Z.; Giles, G.G.; Guy, M.; Morrison, J.; Severi, G.; Leongamornlert, D.A.; Tymrakiewicz, M.; Jhavar, S.; Saunders, E.; et al. Multiple loci on 8q24 associated with prostate cancer susceptibility. Nat. Genet. 2009, 41, 1058–1060. [Google Scholar] [CrossRef] [PubMed]
  25. Gudmundsson, J.; Sulem, P.; Manolescu, A.; Amundadottir, L.T.; Gudbjartsson, D.; Helgason, A.; Rafnar, T.; Bergthorsson, J.T.; Agnarsson, B.A.; Baker, A.; et al. Genome-wide association study identifies a second prostate cancer susceptibility variant at 8q24. Nat. Genet. 2007, 39, 631–637. [Google Scholar] [CrossRef] [PubMed]
  26. Yeager, M.; Orr, N.; Hayes, R.B.; Jacobs, K.B.; Kraft, P.; Wacholder, S.; Minichiello, M.J.; Fearnhead, P.; Yu, K.; Chatterjee, N.; et al. Genome-wide association study of prostate cancer identifies a second risk locus at 8q24. Nat. Genet. 2007, 39, 645–649. [Google Scholar] [CrossRef] [PubMed]
  27. Jia, L.; Landan, G.; Pomerantz, M.; Jaschek, R.; Herman, P.; Reich, D.; Yan, C.; Khalid, O.; Kantoff, P.; Oh, W.; et al. Functional enhancers at the gene-poor 8q24 cancer-linked locus. PLoS Genet. 2009, 5, e1000597. [Google Scholar] [CrossRef] [PubMed]
  28. Lou, X.Y.; Chen, G.B.; Yan, L.; Ma, J.Z.; Zhu, J.; Elston, R.C.; Li, M.D. A generalized combinatorial approach for detecting gene-by-gene and gene-by-environment interactions with application to nicotine dependence. Am. J. Hum. Genet. 2007, 80, 1125–1137. [Google Scholar] [CrossRef] [PubMed]
  29. Chen, G.B.; Xu, Y.; Xu, H.M.; Li, M.D.; Zhu, J.; Lou, X.Y. Practical and theoretical considerations in study design for detecting gene-gene interactions using MDR and GMDR approaches. PLoS ONE 2011, 6, e16981. [Google Scholar] [CrossRef] [PubMed]
  30. Liu, Y.; Scheurer, M.E.; El-Zein, R.; Cao, Y.; Do, K.A.; Gilbert, M.; Aldape, K.D.; Wei, Q.; Etzel, C.; Bondy, M.L. Association and interactions between DNA repair gene polymorphisms and adult glioma. Cancer Epidemiol. Biomark. Prev. 2009, 18, 204–214. [Google Scholar] [CrossRef] [PubMed]
  31. Lindström, S.; Schumacher, F.R.; Campa, D.; Albanes, D.; Andriole, G.; Berndt, S.I.; Bueno-de-Mesquita, H.B.; Chanock, S.J.; Diver, W.R.; Ganziano, J.M.; et al. Replication of five prostate cancer loci identified in an Asian population—Results from the NCI Breast and Prostate Cancer Cohort Consortium (BPC3). Cancer Epidemiol. Biomark. Prev. 2012, 21, 212–216. [Google Scholar] [CrossRef] [PubMed]
  32. Long, Q.Z.; Du, Y.F.; Ding, X.Y.; Li, X.; Song, W.B.; Yang, Y.; Zhang, P.; Zhou, J.P.; Liu, X.G. Replication and fine mapping for association of the C2orf43, FOXP4, GPRC6A and RFX6 genes with prostate cancer in the Chinese population. PLoS ONE 2012, 7, e37866. [Google Scholar] [CrossRef] [PubMed]
  33. Amundadottir, L.T.; Sulem, P.; Gudmundsson, J.; Helgason, A.; Baker, A.; Agnarsson, B.A.; Sigurdsson, A.; Benediktsdottir, K.R.; Cazier, J.B.; Sainz, J.; et al. A common variant associated with prostate cancer in European and African populations. Nat. Genet. 2006, 38, 652–658. [Google Scholar] [CrossRef] [PubMed]
  34. Gudmundsson, J.; Sulem, P.; Steinthorsdottir, V.; Bergthorsson, J.T.; Thorleifsson, G.; Manolescu, A.; Rafnar, T.; Gudbjartsson, D.; Agnarsson, B.A.; Baker, A.; et al. Two variants on chromosome 17 confer prostate cancer risk, and the one in TCF2 protects against type 2 diabetes. Nat. Genet. 2007, 39, 977–983. [Google Scholar] [CrossRef] [PubMed]
  35. Zheng, S.L.; Hsing, A.W.; Sun, J.; Chu, L.W.; Yu, K.; Li, G.; Gao, Z.; Kim, S.T.; Isaacs, W.B.; Shen, M.C.; et al. Association of 17 prostate cancer susceptibility loci with prostate cancer risk in Chinese men. Prostate 2010, 70, 425–432. [Google Scholar] [CrossRef] [PubMed]
  36. Teufel, A.; Wong, E.A.; Mukhopadhyay, M.; Malik, N.; Westphal, H. FoxP4, a novel forkhead transcription factor. Biochim. Biophys. Acta 2003, 1627, 147–152. [Google Scholar] [CrossRef]
  37. Frohme, M.; Scharm, B.; Delius, H.; Knecht, R.; Hoheisel, J.D. Use of representational difference analysis and cDNA arrays for transcriptional profiling of tumor tissue. Ann. N. Y. Acad. Sci. 2000, 910, 85–104. [Google Scholar] [CrossRef] [PubMed]
  38. Sjöblom, T.; Jones, S.; Wood, L.D.; Parsons, D.W.; Lin, J.; Barber, T.D.; Mandelker, D.; Leary, R.J.; Ptak, J.; Silliman, N.; et al. The consensus coding sequences of human breast and colorectal cancers. Science 2006, 314, 268–274. [Google Scholar] [CrossRef] [PubMed]
  39. Huang, Q.; Whitington, T.; Gao, P.; Lindberg, J.F.; Yang, Y.; Sun, J.; Väisänen, M.R.; Szulkin, R.; Annala, M.; Yan, J.; et al. A prostate cancer susceptibility allele at 6q22 increases RFX6 expression by modulating HOXB13 chromatin binding. Nat. Genet. 2014, 46, 126–135. [Google Scholar] [CrossRef] [PubMed]
  40. Chen, L.S.; Fann, J.C.; Chiu, S.Y.; Yen, A.M.; Wahlfors, T.; Tammela, T.L.; Chen, H.H.; Auvinen, A.; Schleutker, J. Assessing interactions of two loci (rs4242382 and rs10486567) in familial prostate cancer: Statistical evaluation of epistasis. PLoS ONE 2014, 9, e89508. [Google Scholar] [CrossRef] [PubMed]
  41. Hayes, R.B. Gene-environment interrelations in prostate cancer. Epidemiol. Rev. 2001, 23, 163–167. [Google Scholar] [CrossRef] [PubMed]
  42. Piegorsch, W.W.; Weinberg, C.R.; Taylor, J.A. Non-hierarchical logistic models and case-only designs for assessing susceptibility in population-based case-control studies. Stat. Med. 1994, 13, 153–162. [Google Scholar] [CrossRef] [PubMed]
  43. Allott, E.H.; Masko, E.M.; Freedland, S.J. Obesity and prostate cancer: Weighing the evidence. Eur. Urol. 2013, 63, 800–809. [Google Scholar] [CrossRef] [PubMed]
  44. Murphy, A.B.; Akereyeni, F.; Nyame, Y.A.; Guy, M.C.; Martin, I.K.; Hollowell, C.M.; Walker, K.; Kittles, R.A.; Ahaghotu, C. Smoking and prostate cancer in a multi-ethnic cohort. Prostate 2013, 73, 1518–1528. [Google Scholar] [CrossRef] [PubMed]
  45. Fowke, J.H.; Howard, L.; Andriole, G.L.; Freedland, S.J. Alcohol intake increases high-grade prostate cancer risk among men taking dutasteride in the REDUCE trial. Eur. Urol. 2014, 66, 1133–1138. [Google Scholar] [CrossRef] [PubMed]

