
Association of Osteoporosis Self-Assessment Tool for Asians (OSTA) Score with Clinical Presentation and Expenditure in Hospitalized Trauma Patients with Femoral Fractures


 ,
,
Abstract
:1. Background
2. Methods
2.1. Study Design
2.2. Ethical Statement
3. Results
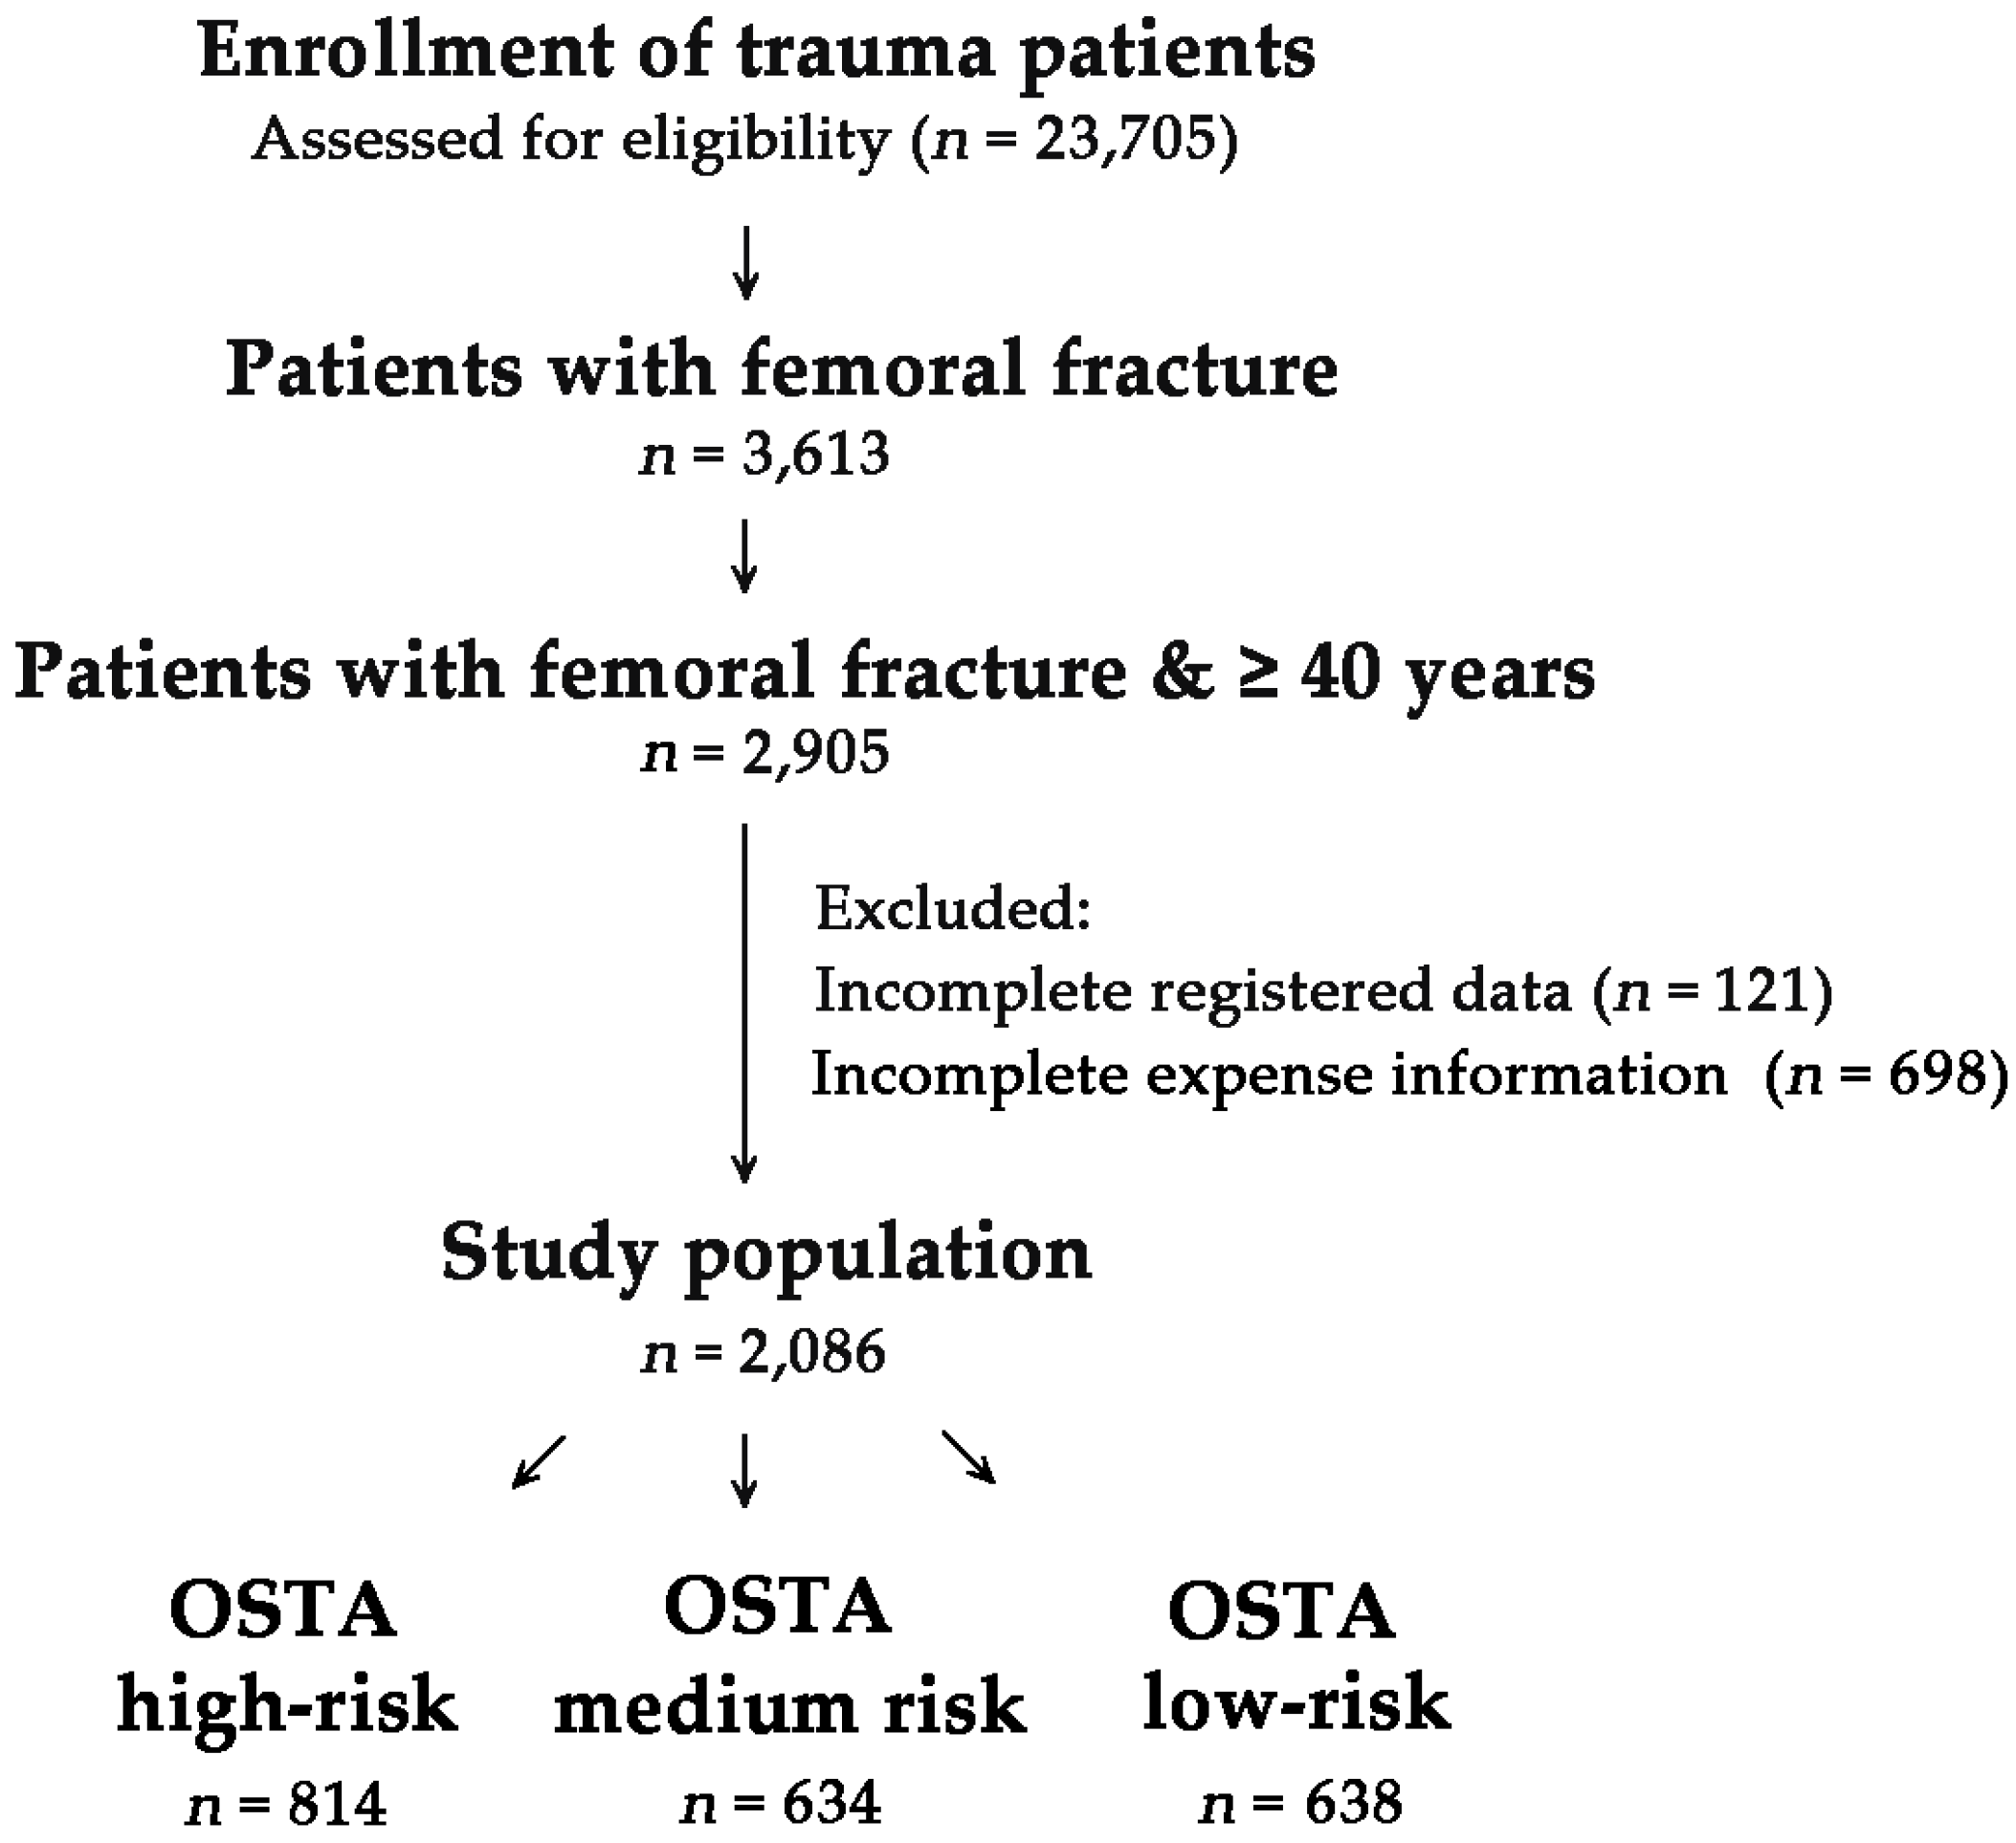
3.1. Injury Characteristics and Severity of the Patients with Femoral Fracture
3.2. Outcome of the Patients with Femoral Fracture
3.3. Outcome of Propensity-Score Matched Patients with Femoral Fracture
4. Discussion
5. Conclusions
Acknowledgments
Author Contributions
Conflicts of Interest
References
- Cummings, S.R.; Melton, L.J. Epidemiology and outcomes of osteoporotic fractures. Lancet 2002, 359, 1761–1767. [Google Scholar] [CrossRef]
- Burge, R.; Dawson-Hughes, B.; Solomon, D.H.; Wong, J.B.; King, A.; Tosteson, A. Incidence and economic burden of osteoporosis-related fractures in the United States, 2005–2025. J. Bone Miner. Res. 2007, 22, 465–475. [Google Scholar] [CrossRef] [PubMed]
- Bonnaire, F.; Zenker, H.; Lill, C.; Weber, A.T.; Linke, B. Treatment strategies for proximal femur fractures in osteoporotic patients. Osteoporos. Int. 2005, 16 (Suppl. 2), S93–S102. [Google Scholar] [CrossRef] [PubMed]
- Court-Brown, C.M.; Caesar, B. Epidemiology of adult fractures: A review. Injury 2006, 37, 691–697. [Google Scholar] [CrossRef] [PubMed]
- Kanis, J.A.; Oden, A.; Johnell, O.; Jonsson, B.; de Laet, C.; Dawson, A. The burden of osteoporotic fractures: A method for setting intervention thresholds. Osteoporos. Int. 2001, 12, 417–427. [Google Scholar] [CrossRef] [PubMed]
- Seeman, E.; Bianchi, G.; Adami, S.; Kanis, J.; Khosla, S.; Orwoll, E. Osteoporosis in men—Consensus is premature. Calcif. Tissue Int. 2004, 75, 120–122. [Google Scholar] [CrossRef] [PubMed]
- Marshall, D.; Johnell, O.; Wedel, H. Meta-analysis of how well measures of bone mineral density predict occurrence of osteoporotic fractures. BMJ 1996, 312, 1254–1259. [Google Scholar] [CrossRef] [PubMed]
- Vanhaecht, K.; Sermeus, W.; Peers, J.; Lodewijckx, C.; Deneckere, S.; Leigheb, F.; Boonen, S.; Sermon, A.; Boto, P.; Mendes, R.V.; et al. The impact of care pathways for patients with proximal femur fracture: Rationale and design of a cluster-randomized controlled trial. BMC Health Serv. Res. 2012, 12, 124. [Google Scholar] [CrossRef] [PubMed]
- Griffin, X.L.; Parsons, N.; Zbaeda, M.M.; McArthur, J. Interventions for treating fractures of the distal femur in adults. Cochrane Database Syst. Rev. 2015, 8. [Google Scholar] [CrossRef]
- Osnes, E.K.; Lofthus, C.M.; Meyer, H.E.; Falch, J.A.; Nordsletten, L.; Cappelen, I.; Kristiansen, I.S. Consequences of hip fracture on activities of daily life and residential needs. Osteoporos. Int. 2004, 15, 567–574. [Google Scholar] [CrossRef] [PubMed]
- Johnell, O. The socioeconomic burden of fractures: Today and in the 21st century. Am. J. Med. 1997, 103, S25–S26. [Google Scholar] [CrossRef]
- Caffarelli, C.; Alessi, C.; Nuti, R.; Gonnelli, S. Divergent effects of obesity on fragility fractures. Clin. Interv. Aging 2014, 9, 1629–1636. [Google Scholar] [PubMed]
- Lupsa, B.C.; Insogna, K. Bone health and osteoporosis. Endocrinol. Metab. Clin. North Am. 2015, 44, 517–530. [Google Scholar] [CrossRef] [PubMed]
- Sanchez-Riera, L.; Carnahan, E.; Vos, T.; Veerman, L.; Norman, R.; Lim, S.S.; Hoy, D.; Smith, E.; Wilson, N.; Nolla, J.M.; et al. The global burden attributable to low bone mineral density. Ann. Rheum. Dis. 2014, 73, 1635–1645. [Google Scholar] [CrossRef] [PubMed]
- Yoo, J.H.; Moon, S.H.; Ha, Y.C.; Lee, D.Y.; Gong, H.S.; Park, S.Y.; Yang, K.H. Osteoporotic fracture: 2015 position statement of the Korean society for bone and mineral research. J. Bone Metab. 2015, 22, 175–181. [Google Scholar] [CrossRef] [PubMed]
- Koh, L.K.; Sedrine, W.B.; Torralba, T.P.; Kung, A.; Fujiwara, S.; Chan, S.P.; Huang, Q.R.; Rajatanavin, R.; Tsai, K.S.; Park, H.M.; et al. A simple tool to identify Asian women at increased risk of osteoporosis. Osteoporos. Int. 2001, 12, 699–705. [Google Scholar] [CrossRef] [PubMed]
- Lin, J.; Yang, Y.; Fei, Q.; Zhang, X.; Ma, Z.; Wang, Q.; Li, J.; Li, D.; Meng, Q.; Wang, B. Validation of three tools for identifying painful new osteoporotic vertebral fractures in older Chinese men: Bone mineral density, Osteoporosis Self-Assessment Tool for Asians, and fracture risk assessment tool. Clin. Interv. Aging 2016, 11, 461–469. [Google Scholar] [PubMed]
- Bhat, K.A.; Kakaji, M.; Awasthi, A.; Kumar, K.; Mishra, K.; Shukla, M.; Gupta, S.K. Utility of Osteoporosis Self-Assessment Tool as a Screening Tool for Predicting Osteoporosis in Indian Men. Available online: http://www.sciencedirect.com/science/article/pii/S1094695016300439 (accessed on 17 May 2016).
- Chan, S.P.; Teo, C.C.; Ng, S.A.; Goh, N.; Tan, C.; Deurenberg-Yap, M. Validation of various osteoporosis risk indices in elderly Chinese females in Singapore. Osteoporos. Int. 2006, 17, 1182–1188. [Google Scholar] [CrossRef] [PubMed]
- Chaovisitsaree, S.; Namwongprom, S.N.; Morakote, N.; Suntornlimsiri, N.; Piyamongkol, W. Comparison of Osteoporosis Self-Assessment Tool for Asian (OSTA) and standard assessment in menopause clinic, Chiang Mai. J. Med. Assoc. Thai 2007, 90, 420–425. [Google Scholar] [PubMed]
- Li-Yu, J.T.; Llamado, L.J.; Torralba, T.P. Validation of OSTA among Filipinos. Osteoporos. Int. 2005, 16, 1789–1793. [Google Scholar] [CrossRef] [PubMed]
- Lu, C.; Chen, D.; Cai, Y.; Wei, S. Concordane of OSTA and lumbar spine BMD by DXA in identifying risk of osteoporosis. J. Orthop. Surg. Res. 2006, 1, 14. [Google Scholar] [CrossRef] [PubMed]
- Muslim, D.; Mohd, E.; Sallehudin, A.; Tengku Muzaffar, T.; Ezane, A. Performance of Osteoporosis Self-assessment Tool for Asian (OSTA) for primary osteoporosis in post-menopausal Malay women. Malays. Orthop. J. 2012, 6, 35–39. [Google Scholar] [PubMed]
- Yang, Y.; Wang, B.; Fei, Q.; Meng, Q.; Li, D.; Tang, H.; Li, J.; Su, N. Validation of an osteoporosis self-assessment tool to identify primary osteoporosis and new osteoporotic vertebral fractures in postmenopausal Chinese women in Beijing. BMC Musculoskelet. Disord. 2013, 14, 271. [Google Scholar] [CrossRef] [PubMed]
- Machado, P.; Coutinho, M.; da Silva, J.A. Selecting men for bone densitometry: Performance of osteoporosis risk assessment tools in Portuguese men. Osteoporos. Int. 2010, 21, 977–983. [Google Scholar] [CrossRef] [PubMed]
- Campion, J.M.; Maricic, M.J. Osteoporosis in men. Am. Fam. Phys. 2003, 67, 1521–1526. [Google Scholar]
- Oh, S.M.; Song, B.M.; Nam, B.H.; Rhee, Y.; Moon, S.H.; Kim, D.Y.; Kang, D.R.; Kim, H.C. Development and validation of osteoporosis risk-assessment model for Korean Men. Yonsei Med. J. 2016, 57, 187–196. [Google Scholar] [CrossRef] [PubMed]
- Yang, N.P.; Lin, T.; Wang, C.S.; Chou, P. Correlation of osteoporosis screening by quantitative ultrasound of calcaneus and Osteoporosis Self-Assessment Tool for Asians in Taiwanese. J. Formos. Med. Assoc. 2004, 103, 130–136. [Google Scholar] [PubMed]
- Chang, S.F.; Yang, R.S. Determining the cut-off point of osteoporosis based on the osteoporosis self-assessment tool, body mass index and weight in Taiwanese young adult women. J. Clin. Nurs. 2014, 23, 2628–2635. [Google Scholar] [CrossRef] [PubMed]
- Oh, S.M.; Nam, B.H.; Rhee, Y.; Moon, S.H.; Kim, D.Y.; Kang, D.R.; Kim, H.C. Development and validation of osteoporosis risk-assessment model for Korean postmenopausal women. J. Bone Miner. Metab. 2013, 31, 423–432. [Google Scholar] [CrossRef] [PubMed]
- Su, F.M.; Liu, D.H.; Chen, J.F.; Yu, S.F.; Chiu, W.C.; Hsu, C.Y.; Ko, C.H.; Tsai, C.C.; Cheng, T.T. Development and validation of an Osteoporosis Self-Assessment Tool for Taiwan (OSTA) postmenopausal women—A sub-study of the Taiwan OsteoPorosis Survey (TOPS). PLoS ONE 2015, 10, e0130716. [Google Scholar]
- Tu, S.H.; Chen, C.; Hsieh, Y.T.; Chang, H.Y.; Yeh, C.J.; Lin, Y.C.; Pan, W.H. Design and sample characteristics of the 2005–2008 nutrition and health survey in Taiwan. Asia Pac. J. Clin. Nutr. 2011, 20, 225–237. [Google Scholar] [PubMed]
- Chie, W.C.; Yang, R.S.; Liu, J.P.; Tsai, K.S. High incidence rate of hip fracture in Taiwan: Estimated from a nationwide health insurance database. Osteoporos. Int. 2004, 15, 998–1002. [Google Scholar] [CrossRef] [PubMed]
- Rau, C.S.; Lin, T.S.; Wu, S.C.; Yang, J.C.; Hsu, S.Y.; Cho, T.Y.; Hsieh, C.H. Geriatric hospitalizations in fall-related injuries. Scand. J. Trauma Resusc. Emerg. Med. 2014, 22, 63. [Google Scholar] [CrossRef] [PubMed]
- Shao, C.J.; Hsieh, Y.H.; Tsai, C.H.; Lai, K.A. A nationwide seven-year trend of hip fractures in the elderly population of Taiwan. Bone 2009, 44, 125–129. [Google Scholar] [CrossRef] [PubMed]
- Müller, M.E.; Nazarian, S.; Koch, P.; Schatzker, J. The Comprehensive Classification of Fractures of the Long Bones; Springer: Berlin, Germany, 1990. [Google Scholar]
- Lenchik, L.; Rogers, L.F.; Delmas, P.D.; Genant, H.K. Diagnosis of osteoporotic vertebral fractures: Importance of recognition and description by radiologists. Am. J. Roentgenol. 2004, 183, 949–958. [Google Scholar] [CrossRef] [PubMed]
- Gregory, J.S.; Aspden, R.M. Femoral geometry as a risk factor for osteoporotic hip fracture in men and women. Med. Eng. Phys. 2008, 30, 1275–1286. [Google Scholar] [CrossRef] [PubMed]
- Keyak, J.H.; Skinner, H.B.; Fleming, J.A. Effect of force direction on femoral fracture load for two types of loading conditions. J. Orthop. Res. 2001, 19, 539–544. [Google Scholar] [CrossRef]
- Faulkner, K.G.; Cummings, S.R.; Black, D.; Palermo, L.; Gluer, C.C.; Genant, H.K. Simple measurement of femoral geometry predicts hip fracture: The study of osteoporotic fractures. J. Bone Miner. Res. 1993, 8, 1211–1217. [Google Scholar] [CrossRef] [PubMed]
- Gabriel, S.E.; Tosteson, A.N.; Leibson, C.L.; Crowson, C.S.; Pond, G.R.; Hammond, C.S.; Melton, L.J. Direct medical costs attributable to osteoporotic fractures. Osteoporos. Int. 2002, 13, 323–330. [Google Scholar] [CrossRef] [PubMed]
- Shi, N.; Foley, K.; Lenhart, G.; Badamgarav, E. Direct healthcare costs of hip, vertebral, and non-hip, non-vertebral fractures. Bone 2009, 45, 1084–1090. [Google Scholar] [CrossRef] [PubMed]
- McCann, R.M.; Colleary, G.; Geddis, C.; Clarke, S.A.; Jordan, G.R.; Dickson, G.R.; Marsh, D. Effect of osteoporosis on bone mineral density and fracture repair in a rat femoral fracture model. J. Orthop. Res. 2008, 26, 384–393. [Google Scholar] [CrossRef] [PubMed]
- Lill, C.A.; Hesseln, J.; Schlegel, U.; Eckhardt, C.; Goldhahn, J.; Schneider, E. Biomechanical evaluation of healing in a non-critical defect in a large animal model of osteoporosis. J. Orthop. Res. 2003, 21, 836–842. [Google Scholar] [CrossRef]
- Lindner, T.; Kanakaris, N.K.; Marx, B.; Cockbain, A.; Kontakis, G.; Giannoudis, P.V. Fractures of the hip and osteoporosis: The role of bone substitutes. J. Bone Joint Surg. Br. 2009, 91, 294–303. [Google Scholar] [CrossRef] [PubMed]
- Gardner, M.J.; Lorich, D.G.; Lane, J.M. Osteoporotic femoral neck fractures: Management and current controversies. Instr. Course Lect. 2004, 53, 427–439. [Google Scholar] [PubMed]
- Nikolaou, V.S.; Efstathopoulos, N.; Kontakis, G.; Kanakaris, N.K.; Giannoudis, P.V. The influence of osteoporosis in femoral fracture healing time. Injury 2009, 40, 663–668. [Google Scholar] [CrossRef] [PubMed]


| Variables | High-Risk OSTA < −4 n = 814 (I) | Medium-Risk −1 ≥ OSTA ≥ −4 n = 634 (II) | Low-Risk OSTA > −1 n = 638 (III) | OR (95% CI) I vs. III | p | OR (95% CI) II vs. III | p |
|---|---|---|---|---|---|---|---|
| Age | 82.3 ± 6.2 | 74.0 ± 7.6 | 59.4 ± 10.8 | - | <0.001 | - | <0.001 |
| Gender | <0.001 | <0.001 | |||||
| Male | 207 (25.4) | 215 (33.9) | 370 (58.0) | 0.2 (0.20–0.31) | 0.4 (0.30–0.47) | ||
| Female | 607 (74.6) | 419 (66.1) | 268 (42.0) | 4.0 (3.24–5.06) | 2.7 (2.14–3.38) | ||
| Co-morbidity | |||||||
| DM | 192 (23.6) | 243 (38.3) | 179 (28.1) | 0.8 (0.63–1.00) | 0.053 | 1.6 (1.26–2.02) | <0.001 |
| HTN | 489 (60.1) | 384 (60.6) | 265 (41.5) | 2.1 (1.72–2.62) | <0.001 | 2.2 (1.73–2.71) | <0.001 |
| CAD | 81 (10.0) | 65 (10.3) | 40 (6.3) | 1.7 (1.11–2.45) | 0.012 | 1.7 (1.13–2.57) | 0.010 |
| CHF | 24 (2.9) | 17 (2.7) | 6 (0.9) | 3.2 (1.30–7.88) | 0.008 | 2.9 (1.14–7.41) | 0.020 |
| CVA | 100 (12.3) | 88 (13.9) | 62 (9.7) | 1.3 (0.93–1.82) | 0.123 | 1.5 (1.06–2.12) | 0.021 |
| Mechanism, n (%) | |||||||
| Motor vehicle | 1 (0.1) | 3 (0.5) | 19 (3.0) | 0.0 (0.01–0.30) | <0.001 | 0.2 (0.05–0.53) | 0.001 |
| Motorcycle | 39 (4.8) | 99 (15.6) | 218 (34.2) | 0.1 (0.07–0.14) | <0.001 | 0.4 (0.27–0.47) | <0.001 |
| Bicycle | 23 (2.8) | 43 (6.8) | 33 (5.2) | 0.5 (0.31–0.92) | 0.021 | 1.3 (0.84–2.13) | 0.226 |
| Pedestrian | 11 (1.4) | 8 (1.3) | 5 (0.8) | 1.7 (0.60–5.02) | 0.304 | 1.6 (0.53–4.97) | 0.397 |
| Fall | 733 (90.0) | 474 (74.8) | 344 (53.9) | 7.7 (5.86–10.21) | <0.001 | 2.5 (2.00–3.21) | <0.001 |
| Struck by/against | 7 (0.9) | 7 (1.1) | 18 (2.8) | 0.3 (0.12–0.72) | 0.004 | 0.4 (0.16–0.93) | 0.027 |
| BAC > 50 mg/dL, n (%) | 1 (0.1) | 3 (0.5) | 34 (5.3) | 0.0 (0.00–0.16) | <0.001 | 0.1 (0.03–0.28) | <0.001 |
| GCS | 14.7 ± 1.1 | 14.8 ± 1.0 | 14.7 ± 1.6 | — | 0.339 | — | 0.057 |
| AIS ≥ 3, n (%) | |||||||
| Head/Neck | 42 (5.2) | 29 (4.6) | 72 (11.3) | 0.4 (0.29–0.64) | <0.001 | 0.4 (0.24–0.59) | <0.001 |
| Face | 9 (1.1) | 9 (1.4) | 39 (6.1) | 0.2 (0.08–0.36) | <0.001 | 0.2 (0.11–0.46) | <0.001 |
| Thorax | 19 (2.3) | 16 (2.5) | 50 (7.8) | 0.3 (0.16–0.48) | <0.001 | 0.3 (0.17–0.54) | <0.001 |
| Abdomen | 14 (1.7) | 7 (1.1) | 23 (3.6) | 0.5 (0.24–0.92) | 0.024 | 0.3 (0.13–0.70) | 0.003 |
| Extremity | 810 (99.5) | 633 (99.8) | 637 (99.8) | 0.3 (0.04–2.85) | 0.392 | 1.0 (0.06–15.92) | 1.000 |
| ISS, median (IQR) | 9 (9–9) | 9 (9–9) | 9 (9–9) | - | <0.001 | - | <0.001 |
| <16 | 797 (97.9) | 622 (98.1) | 583 (91.4) | 4.4 (2.54–7.70) | <0.001 | 4.9 (2.59–9.22) | <0.001 |
| 16–24 | 9 (1.1) | 4 (0.6) | 28 (4.4) | 0.2 (0.11–0.52) | <0.001 | 0.1 (0.05–0.40) | <0.001 |
| ≥25 | 8 (1.0) | 8 (1.3) | 27 (4.2) | 0.2 (0.10–0.50) | <0.001 | 0.3 (0.13–0.64) | 0.001 |
| Mortality, n (%) | 9 (1.1) | 5 (0.8) | 9 (1.4) | 0.8 (0.31–1.98) | 0.602 | 0.6 (0.19–1.67) | 0.288 |
| LOS in hospital (days) | 9.9 ± 7.0 | 9.9 ± 7.4 | 11.1 ± 9.6 | - | 0.010 | - | 0.016 |
| ICU admission, n (%) | 72 (8.8) | 42 (6.6) | 64 (10.0) | 0.9 (0.61–1.24) | 0.441 | 0.6 (0.42–0.96) | 0.028 |
| LOS in ICU (days) | 7.2 ± 10.4 | 5.4 ± 5.1 | 8.6 ± 8.4 | — | 0.398 | — | 0.016 |
| Medical expenses | 3495 ± 2813 | 3654 ± 3195 | 4451 ± 5014 | — | <0.001 | — | 0.001 |
| Charge of operation | 539 ± 209 | 585 ± 343 | 758 ± 655 | — | <0.001 | — | <0.001 |
| Charge of examination | 228 ± 347 | 195 ± 297 | 217 ± 371 | — | 0.552 | — | 0.239 |
| Charge of pharmaceutical | 173 ± 380 | 155 ± 290 | 232 ± 721 | — | 0.063 | — | 0.013 |
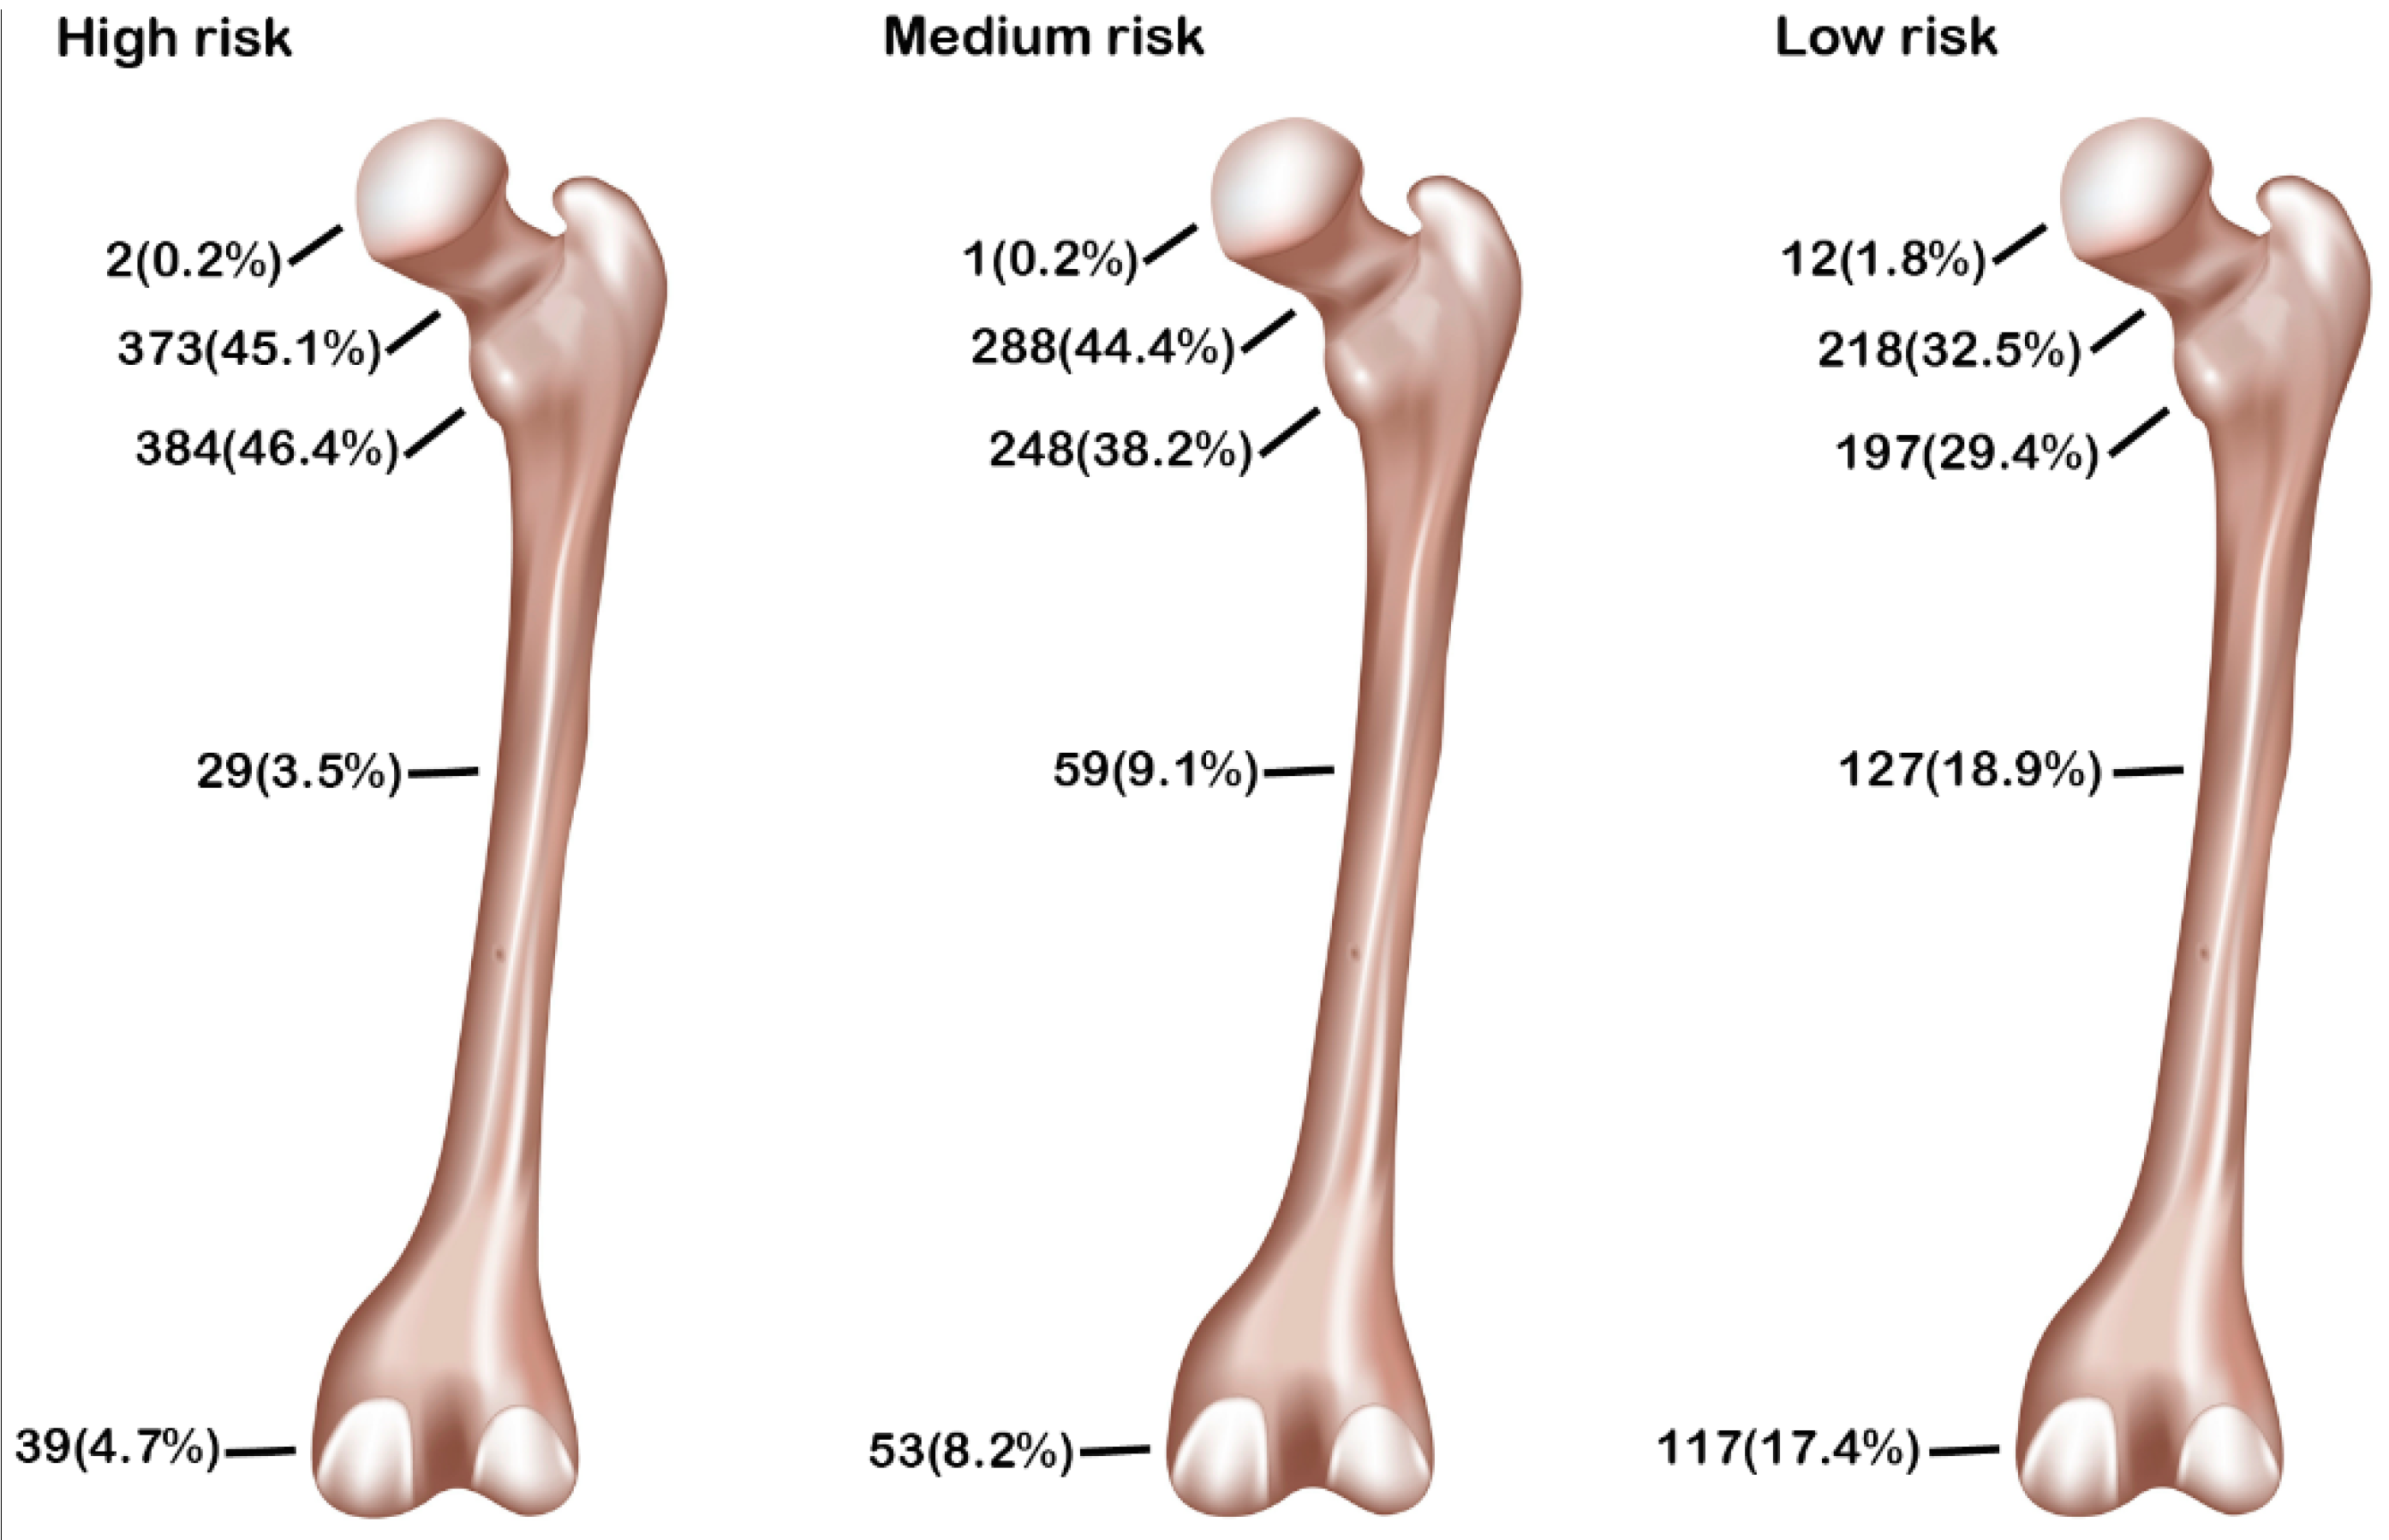
| Femur Fracture Sites | High-Risk OSTA < −4 n = 827 (I) | Medium-Risk −1 ≥ OSTA ≥ −4 n = 649 (II) | Low-Risk OSTA > −1 n = 671 (III) | OR (95% CI) I vs. III | p | OR (95% CI) II vs. III | p |
|---|---|---|---|---|---|---|---|
| Proximal-Type A (trochanter) | 384 (46.4) | 248 (38.2) | 197 (29.4) | 2.1 (1.68–2.59) | <0.001 | 1.5 (1.18–1.87) | 0.001 |
| Proximal-Type B (neck) | 373 (45.1) | 288 (44.4) | 218 (32.5) | 1.7 (1.38–2.11) | <0.001 | 1.7 (1.33–2.07) | <0.001 |
| Proximal-Type C (head) | 2 (0.2) | 1 (0.2) | 12 (1.8) | 0.1 (0.03–0.60) | 0.002 | 0.1 (0.01–0.65) | 0.003 |
| Shaft | 29 (3.5) | 59 (9.1) | 127 (18.9) | 0.2 (0.10–0.24) | <0.001 | 0.4 (0.31–0.60) | <0.001 |
| Distal | 39 (4.7) | 53 (8.2) | 117 (17.4) | 0.2 (0.16–0.34) | <0.001 | 0.4 (0.30–0.59) | <0.001 |
| Variables | Before Matching | After Matching | ||||||
|---|---|---|---|---|---|---|---|---|
| High-Risk OSTA < −4 n = 814 | Low-Risk OSTA > −1 n = 638 | OR (95% CI) | p | High-Risk OSTA < −4 n = 408 | Low-Risk OSTA > −1 n = 408 | OR (95% CI) | p | |
| Mechanism, n (%) | ||||||||
| Motor vehicle | 1 (0.1) | 19 (3.0) | 0.0 (0.01–0.30) | <0.001 | 1 (0.2) | 1 (0.2) | 1.0 (0.06–16.04) | 1.000 |
| Motorcycle | 39 (4.8) | 218 (34.2) | 0.1 (0.07–0.14) | <0.001 | 38 (9.3) | 38 (9.3) | 1.0 (0.62–1.60) | 1.000 |
| Bicycle | 23 (2.8) | 33 (5.2) | 0.5 (0.31–0.92) | 0.021 | 22 (5.4) | 22(5.4) | 1.0 (0.55–1.84) | 1.000 |
| Pedestrian | 11 (1.4) | 5 (0.8) | 1.7 (0.60–5.02) | 0.304 | 4 (1.0) | 4 (1.0) | 1.0 (0.25–4.03) | 1.000 |
| Fall | 733 (90.0) | 344 (53.9) | 7.7 (5.86–10.21) | <0.001 | 338 (82.8) | 338 (82.8) | 1.0 (0.70–1.44) | 1.000 |
| Struck by/against | 7 (0.9) | 18 (2.8) | 0.3 (0.12–0.72) | 0.004 | 5 (1.2) | 5 (1.2) | 1.0 (0.29–3.48) | 1.000 |
| GCS | 14.7 ± 1.1 | 14.7 ± 1.6 | — | 0.339 | 14.9 ± 0.8 | 14.9 ± 0.7 | — | 0.781 |
| AIS ≥ 3, n (%) | ||||||||
| Head/Neck | 42 (5.2) | 72 (11.3) | 0.4 (0.29–0.64) | <0.001 | 18 (4.4) | 18 (4.4) | 1.0 (0.51–1.95) | 1.000 |
| Face | 9 (1.1) | 39 (6.1) | 0.2 (0.08–0.36) | <0.001 | 7 (1.7) | 7 (1.7) | 1.0 (0.35–2.88) | 1.000 |
| Thorax | 19 (2.3) | 50 (7.8) | 0.3 (0.16–0.48) | <0.001 | 11 (2.7) | 11 (2.7) | 1.0 (0.43–2.33) | 1.000 |
| Abdomen | 14 (1.7) | 23 (3.6) | 0.5 (0.24–0.92) | 0.024 | 5 (1.2) | 5 (1.2) | 1.0 (0.29–3.48) | 1.000 |
| Extremity | 810 (99.5) | 637 (99.8) | 0.3 (0.04–2.85) | 0.392 | 408 (100.0) | 408 (100.0) | — | — |
| ISS, median (IQR) | 9 (9–9) | 9 (9–9) | — | <0.001 | 9 (9–9) | 9 (9–9) | — | 0.774 |
| LOS in hospital (days) | 9.9 ± 7.0 | 11.1 ± 9.6 | — | 0.010 | 9.7 ± 6.7 | 9.6 ± 7.7 | — | 0.832 |
| ICU admission, n (%) | 72 (8.8) | 64 (10.0) | 0.9 (0.61–1.24) | 0.441 | 31 (7.6) | 19 (4.7) | 1.7 (0.94–3.03) | 0.080 |
| Medical expenses | 3495 ± 2813 | 4451 ± 5014 | — | <0.001 | 3517 ± 2793 | 3733 ± 3539 | — | 0.332 |
| Charge of operation | 539 ± 209 | 758 ± 655 | — | <0.001 | 551 ± 200 | 657 ± 489 | — | <0.001 |
| Charge of examination | 228 ± 347 | 217 ± 371 | — | 0.552 | 220 ± 352 | 202 ± 373 | — | 0.485 |
| Charge of pharmaceutical | 173 ± 380 | 232 ± 721 | — | 0.063 | 181 ± 425 | 171 ± 475 | — | 0.754 |
| Variables | Before Matching | After Matching | ||||||
|---|---|---|---|---|---|---|---|---|
| Medium-Risk −1 ≥ OSTA ≥ −4 n = 634 | Low-Risk OSTA > −1 n = 638 | OR (95% CI) | p | Medium-Risk −1 ≥ OSTA ≥ −4 n = 477 | Low-Risk OSTA > −1 n = 477 | OR (95% CI) | p | |
| Mechanism, n (%) | ||||||||
| Motor vehicle | 3 (0.5) | 19 (3.0) | 0.2 (0.05–0.53) | 0.001 | 3 (0.6) | 3 (0.6) | 1.0 (0.20–4.98) | 1.000 |
| Motorcycle | 99 (15.6) | 218 (34.2) | 0.4 (0.27–0.47) | <0.001 | 99 (20.8) | 99 (20.8) | 1.0 (0.73–1.37) | 1.000 |
| Bicycle | 43 (6.8) | 33 (5.2) | 1.3 (0.84–2.13) | 0.226 | 33 (6.9) | 33 (6.9) | 1.0 (0.61–1.65) | 1.000 |
| Pedestrian | 8 (1.3) | 5 (0.8) | 1.6 (0.53–4.97) | 0.397 | 2 (0.4) | 2 (0.4) | 1.0 (0.14–7.13) | 1.000 |
| Fall | 474 (74.8) | 344 (53.9) | 2.5 (2.00–3.21) | <0.001 | 333 (69.8) | 333 (69.8) | 1.0 (0.76–1.32) | 1.000 |
| Struck by/against | 7 (1.1) | 18 (2.8) | 0.4 (0.16–0.93) | 0.027 | 7 (1.5) | 7 (1.5) | 1.0 (0.35–2.87) | 1.000 |
| GCS | 14.8 ± 1.0 | 14.7 ± 1.6 | — | 0.057 | 14.9 ± 0.8 | 14.9 ± 0.9 | — | 1.000 |
| AIS ≥ 3, n (%) | ||||||||
| Head/Neck | 29 (4.6) | 72 (11.3) | 0.4 (0.24–0.59) | <0.001 | 22 (4.6) | 22 (4.6) | 1.0 (0.55–1.83) | 1.000 |
| Face | 9 (1.4) | 39 (6.1) | 0.2 (0.11–0.46) | <0.001 | 8 (1.7) | 8 (1.7) | 1.0 (0.37–2.69) | 1.000 |
| Thorax | 16 (2.5) | 50 (7.8) | 0.3 (0.17–0.54) | <0.001 | 14 (2.9) | 14 (2.9) | 1.0 (0.47–2.12) | 1.000 |
| Abdomen | 7 (1.1) | 23 (3.6) | 0.3 (0.13–0.70) | 0.003 | 5 (1.0) | 5 (1.0) | 1.0 (0.29–3.48) | 1.000 |
| Extremity | 633 (99.8) | 637 (99.8) | 1.0 (0.06–15.92) | 1.000 | 477 (100.0) | 477 (100.0) | — | — |
| ISS, median (IQR) | 9 (9–9) | 9 (9–9) | — | <0.001 | 9 (9–9) | 9 (9–9) | — | 0.947 |
| LOS in hospital (days) | 9.9 ± 7.4 | 11.1 ± 9.6 | — | 0.016 | 10.1 ± 7.6 | 9.7 ± 8.2 | — | 0.406 |
| ICU admission, n (%) | 42 (6.6) | 64 (10.0) | 0.6 (0.42–0.96) | 0.028 | 33 (6.9) | 27 (5.7) | 1.2 (0.73–2.10) | 0.424 |
| Medical expenses | 3654 ± 3195 | 4451 ± 5014 | 0.001 | 3729 ± 3367 | 3869 ± 4402 | — | 0.581 | |
| Charge of operation | 585 ± 343 | 758 ± 655 | — | <0.001 | 595 ± 366 | 671 ± 510 | — | 0.008 |
| Charge of examination | 195 ± 297 | 217 ± 371 | — | 0.239 | 202 ± 313 | 194 ± 361 | — | 0.703 |
| Charge of pharmaceutical | 155 ± 290 | 232 ± 721 | — | 0.013 | 159 ± 305 | 165 ± 454 | — | 0.793 |
| Variables | Before Matching | After Matching | ||||||
|---|---|---|---|---|---|---|---|---|
| High-Risk OSTA < −4 n = 814 | Medium-Risk −1 ≥ OSTA ≥ −4 n = 634 | OR (95% CI) | p | High-Risk OSTA < −4 n = 545 | Medium-Risk −1 ≥ OSTA ≥ −4 n = 545 | OR (95% CI) | p | |
| Mechanism, n (%) | ||||||||
| Motor vehicle | 1 (0.1) | 3 (0.5) | 0.3 (0.03–2.49) | 0.325 | 1 (0.2) | 1 (0.2) | 1.0 (0.06–16.03) | 1.000 |
| Motorcycle | 39 (4.8) | 99 (15.6) | 0.3 (0.19–0.40) | <0.001 | 37 (6.8) | 37 (6.8) | 1.0 (0.62–1.60) | 1.000 |
| Bicycle | 23 (2.8) | 43 (6.8) | 0.4 (0.24–0.67) | <0.001 | 22 (4.0) | 22 (4.0) | 1.0 (0.55–1.83) | 1.000 |
| Pedestrian | 11 (1.4) | 8 (1.3) | 1.1 (0.43–2.68) | 0.882 | 7 (1.3) | 7 (1.3) | 1.0 (0.35–2.87) | 1.000 |
| Fall | 733 (90.0) | 474 (74.8) | 3.1 (2.28–4.09) | <0.001 | 474 (87.0) | 474 (87.0) | 1.0 (0.70–1.42) | 1.000 |
| Struck by/against | 7 (0.9) | 7 (1.1) | 0.8 (0.27–2.23) | 0.638 | 4 (0.7) | 4 (0.7) | 1.0 (0.25–4.02) | 1.000 |
| GCS | 14.7 ± 1.1 | 14.8 ± 1.0 | — | 0.190 | 14.8 ± 0.8 | 14.8 ± 0.8 | — | 0.819 |
| AIS ≥ 3, n (%) | ||||||||
| Head/Neck | 42 (5.2) | 29(4.6) | 1.1 (0.70–1.84) | 0.609 | 18 (3.3) | 18 (3.3) | 1.0 (0.52–1.94) | 1.000 |
| Face | 9 (1.1) | 9 (1.4) | 0.8 (0.31–1.97) | 0.593 | 4 (0.7) | 4 (0.7) | 1.0 (0.25–4.02) | 1.000 |
| Thorax | 19 (2.3) | 16 (2.5) | 0.9 (0.47–1.81) | 0.816 | 9 (1.7) | 9 (1.7) | 1.0 (0.39–2.54) | 1.000 |
| Abdomen | 14 (1.7) | 7 (1.1) | 1.6 (0.63–3.91) | 0.331 | 4 (0.7) | 4 (0.7) | 1.0 (0.25–4.02) | 1.000 |
| Extremity | 810 (99.5) | 633 (99.8) | 0.3 (0.04–2.87) | 0.393 | 544 (99.8) | 544 (99.8) | 1.0 (0.06–16.03) | 1.000 |
| ISS, median (IQR) | 9 (9–9) | 9 (9–9) | — | 0.435 | 9 (9–9) | 9 (9–9) | — | 0.722 |
| LOS in hospital (days) | 9.9 ± 7.0 | 9.9 ± 7.4 | — | 0.966 | 9.7 ± 6.6 | 9.5 ± 6.7 | — | 0.705 |
| ICU admission, n (%) | 72 (8.8) | 42 (6.6) | 1.4 (0.92–2.03) | 0.120 | 44 (8.1) | 33 (6.1) | 1.4 (0.85–2.18) | 0.193 |
| Medical expenses | 3495 ± 2813 | 3654 ± 3195 | — | 0.315 | 3472 ± 2638 | 3465 ± 2821 | — | 0.968 |
| Charge of operation | 539 ± 209 | 585 ± 343 | — | 0.003 | 554 ± 204 | 555 ± 253 | — | 0.959 |
| Charge of examination | 228 ± 347 | 195 ± 297 | — | 0.053 | 212 ± 333 | 193 ± 303 | — | 0.305 |
| Charge of pharmaceutical | 173 ± 380 | 155 ± 290 | — | 0.326 | 163 ± 333 | 146 ± 272 | — | 0.345 |
© 2016 by the authors; licensee MDPI, Basel, Switzerland. This article is an open access article distributed under the terms and conditions of the Creative Commons Attribution (CC-BY) license (http://creativecommons.org/licenses/by/4.0/).
Share and Cite
Chen, C.-C.; Rau, C.-S.; Wu, S.-C.; Kuo, P.-J.; Chen, Y.-C.; Hsieh, H.-Y.; Hsieh, C.-H. Association of Osteoporosis Self-Assessment Tool for Asians (OSTA) Score with Clinical Presentation and Expenditure in Hospitalized Trauma Patients with Femoral Fractures. Int. J. Environ. Res. Public Health 2016, 13, 995. https://doi.org/10.3390/ijerph13100995
Chen C-C, Rau C-S, Wu S-C, Kuo P-J, Chen Y-C, Hsieh H-Y, Hsieh C-H. Association of Osteoporosis Self-Assessment Tool for Asians (OSTA) Score with Clinical Presentation and Expenditure in Hospitalized Trauma Patients with Femoral Fractures. International Journal of Environmental Research and Public Health. 2016; 13(10):995. https://doi.org/10.3390/ijerph13100995
Chicago/Turabian StyleChen, Chien-Chang, Cheng-Shyuan Rau, Shao-Chun Wu, Pao-Jen Kuo, Yi-Chun Chen, Hsiao-Yun Hsieh, and Ching-Hua Hsieh. 2016. "Association of Osteoporosis Self-Assessment Tool for Asians (OSTA) Score with Clinical Presentation and Expenditure in Hospitalized Trauma Patients with Femoral Fractures" International Journal of Environmental Research and Public Health 13, no. 10: 995. https://doi.org/10.3390/ijerph13100995