
Racial and Ethnic Heterogeneity in the Association Between Total Cholesterol and Pediatric Obesity

Abstract
:1. Introduction
2. Experimental Section
2.1. Materials and Methods
2.1.1. Sampling, Sample Size, and Power Estimation
2.1.2. Variable Ascertainment
2.2. Statistical Analysis
3. Results and Discussion
3.1. Results
3.1.1. Study Sample Characteristics

| Variable | Number | Percentage (%) |
|---|---|---|
| Ethnicity | ||
| Hispanic/Latino | 6803 | 10.6 |
| Non-Hispanic/Latino | 57,060 | 89.4 |
| Race | ||
| AI/AN | 102 | 0.2 |
| Asian | 1324 | 2.2 |
| Black/AA | 31,485 | 49.5 |
| HN/PI | 43 | 0.07 |
| SOR | 5703 | 9.0 |
| White | 24,971 | 39.3 |
| Body Mass Index | ||
| Normal | 42,564 | 66.6 |
| Overweight/Obese | 21,309 | 33.4 |
| Total Cholesterol | ||
| Normal < 200 mg | 59,061 | 92.5 |
| Abnormal ≥ 200 mg | 4812 | 7.5 |
| Insurance | ||
| Commercial | 31,550 | 49.4 |
| Public | 30,333 | 47.5 |
| Uninsured | 1990 | 3.1 |
3.1.2. Study Characteristics by Race/Ethnicity (Categorical Variables)
| Variable | Race | |||||||
|---|---|---|---|---|---|---|---|---|
| AI/AN | Asian | Black/AA | HN/PI | SOR | White | χ 2 (df) | p | |
| n(%) | n(%) | n(%) | n(%) | n(%) | n(%) | |||
| Ethnicity | 3,0004 (18) | <0.0001 | ||||||
| Hispanic/Latino | 12 (11.6) | 21 (1.57) | 434 (1.36) | 20 (40.8) | 3934 (68.2) | 2357 (9.33) | ||
| Non-Hispanic/Latino | 90 (87.4) | 1303 (97.7) | 31,051 (97.3) | 23 (46.9) | 1769 (30.7) | 22,614 (89.5) | ||
| Refused | 0 (0) | 2 ( 0.15) | 26 (0.08) | 0 (0) | 6 (0.10) | 25 (0.10) | ||
| Information NA | 1 (0.97) | 8 (0.60) | 384 (1.20) | 6 (12.2) | 60 (1.04) | 280 (1.11) | ||
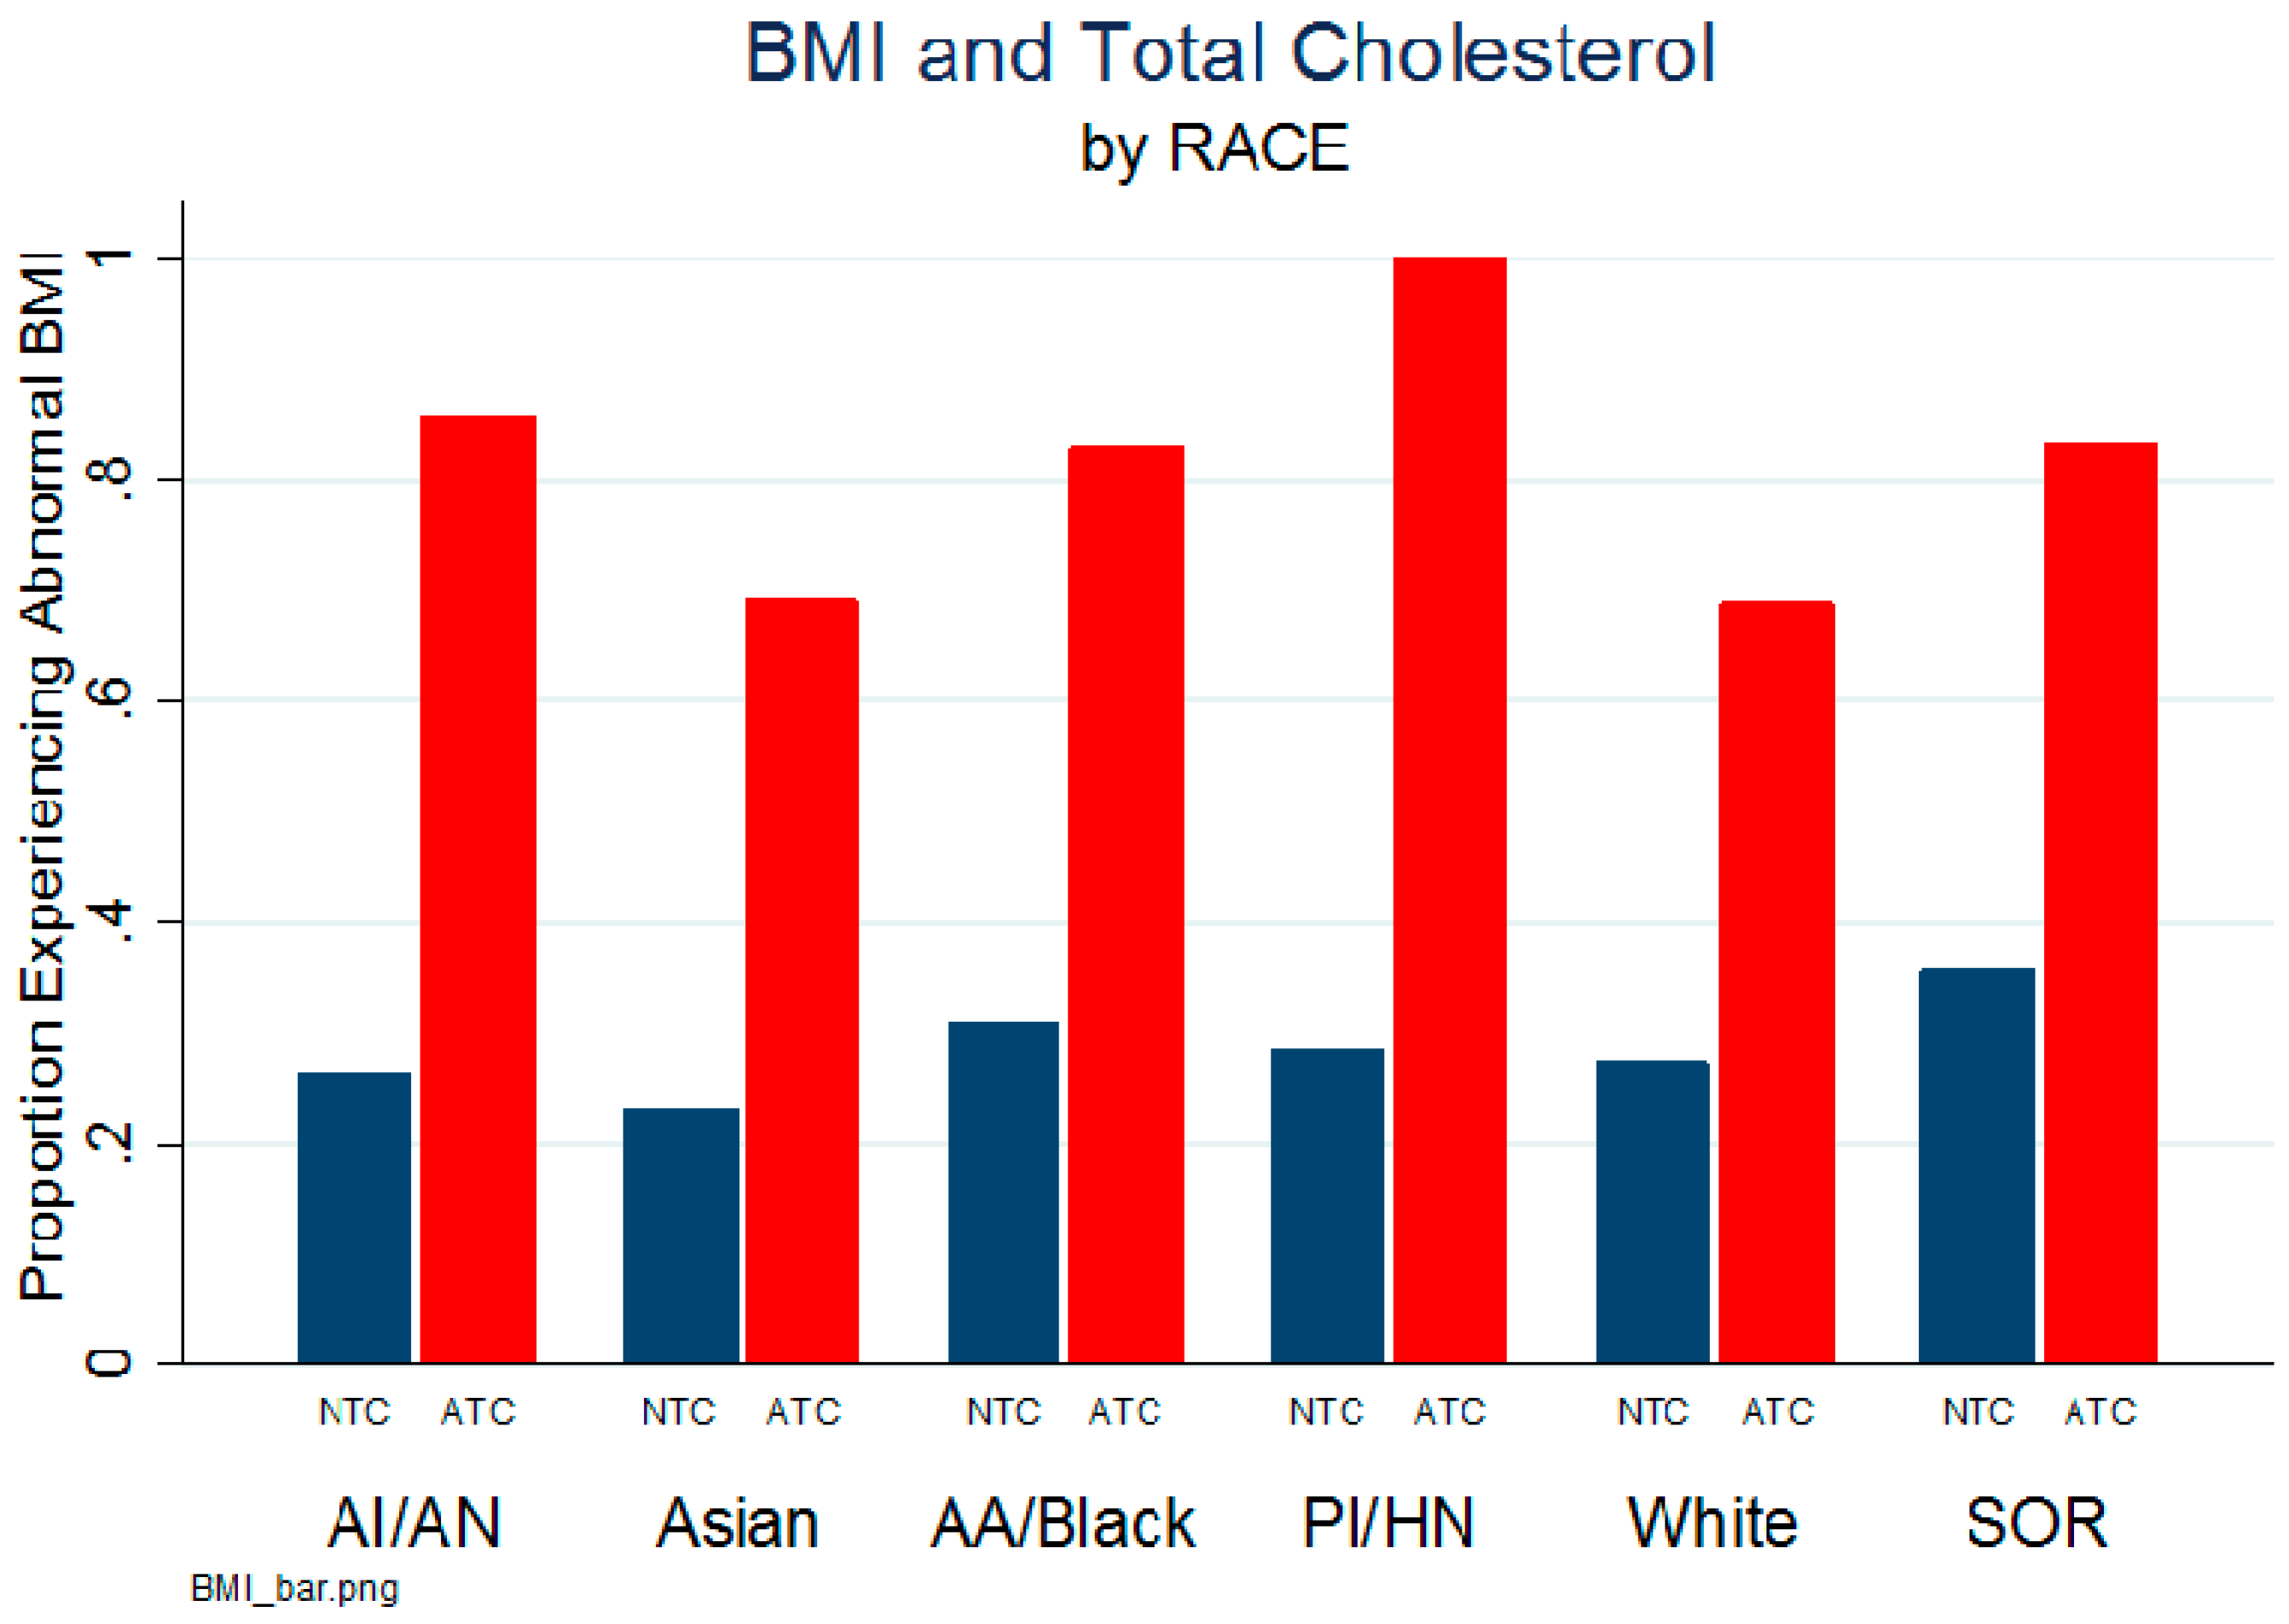
| Body Mass Index | 321.3 (6) | <0.0001 | ||||||
| Normal | 71 (68.9) | 999 (74.9) | 20,959 (65.7) | 35 (71.4) | 3429 (59.4) | 17,697 (70.0) | ||
| Overweight/Obese | 32 (25.1) | 335 (25.1) | 10,936 (34.3) | 14 (28.6) | 2340 (40.6) | 7579 (30.0) | ||
| Total cholesterol | 141.9 (6) | <0.0001 | ||||||
| Normal | 96 (93.2) | 1266 (94.9) | 29,548 (92.6) | 48 (97.0) | 5116 (88.7) | 23,493 (92.9) | ||
| Abnormal | 7 (6.80) | 68 (5.10) | 2347 (7.36) | 1 (2.04) | 653 (11.3) | 1783 (7.05) | ||
| Insurance | 7400 (12) | <0.0001 | ||||||
| Commercial | 62 (60.2) | 860 (64.5) | 11,280 (35.4) | 17 (34.7) | 2104 (36.5) | 17,635 (69.8) | ||
| Public | 39 (37.9) | 435 (32.6) | 19,586 (61.4) | 31 (63.3) | 3465 (60.10) | 6915 (27.4) | ||
| Uninsured | 2 (1.90) | 39 (2.9) | 1029 (3.2) | 1 (2.0) | 200 (3.5) | 726 (2.9) | ||
3.1.3. Study Characteristics by Race (Categorical Variables)
| AI/AN | Asian | Black/AA | HN/PI | SOR | White | F | p | |
|---|---|---|---|---|---|---|---|---|
| Variables | mean (SD) | mean (SD) | mean (SD) | mean (SD) | mean (SD) | mean (SD) | ||
| Height | 126.6 (25.6) | 122.2 (25.0) | 130.4 (27.3) | 115.6 (25.6) | 123.7 (25.6) | 128.2 (26.9) | 73.9 | <0.0001 |
| Weight | 31.4 ((17.6) | 28.7 (16.8) | 36.8 (23.0) | 26.5 (16.5) | 32.6 (20.5) | 34.0 (20.8) | 71.2 | <0.0001 |
| BMI% | 58.1 (33.1) | 55.7 (31.5) | 65.2 (29.1) | 65.8 (26.4) | 69.0 (28.6) | 62.4 (29.0) | 58.6 | <0.0001 |
| BMI | 17.9 (3.79) | 17.7 (3.69) | 19.5 (13.1) | 18.0 (3.36) | 19.2 (4.85) | 18.8 (11.2) | 10.5 | <0.0001 |
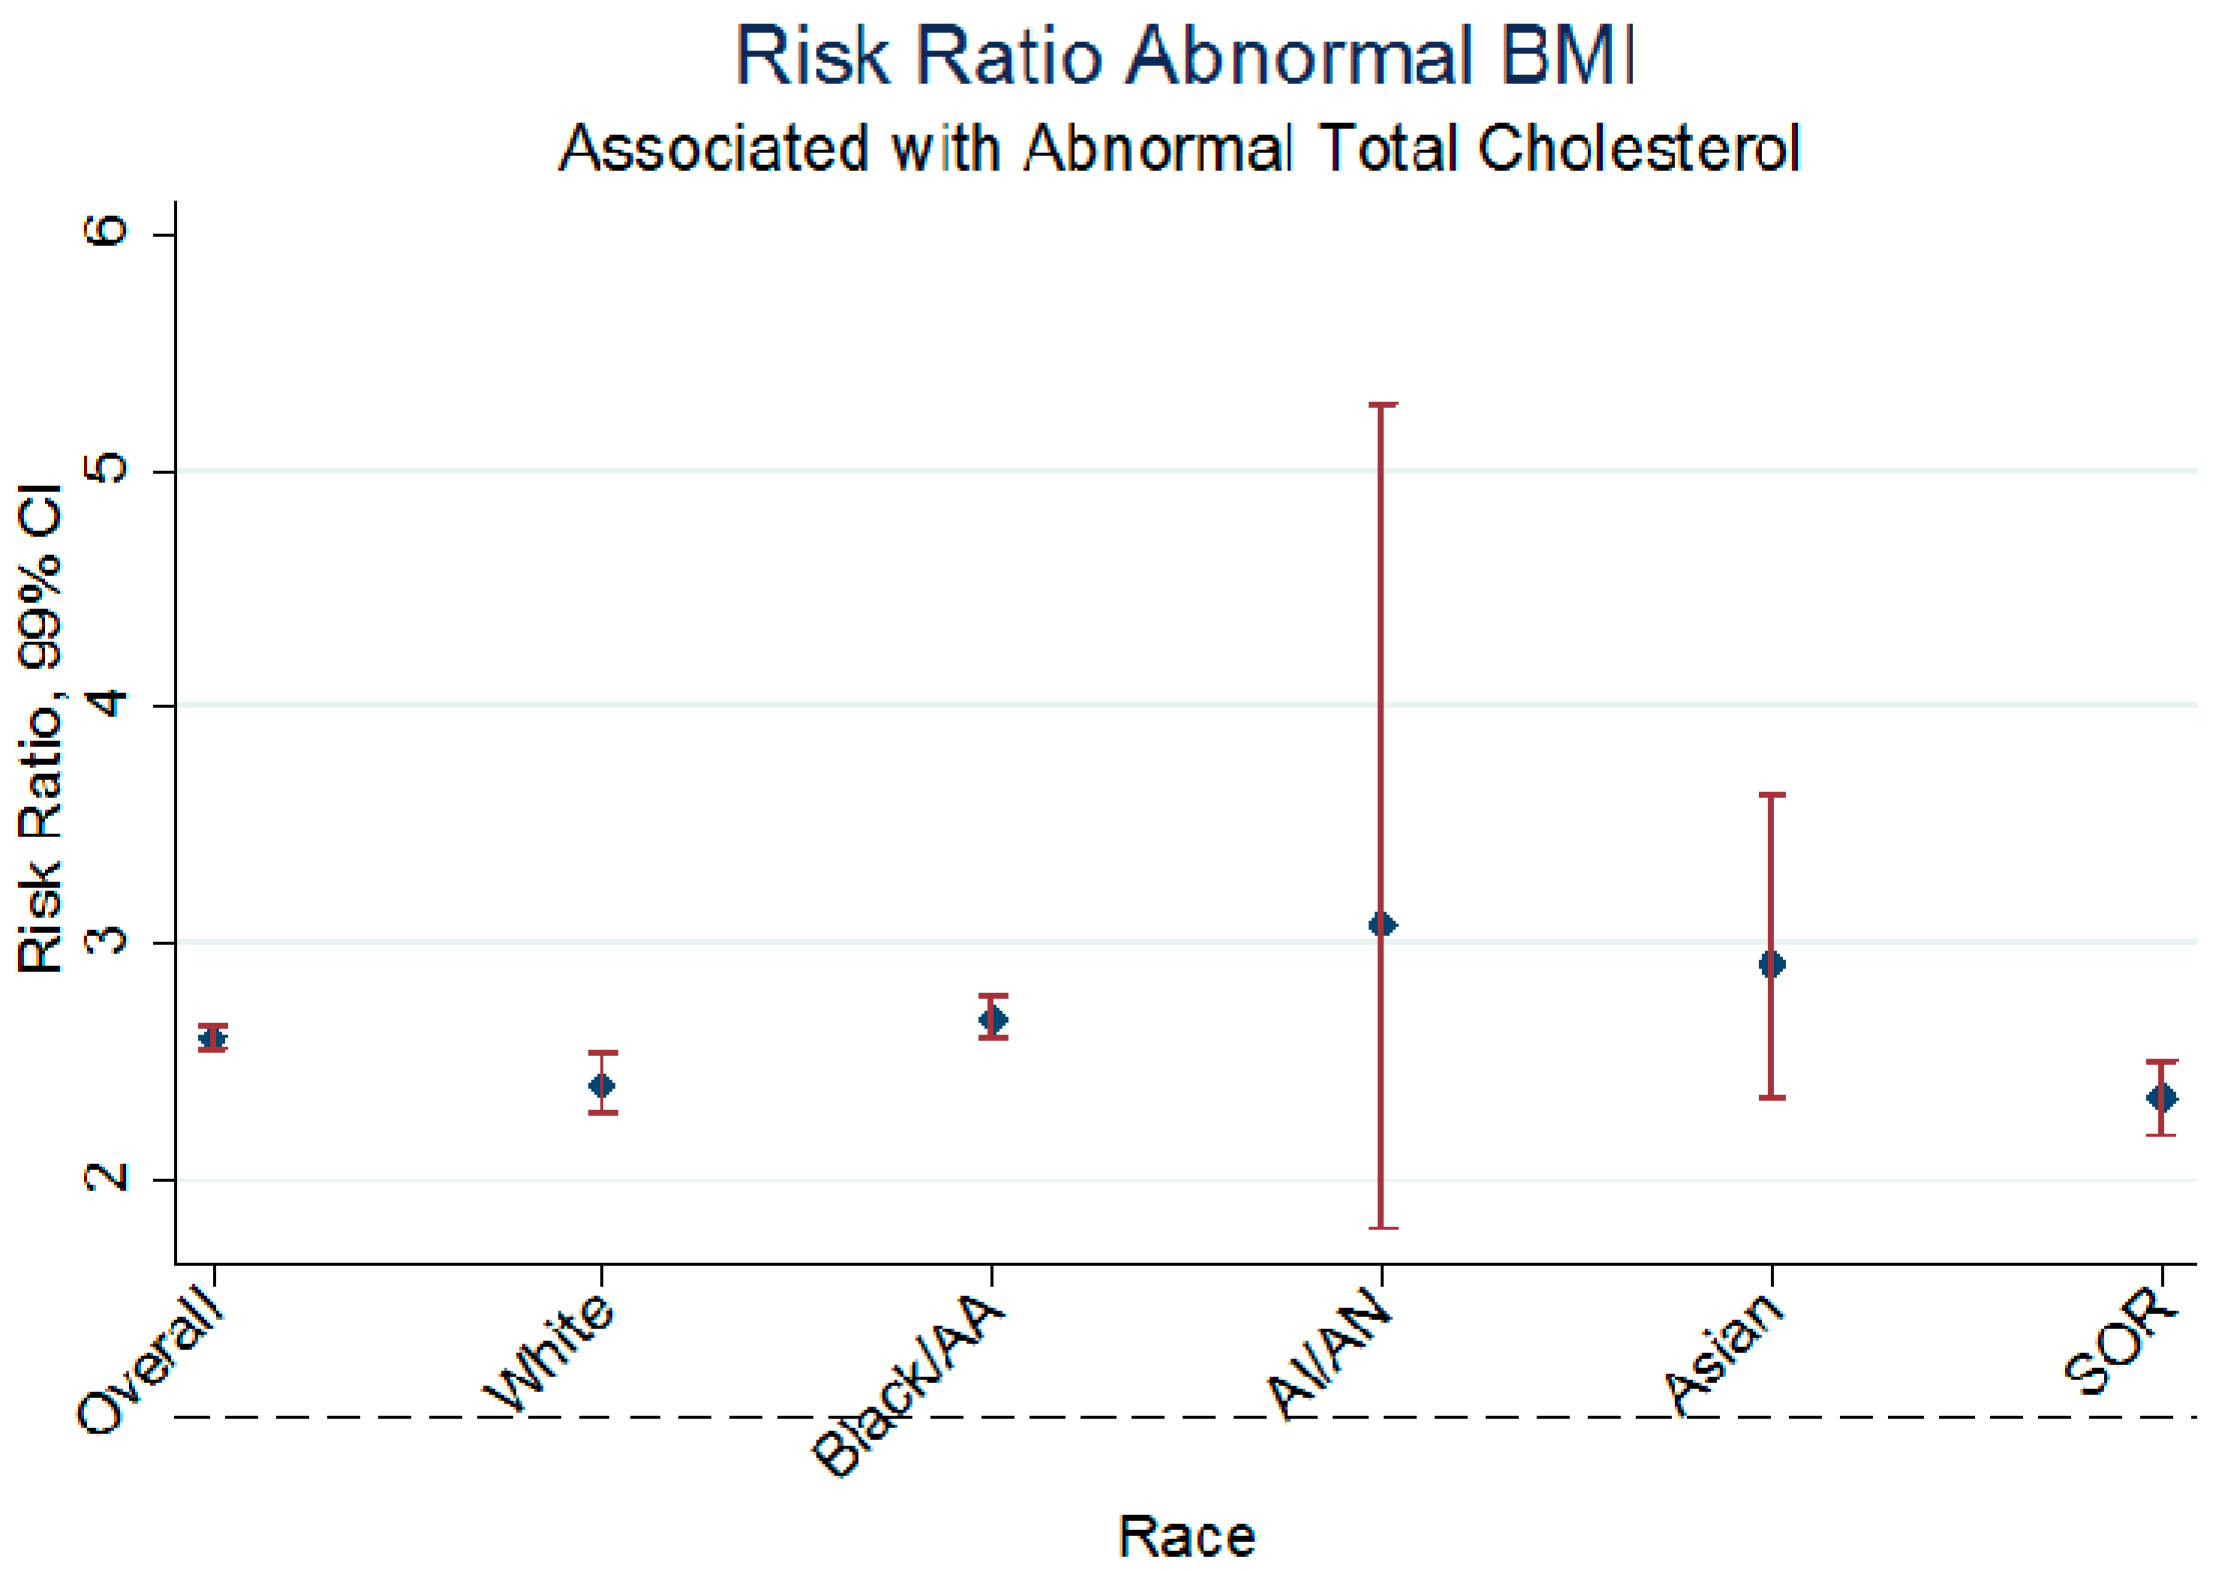
3.1.4. Multi-Level Risk Ratio (adjusted) Relationship between Total Cholesterol and Other Factors with BMI

| Race | Odds Ratio | 99% CI | p |
|---|---|---|---|
| AI/AN | 16.8 | 1.68–168.0 | 0.001 |
| Asian | 7.3 | 4.24–12.64 | <0.001 |
| Black/AA | 11.0 | 9.75–12–64 | <0.001 |
| White | 5.8 | 5.23–6.49 | <0.001 |
| SOR | 8.9 | 7.13–11.19 | <0.001 |
| Variable | ARR | 99% CI | p |
|---|---|---|---|
| Ethnicity | |||
| Non-Hispanic | 2.61 | 2.54–2.69 | <0.001 |
| Hispanic | 2.34 | 2.21–2.48 | <0.001 |
| Race | |||
| White | 2.40 | 2.29–2.53 | <0.001 |
| Black/AA | 2.68 | 2.60–2.77 | <0.001 |
| AI/AN | 3.08 | 1.80–5.28 | <0.001 |
| Asian | 2.91 | 2.34–3.62 | <0.001 |
| SOR | 2.34 | 2.19–2.50 | <0.001 |
3.2. Discussion
4. Conclusions
Acknowledgments
Author Contributions
Conflicts of Interest
References
- Lamb, M.M.; Ogden, C.L.; Carroll, M.D.; Lacher, D.A.; Flegal, K.M. Association of body fat percentage with lipid concentrations in children and adolescents: United States, 1999–2004. Am. J. Clin. Nutr. 2001, 94, 877–883. [Google Scholar] [CrossRef] [PubMed]
- Doumatey, A.P.; Lashley, K.S.; Huang, H.; Zhou, J.; Chen, G.; Amoah, A.; Agyenim-Boateng, K.; Oli, J.; Fasanmade, O.; Adebamowo, C.A.; et al. Relationships among obesity, inflammation, and insulin resistance in African Americans and West Africans. Obesity 2010, 18, 598–603. [Google Scholar] [CrossRef] [PubMed]
- De Lorenzo, F.; Mukherjee, M.; Kadziola, Z.; Suleiman, S.; Kakkar, V.V. Association of overall adiposity rather than body mass index with lipids and procoagulant factors. Thromb Haemost 1998, 80, 603–606. [Google Scholar] [PubMed]
- Edgell, H.; Petrella, R.J.; Hodges, G.J.; Shoemaker, J.K. Central versus peripheral cardiovascular risk in metabolic syndrome. Frontiers Physiol. 2012, 3. [Google Scholar] [CrossRef] [PubMed]
- Jiang, X.; Srinivasan, S.R.; Urbina, E.; Berenson, G.S. Hyperdynamic circulation and cardiovascular risk in children and adolescents, the bogalusa heart study. Circulation 1995, 91, 1101–1106. [Google Scholar] [CrossRef] [PubMed]
- Eirin, A.; Zhu, X.Y.; Woolard, J.R.; Herrmann, S.M.; Gloviczki, M.L.; Saad, A.; Juncos, L.A.; Calhoun, D.A.; Rule, A.D.; Lerman, A.; et al. Increased circulating inflammatory endothelial cells in blacks with essential hypertension. Hypertension 2013, 62, 585–589. [Google Scholar] [CrossRef] [PubMed]
- Mangiacapra, F.; de Bruyne, B.; Peace, A.J.; Melikian, N.; Wijns, W.; Barbato, E. High cholesterol levels are associated with coronary microvascular dysfunction. J. Cardiovasc. Med. 2012, 13, 439–442. [Google Scholar] [CrossRef] [PubMed]
- Hu, D.; Hannah, J.; Gray, R.S.; Jablonski, K.A.; Henderson, J.A.; Robbins, D.C. Effects of obesity and body fat distribution on lipids and lipoproteins in nondiabetic American Indians: The Strong Heart Study. Obesity Res. 2000, 8, 411–421. [Google Scholar] [CrossRef] [PubMed]
- Chen, T.J.; Ji, C.Y.; Pang, Z.C.; Wang, S.J.; Hu, Y.H.; Qin, Y. Heritability of Total Cholesterols and Lipoproteins and Its Related Factors in Twins Aged 5 to 19 Years of China; Institute of Child and Adolescent Health, Peking University: Beijing, China, 2004. [Google Scholar]
- Foster, C.J.; Weinsier, R.L.; Birch, R.; Norris, D.J.; Bernstein, R.S.; Wang, J.; Pierson, R.N.; van Itallie, T.B. Obesity and total cholesterols: An evaluation of the relative contribution of body fat and fat distribution to lipid levels. Int. J. Obes. 1986, 11, 151–161. [Google Scholar]
- Wilks, R.J.; McFarlane-Anderson, N.; Bennett, F.I.; Reid, M.; Forrester, T.E. Blood pressure in Jamaican children: Relationship to body size and composition. West Indian Med. J. 1999, 48, 61–68. [Google Scholar] [PubMed]
- Kit, B.K.; Carroll, M.D.; Lacher, D.A.; Sorlie, P.D.; DeJesus, J.M.; Ogden, C. Trends in total cholesterol s among US youths aged 6 to 19 years, 1988–2010. JAMA 2012, 308, 591–600. [Google Scholar] [CrossRef] [PubMed]
- Magkos, F.; Piperkou, I.; Manios, Y.; Papoutsakis, C.; Yiannakouris, N.; Cimponerio, A.; Aloumanis, K.; Skenderi, K.; Papathoma, A.; Arvaniti, F.; et al. Diet, blood lipid profile and physical activity patterns in primary school children from a semi-rural area of Greece. J. Hum. Nutr. Diet. 2006, 19, 101–112. [Google Scholar] [CrossRef] [PubMed]
- Shah, N.R.; Braverman, E.R. Measuring adiposity in patients: The utility of body mass index (BMI), percent body fat, and leptin. PLoS ONE 2012, 7. [Google Scholar] [CrossRef] [PubMed]
- Freedman, D.S.; Sherry, B. The validity of BMI as an indicator of body fatness and risk among children. Pediatrics 2009, 124, S23–S34. [Google Scholar] [CrossRef] [PubMed]
- Miljkovic, I.; Kuipers, A.L.; Kuller, L.H.; Sheu, Y.; Bunker, C.H.; Patrick, A.L.; Wheeler, V.W.; Evans, R.W.; Zmuda, J.M. Skeletal Muscle Adiposity is associated with total cholesterol and Lipoprotein Levels in Afro-Caribbean Men. Obesity 2013, 21, 1900–1907. [Google Scholar] [PubMed]
- Morin, S.; Leslie, W.D. Manitoba bone density program. high bone mineral density is associated with high body mass index. Osteoporos. Int. 2009, 20, 1267–1271. [Google Scholar] [CrossRef] [PubMed]
- Katzmarzyk, P.T.; Leon, A.S.; Rankinen, T.; Gagnon, J.; Skinner, J.S.; Wilmore, J.H.; Rao, D.C.; Bouchard, C. Changes in blood lipids consequent to aerobic exercise training related to changes in body fatness and aerobic fitness. Metabolism 2001, 50, 841–848. [Google Scholar] [CrossRef] [PubMed]
- Dai, S.; Fulton, J.E.; Harrist, R.B.; Grunbaum, J.A.; Steffen, L.M.; Labarthe, D.R. Blood lipids in children: Age-related patterns and association with body-fat indices. Am. J. Prev. Med. 2009, 37, S56–S64. [Google Scholar] [CrossRef] [PubMed]
- Centers for Disease Control and Prevention, Division of Nutrition, Physical Activity and Obesity. Defining Childhood Obesity, 2015. Available online: http://www.cdc.gov/obesity/childhood/defining.html (accessed on 28 June 2015).
- Freedman, D.S.; Khan, L.K.; Serdula, M.K.; Ogden, C.L.; Dietz, W.H. Racial and ethnic differences in secular trends for childhood BMI, weight, and height. Obesity 2006, 14, 301–308. [Google Scholar] [CrossRef] [PubMed]
- Daniels, S.; Greer, F.; The Committee on Nutrition. Lipid screening and cardiovascular health in children. Pediatrics 2008, 122, 198–208. [Google Scholar] [CrossRef] [PubMed]
- Corson, K. Blood Collection Adverse Reactions and Patient Blood Volumes. Available online: http://www.frhg.org/documents/Lab_Manuals/Blood-Collection-Adverse-Reactions-and-Patient-Blood-Volumes.pdf (accessed on 6 May 2015).
- Centers for Disease Control and Prevention, Division of Nutrition, Physical Activity, and Obesity. Published 2015. Updated 15 May 2015. Available online: http://www.cdc.gov/healthyweight/assessing/bmi/childrens_bmi/about_childrens_bmi.html (accessed on 28 June 2015).
- Frisdal, E.; le Lay, S.; Hooton, H.; Poupel, L.; Olivier, M.; Alili, R.; Plengpanich, W.; Villard, E.F.; Gilibert, S.; Lhomme, M.; et al. Adipocyte ATP-binding cassette G1 promotes triglyceride storage, fat mass growth, and human obesity. Diabetes 2014, 64, 840–855. [Google Scholar] [CrossRef] [PubMed] [Green Version]
- Nutrition and Weight Status. HealthyPeople.gov, U.S. Department of Health and Human Services, 2015. Available online: https://www.healthypeople.gov/2020/topics-objectives/topic/nutrition-and-weight-status (accessed on 8 July 2015).
- Sijtsma, F.P.; Meyer, K.A.; Steffen, L.M.; Shikany, J.M.; van Horn, L.; Harnack, L.; Kromhout, D.; Jacobs, D.R. Longitudinal trends in diet and effects of sex, race, and education on dietary quality score change: The coronary artery risk development in young adults study. Am. J. Clin. Nutr. 2012, 95, 580–586. [Google Scholar] [CrossRef] [PubMed]
- Holmes, L.; Chan, W.; Jiang, Z.; Du, X.L. Effectiveness of androgen deprivation therapy in prolonging survival of older men treated for locoregional prostate cancer. Prostate Cancer Prostatic Dis. 2007, 10, 388–395. [Google Scholar] [CrossRef] [PubMed]
© 2015 by the authors; licensee MDPI, Basel, Switzerland. This article is an open access article distributed under the terms and conditions of the Creative Commons by Attribution (CC-BY) license (http://creativecommons.org/licenses/by/4.0/).
Share and Cite
Holmes, L.; LaHurd, A.; Wasson, E.; McClarin, L.; Dabney, K. Racial and Ethnic Heterogeneity in the Association Between Total Cholesterol and Pediatric Obesity. Int. J. Environ. Res. Public Health 2016, 13, 19. https://doi.org/10.3390/ijerph13010019
Holmes L, LaHurd A, Wasson E, McClarin L, Dabney K. Racial and Ethnic Heterogeneity in the Association Between Total Cholesterol and Pediatric Obesity. International Journal of Environmental Research and Public Health. 2016; 13(1):19. https://doi.org/10.3390/ijerph13010019
Chicago/Turabian StyleHolmes, Laurens, Alex LaHurd, Emily Wasson, Lavisha McClarin, and Kirk Dabney. 2016. "Racial and Ethnic Heterogeneity in the Association Between Total Cholesterol and Pediatric Obesity" International Journal of Environmental Research and Public Health 13, no. 1: 19. https://doi.org/10.3390/ijerph13010019