1. Introduction
It is well known and widely accepted that exposure to Extremely Low Frequency (ELF) electromagnetic fields (EMF) causes well-defined acute biological effects on the nervous system, which include in particular nerve stimulation as well as the induction of retinal phospenes [
1,
2,
3,
4]. Furthermore, at the late 1970s, Wertheimer and Leeper [
5] indicated a possible association between long-term exposure to ELF-EMF and an increased risk of childhood cancer. Since then, many expert-group reports, as well as independent epidemiological studies have specifically addressed this issue and in particular the relationship between the exposure to ELF-EMF produced by transmission lines and childhood leukaemia (see e.g., [
6,
7,
8,
9,
10,
11,
12,
13,
14,
15,
16,
17,
18,
19]). All this great amount of studies has been mainly based on the investigation of the exposure from electricity transmission and distribution networks at 50 Hz (or 60 Hz in some countries; in the rest of this Introduction, the term 50 Hz should be read as either 50 or 60 Hz, as a function of the country considered). The overall conclusion has been that the exposure to 50 Hz magnetic fields could be associated to an increased risk of leukaemia in children. This has brought the International Agency for Research on Cancer (IARC) [
20] to classify ELF magnetic fields as “possibly carcinogenic to humans” in 2002. Since then, many studies have investigated the assessment of the exposure to magnetic field at the specific frequency of 50 Hz.
However, many authors have stressed the possible influence on ELF health effects of frequency components other than the fundamental 50 Hz one (see e.g., [
21,
22,
23,
24,
25,
26,
27]). From that perspective, one should consider that the sources generating magnetic fields, in addition to the fundamental sinusoidal component at 50 Hz, are emitting additional frequency components, which can be analysed by the so-called sinusoidal harmonics, mainly due to non-linear electric loads. They can be defined as sinusoidal components of a signal, each of them at a frequency of an integer number of times the fundamental frequency. Day after day, this is becoming increasingly important, considering that the sources of distortion (
i.e., causes of introduction of harmonics) are spreading due to the development of new technologies, which use non-linear loads, in common electrical appliances and industrial equipment. This spread, besides impairing the quality of the supplied electrical power and producing damage to the devices, can increase consistently the amount of delivered power and thus increase the levels of exposure in an uncontrolled way [
28].
So far, the available studies addressing the evaluation of the ELF-EMF exposure assessment at tissue level have been focused only on the exposure to 50 Hz magnetic fields of children, adults, women and pregnant women (see e.g., the studies of [
29,
30,
31,
32,
33]). However, no study has addressed the estimation of the exposure at tissue level considering the contribution of the harmonics, least of all on foetuses.
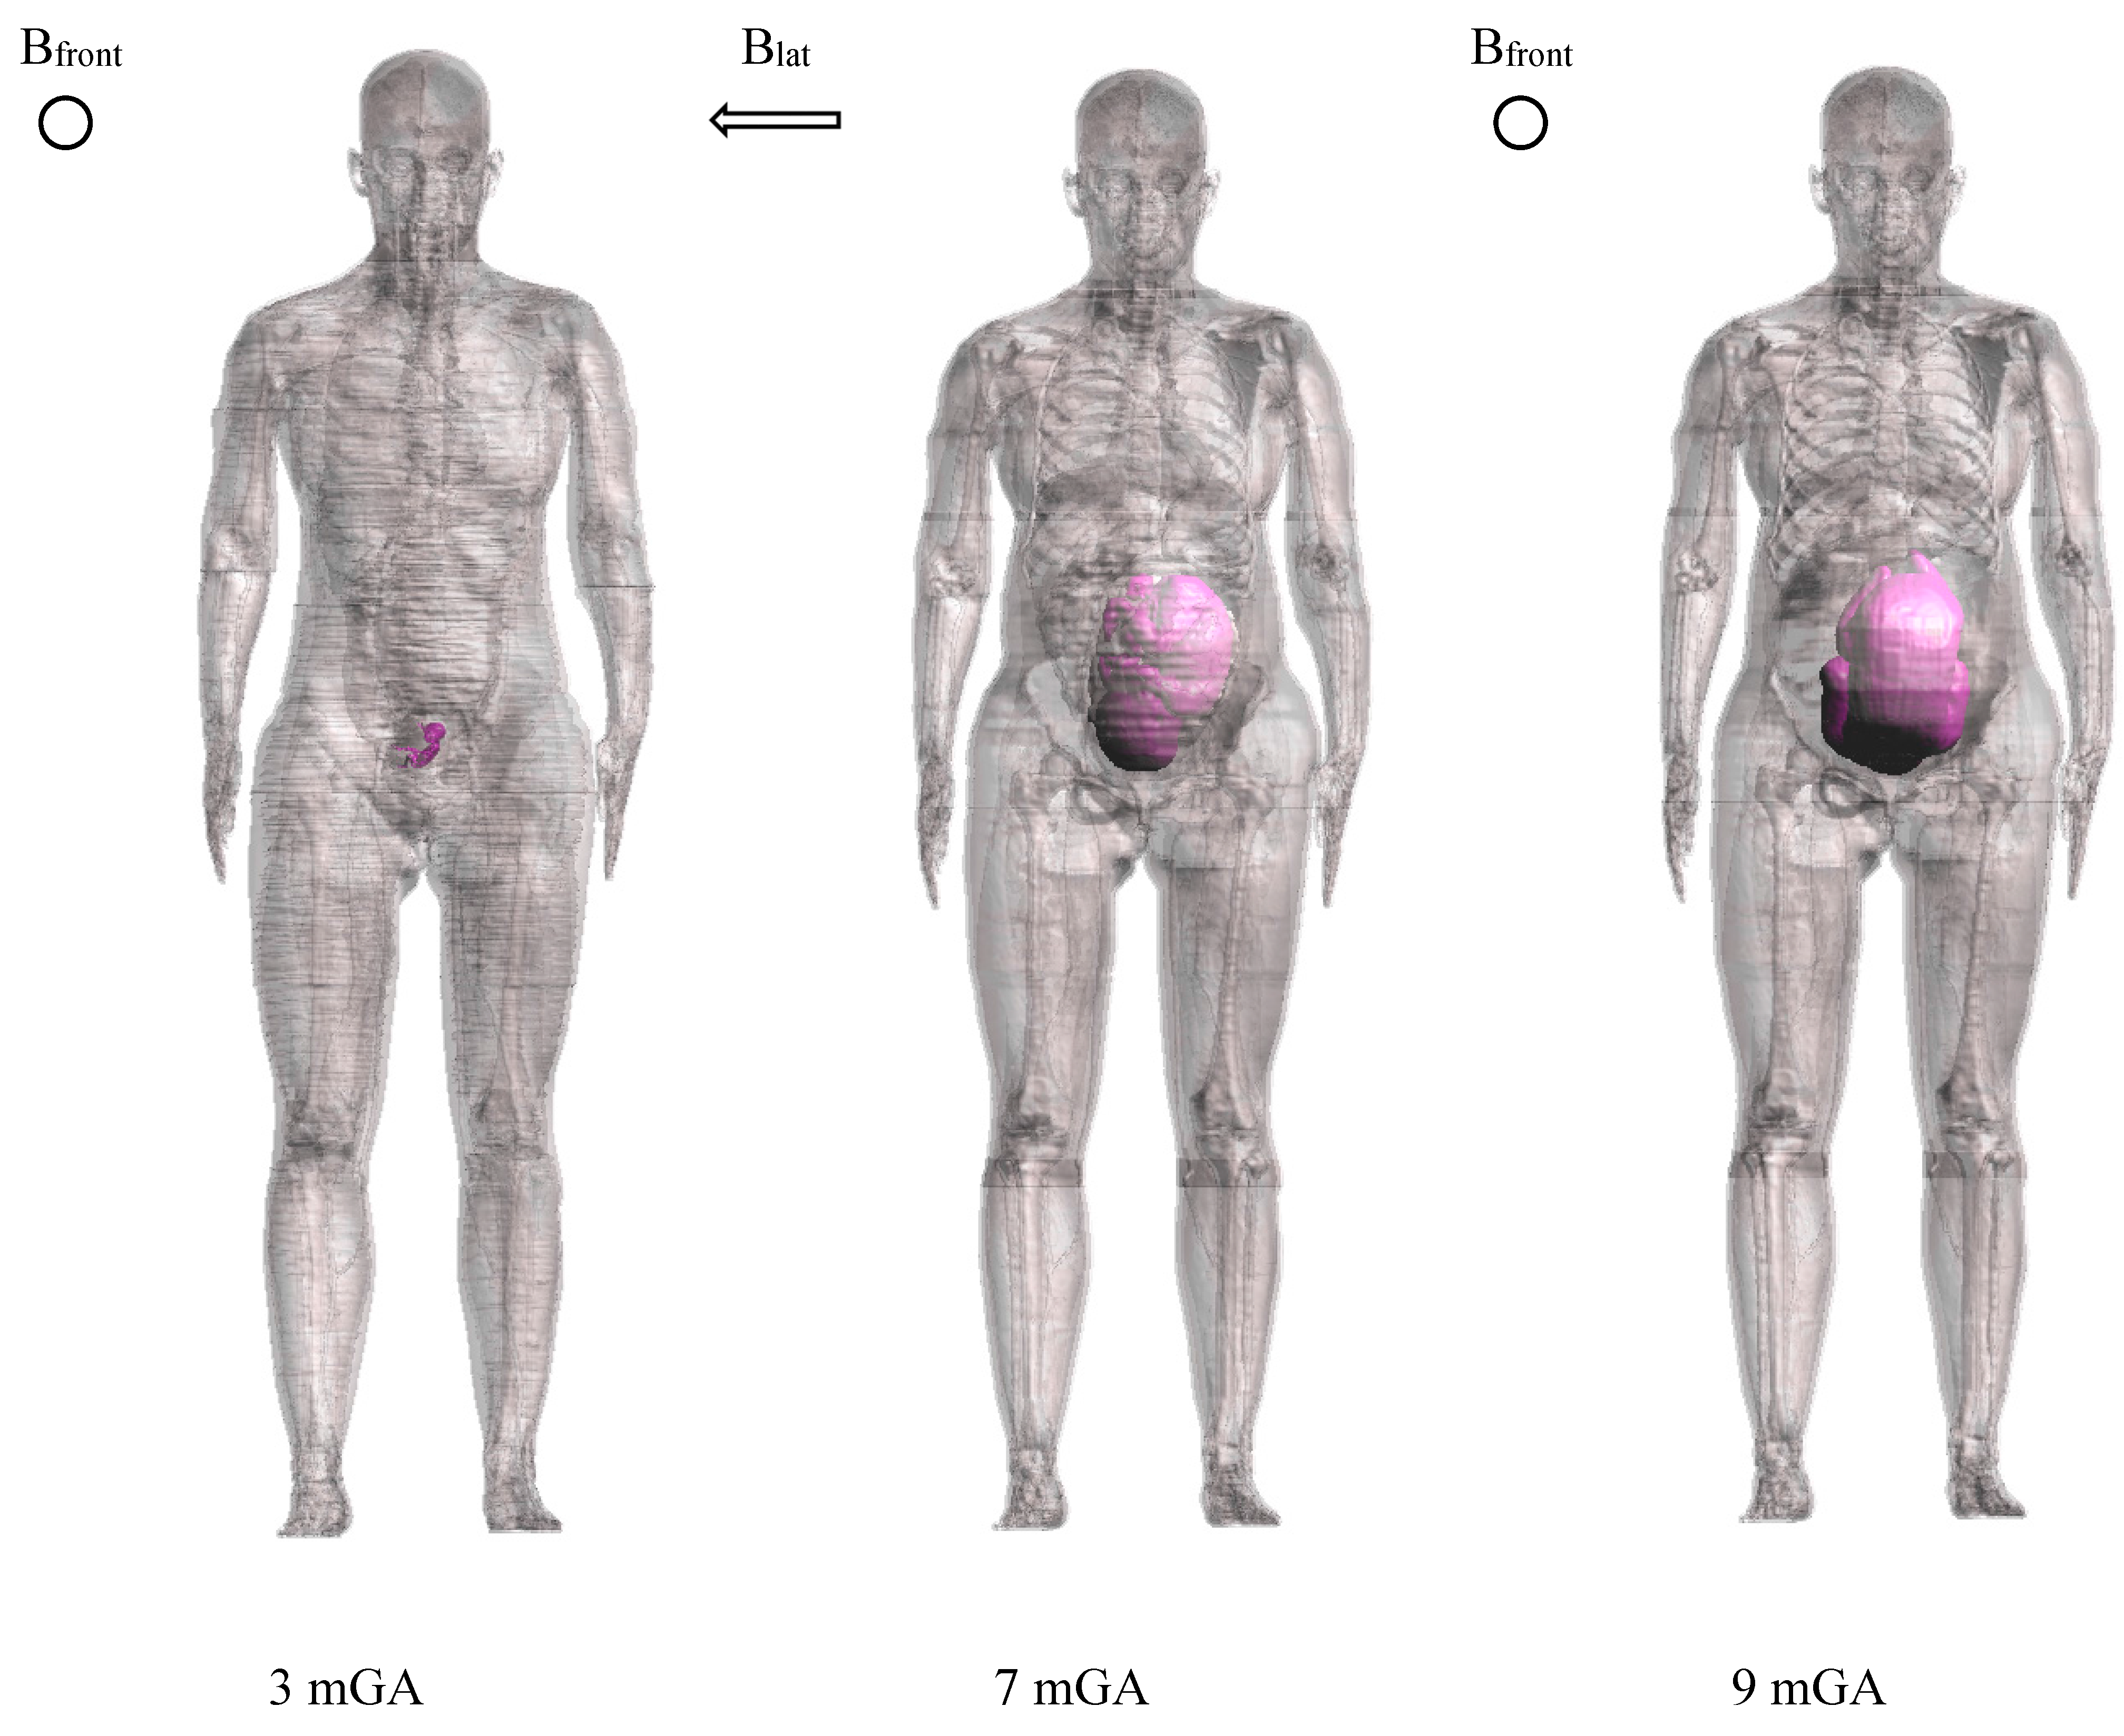
The aim of this study was therefore to assess this latter exposure considering the harmonic content of a uniform magnetic field at 50 Hz. It will be performed on high-resolution three-dimensional models of pregnant women at 3, 7, 9 months gestational age. The harmonics considered here are based on the spectrum of supply voltage networks, as described in the European technical standards for the quality assessment of electrical power.
3. Results
Table 4 and
Table 5 summarize the induced E
peak, E
99th and E
50th fields in the whole-body foetus at 3, 7 and 9 months GA, for each frequency component, normalized to
Bpeak,50Hz = 1 μT and scaled according to the relative amplitudes as provided by the EN 50160 standard (
Table 1) for the two power supply networks considered. These results specifically provide a picture of the maximum levels of the foetal exposure to electricity transmission and distribution networks per μT of uniform magnetic field at 50 Hz. Therefore, once known the levels of magnetic field to which a foetus is exposed, by a simple scaling procedure, they can be used to assess the maxima realistic levels of exposure to electricity transmission and distribution networks.
The values reported were found in the fat (Epeak and E99th) and bladder (E50th), skin (Epeak and E99th) and liver (E50th at 50 Hz) and brain (E50th at harmonic frequencies) and skin (Epeak and E99th) and spinal cord (E50th at all frequencies) for 3, 7, 9 months GA foetuses.
Table 4.
Whole-body foetus induced electric field Epeak, E99th and E50th at 3, 7 and 9 months GA, for each frequency, per μT of Bpeak,50Hz, calculated according to the percentage provided by the standard EN 50160 in case of LV or MV electricity distribution networks exposure.
Table 4.
Whole-body foetus induced electric field Epeak, E99th and E50th at 3, 7 and 9 months GA, for each frequency, per μT of Bpeak,50Hz, calculated according to the percentage provided by the standard EN 50160 in case of LV or MV electricity distribution networks exposure.
| LV&MV | 3 mGA | 7 mGA | 9 mGA |
|---|
| Frequency (Hz) | Epeak (μV/m/μT) | E99th (μV/m/μT) | E50th (μV/m/μT) | Epeak (μV/m/μT) | E99th (μV/m/μT) | E50th (μV/m/μT) | Epeak (μV/m/μT) | E99th (μV/m/μT) | E50th (μV/m/μT) |
|---|
| 50 | 19.3 | 14.2 | 9.0 | 40.6 | 27.6 | 10.8 | 56.9 | 38.6 | 16.5 |
| 150 | 2.3 | 1.4 | 1.0 | 5.5 | 3.6 | 1.6 | 7.4 | 4.7 | 2.2 |
| 250 | 4.6 | 2.7 | 2.0 | 10.7 | 7.0 | 3.1 | 14.7 | 9.4 | 4.5 |
| 350 | 5.3 | 3.1 | 2.3 | 12.4 | 8.2 | 3.6 | 17.2 | 10.9 | 5.2 |
| 550 | 5.8 | 3.4 | 2.5 | 13.6 | 8.9 | 3.9 | 18.9 | 12.0 | 5.7 |
| 650 | 5.9 | 3.4 | 2.6 | 13.8 | 9.0 | 4.0 | 19.2 | 12.2 | 5.8 |
Table 5.
Whole-body foetus induced electric field Epeak, E99th and E50th at 3, 7 and 9 months GA, for each frequency, per μT of Bpeak,50Hz, calculated according to the percentage provided by the standard EN 50160 in case of HV electricity transmission networks exposure.
Table 5.
Whole-body foetus induced electric field Epeak, E99th and E50th at 3, 7 and 9 months GA, for each frequency, per μT of Bpeak,50Hz, calculated according to the percentage provided by the standard EN 50160 in case of HV electricity transmission networks exposure.
| HV | 3 mGA | 7 mGA | 9 mGA |
|---|
| Frequency (Hz) | Epeak (μV/m/μT) | E99th (μV/m/μT) | E50th (μV/m/μT) | Epeak (μV/m/μT) | E99th (μV/m/μT) | E50th (μV/m/μT) | Epeak (μV/m/μT) | E99th (μV/m/μT) | E50th (μV/m/μT) |
|---|
| 50 | 19.3 | 14.2 | 9.0 | 40.6 | 27.6 | 10.8 | 56.9 | 38.6 | 16.5 |
| 150 | 1.4 | 0.8 | 0.6 | 3.3 | 2.2 | 0.9 | 4.4 | 2.8 | 1.3 |
| 250 | 3.8 | 2.2 | 1.7 | 8.9 | 5.9 | 2.6 | 12.3 | 7.8 | 3.7 |
| 350 | 4.3 | 2.5 | 1.9 | 9.9 | 6.5 | 2.9 | 13.8 | 8.7 | 4.2 |
| 550 | 5.0 | 2.9 | 2.2 | 11.7 | 7.6 | 3.4 | 16.2 | 10.3 | 4.9 |
| 650 | 4.9 | 2.9 | 2.1 | 11.5 | 7.5 | 3.3 | 16.0 | 10.1 | 4.8 |
Figure 2,
Figure 3,
Figure 4,
Figure 5,
Figure 6 and
Figure 7 show the calculated E
peak, E
99th and E
50th, for all harmonics considered in this study, over all tissues of the 3, 7 and 9 months GA foetuses, respectively, considering the exposure to
Bpeak,50Hz = 1 μT for both the power supply networks considered. The maxima for each frequency coincide with the whole-body foetus values shown in
Table 4.
The levels of the induced electric fields in the foetus were also compared with the exposure limits for general public exposure [
4]. To that purpose, the maxima E
99th found among the CNS tissues over the head (
i.e., brain and eye according to the ICNIRP guidelines 2010 [
4]) and among all the other tissues for each frequency have been scaled according to the values shown in
Table 3, that identifies the worst-case exposure scenario.
Figure 8 shows these data as a function of the frequency of the component under consideration and considering the standards for both the Low and Medium Voltage (LV & MV) and the High Voltage (HV) networks, respectively.
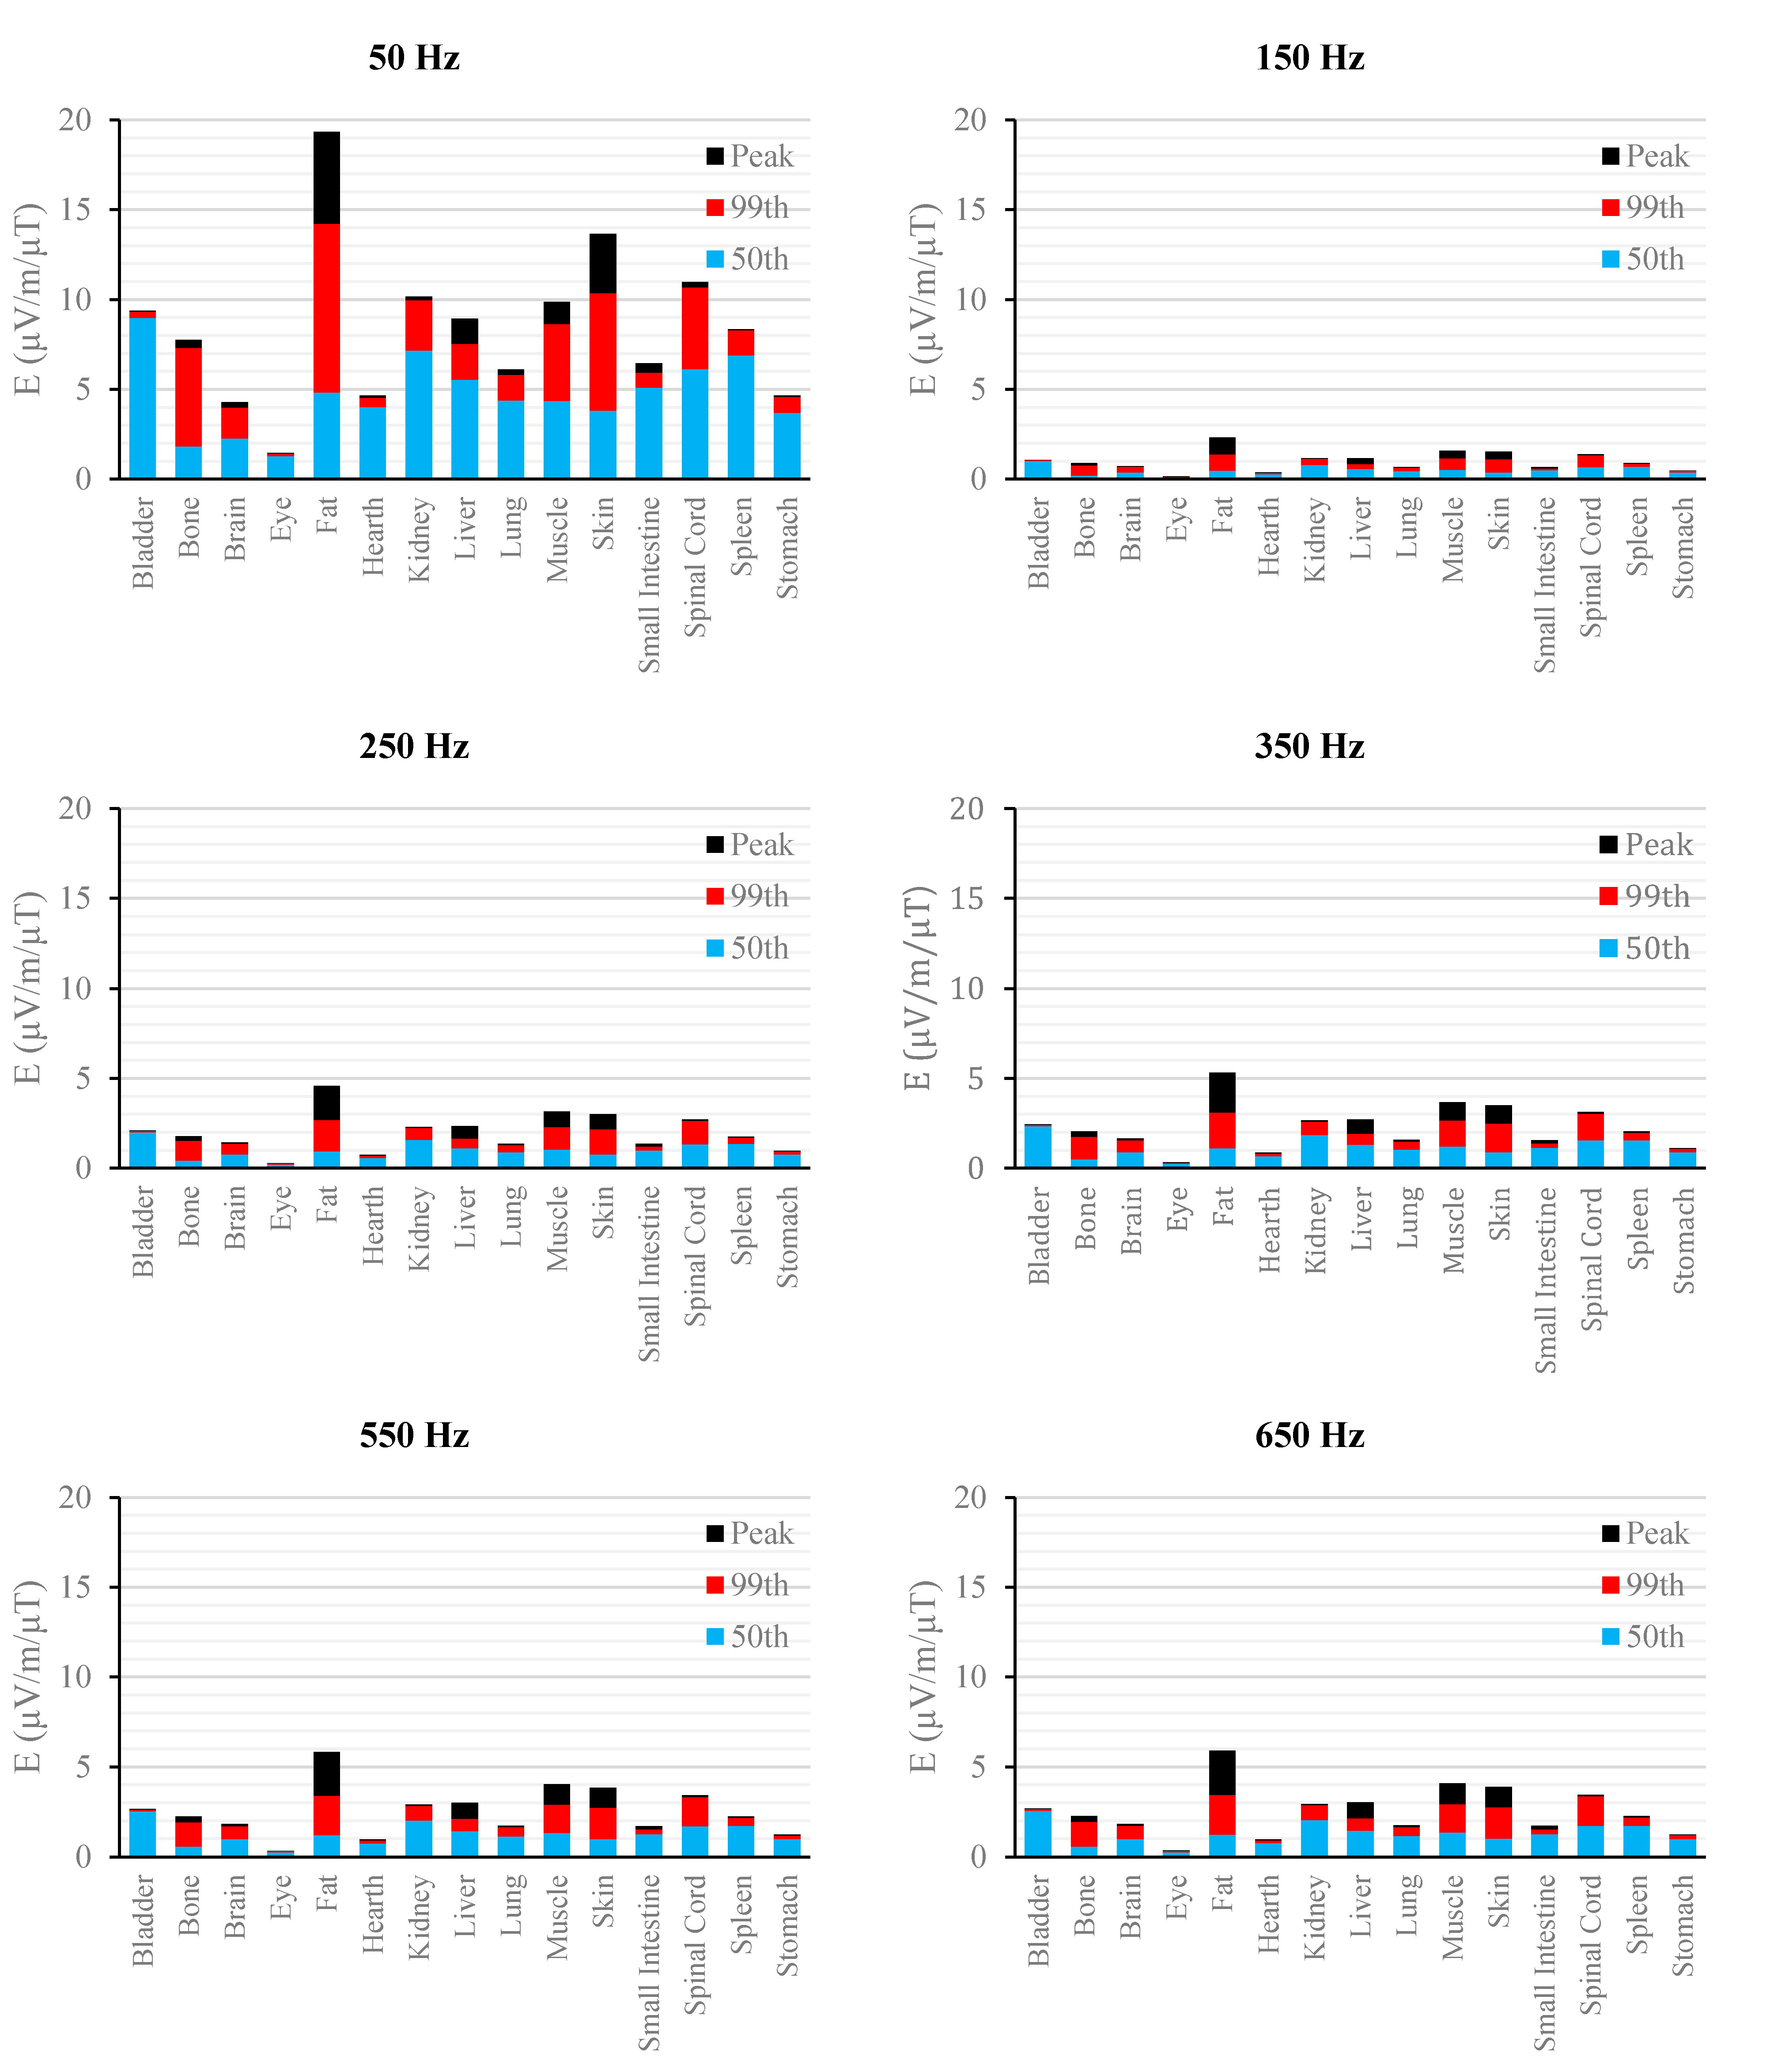
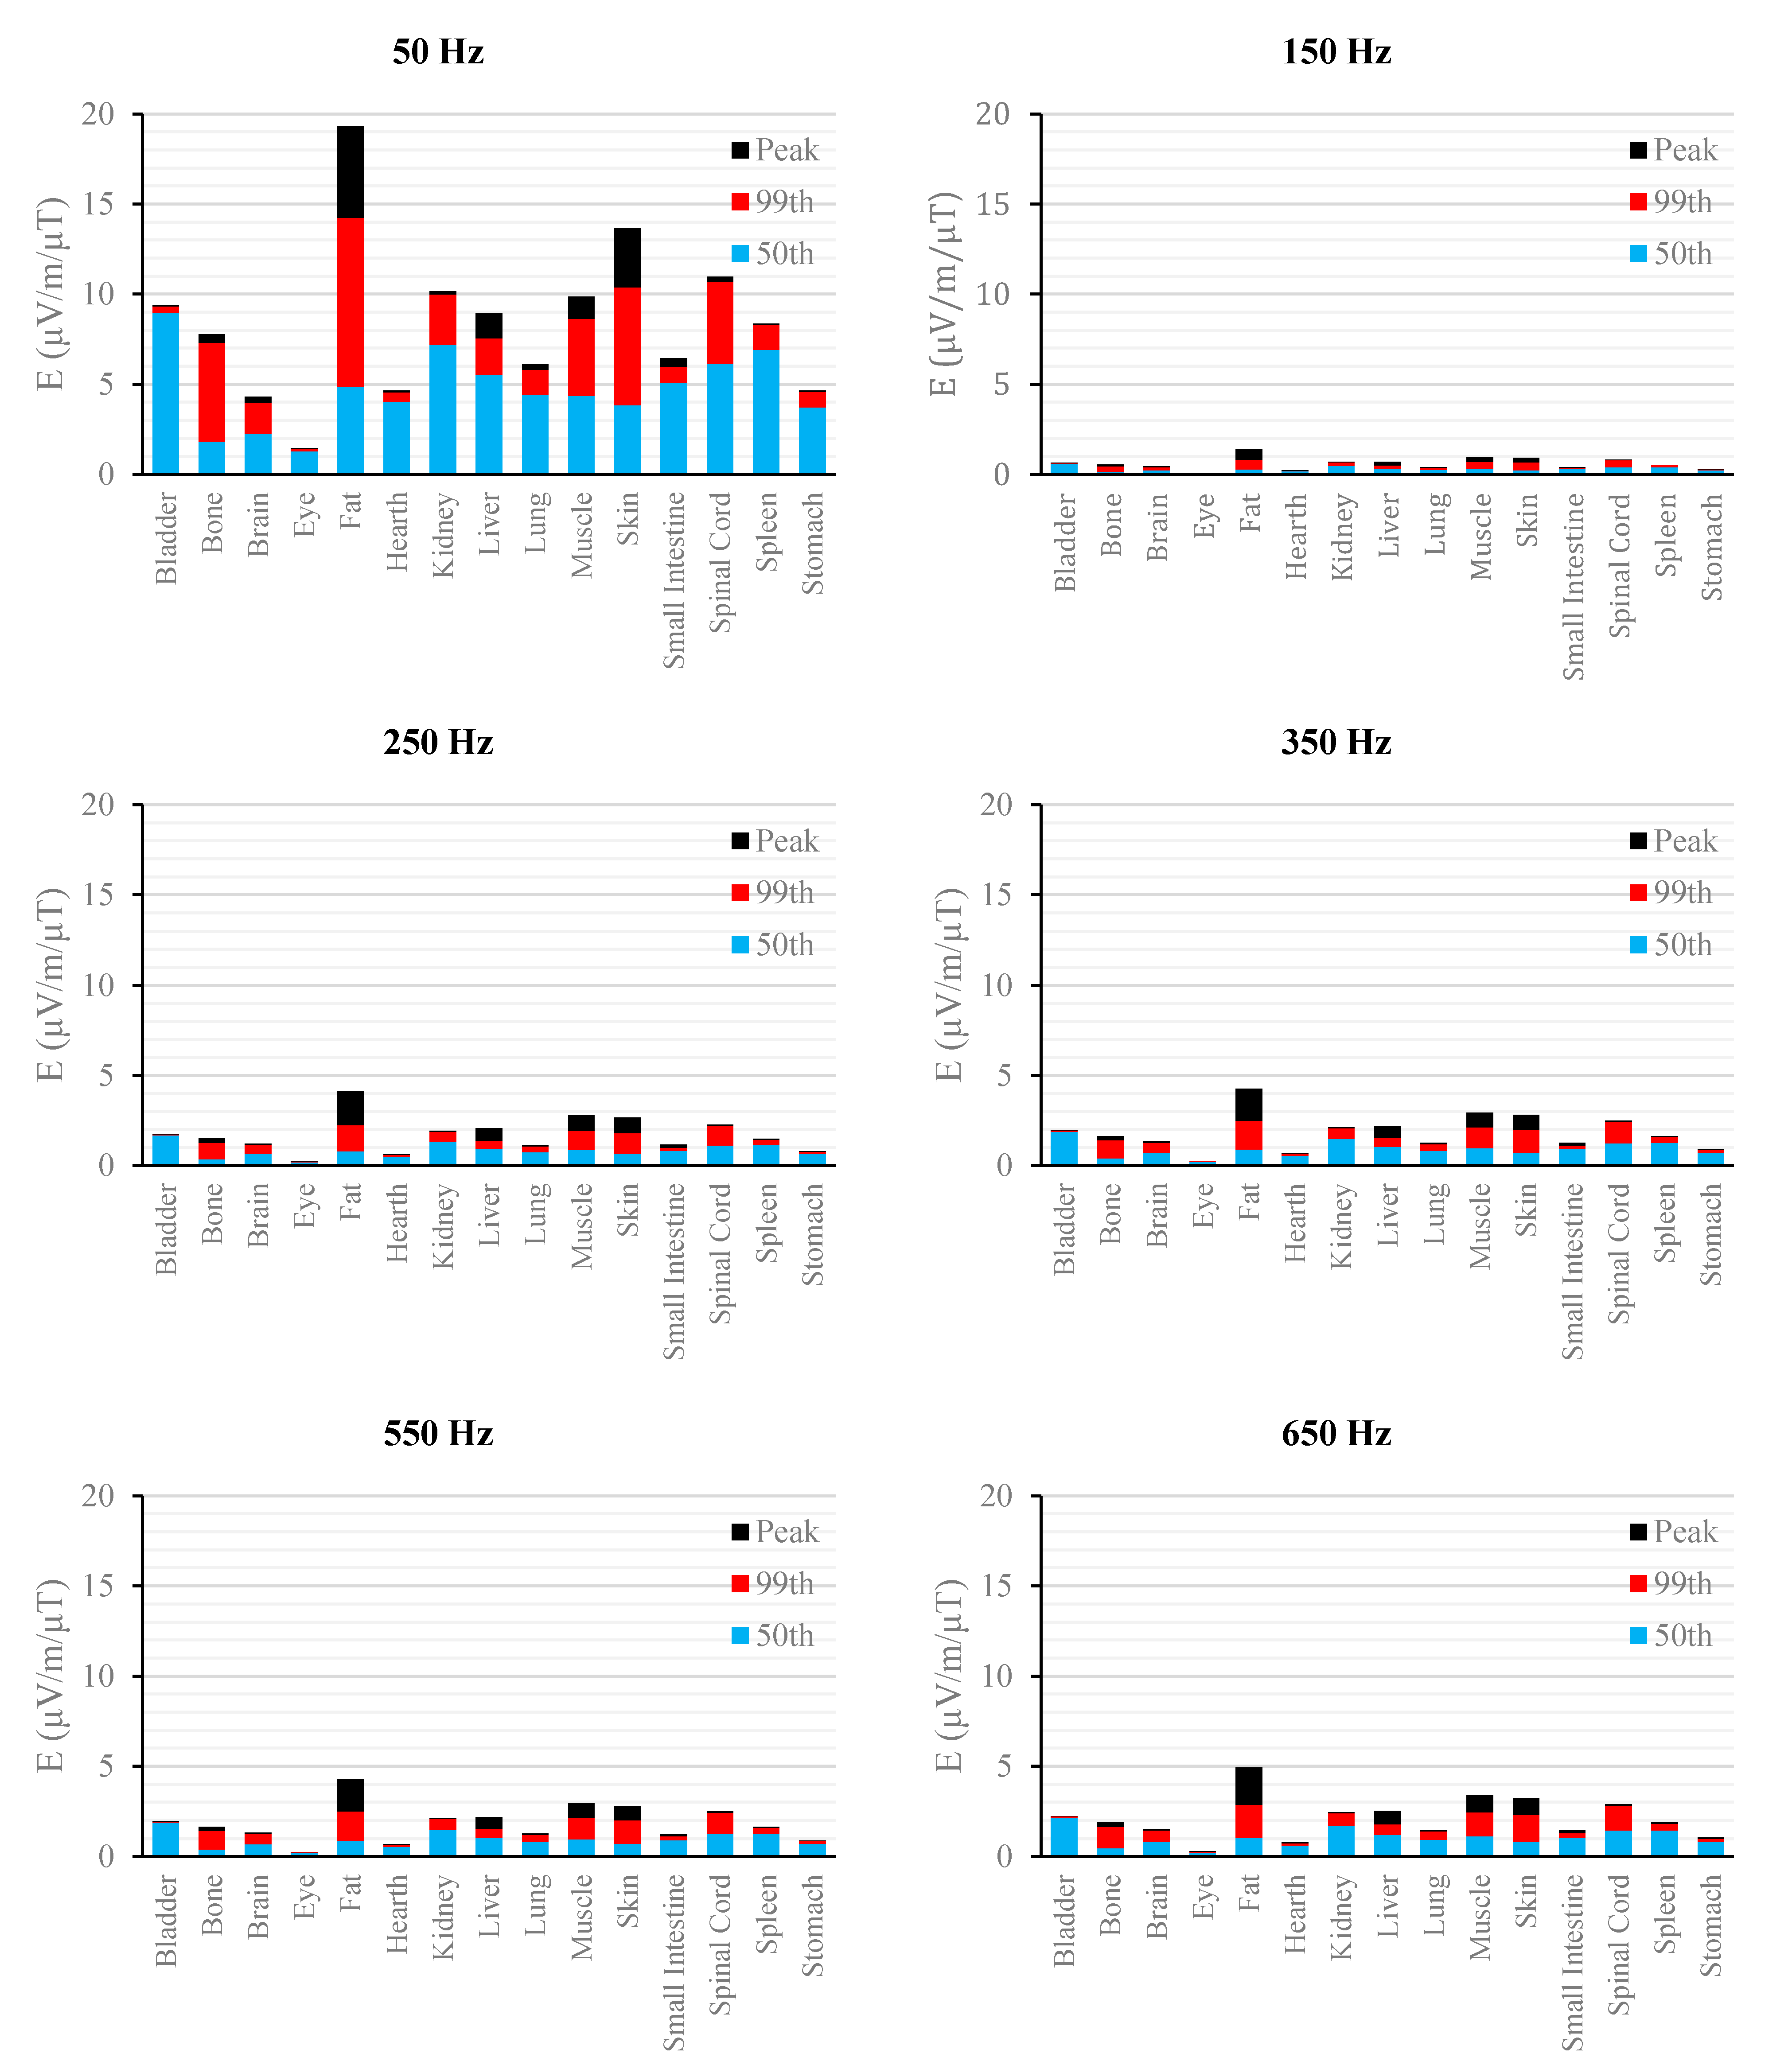
Figure 2.
E (μV/m) per μT of 50 Hz Bpeak induced in foetal tissues at 3 mGA for all the harmonic frequencies considering the standard EN 50160 for the LV&MV power supply networks. The bars indicate the E50th (blue), the E99th (red) percentiles and the Epeak (black) of each distribution.
Figure 2.
E (μV/m) per μT of 50 Hz Bpeak induced in foetal tissues at 3 mGA for all the harmonic frequencies considering the standard EN 50160 for the LV&MV power supply networks. The bars indicate the E50th (blue), the E99th (red) percentiles and the Epeak (black) of each distribution.
Figure 3.
E (μV/m) per μT of 50 Hz Bpeak induced in foetal tissues at 3 mGA for all the harmonic frequencies considering the standard EN 50160 for the HV power supply networks. The bars indicate the E50th (blue), the E99th (red) percentiles and the Epeak (black) of each distribution.
Figure 3.
E (μV/m) per μT of 50 Hz Bpeak induced in foetal tissues at 3 mGA for all the harmonic frequencies considering the standard EN 50160 for the HV power supply networks. The bars indicate the E50th (blue), the E99th (red) percentiles and the Epeak (black) of each distribution.
Figure 4.
E (μV/m) per μT of 50 Hz Bpeak induced in foetal tissues at 7 mGA for all the harmonic frequencies considering the standard EN 50160 for the LV&MV power supply networks. The bars indicate the E50th (blue), the E99th (red) percentiles and the Epeak (black) of each distribution.
Figure 4.
E (μV/m) per μT of 50 Hz Bpeak induced in foetal tissues at 7 mGA for all the harmonic frequencies considering the standard EN 50160 for the LV&MV power supply networks. The bars indicate the E50th (blue), the E99th (red) percentiles and the Epeak (black) of each distribution.
Figure 5.
E (μV/m) per μT of 50 Hz Bpeak induced in foetal tissues at 7 mGA for all the harmonic frequencies considering the standard EN 50160 for the HV power supply networks. The bars indicate the E50th (blue), the E99th (red) percentiles and the Epeak (black) of each distribution.
Figure 5.
E (μV/m) per μT of 50 Hz Bpeak induced in foetal tissues at 7 mGA for all the harmonic frequencies considering the standard EN 50160 for the HV power supply networks. The bars indicate the E50th (blue), the E99th (red) percentiles and the Epeak (black) of each distribution.
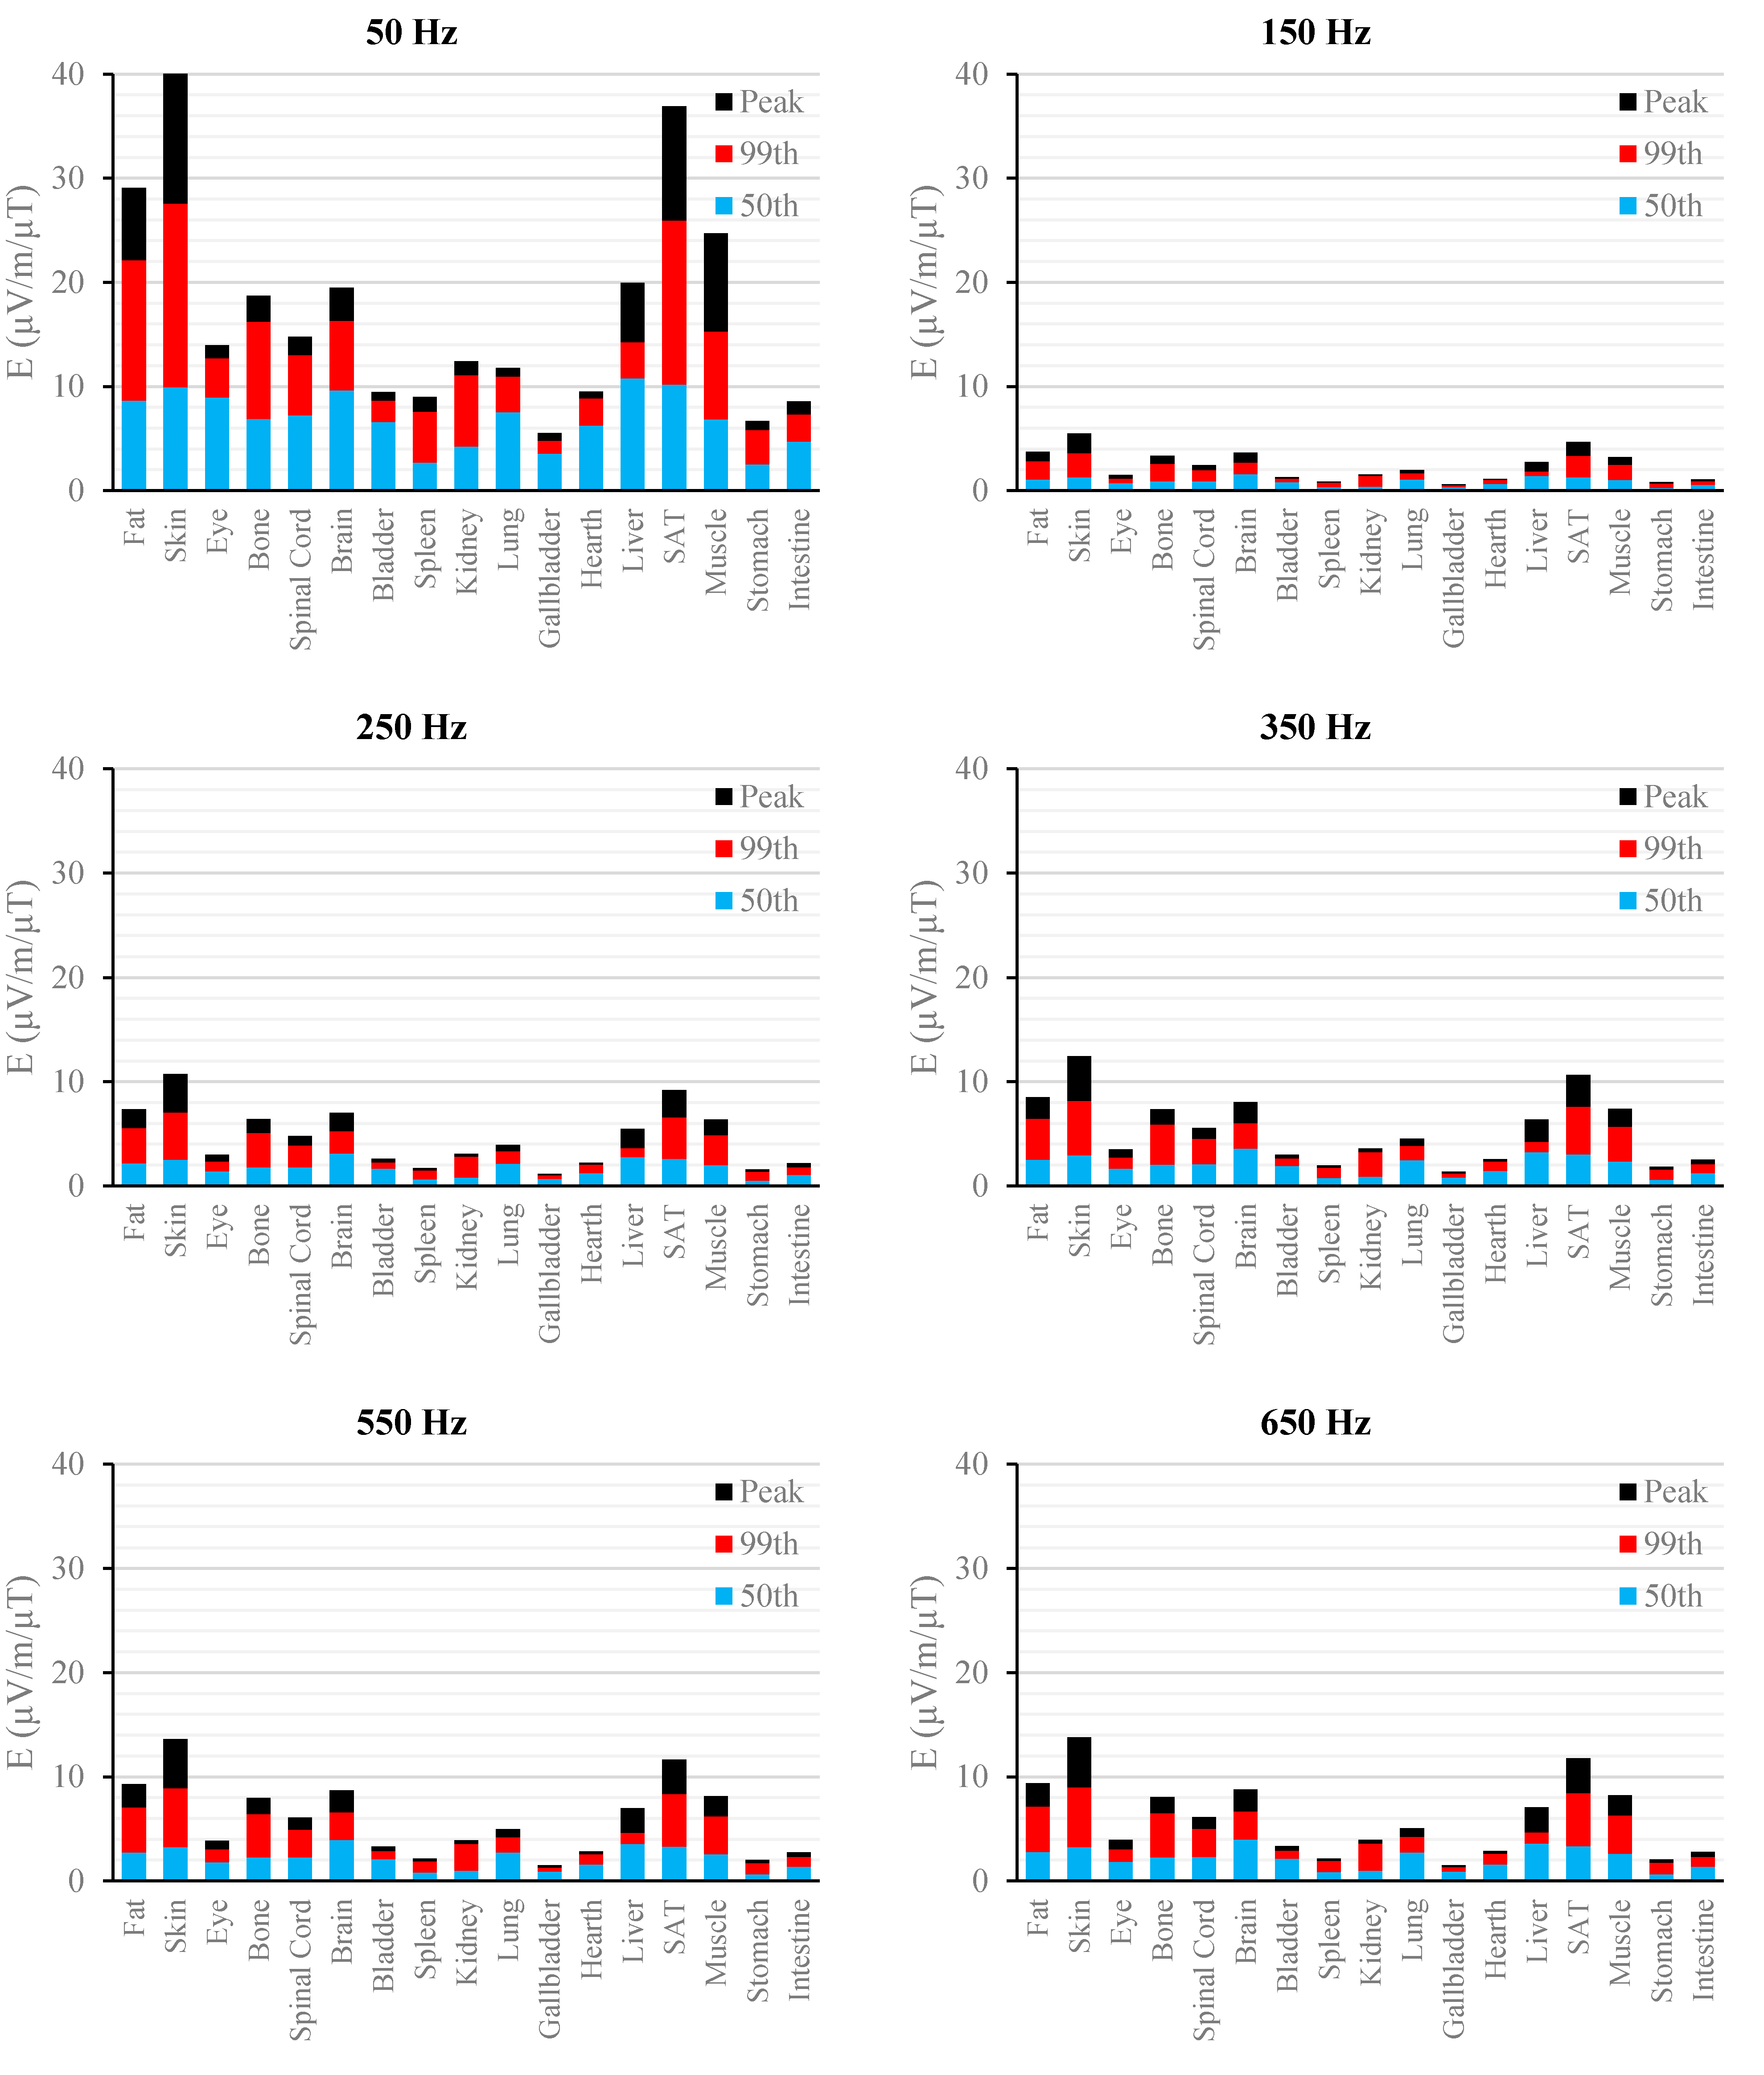
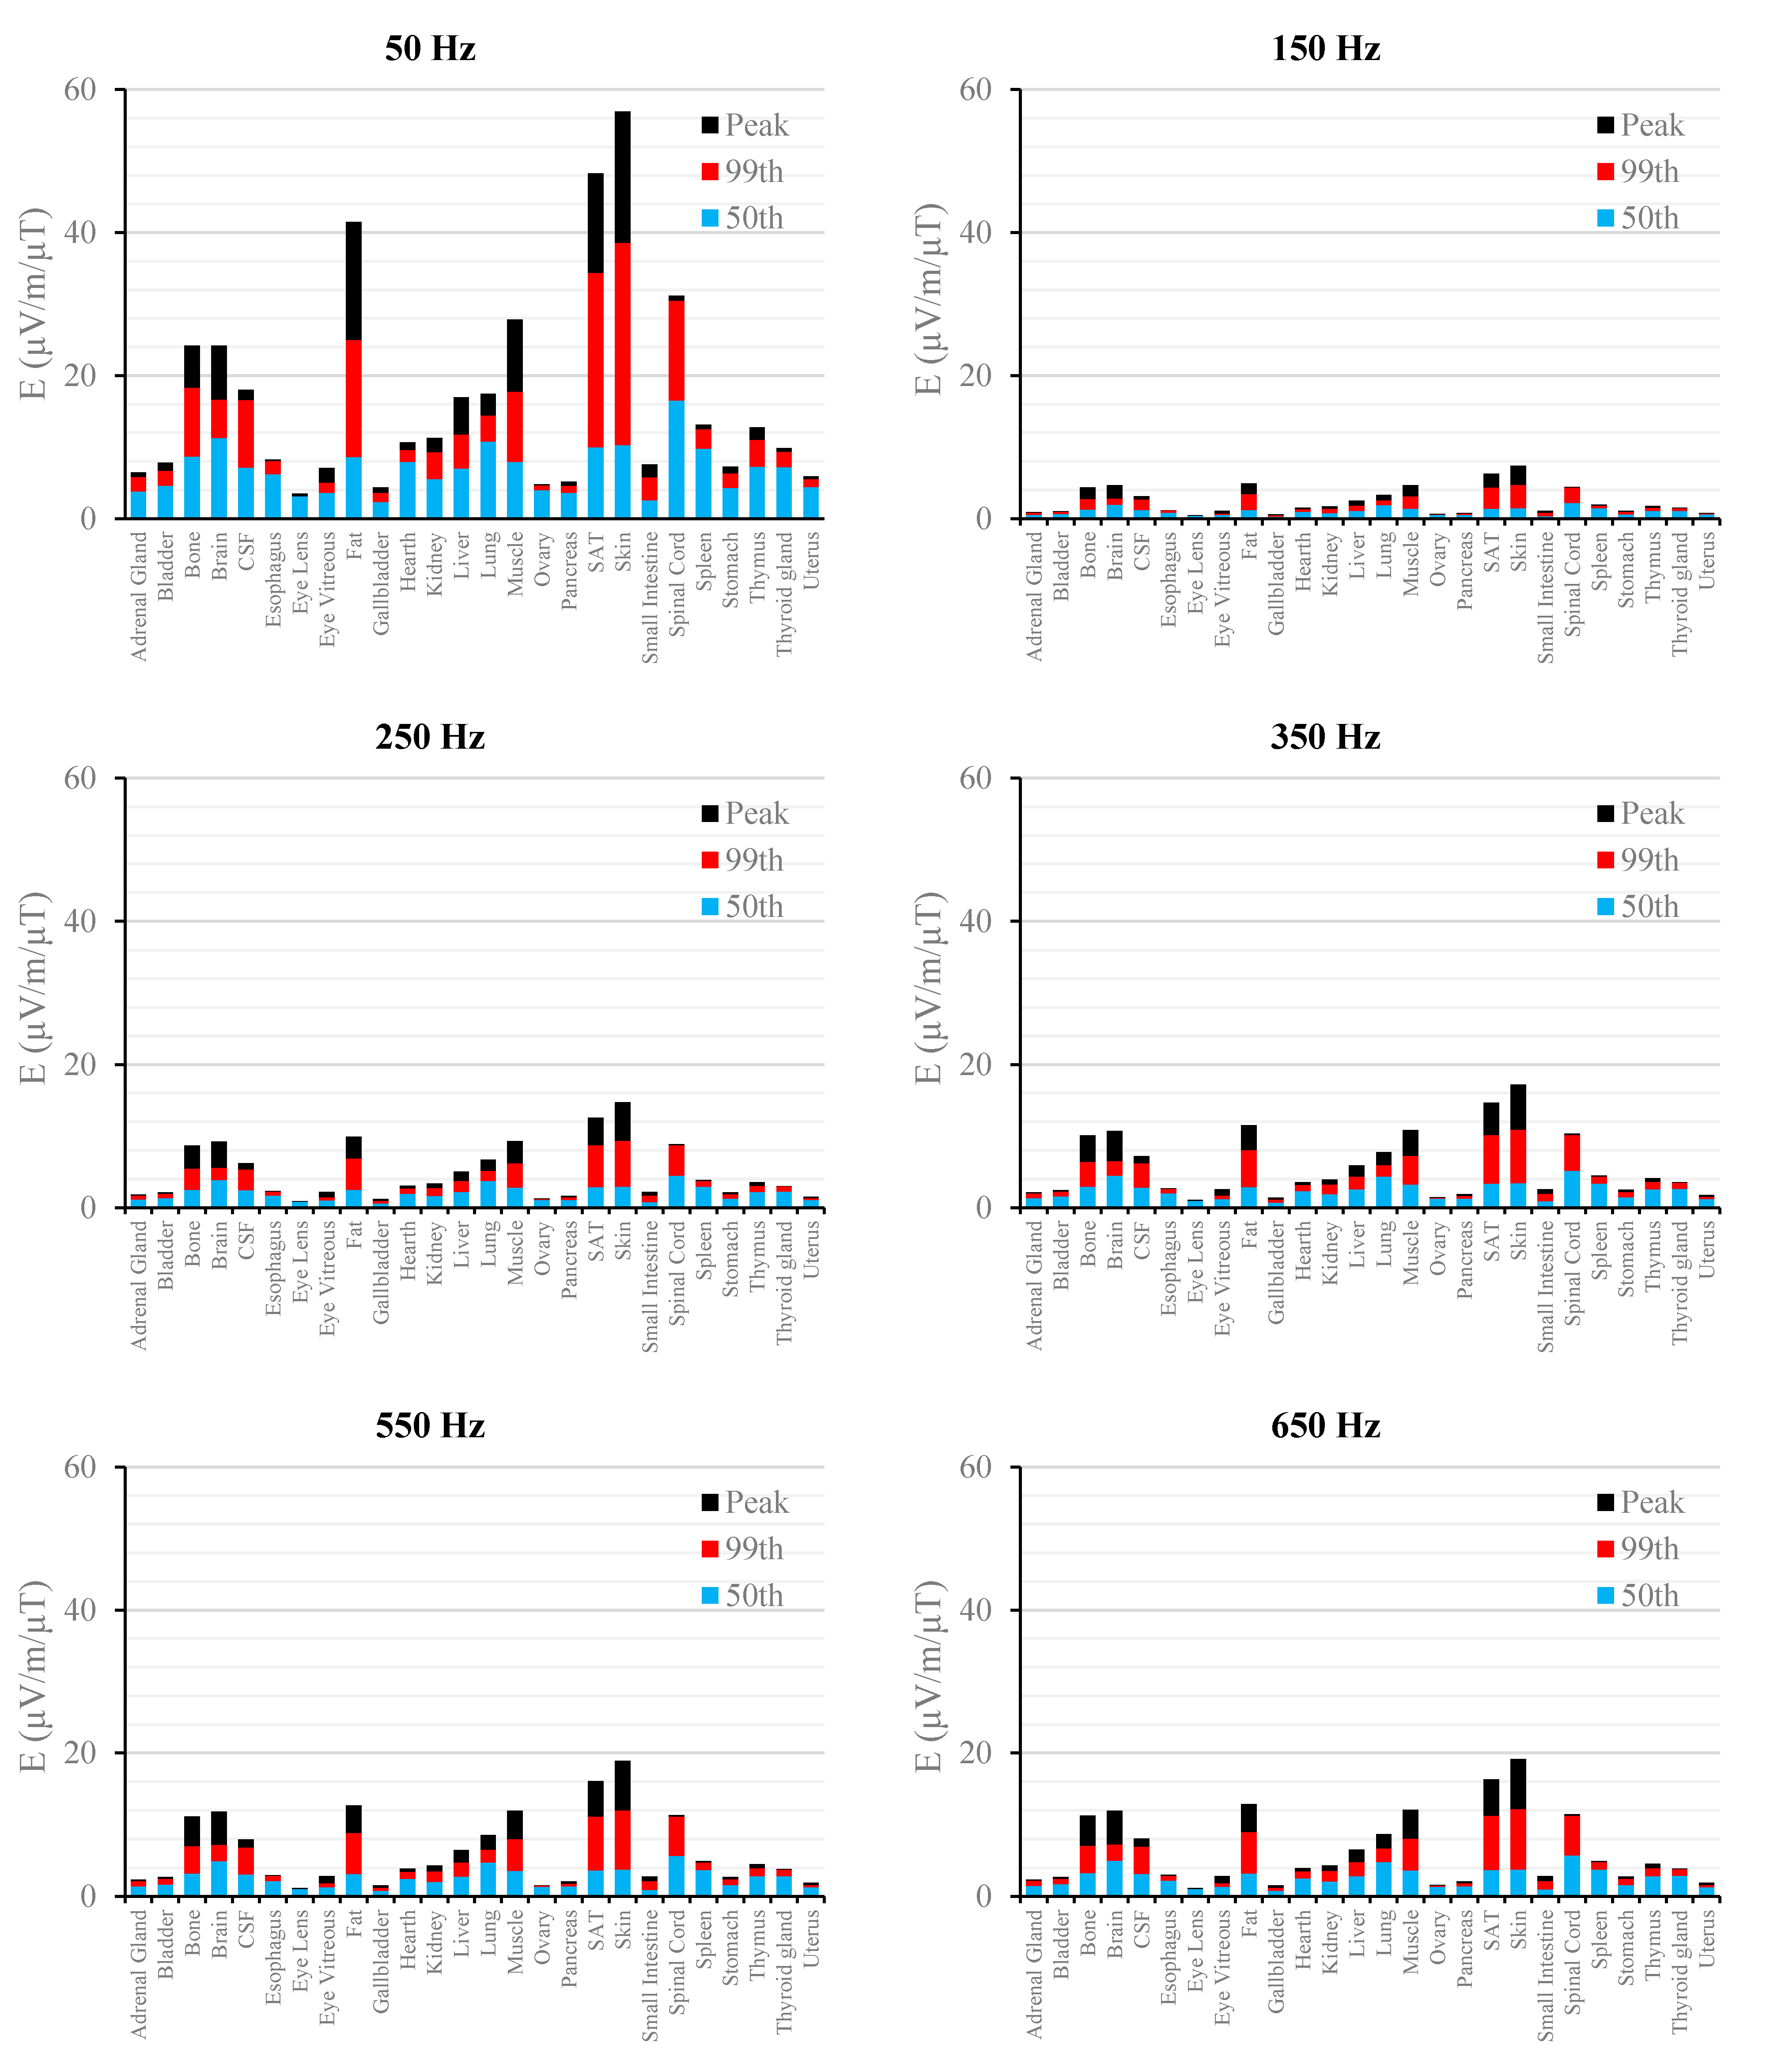
Figure 6.
E (μV/m) per μT of 50 Hz Bpeak induced in foetal tissues at 9 mGA for all the harmonic frequencies considering the standard EN 50160 for the LV&MV power supply networks. The bars indicate the E50th (blue), the E99th (red) percentiles and the Epeak (black) of each distribution.
Figure 6.
E (μV/m) per μT of 50 Hz Bpeak induced in foetal tissues at 9 mGA for all the harmonic frequencies considering the standard EN 50160 for the LV&MV power supply networks. The bars indicate the E50th (blue), the E99th (red) percentiles and the Epeak (black) of each distribution.
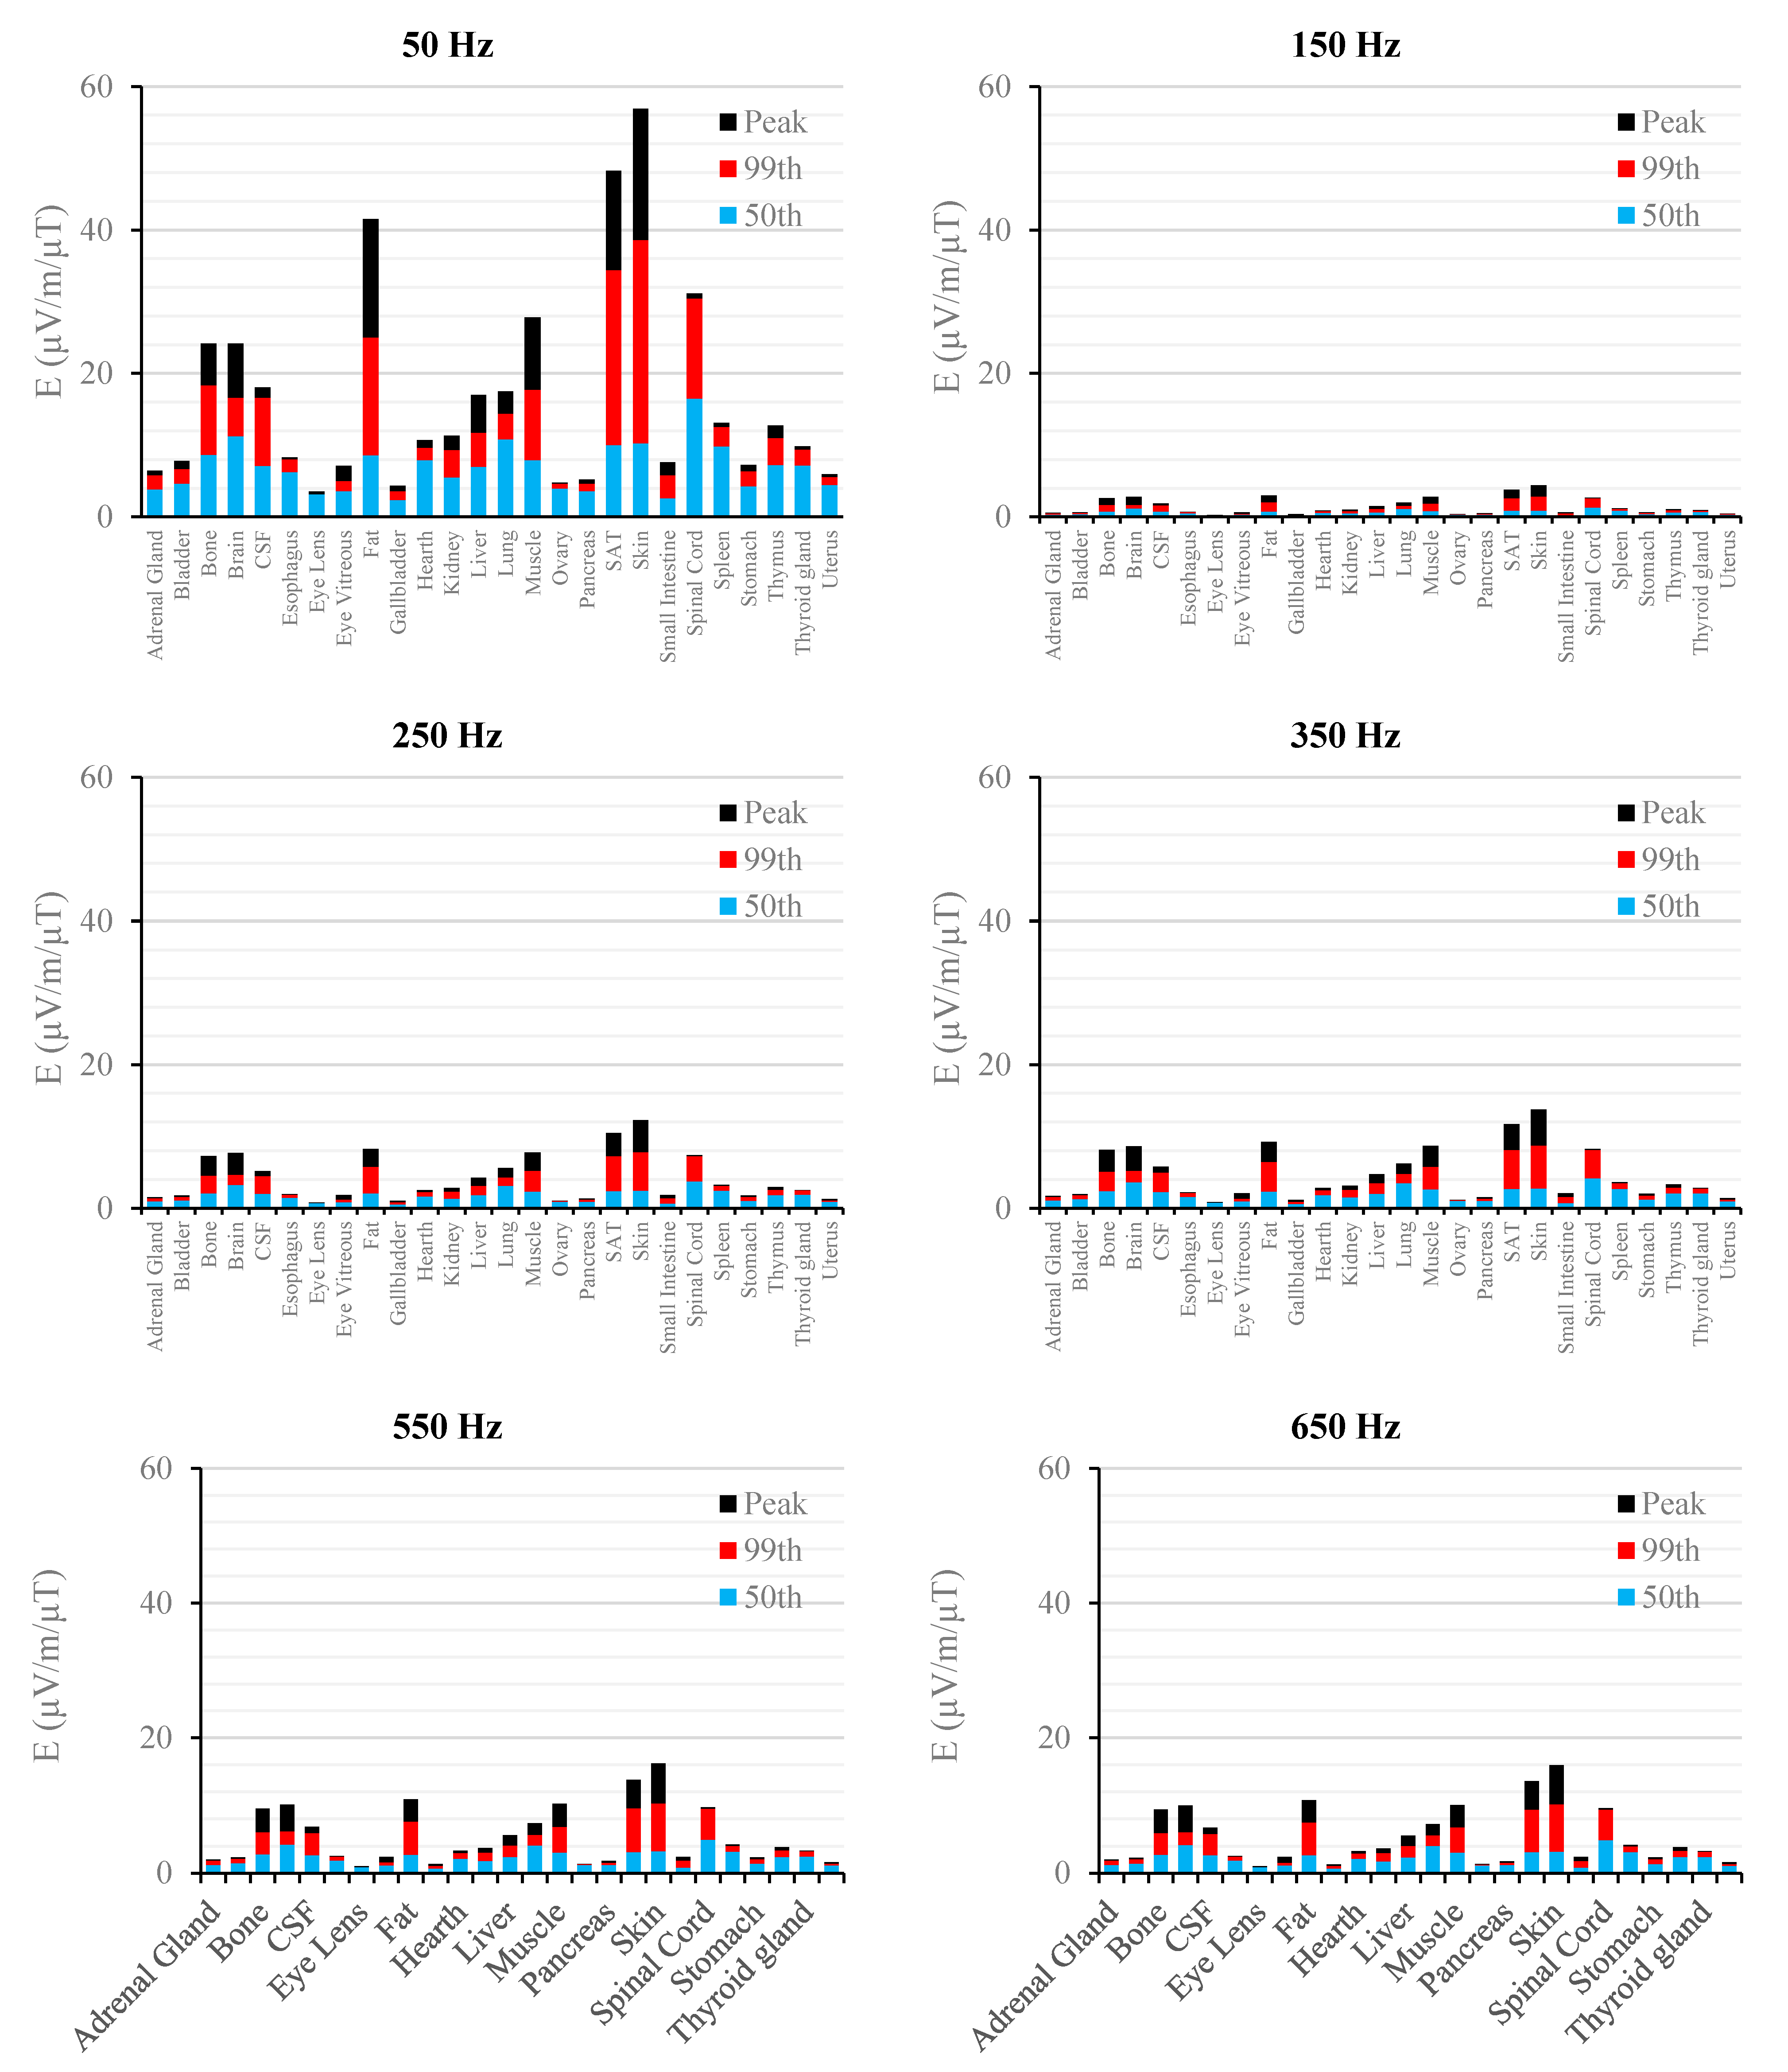
Figure 7.
E (μV/m) per μT of 50 Hz Bpeak induced in foetal tissues at 9 mGA for all the harmonic frequencies considering the standard EN 50160 for the HV power supply networks. The bars indicate the E50th (blue), the E99th (red) percentiles and the Epeak (black) of each distribution.
Figure 7.
E (μV/m) per μT of 50 Hz Bpeak induced in foetal tissues at 9 mGA for all the harmonic frequencies considering the standard EN 50160 for the HV power supply networks. The bars indicate the E50th (blue), the E99th (red) percentiles and the Epeak (black) of each distribution.
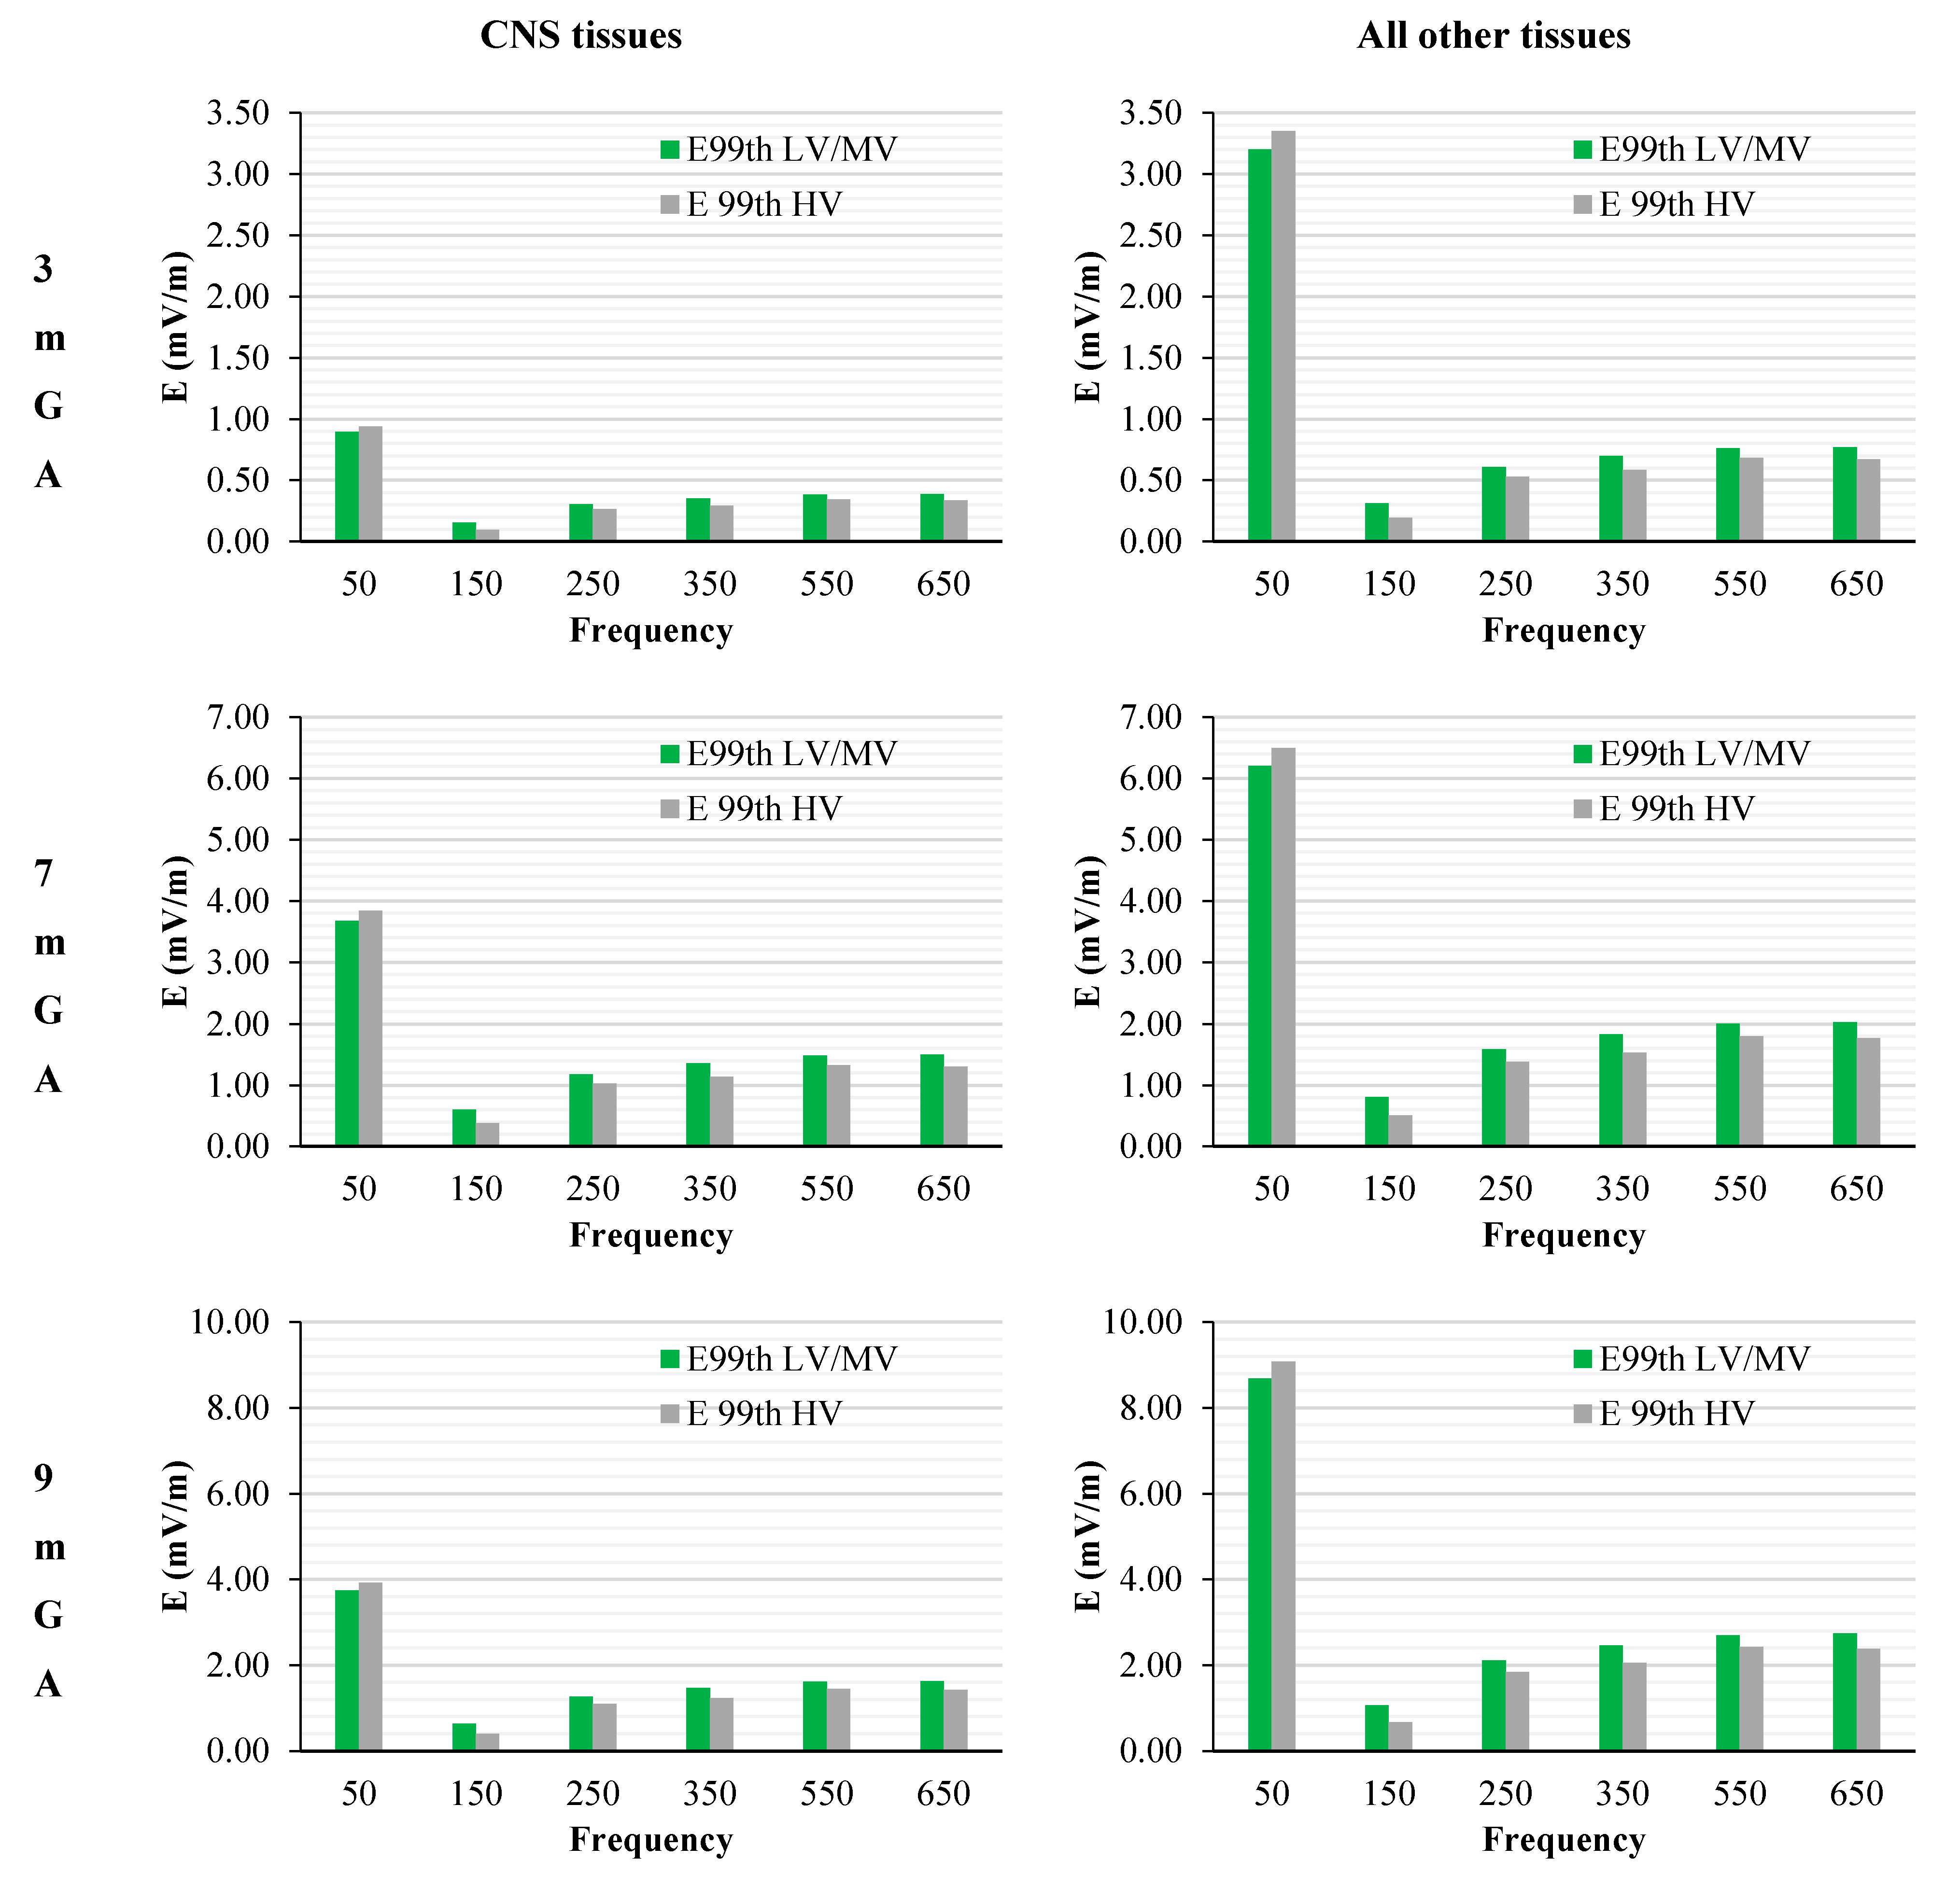
Figure 8.
E99th (mV/m) induced over CNS tissues (left) and all other tissues (right) at different GA as a function of the frequency of the component under investigation for the worst-case exposure (see the text for details). The green and grey bars indicate the two classes of networks identified by the EN 50160 standard, i.e., Low and Medium Voltage (LV & MV) and the High Voltage (HV) networks, respectively.
The peak of the electric field is always at the fundamental frequency of 50 Hz and increases progressively with the stage of pregnancy. In particular, it ranges from 0.94 and 3.92 mV/m over CNS tissues of the head and from 3.35 to 9.1 mV/m over all other tissues, passing from 3 mGA to 9 mGA, respectively. The maximum E
99th over the CNS tissues, for all frequencies and across all the GAs were found in the brain at all the GA (16.7 μV/m/μT; 50 Hz, 9 mGA). The maximum induced E
99th over all other tissues were found over fat (14.2 μV/ m/μT; 650 Hz), skin (27.6 μV/m/μT; 50 Hz) and skin (38.6 μV/m/μT; 50 Hz) for 3 mGA, 7 mGA and 9 mGA, respectively. As expected, the electric field levels at the fundamental components due to the HV electricity transmission networks are higher than those ones due to the LV&MV electricity distribution networks, whereas an opposite behaviour has been found for the harmonic components. The comparison with the exposure standards was also analysed in terms of maximum fraction of the Basic Restrictions proposed by the ICNIRP guidelines [
4], relative to both CNS tissues of the head and all the other tissues of the body, as described above. The results are summarized in
Figure 9.
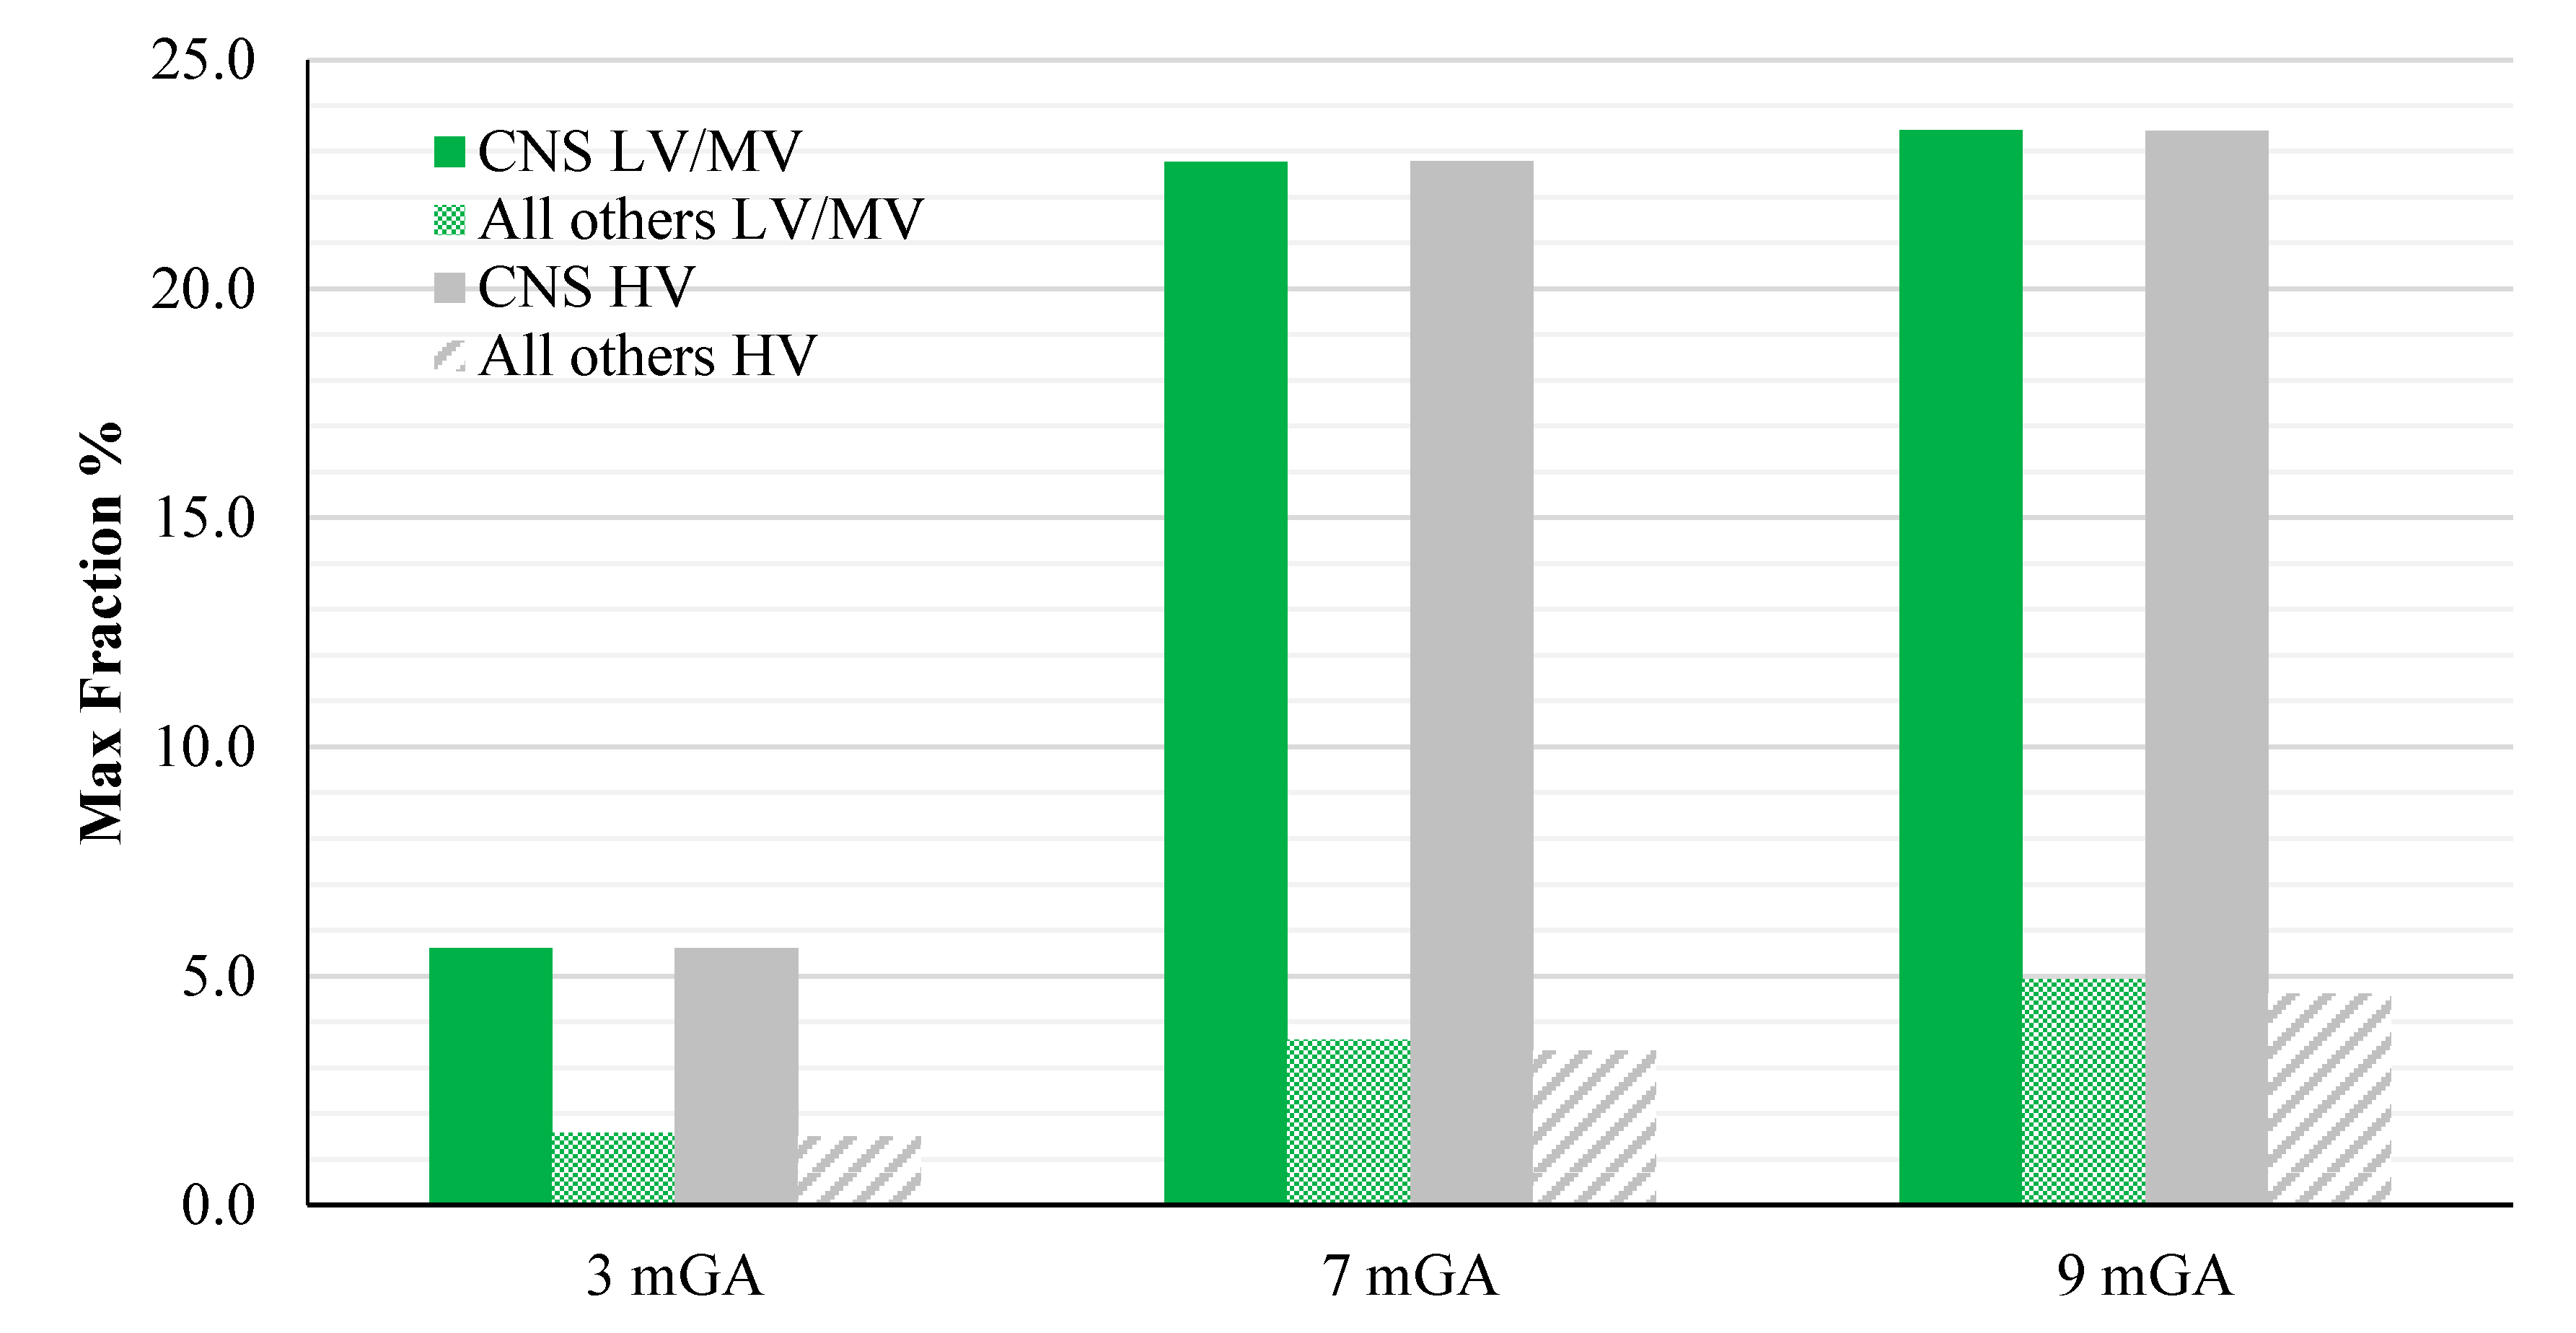
Figure 9.
Maximum fraction of the ICNIRP Basic Restrictions for general public on the E
99th for the CNS and all other tissues, exposed to a magnetic field at the reference level using the standard EN 50160 (B levels shown in
Table 4), at different GA.
Figure 9.
Maximum fraction of the ICNIRP Basic Restrictions for general public on the E
99th for the CNS and all other tissues, exposed to a magnetic field at the reference level using the standard EN 50160 (B levels shown in
Table 4), at different GA.
As one can see from this figure, all foetuses are exposed to levels far below the Basic Restrictions [
4] for both CNS tissues of the head and all other tissues and for both the classes of voltage characteristics of the networks. The highest value is the one related to the CNS tissues, where a maximum of about 23.5 % (at 9 months GA) of the Basic Restrictions for both the classes of networks considered has been found. Lower values have been found in the other tissues, with a maximum fraction of only the 5%.
4. Discussion and Conclusions
The main outcome of this study is to provide a full picture of the EMF exposure of three realistic models of foetus at different gestational ages to electricity transmission and distribution networks. In particular, the source of EMF is here modelled taking into account the maxima spectral harmonic characteristics of the networks as provided by the quality standard EN 50160. It is important to note that the exposure scenario modelled in this study is worse than the one due to a realistic power supply network. Indeed, the few data available in literature ([
34,
48,
49]) suggest that typically the prevailing harmonic is the fifth, with percentages ranging from 0.5 to 4.5% of the fundamental component. Moreover, the third and the seventh harmonics generally remain below 3% (see
Table 1 for comparison with the percentage used in this study) and the Total Harmonic Distortion (THD—defined as the ratio of the root mean-square of the harmonic content to the root-mean square value of the fundamental quantity, expressed as a percent of the fundamental) below the 5%. On the contrary, in this study the THD resulted of the 10% and 8% for LV & MV and HV networks (using with the percentages of
Table 1).
The first evidence coming from the analysis of the exposure to the full harmonic spectrum of the electricity transmission and distribution networks derives from the extremely low relative amplitude between the main component at 50 Hz and its harmonics (here ranging from 2.5% to 6.0%). Indeed, the induced electric fields due to the harmonic components are far lower than those ones induced by the main frequency at 50 Hz. As an example, in the foetal bone (one of the tissues considered of interest in leukaemia studies) and considering a source at the limit of the quality standard EN 50160 [
36] (
Figure 2,
Figure 3,
Figure 4,
Figure 5,
Figure 6 and
Figure 7), the relative percentages of 99th and the 50th of the induced electric field at the harmonic frequencies with respect to the fundamental are summarized in
Table 6.
Table 6.
Relative percentage of the E99th and E50th in the foetal bone at the harmonic frequencies with respect to the same quantities calculated at 50 Hz, for 3, 7 and 9 months GA, and for both the supply networks, when the harmonic content at the source was set according to the percentage provided by the standard EN 50160.
| Ebone, f /Ebone, 50 | 3 mGA | 7 mGA | 9 mGA |
|---|
| LV & MV | HV | LV & MV | HV | LV & MV | HV |
|---|
| f (Hz) | 99th (%) | 50th (%) | 99th (%) | 50th (%) | 99th (%) | 50th (%) | 99th (%) | 50th (%) | 99th (%) | 50th (%) | 99th (%) | 50th (%) |
| 150 | 10.6 | 11.6 | 6.4 | 7.0 | 16.0 | 13.0 | 9.6 | 7.8 | 15.1 | 14.6 | 10.2 | 11.0 |
| 250 | 20.8 | 23.4 | 17.4 | 19.5 | 31.3 | 25.7 | 26.1 | 21.4 | 29.9 | 29.1 | 28.2 | 30.5 |
| 350 | 24.1 | 27.4 | 19.3 | 21.9 | 36.2 | 29.8 | 29.0 | 23.9 | 34.8 | 34.0 | 31.4 | 34.1 |
| 550 | 26.4 | 30.2 | 22.6 | 25.9 | 39.5 | 32.7 | 33.9 | 28.0 | 38.2 | 37.3 | 36.9 | 40.2 |
| 650 | 26.7 | 30.6 | 22.2 | 25.5 | 40.0 | 33.1 | 33.3 | 27.6 | 38.7 | 37.8 | 36.4 | 39.6 |
Again, this strong reduction of induced fields with frequencies can be also seen when the characteristics of the sources are set also considering the limit of the exposure levels (ICNIRP reference levels [
4]) as shown in
Figure 8, where, across the gestational ages of the foetus, the electric field shows a reduction of about the 55% (comparing the 50 Hz exposure with the 650 Hz) when the CNS tissues are considered, and of about the 70% (76% for 3mGA), when the other tissues are considered. These results are confirmed both when the LV&MV and HV electricity transmission and distribution networks are examined, even though this latter shows in all cases lower levels of induced E. This is due to the higher restrictions posed on HV power lines by the regulation of the quality of the electricity, as reviewed in
Table 1.
As expected, the induced E increases with the gestational age. In more details, the average relative increase computed along the frequency of the E field in terms of E
peak, E
99th and E
50th, has been found of 2.3, 2.5 and 1.5, respectively passing from 3 to 7 months GA, and about 3.2, 3.4 and 2.2, respectively, passing from 3 to 9 months GA (
Figure 2,
Figure 3,
Figure 4,
Figure 5,
Figure 6 and
Figure 7).
As to the tissue dosimetry, the most exposed tissues (
i.e., tissue with the highest E
peak, E
99th), as expected, are also the most superficial ones for all GA and the frequencies considered (see in
Figure 2,
Figure 3 and
Figure 4, skin, fat, SAT, when segmented, and muscle). On the contrary, the most exposed tissues on average (
i.e., with the highest E
50th) strongly depend on the combination of foetal position and size and magnetic field polarization. At 3 months GA they are bladder, spinal cord, kidney and spleen, at 7 months GA brain, liver, skin and SAT, at 9 moths GA again brain, skin, SAT, lung and spinal cord. At 7 mGA, the maximum E
50th change position depending on frequency, passing from the liver (at 50 Hz) to the brain (at harmonic frequency); this is due the impact of the different choice of dielectric properties values (see Material an Methods section above) of these two tissues, which then affect mildly the whole electric field distribution. As for the whole-body electric fields, the levels of E
peak, E
99th and E
50th show an increasing trend with the stage of pregnancy. Looking specifically at the bone tissue, the increase with foetal growth is even more conspicuous, suggesting that the foetuses close to the birth are exposed to larger induced electric fields. In particular, on average, along frequencies, it is equal to about 3.4, 3.2 and 4.0 for E
peak, E
99th and E
50th, respectively passing from 3 to 7 months GA, and about 4.6, 3.4 and 5.7 for E
peak, E
99th and E
50th, respectively, moving from 3 to 9 months GA.
In parallel to these considerations, an example on how these data can be concretely used in the comparison with the Basic Restrictions of the ICNIRP guidelines [
4] was also given. The maximum fraction of 23.5% obtained considering together the fundamental component and the harmonics is similar with the one of the previous study [
33] (maximum fraction of 23.6%), which only addressed the foetus exposure to 50 Hz homogenous magnetic fields. This similarity is quite expected considering that the larger contribution to the magnetic field is due to the 50 Hz frequency component and the contribution to the maximum fraction of the harmonic components is counterbalanced by the progressive reduction of the limits of the CNS Basic Restrictions with frequency, which implies that higher-order harmonic components are less weighted. Furthermore, in the interpretation of the maximum fraction (suggested by ICNIRP 2010 [
4]), the phase relationship is not considered. This considerably overestimates the exposure, as shown by Leitgeb studies [
50,
51]. Those works found that many electric appliances emissions, characterized by complex frequency spectra of ELF magnetic field, exceeded ICNIRP reference levels up to almost two orders of magnitude. In these cases, and if the results here obtained will be used and therefore scaled to higher levels than the ICNIRP references, the existing ICNIRP spectral assessment rules are unnecessarily conservative and could lead to non-compliances. In those situations, alternative approaches should be adopted. The first alternative option to the spectral method would be to weight the external magnetic field and the induced electric field with a filter function which takes into account the fixed coherent phases angles of the field among harmonic frequencies, as suggested by [
4] and [
52]. Another approach, as suggested by [
50], is to apply a nonlinear biology-based assessment rule, derived taking into account the nonlinearity of cellular membranes behaviour, which weights the higher (>3rd) harmonics not proportionally to frequency but with more appropriate contributions.
Finally yet importantly, the results of this study, as for any result obtained from computational assessment studies, are affected by a variable degree of uncertainty. Liorni and colleagues [
33] discussed the uncertainty budget related to the estimation of the induced E in pregnant women exposed at 50 Hz. They found a maximum expanded uncertainty of 2.03 dB in foetal SAT for E
peak and 0.3 dB in foetal skin for E
99th. Considering the linearity of E with frequency (up to 650 Hz) discussed above, the results of Liorni and colleagues apply also in this study.
Besides that, the major source of uncertainty linked to the results of this study is the representativeness of the pregnant woman models and the tissue parameters of the whole population included in the process of risk assessment.
To this purpose, the accuracy of the fetal anatomy was already discussed by [
53] where some physiological and anatomical reference data of fetuses at different gestational ages were compared with the same data of the models used.
As to the dielectric properties, the main source of uncertainty is given by the intrinsic variability due to the tissue inhomogeneity and to the large difference in tissues structure and composition. The measurement of the dielectric properties of foetal tissues here used, have been performed by Gabriel and colleagues [
54], who observed a variability ranging from 3 to 15%, with a peak of 25% for skin and skull tissues. Moreover they also stated that, in view of the large measurements performed per tissues, the total standard uncertainty is significantly lower than those percentages.
Other considerations and uncertainty assessment relative to the pregnant woman models are discussed in [
33,
39,
53,
55]. Even if these studies examined the uncertainty in the results of localized sources, the conclusions held also for the whole body exposure, since the uncertainty is certainly lower; this is due to the minor impact of dielectric properties and source and foetal position variability to the total budget uncertainty, as discussed in [
39].
In conclusion, this study showed that in the exposure to the magnetic fields generated by electricity transmission and distribution networks, the harmonic components add some contributions to the overall level of the electric field induced in foetal tissues. However, although these contributions increase with frequency and cannot be neglected, their amplitude is low, due to the extremely low permitted amplitude of the harmonic components with respect to the fundamental one, even in the worst-case scenario here considered. The levels of the electric field in the foetus tissues are also extremely lower than the limits suggested by the ICNIRP 2010 guidelines [
4] for general public exposure, when the amplitude of the incident magnetic field is set at the maximum permitted level by the guidelines themselves.


