1. Introduction
In the last decades, planet Earth has been warming up and it is clear that human activities have affected the weather and the balance of the planet’s natural cycles. [
1] Weather phenomena depend on a number of factors that interact in complex ways, in contrast to the traditional notion, which is the set of variables that impact directly the way the atmosphere restructures itself with a series of interactions that occur with the sea and continents in different time and spatial frames. The costs of global warming arise from high temperatures produced by continuous damage to the environment, caused by sudden events in terms of climatic catastrophes [
2]. The inherent problem is that there is considerable uncertainty associated to these two types of events [
3]. Since global warming is a very complex problem and its signs are sometimes difficult to see, there is without a doubt a high level of uncertainty among population about the existence of global warming.
Mexico is among the 70 countries with greater Greenhouse Gas Emissions (GGE)
per capita, because it produces 0.96 tonnes of carbon dioxide every year that go into the atmosphere; 30.5% of the emissions are directly involved in activities of soil usage change and deforestation [
4]. In this respect, animal and vegetal species, as yet endangered because of human activities, will be also endangered because of Climatic Change (CC).
Due to its geographic location and complex landscape Mexico is one of the countries with greater species diversity. Besides, many of the species in this country are endemic [
5]. In the state of Chihuahua half of the ecosystems are arid and semi-arid zones. The potential of these zones has to be evaluated for a proper resource management, since these ecosystems are fragile and have a slow restoration [
6].
The Chihuahua desert is, biologically speaking, one of the richest in the World. It covers an approximate area of 391,046 sq. mi., and approximately 30% of cacti species grow in this desert [
5]. Cacti are important because of their endemism and their wide distribution in the American continent [
7]. The cacti family, known collectively as cactus or cacti, is one of the most typical groups of succulents and most of them have spines [
8]. Out of the total that exist in Mexico, about 35% have a risk status, and the Northwest region of the country houses the higher diversity and endemism, unfortunately this diversity is threatened due to man’s activities [
6]. Cacti may be exploited in different ways, including as hedges and as cattle food, however their most common usage is as ornamental plants and as part of the human diet.
Tellez-Valdez and Davila-Aranda say that ecological niche modeling allows for the analysis of factors associated with different populations of a particular species with different degrees of impact [
9]. The information that was analyzed by algorithms enables the projection in the geographical level of the potential area covered by the species. The results of the spatial studies may provide critical information about the diversity present on certain geographic areas and they can be used for different purposes, such as assessing of the current state of plant species conservation or prioritizing conservation areas [
10].
There are general factors that affect species distribution: temperature, water availability and topography. More particularly they can be described as soil types, evapotranspiration, light quality or days with temperatures below the freezing point, among others [
11]. It is important to know that niche modeling represents an approximation of the species’ ecological niche in the dimensions in the environmental crusts used [
12].
There are modeling efforts where the MaxEnt program was applied, including those by Carroll who evaluated and modeled with the relations that exist between weather and vegetation variables, concluding that MaxEnt has a good performance in contrast with 15 alternative methods in a wide taxa variety in different regions. The variables measured were temperature and precipitation, provided for the three simulations of the future climate during two time periods (2011 to 2040 and 2061 to 2090) [
13].
Colombo and Joly [
14] worked on a zone in the Atlantic Forest. The data about species distribution were taken from Oliveira and Scudeller and Martins [
15,
16], who compared more than 100 lists of tree species, and 38 were selected for which there were not enough data about their current distribution. The selected variables were slope, diurnal temperature range, average annual precipitation and vapor pressure (annual averages 1960–1990). Regarding to future scenario projection, CC crusts were used for the next 50 years (IPCC 2001) and the same data for topographical issues, taking into account the little possibility of topographical changes in the next 50 years. It was concluded that all the MaxEnt projection models on the current area covered by the 38 species, present a high significance level (binomial test: two ratios,
p < 0.05 for all species). Based on the above, the objective of the research reported herein was to evaluate the impact of the climate change on the geographical distribution of four cacti species found in the state of Chihuahua.
3. Results and Discussion
The data presented in
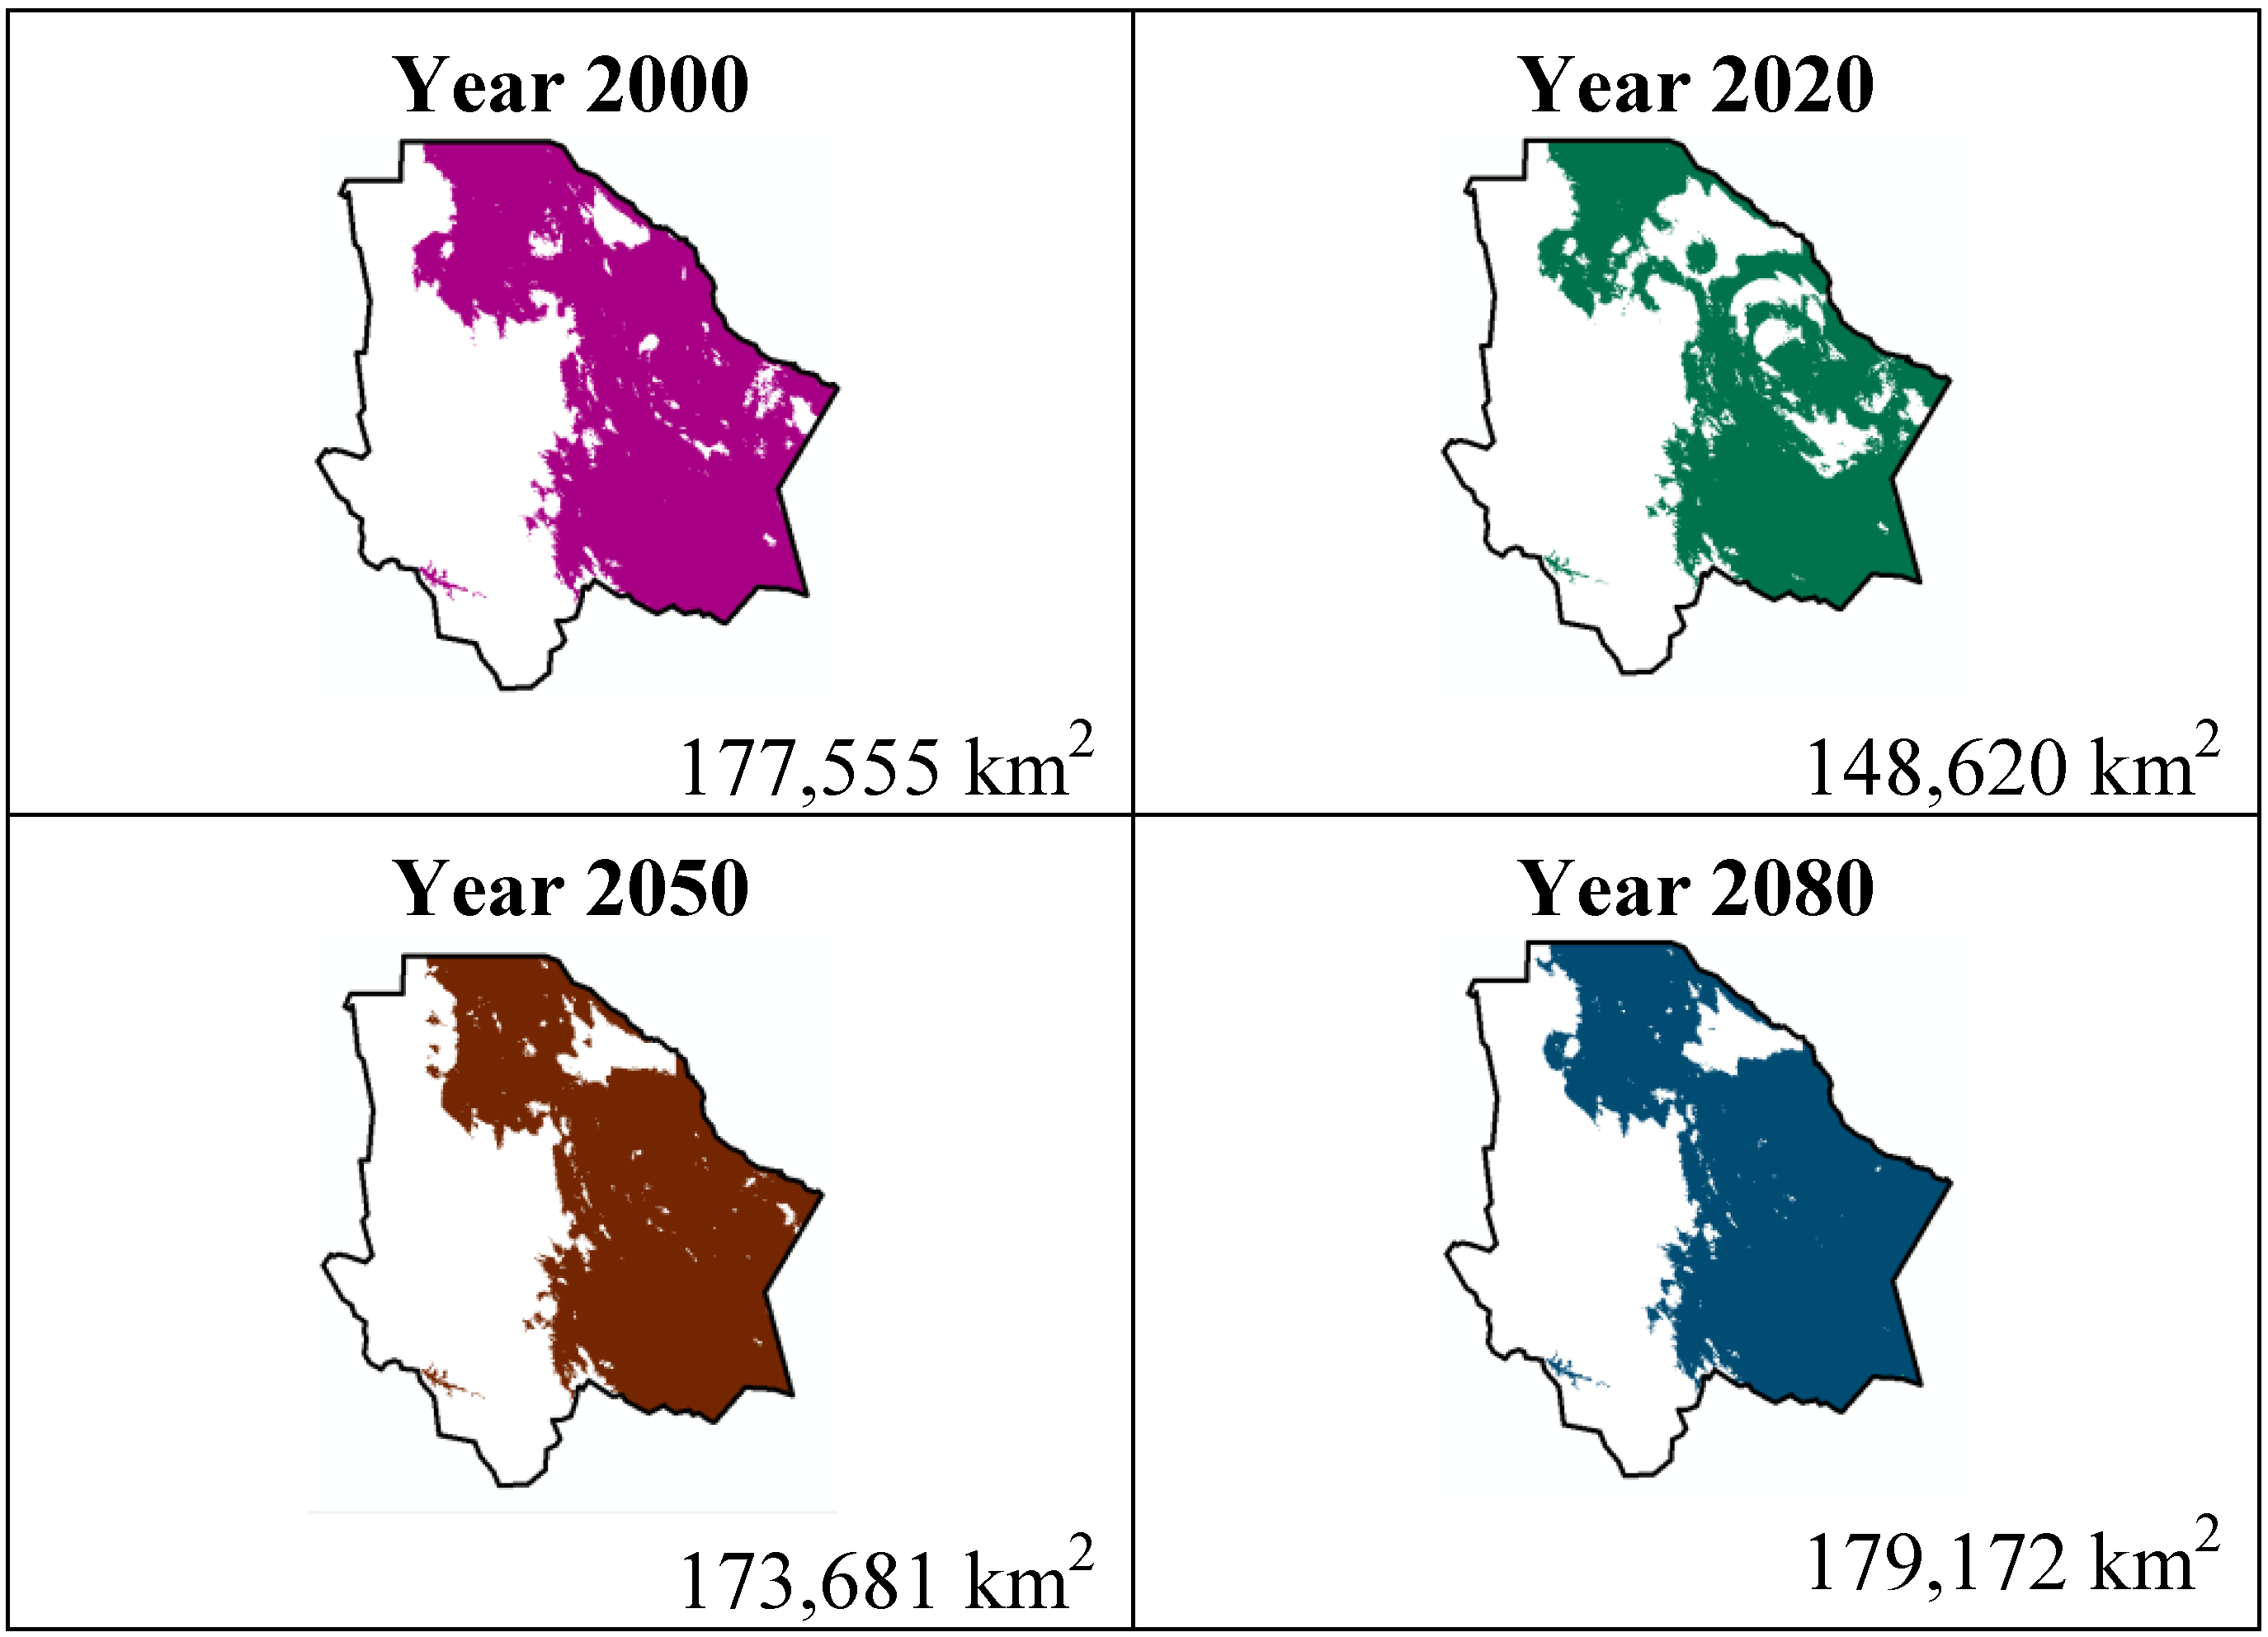
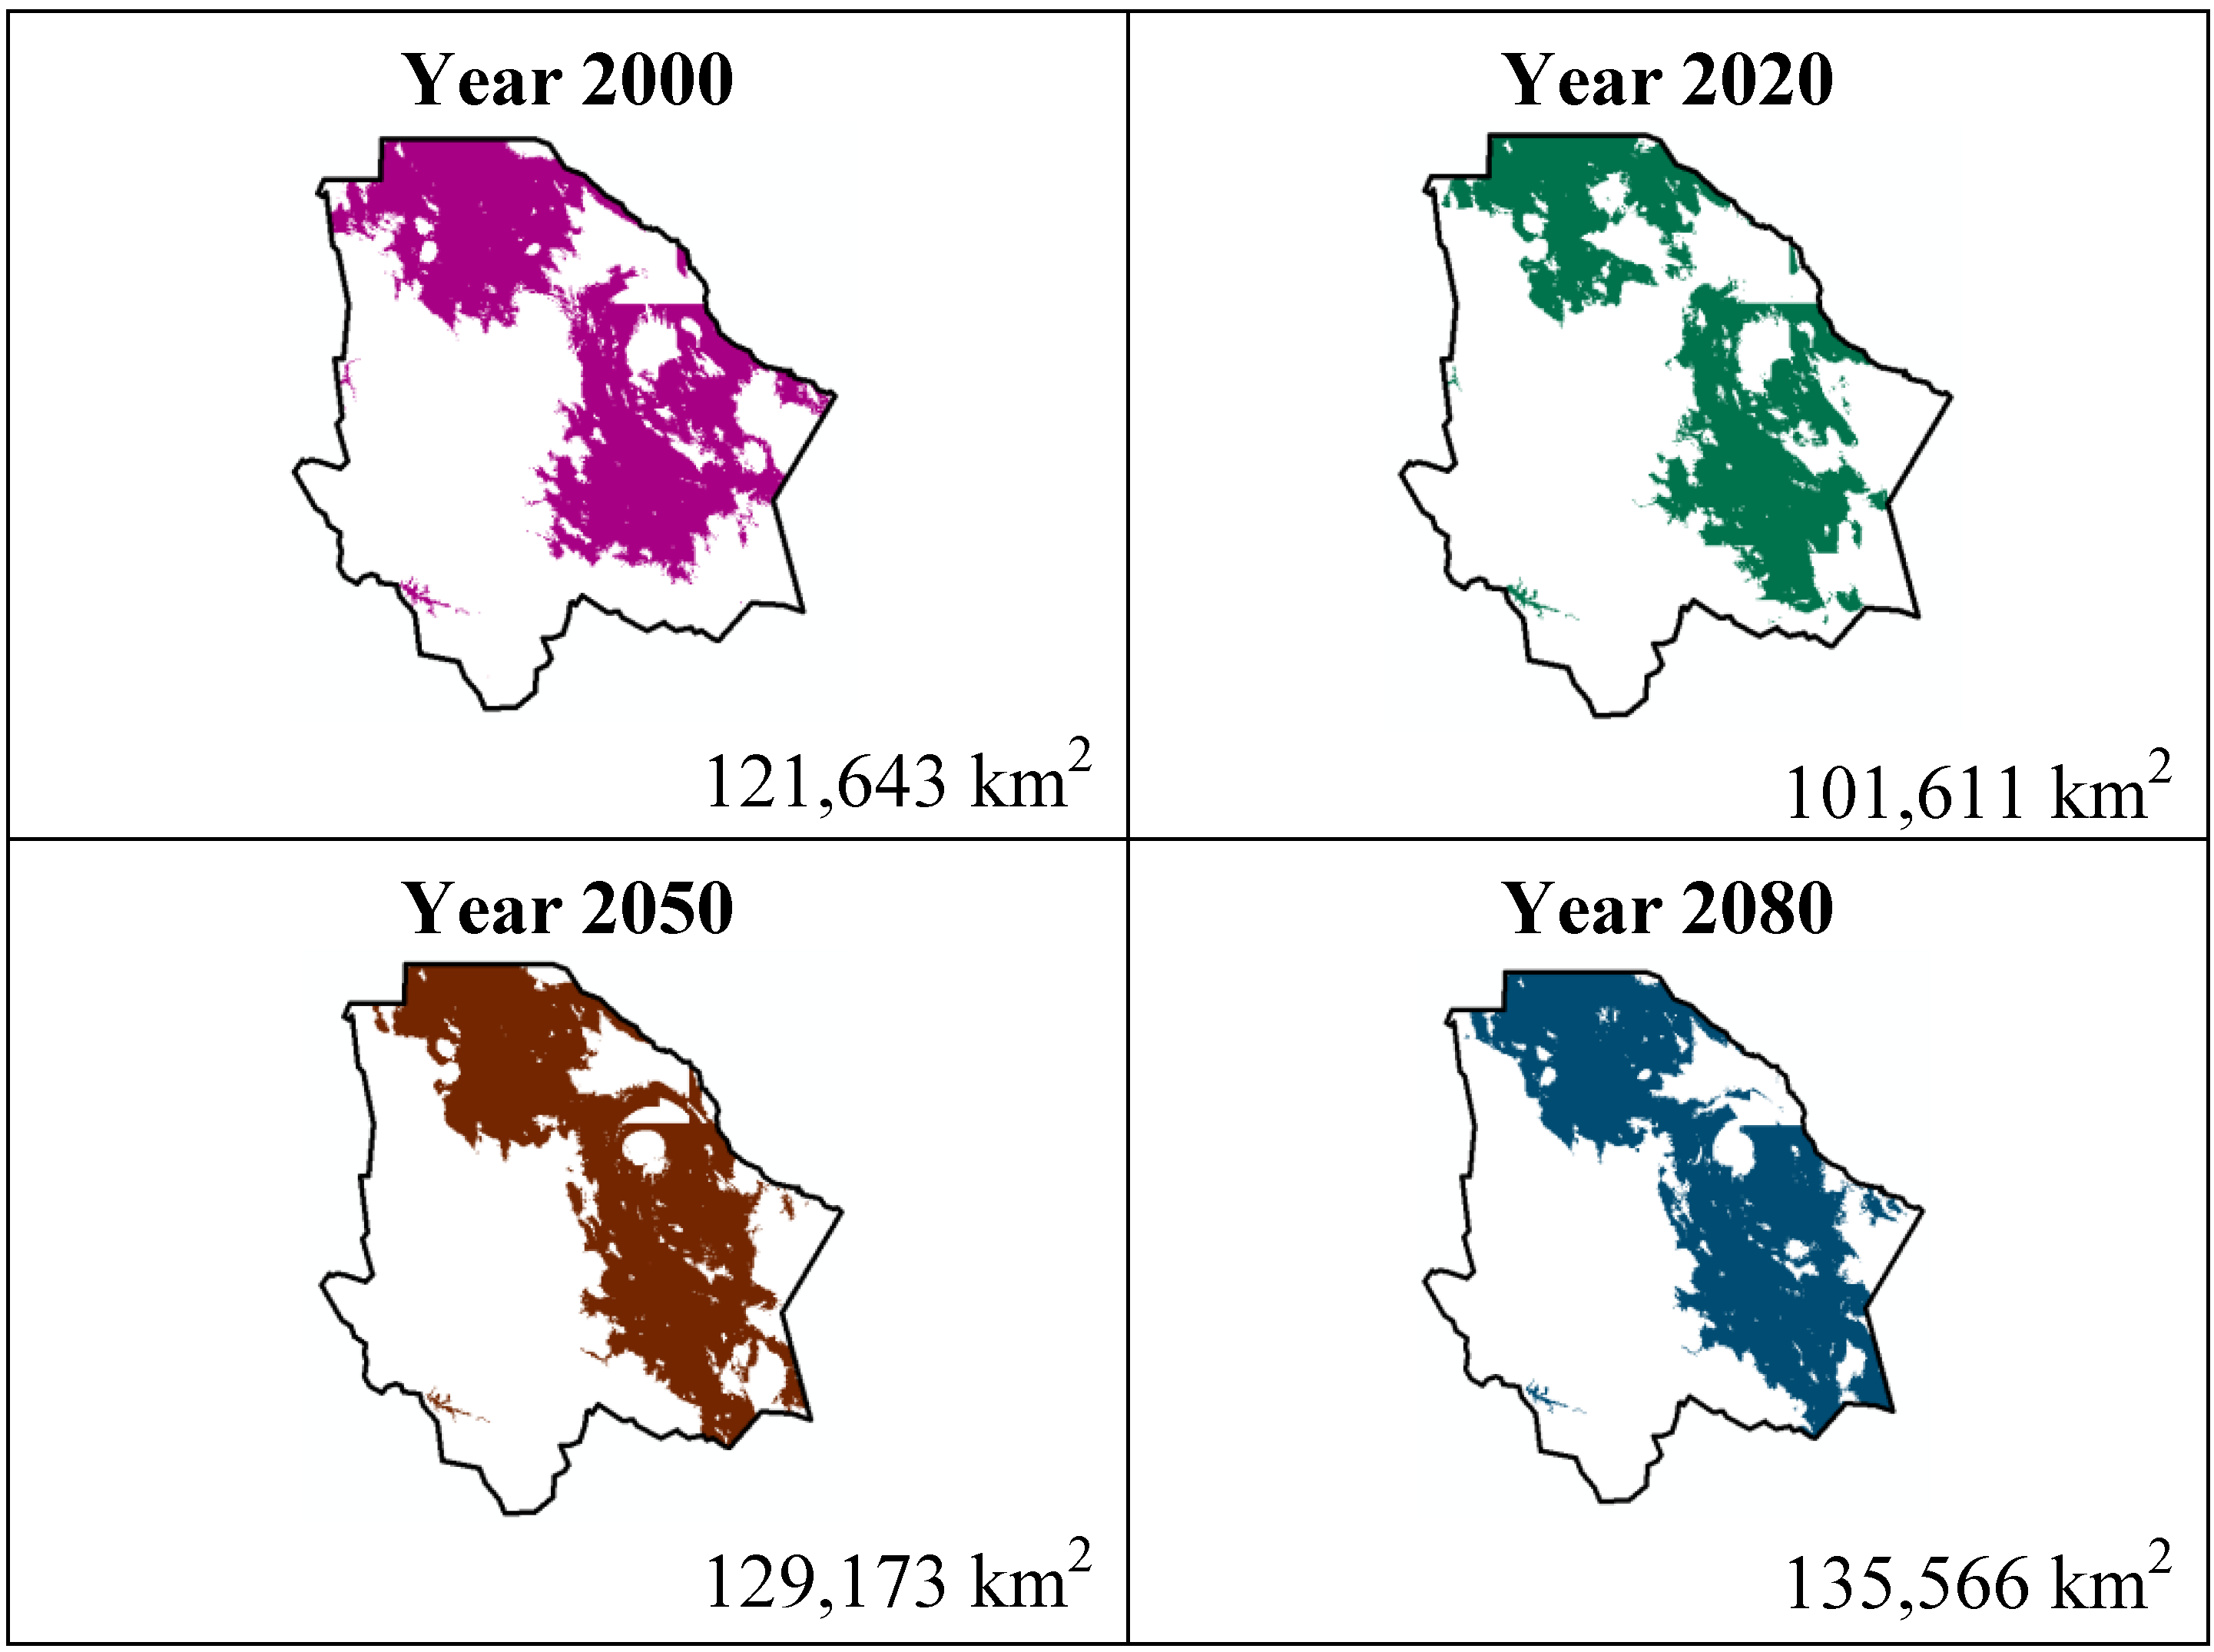
Table 1 show the results from MaxEnt modeling. It is observed how the four cacti species will be located on scenario A2 (
Figure 1,
Figure 2,
Figure 3 and
Figure 4), with a decrease in relation to the potential area by the year 2020. This decrease can be taken as non-significant for the
Coryphantha macromeris and
Mammillaria lasiacantha species because in the years 2050 and 2080 they have a major increase in their potential area that in the case of
Coryphantha macromeris is larger than it is currently.
Table 1.
Current and future Potential Areas of the species in km2.
Table 1.
Current and future Potential Areas of the species in km2.
| Scenario | A2 | B1 | A1B | A2 | B1 | A1B |
|---|
| Coryphantha macromeris | Mammillaria lasiacantha |
| 2000 | 121,643 | ND | ND | 177,557 | ND | ND |
| 2020 | 101,611 | 126,127 | 107,183 | 148,620 | 175,365 | 180,743 |
| 2050 | 129,173 | 100,073 | 78,228 | 173,681 | 170,489 | 123,352 |
| 2080 | 135,566 | 112,298 | 138,631 | 179,172 | 174,472 | 157,051 |
| Echinocereus dasyacanthus | Ferocactus wislizenii |
| 2000 | 134,720 | ND | ND | 85,531 | ND | ND |
| 2020 | 131,951 | 147,397 | 128,736 | 86,285 | 79,520 | 67,551 |
| 2050 | 130,401 | 137,911 | 130,518 | 86,883 | 65,355 | 80,185 |
| 2080 | 127,423 | 136,181 | 33,789 | 90,957 | 75,627 | 78,144 |
Figure 1.
Potential distribution models (MaxEnt) for Coryphantha macromeris considering a liberal A2 temperature climatic scenario (current, 2020, 2050 and 2080).
Figure 1.
Potential distribution models (MaxEnt) for Coryphantha macromeris considering a liberal A2 temperature climatic scenario (current, 2020, 2050 and 2080).
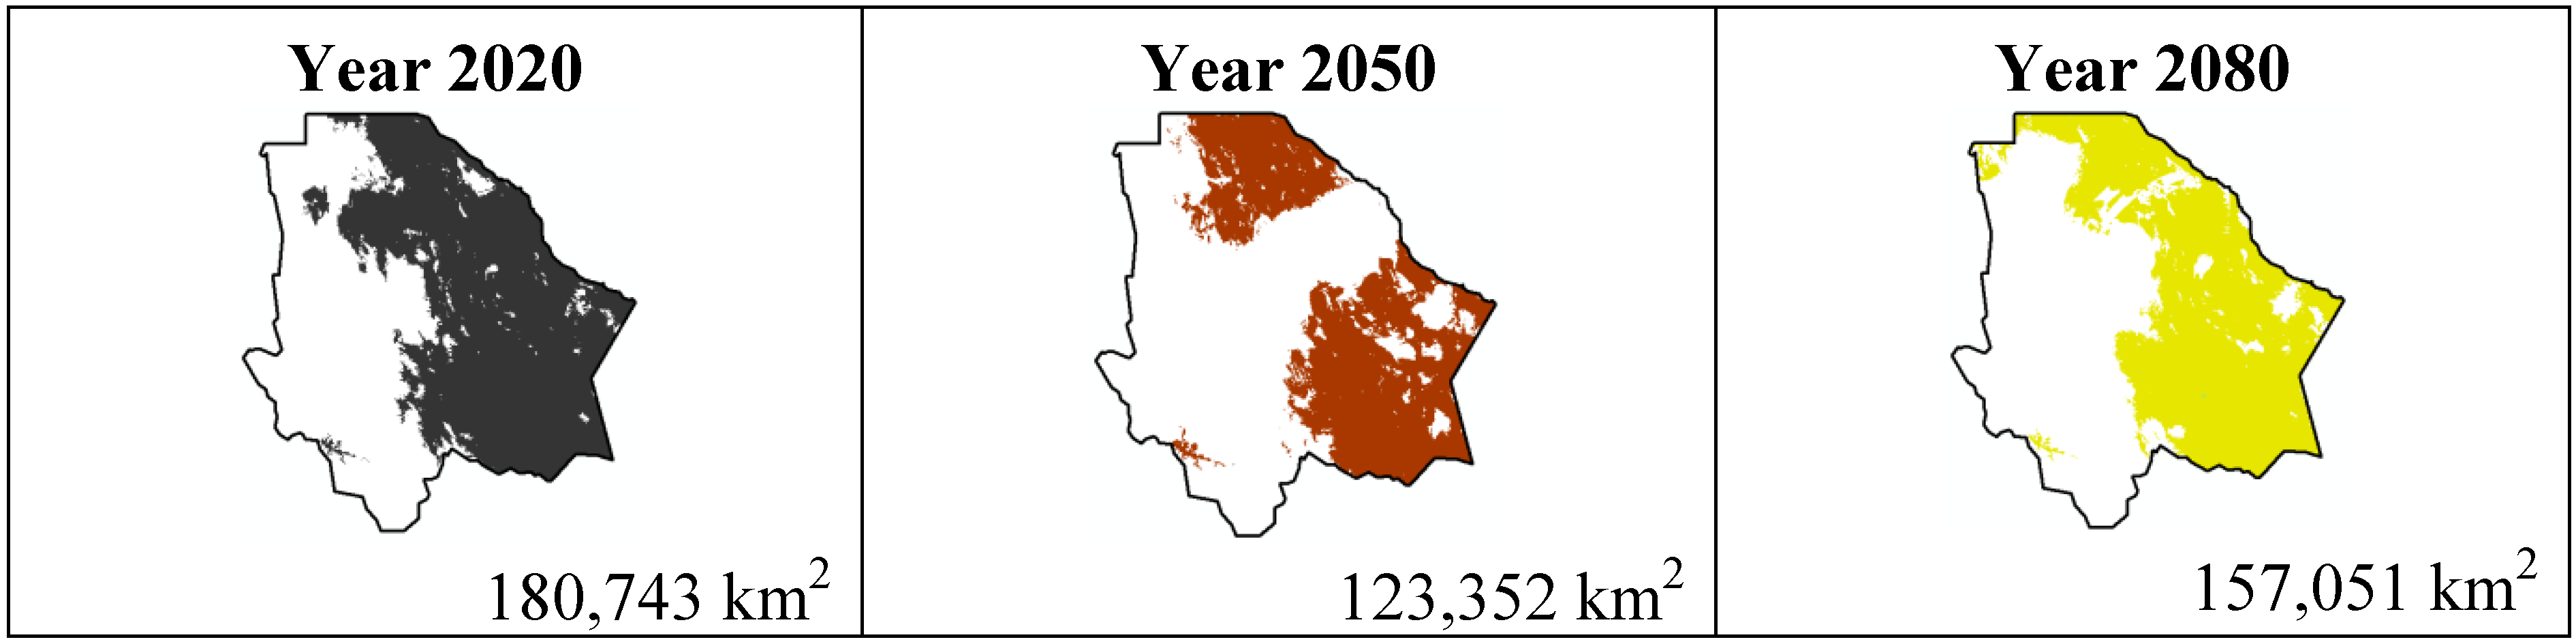
Figure 2.
Potential distribution models (MaxEnt) for Mamillaria lasiacantha considering a liberal A2 temperature climatic scenario (current, 2020, 2050 and 2080).
Figure 2.
Potential distribution models (MaxEnt) for Mamillaria lasiacantha considering a liberal A2 temperature climatic scenario (current, 2020, 2050 and 2080).
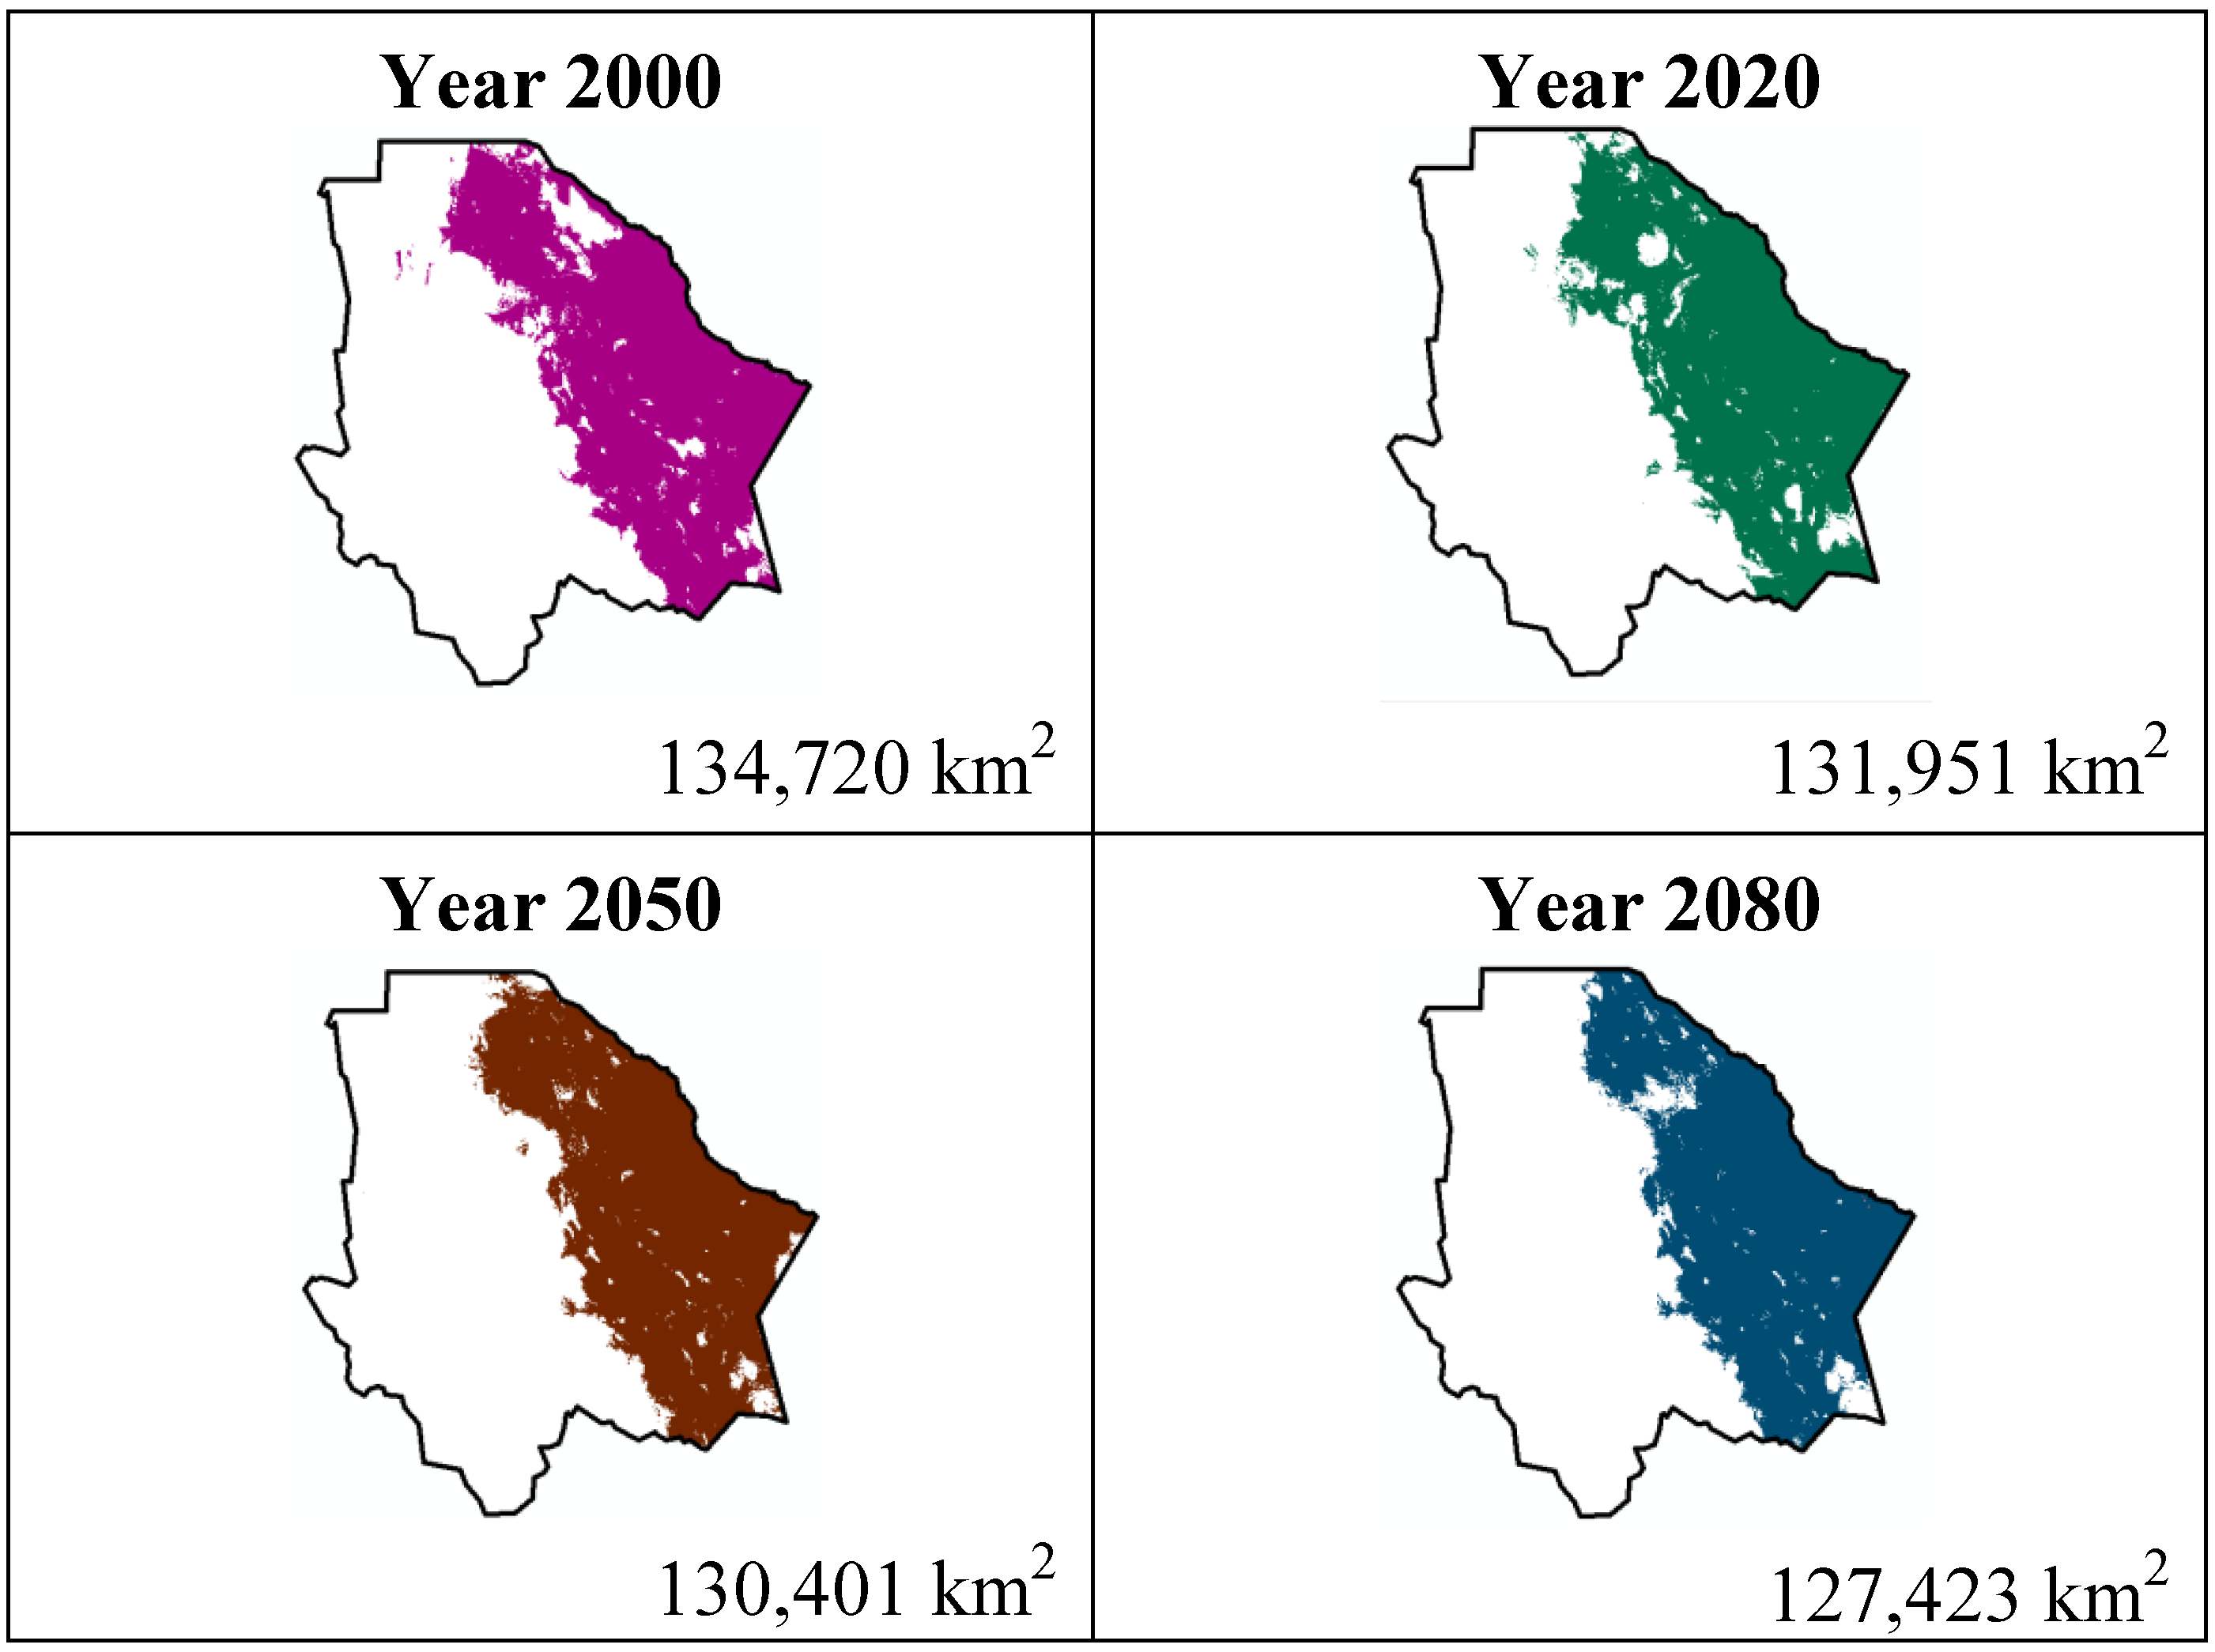
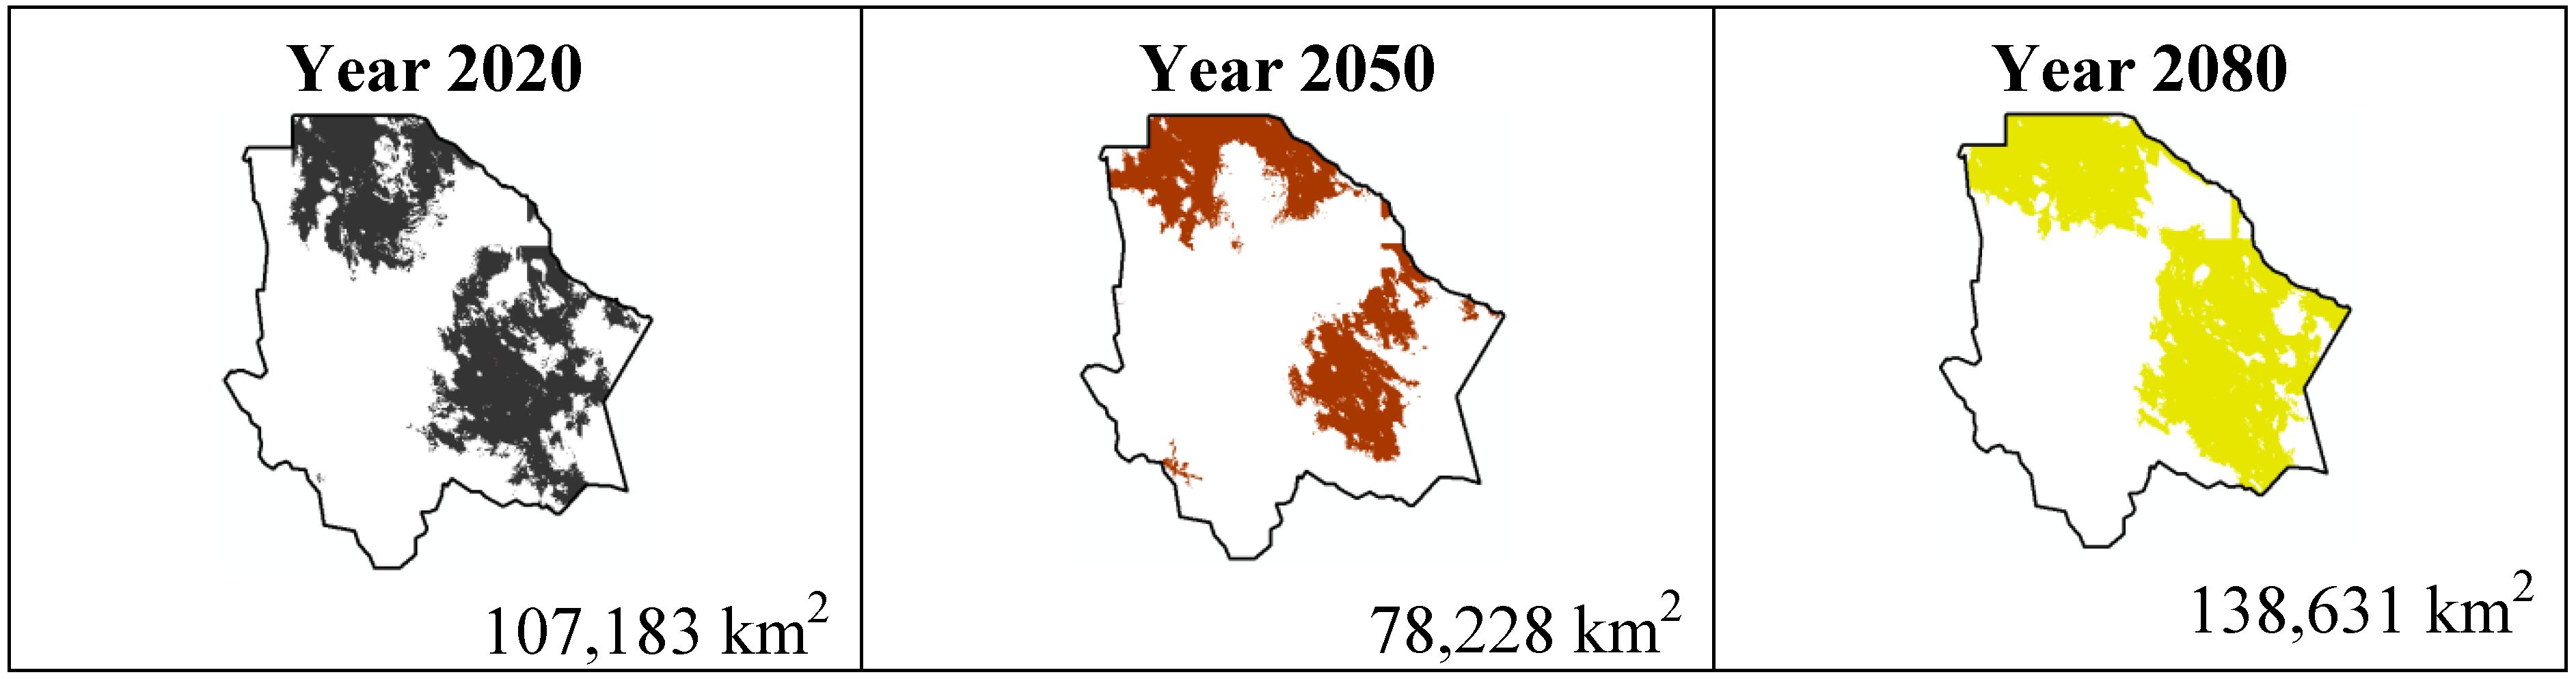
Figure 3.
Potential distribution models (MaxEnt) for Echinocereus dasyacanthus considering a liberal A2 temperature climatic scenario (current, 2020, 2050 and 2080).
Figure 3.
Potential distribution models (MaxEnt) for Echinocereus dasyacanthus considering a liberal A2 temperature climatic scenario (current, 2020, 2050 and 2080).
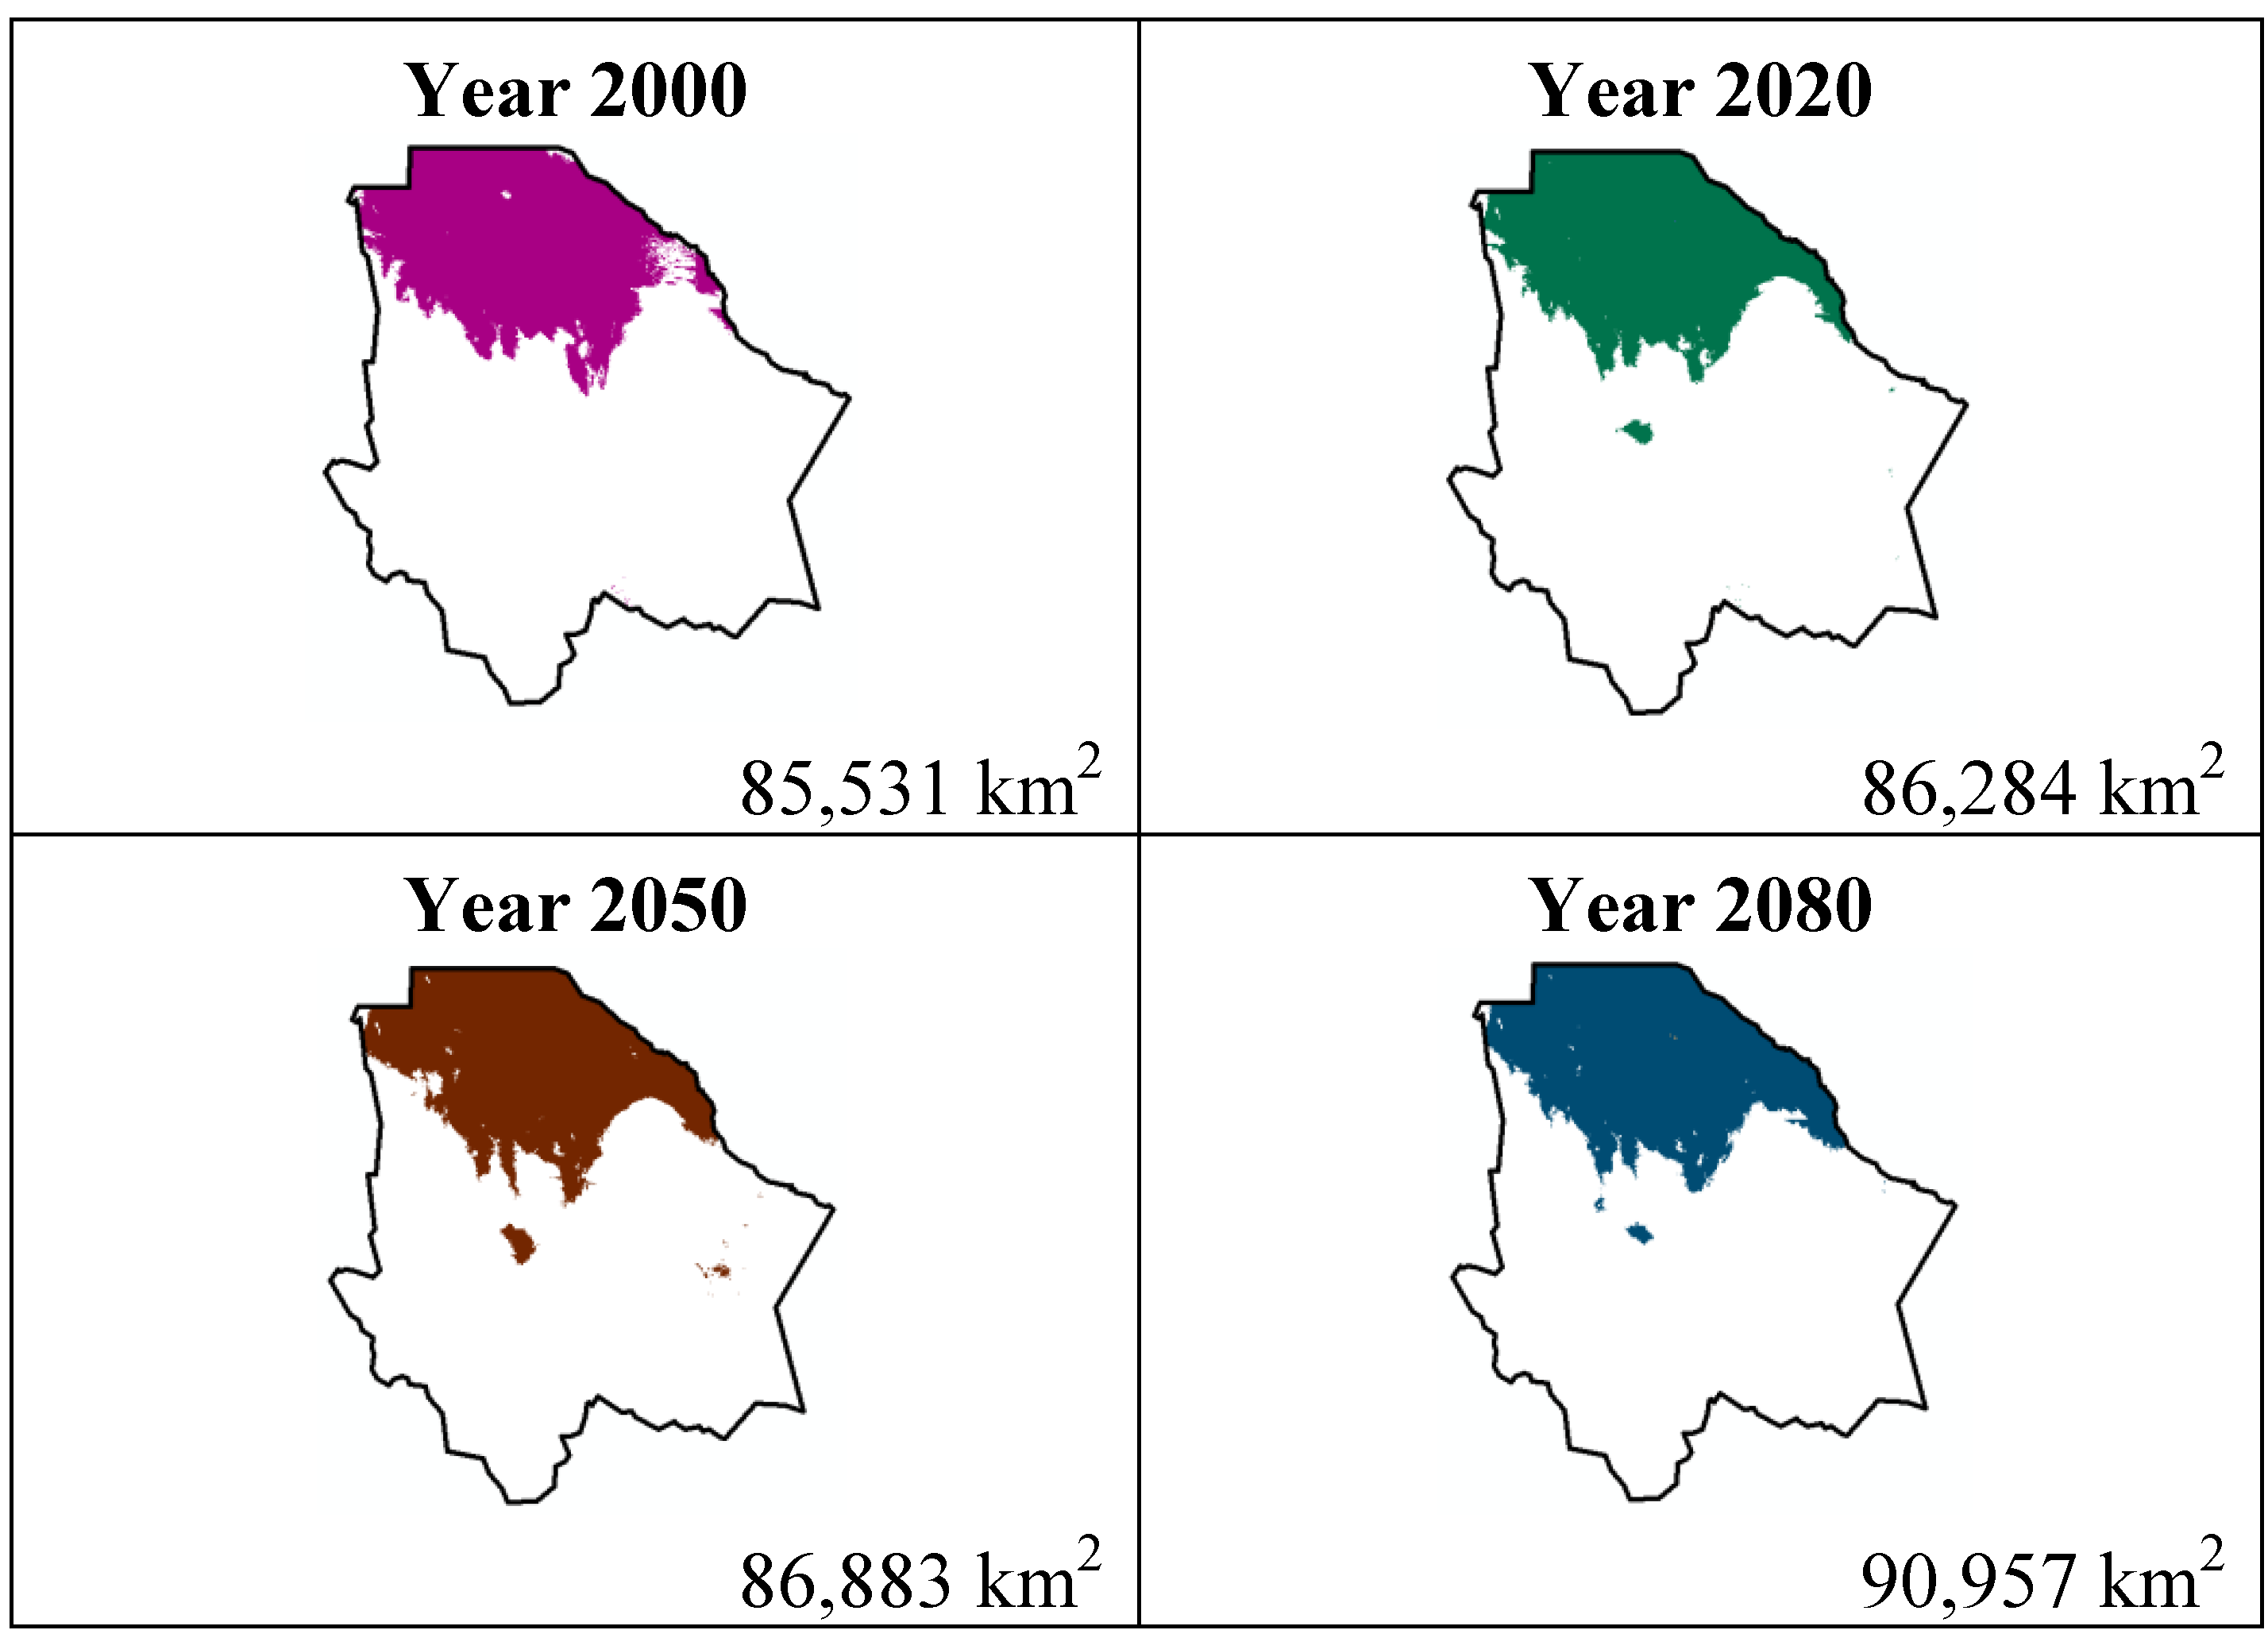
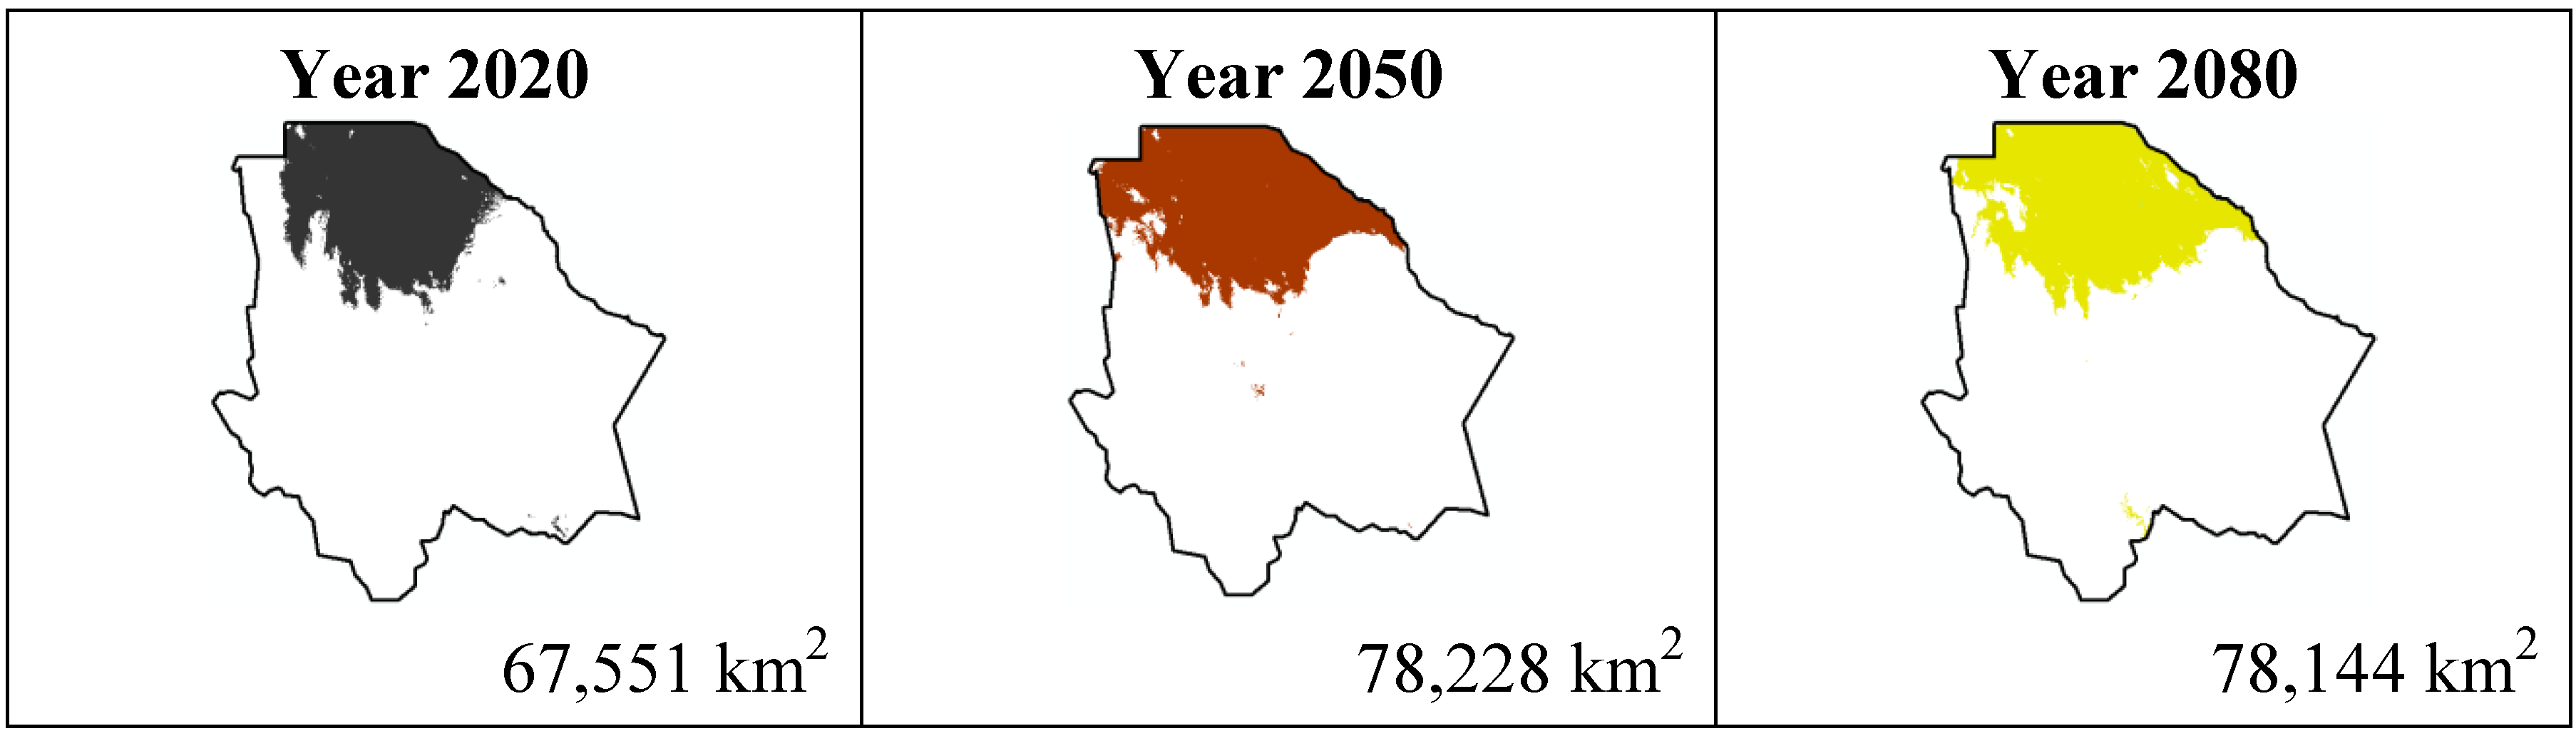
Figure 4.
Potential distribution models (MaxEnt) for Ferocactus wislizenii considering a liberal A2 temperature climatic scenario (current, 2020, 2050 and 2080).
Figure 4.
Potential distribution models (MaxEnt) for Ferocactus wislizenii considering a liberal A2 temperature climatic scenario (current, 2020, 2050 and 2080).
Both species, Echinocereus dasyacanthus and Ferocactus wislizenii, present a decrease in their areas in the year 2050, unlike Echinocereus dasyacanthus, and the Ferocactus wislizenii species will increase its area in 2080, to larger than its current area.
The study showed about the variable contribution percentage of the variables that temperature has a greater influence in species distribution. The variables were: 10 (Average temperature of the hotter quadrimester) more significant for Coryphantha macromeris; variable 1 (Average annual temperature) for Mammillaria lasiacantha; variable 8 (Average temperature of the rainiest quadrimester) for Echinocereus dasyacanthus and variable 7 (Annual tolerance range) for Ferocactus wislizenii. Taking into account that climate change causes an increase in the planet’s temperatures and being the temperature variables those with a greater influence on these cacti species, it is reasonable to say that the tolerance range for these species is wide since MaxEnt did not indicate a noticeable decrease about the species’ potential distribution area.
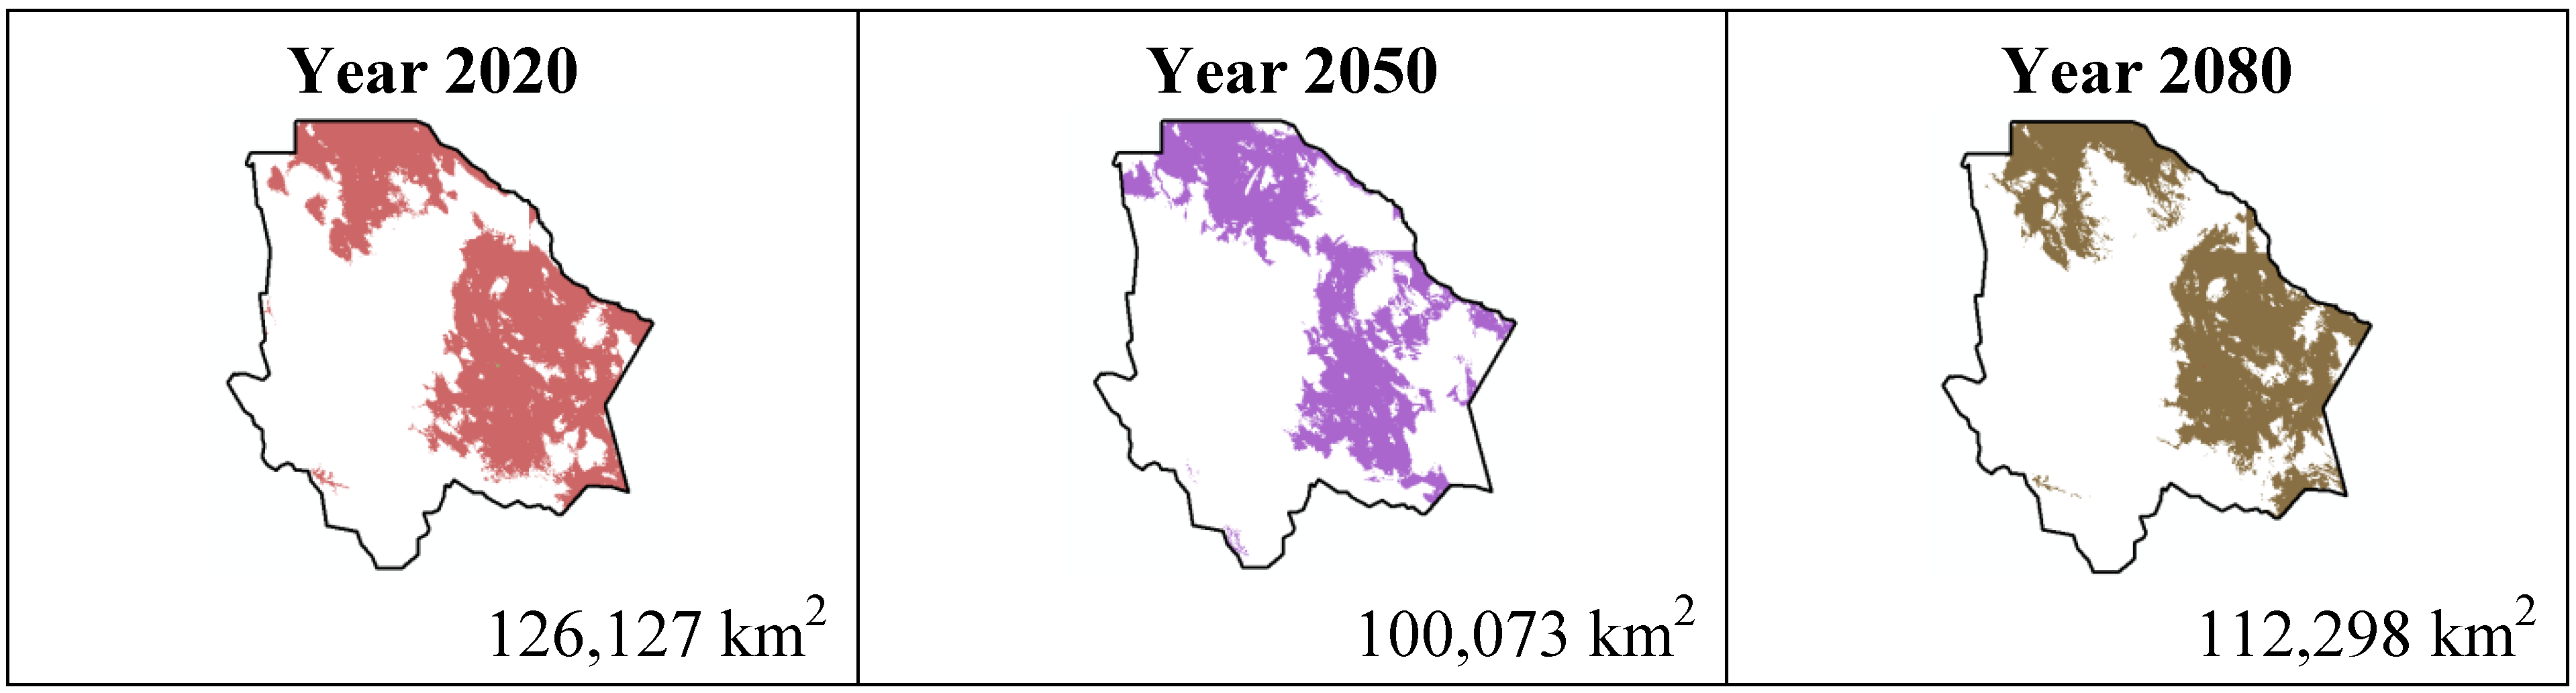
The results estimated for scenario B1 are similar to scenario A2 (
Figure 5,
Figure 6,
Figure 7 and
Figure 8); all species except
Echinocereus dasyacanthus show a decrease from the year 2020 to the year 2050 and later in the year 2080 an increase in their distribution area. In the case of
Echinocereus dasyacanthus the decrease in its potential distribution area is constant in the three time periods.
Figure 5.
Potential distribution models (MaxEnt) for Coryphantha macromeris considering a liberal B2 temperature climatic scenario (current, 2020, 2050 and 2080).
Figure 5.
Potential distribution models (MaxEnt) for Coryphantha macromeris considering a liberal B2 temperature climatic scenario (current, 2020, 2050 and 2080).
Figure 6.
Potential distribution models (MaxEnt) for Mamillaria lasiacantha considering a liberal B1 temperature climatic scenario (current, 2020, 2050 and 2080).
Figure 6.
Potential distribution models (MaxEnt) for Mamillaria lasiacantha considering a liberal B1 temperature climatic scenario (current, 2020, 2050 and 2080).
Figure 7.
Potential distribution models (MaxEnt) for Echinocereus dasyacanthus considering a liberal B1 temperature climatic scenario (current, 2020, 2050 and 2080).
Figure 7.
Potential distribution models (MaxEnt) for Echinocereus dasyacanthus considering a liberal B1 temperature climatic scenario (current, 2020, 2050 and 2080).
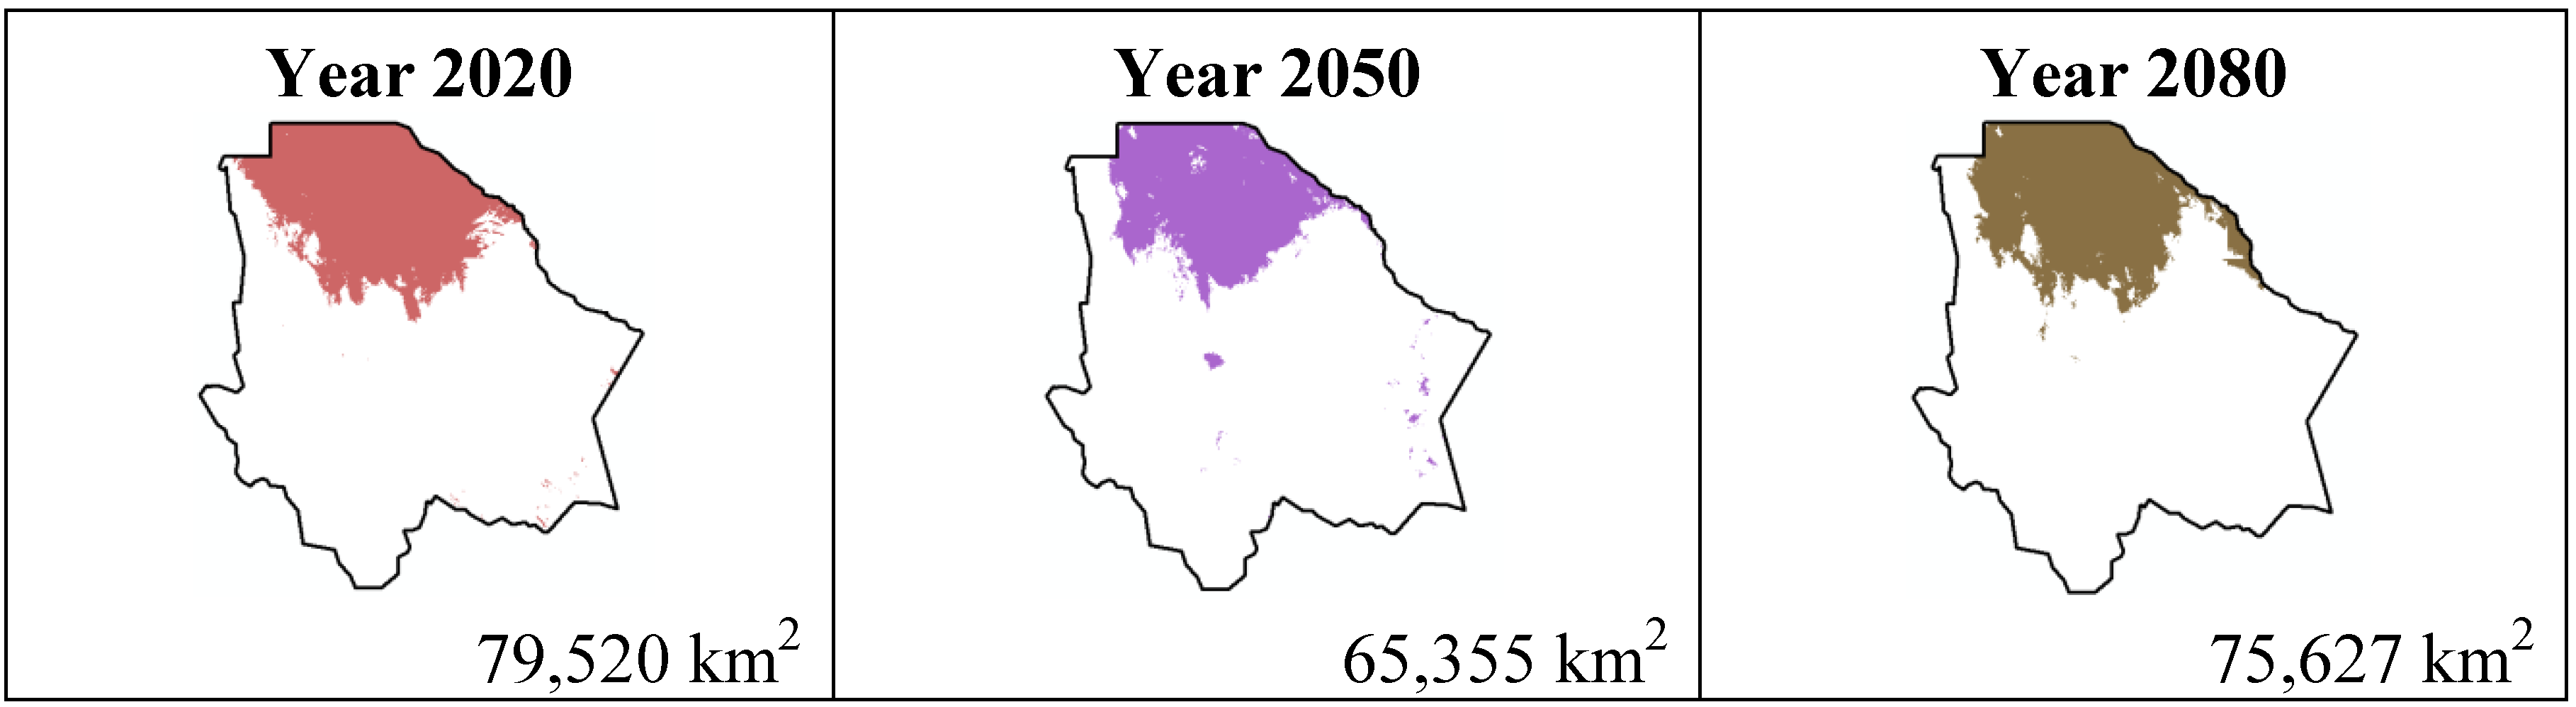
Figure 8.
Potential distribution models (MaxEnt) for Ferocactus wislizenii considering a liberal B1 temperature climatic scenario (current, 2020, 2050 and 2080).
Figure 8.
Potential distribution models (MaxEnt) for Ferocactus wislizenii considering a liberal B1 temperature climatic scenario (current, 2020, 2050 and 2080).
In spite of scenario B1 being about a reduction in the use of materials, a cleaner technology and a more efficient resource usage including global solutions to environmental sustainability, we can observe a difference about the species’ total distribution area for both scenarios. An important observation concerning the B1 scenario is that in the four cases the distribution area is smaller from year 2080 to 2020, where Coryphantha macromeris will decrease in 10.96%, Mammillaria lasiacantha in 0.5%, Echinocereus dasyacanthus in 7.6% and Ferocactus wislizenii in 4.89%.
The MaxEnt model shows an overview of the species spatial conditions, it is an approximation to reality that serves as starting point decision making in species conservation. Even though in the results we can see a resistance of cacti to CC, it is important to take into account other important factors such as soil usage or species trafficking that place them in risk.
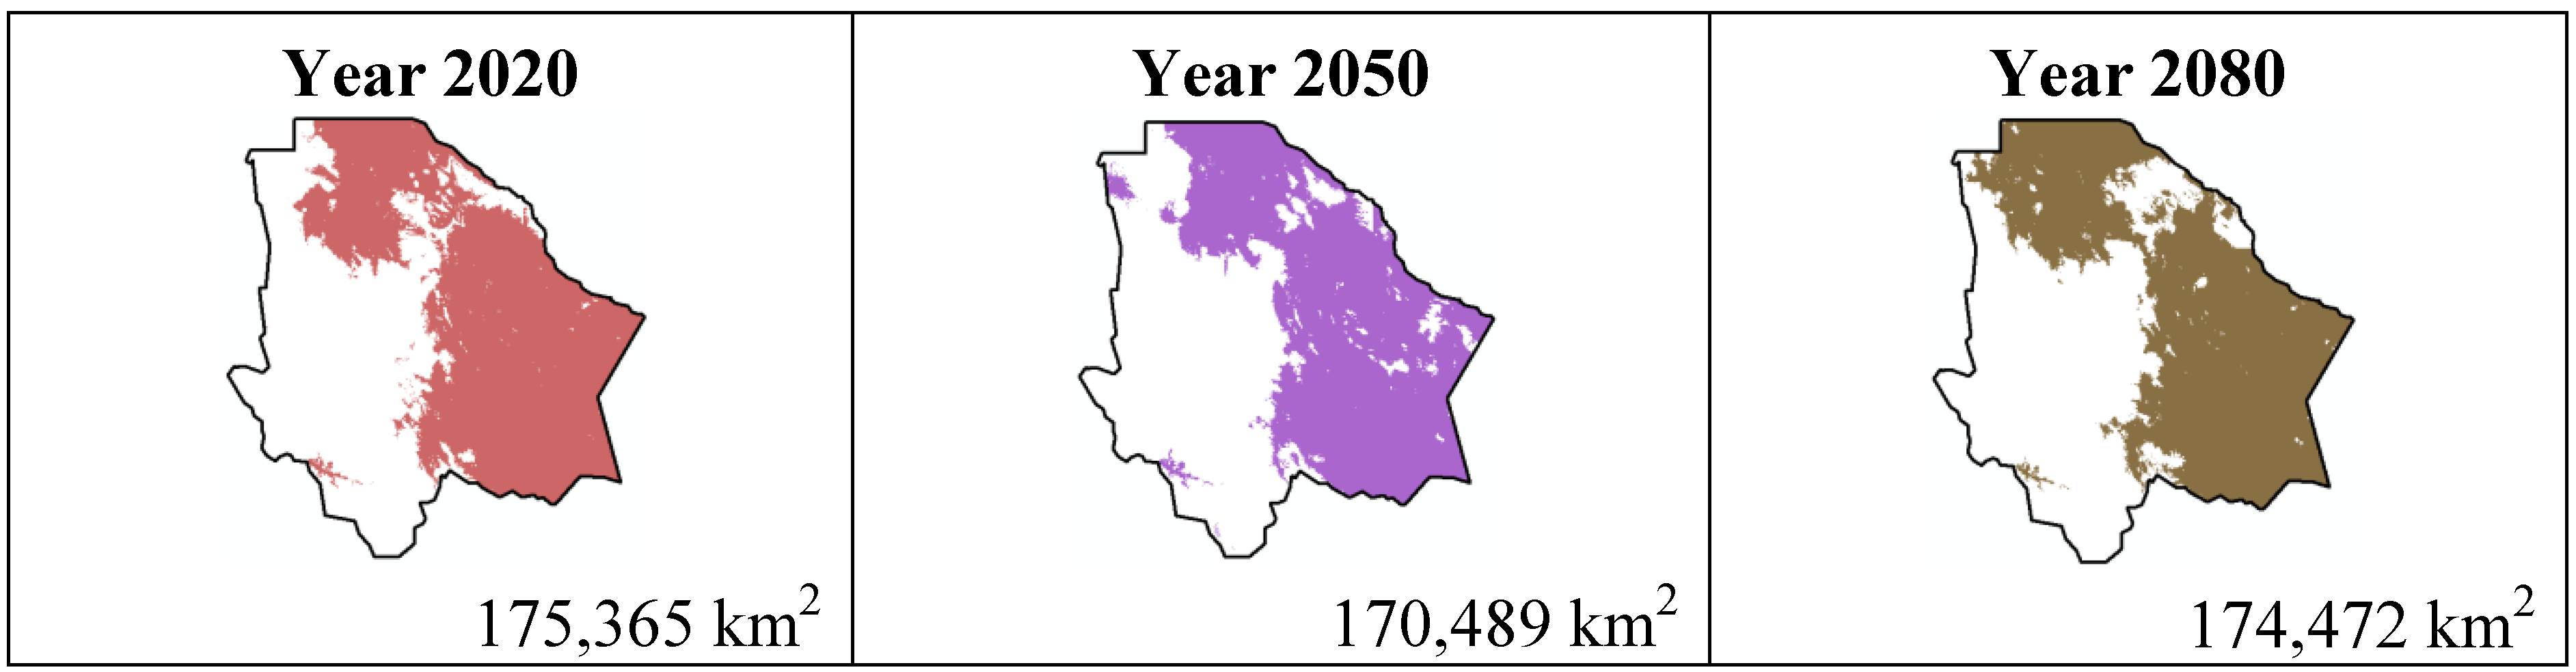
The most important results were projected by MaxEnt for the scenario A1B (
Figure 9,
Figure 10,
Figure 11 and
Figure 12). For
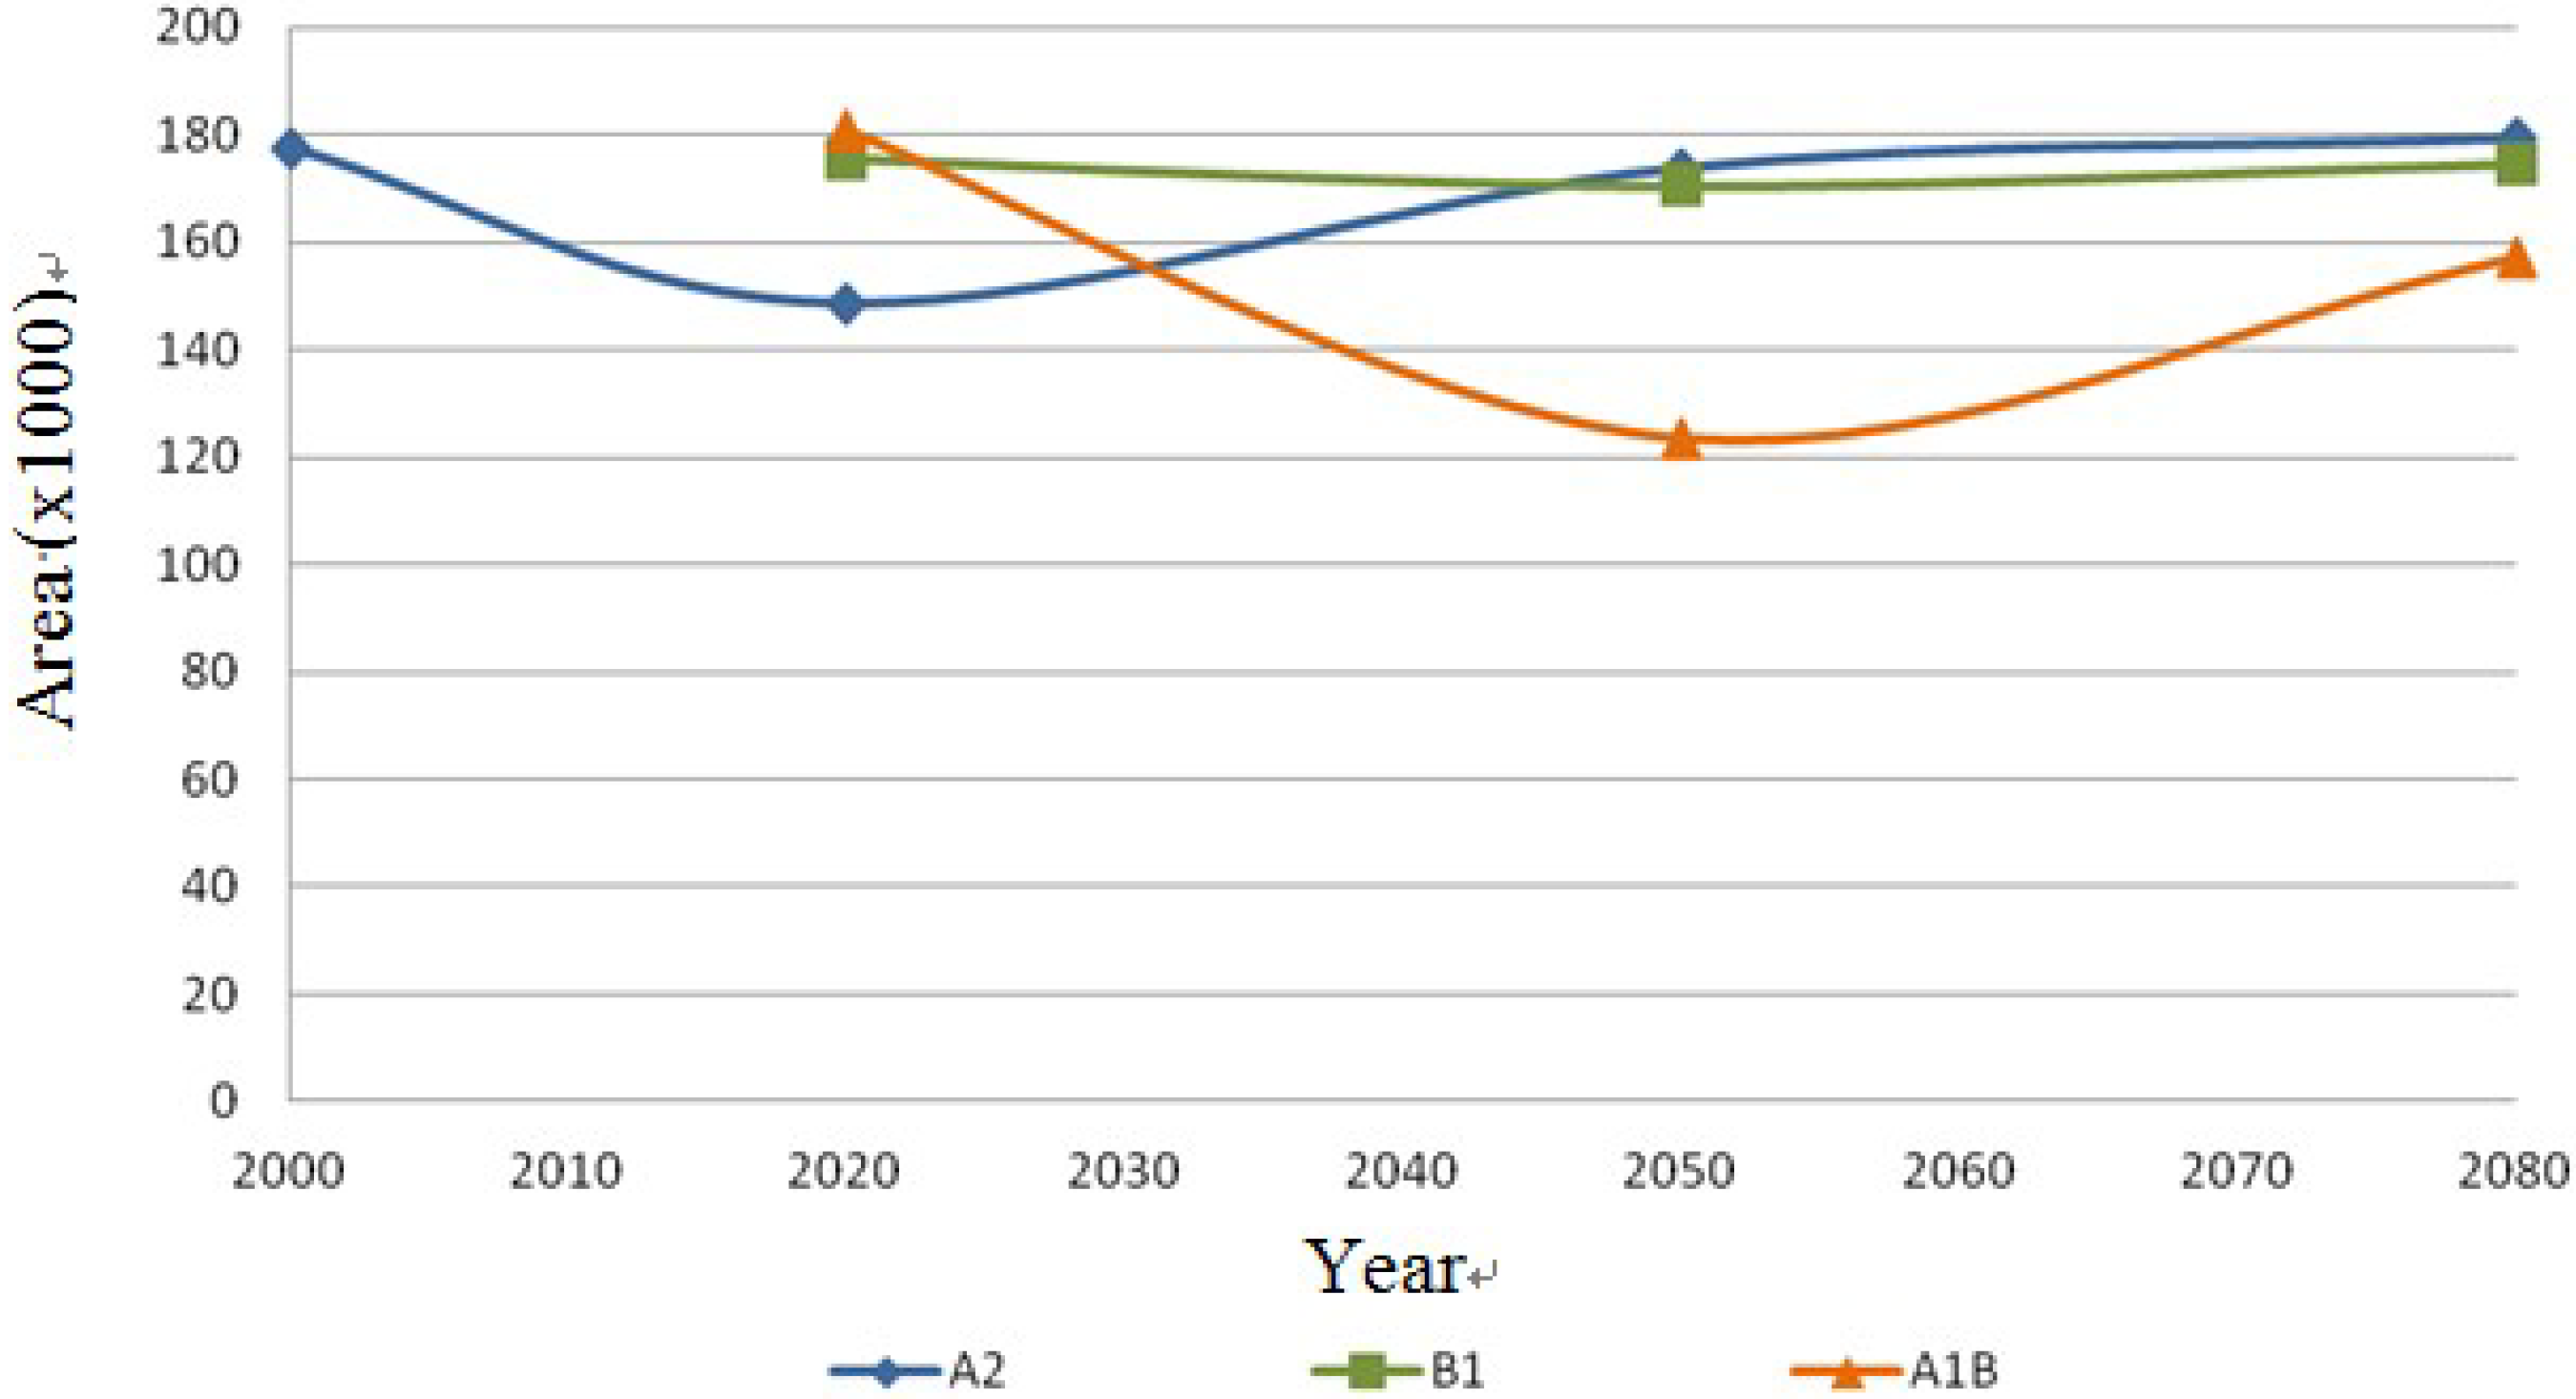
Coryphantha macromeris it shows a decrease of 27% from the year 2020 to 2050, but the area will increase in 2080 to 86.14 sq. mi. which represents an increase of 22% from the projection for 2020.
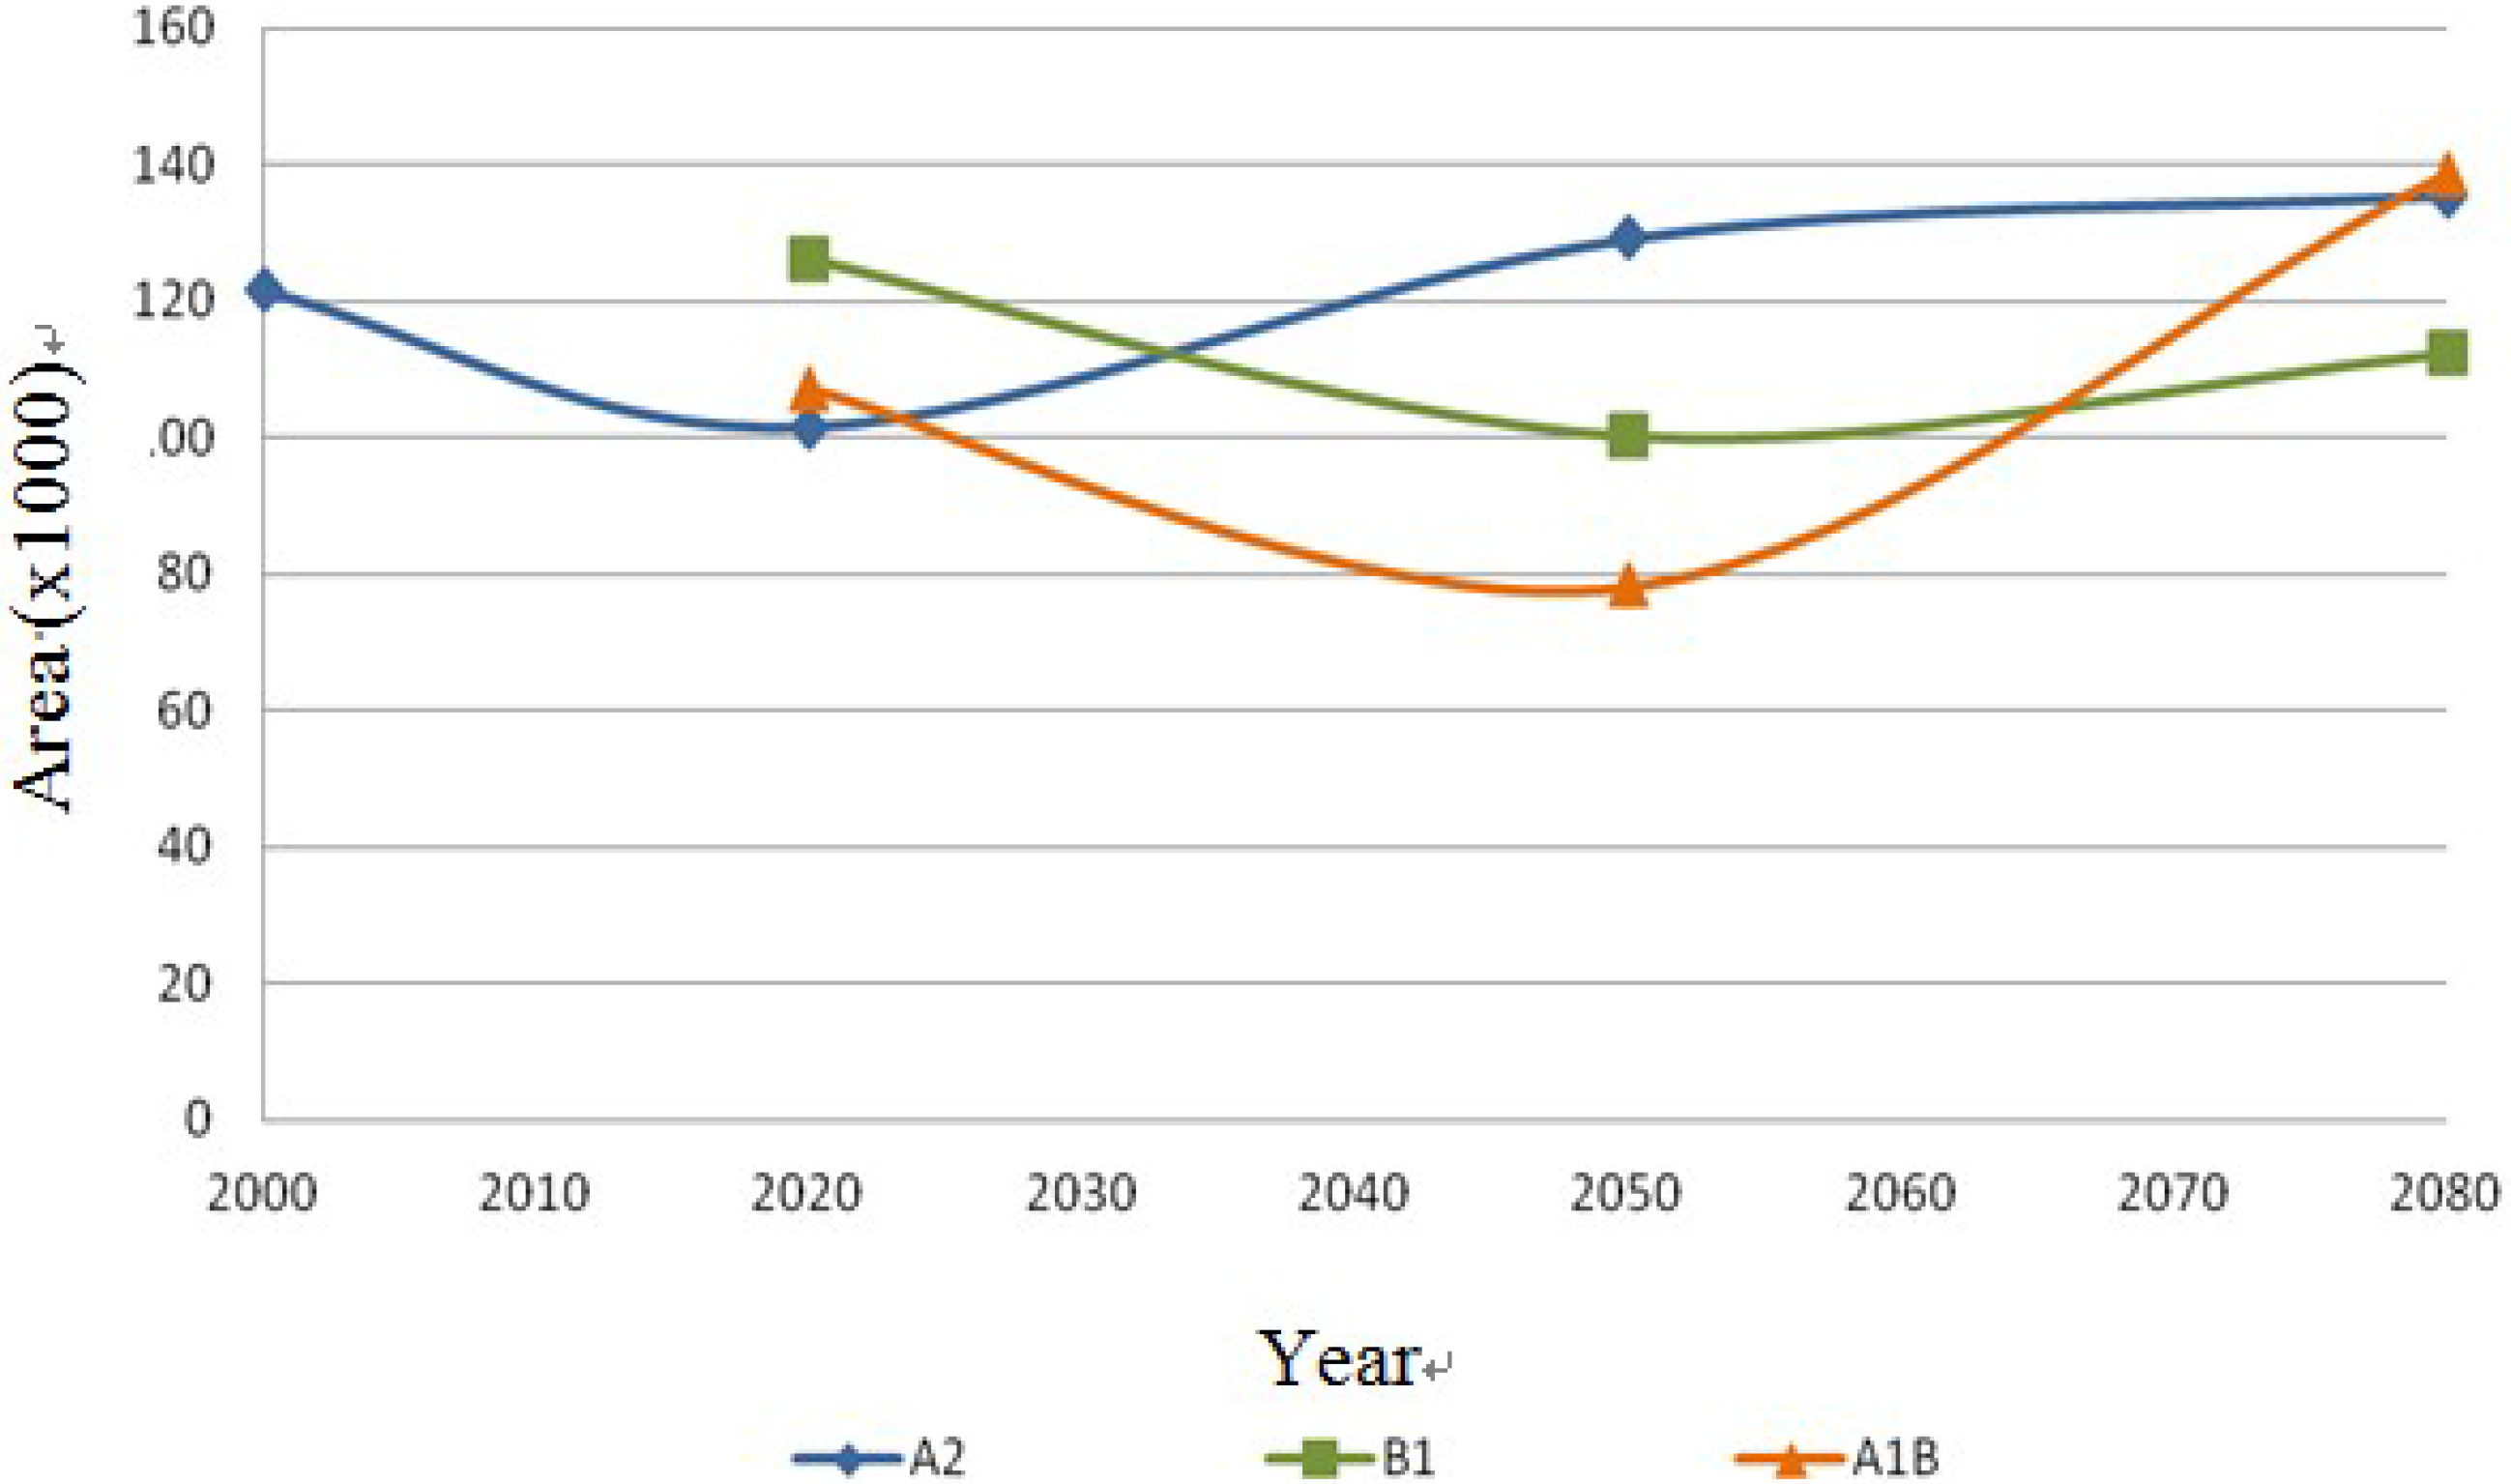
Mammillaria lasiacantha decreases from 2020 to 2050 and increases in 2080, being left with a distribution area 13% smaller than in 2020.
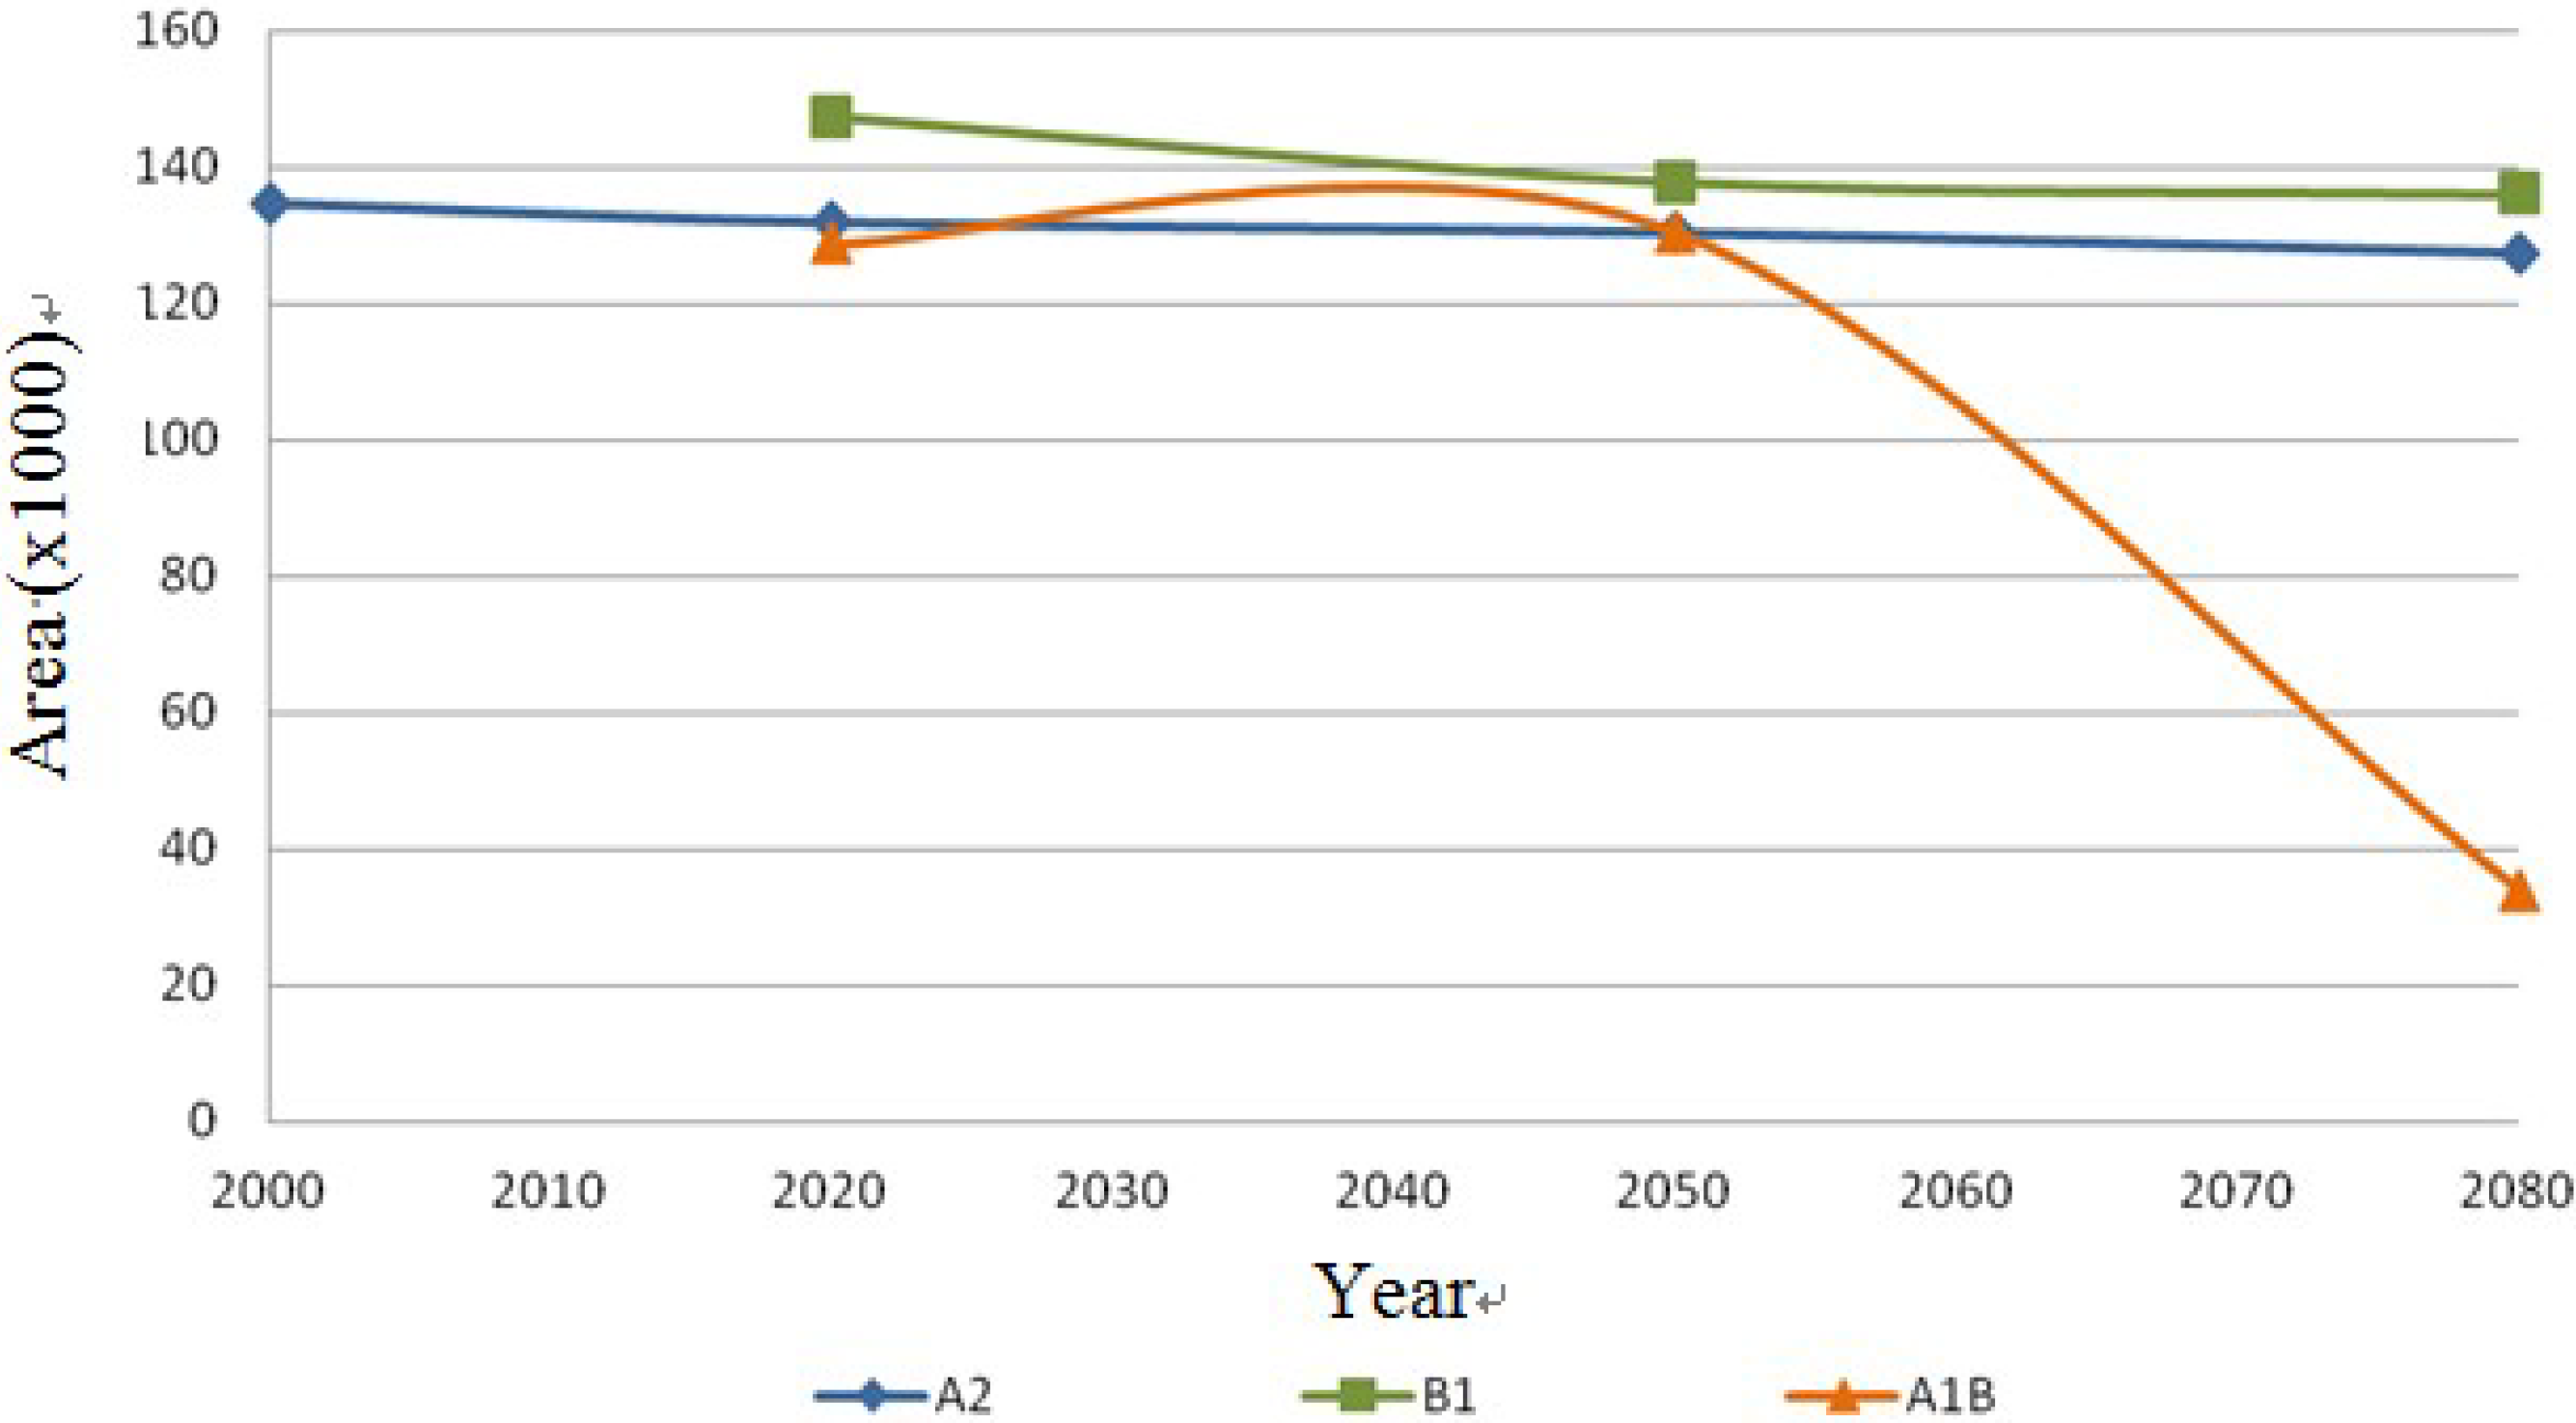
Echinocereus dasyacanthus presented a decrease in the three time periods in scenario A2 as well as in scenario B1, this shows it as the only constant species in both scenarios, however for scenario A1B it will have a slight increase of 1.38% by 2050 and similar to the previous scenarios it will decrease, in this case 73% smaller than in 2020. Finally
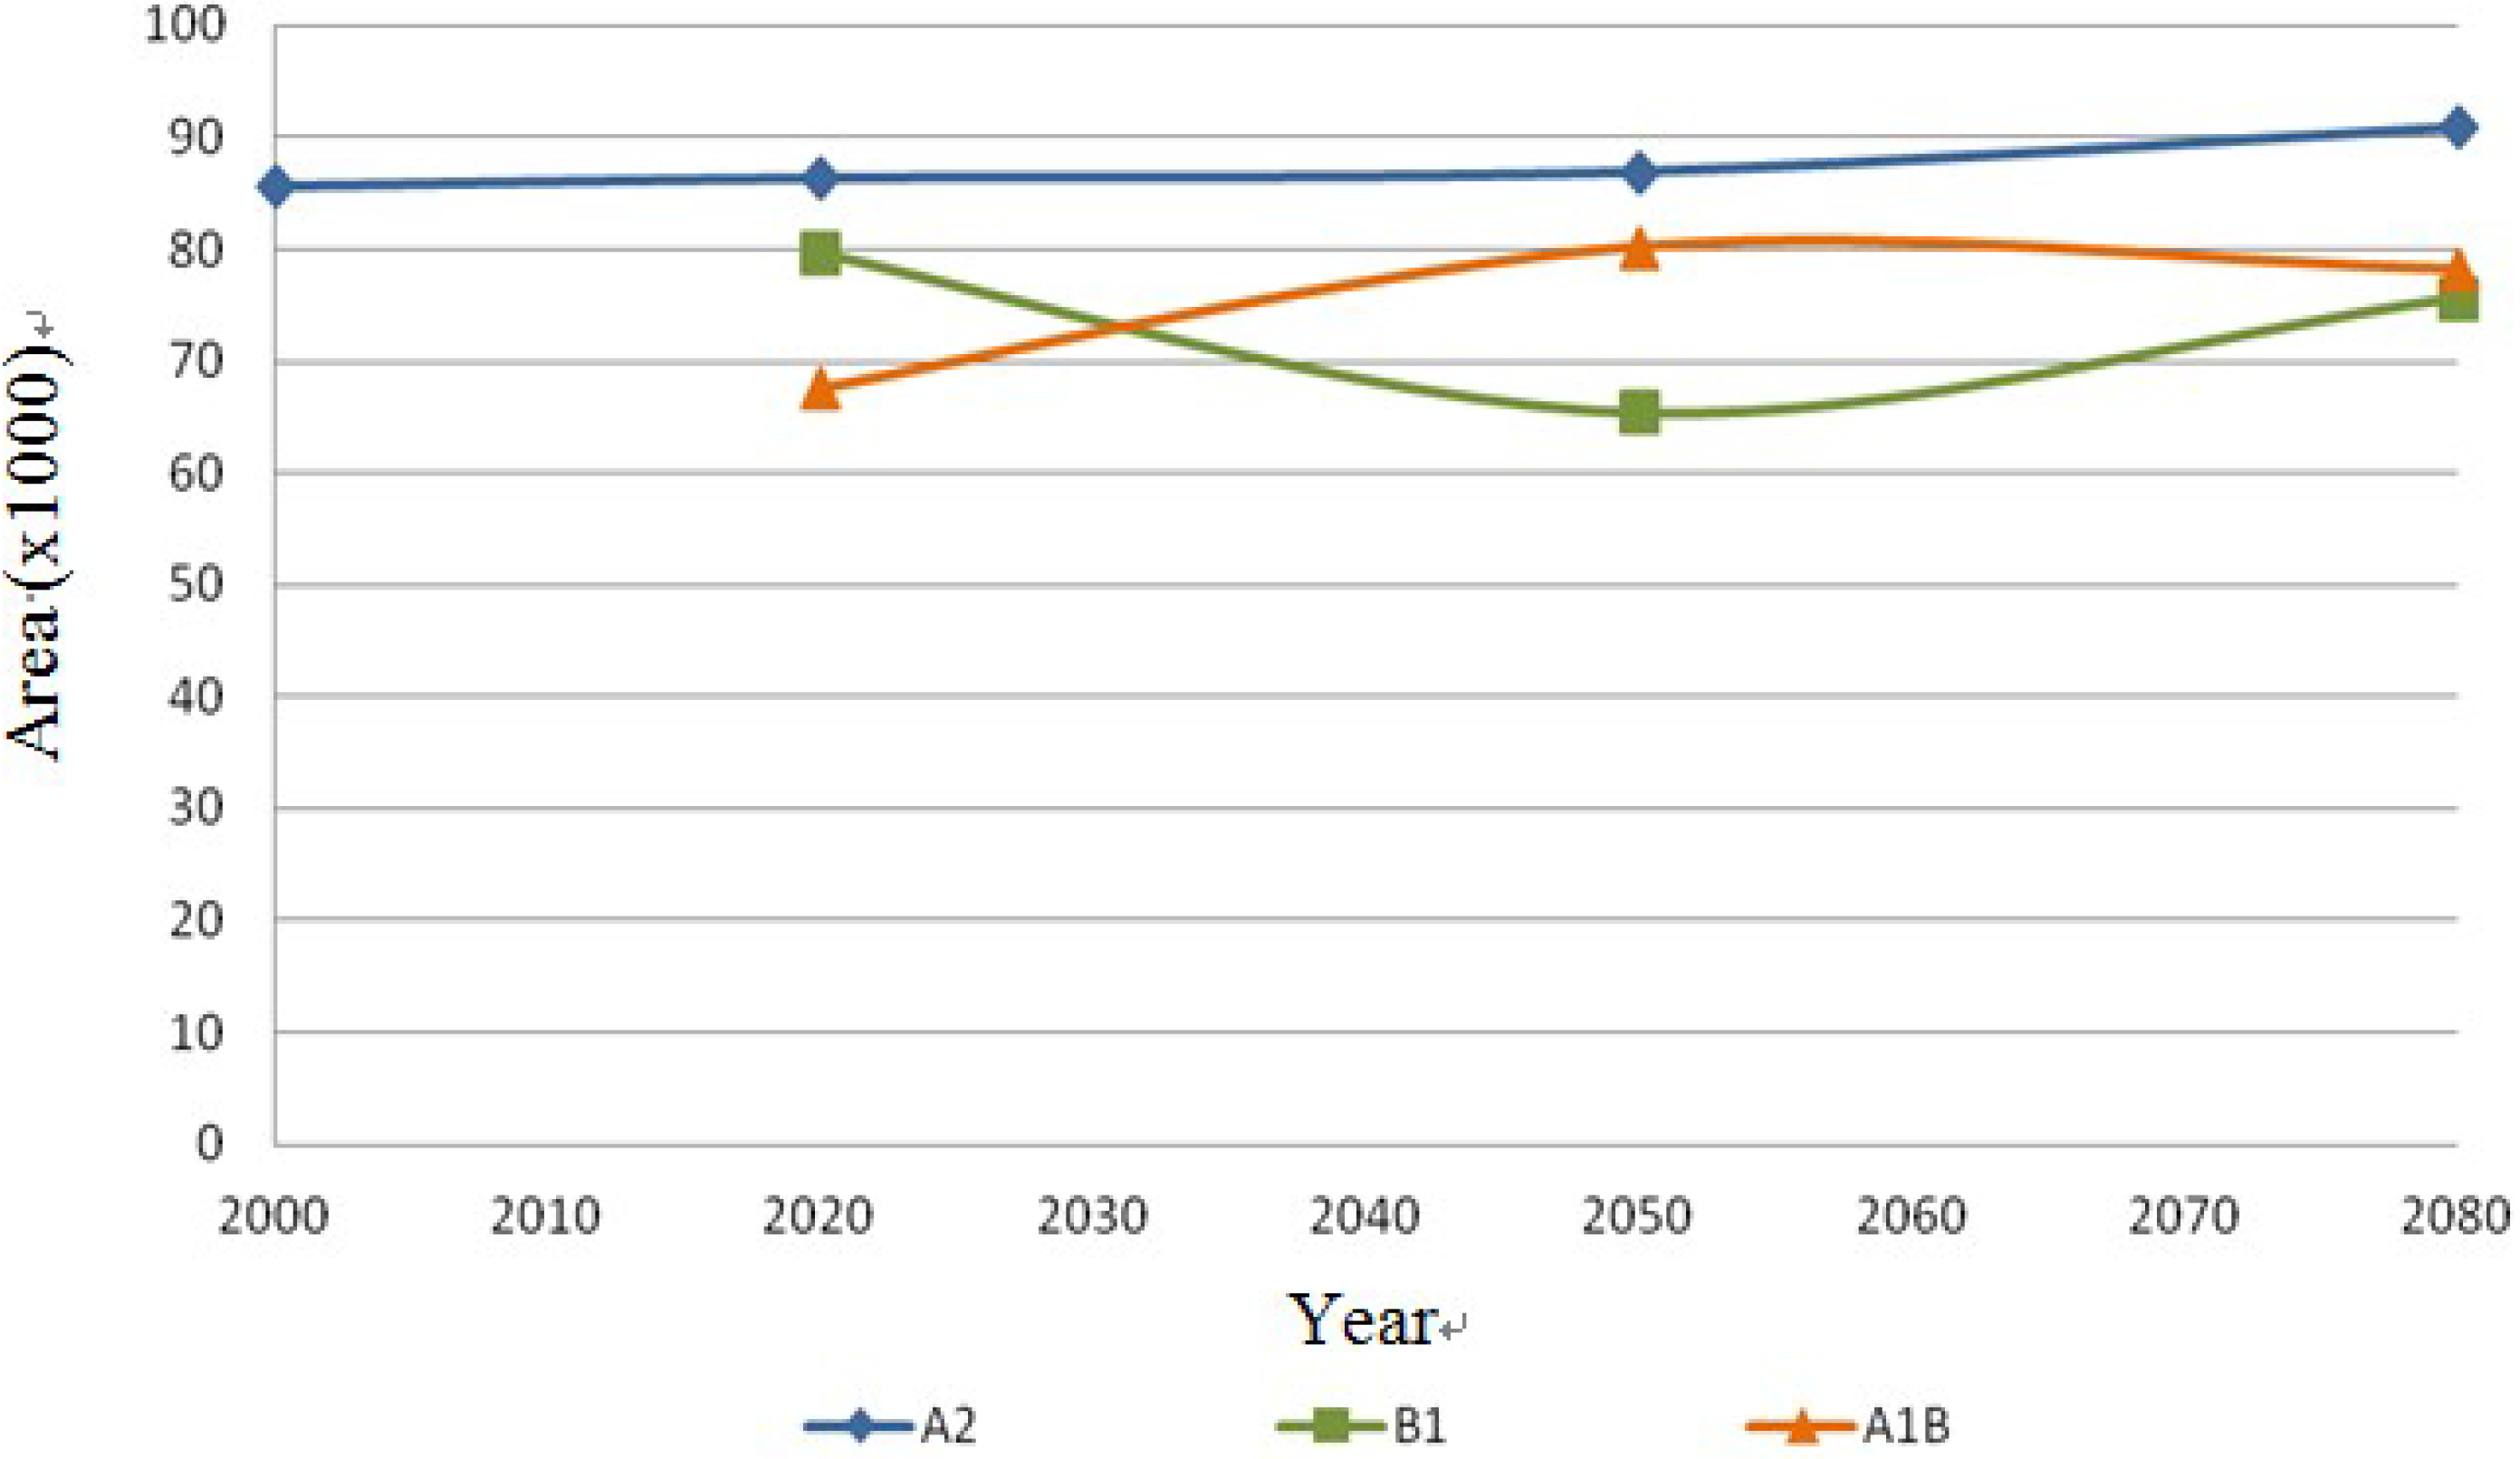
Ferocactus wislizenii increases in 15% from 2020 to 2050 and for 2080 it decreases 2.5%.
Figure 9.
Potential distribution models (MaxEnt) for Coryphantha macromeris considering a liberal A1B temperature climatic scenario (current, 2020, 2050 and 2080).
Figure 9.
Potential distribution models (MaxEnt) for Coryphantha macromeris considering a liberal A1B temperature climatic scenario (current, 2020, 2050 and 2080).
Figure 10.
Potential distribution models (MaxEnt) for Mamillaria lasiacantha considering a liberal A1B temperature climatic scenario (current, 2020, 2050 and 2080).
Figure 10.
Potential distribution models (MaxEnt) for Mamillaria lasiacantha considering a liberal A1B temperature climatic scenario (current, 2020, 2050 and 2080).
Figure 11.
Potential distribution models (MaxEnt) for Echinocereus dasyacanthus considering a liberal A1B temperature climatic scenario (current, 2020, 2050 and 2080).
Figure 11.
Potential distribution models (MaxEnt) for Echinocereus dasyacanthus considering a liberal A1B temperature climatic scenario (current, 2020, 2050 and 2080).
Figure 12.
Potential distribution models (MaxEnt) for Ferocactus wislizenii considering a liberal A1B temperature climatic scenario (current, 2020, 2050 and 2080).
Figure 12.
Potential distribution models (MaxEnt) for Ferocactus wislizenii considering a liberal A1B temperature climatic scenario (current, 2020, 2050 and 2080).
The description given by IPCC for the A1B scenario is made as part of the A1 scenario where it is supposed that economic growth is fast, with an accelerated population growth that peaks in the twenty-first century and decreases afterwards; a world where there is a quick introduction of new and efficient technologies, especially in A1B which would have a balance of all energy sources.
Figure 13.
Coryphantha macromeris dispersal area on the different scenarios (A2, B1 and A1B) in km2.
Figure 13.
Coryphantha macromeris dispersal area on the different scenarios (A2, B1 and A1B) in km2.
Figure 14.
Mammillaria lasiacantha dispersal area on the different scenarios (A2, B1 and A1B) in km2.
Figure 14.
Mammillaria lasiacantha dispersal area on the different scenarios (A2, B1 and A1B) in km2.
Figure 15.
Echinocereus dasyacanthus dispersal area on the different scenarios (A2, B1 and A1B) in km2.
Figure 15.
Echinocereus dasyacanthus dispersal area on the different scenarios (A2, B1 and A1B) in km2.
Figure 16.
Ferocactus wislizenii dispersal area on the different scenarios (A2, B1 and A1B) in km2.
Figure 16.
Ferocactus wislizenii dispersal area on the different scenarios (A2, B1 and A1B) in km2.

