Risk of Spina Bifida and Maternal Cigarette, Alcohol, and Coffee Use during the First Month of Pregnancy

Abstract
:1. Introduction
2. Methods
2.1. Study Population
2.2. Smoking
2.3. Alcohol
2.4. Coffee
2.5. Smoking, Alcohol, and Coffee Interaction
2.6. Folic Acid Intake
2.7. Statistical Analysis
3. Results
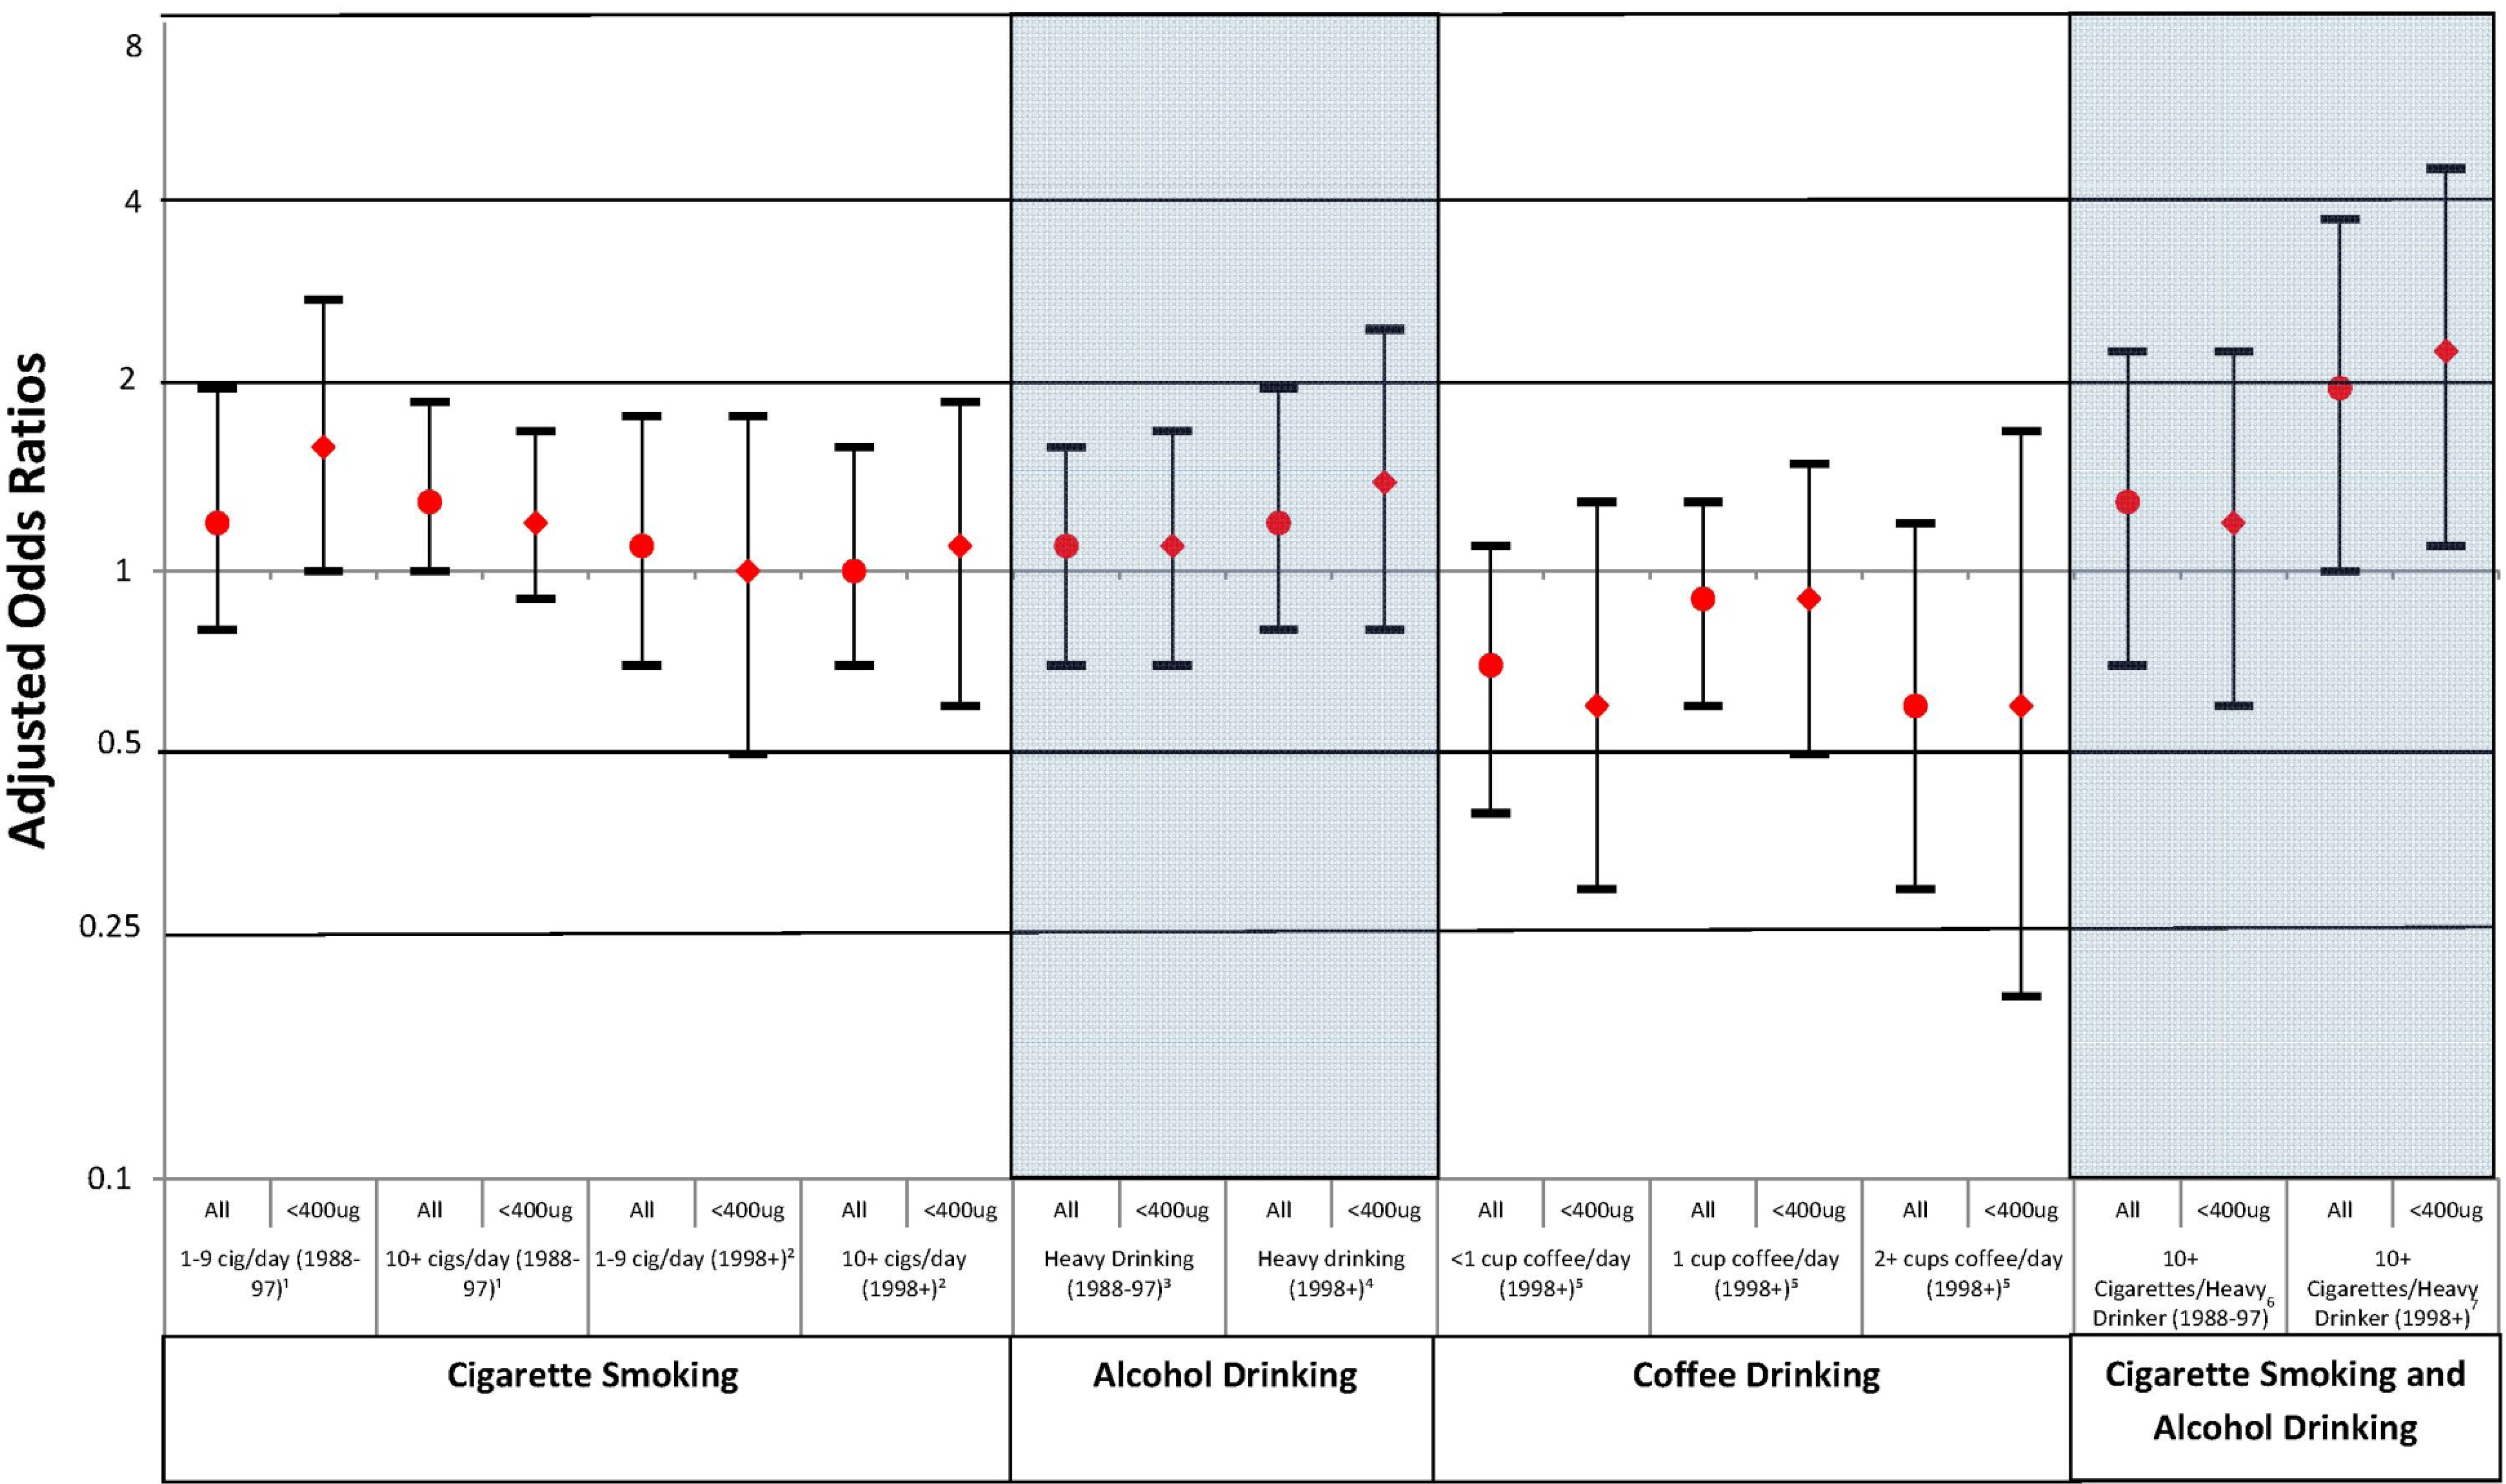
3.1. Smoking

| 1988–1997 | 1998–2012 | |||||||
|---|---|---|---|---|---|---|---|---|
| Controls | SB Cases | Controls | SB Cases | |||||
| n | % | N | % | n | % | n | % | |
| Total | 868 | 511 | 7,888 | 265 | ||||
| Maternal race/ethnicity | ||||||||
| White, non-Hispanic | 782 | 90.1 | 455 | 89.0 | 5,645 | 71.6 | 166 | 62.6 |
| Black, non-Hispanic | 46 | 5.3 | 30 | 5.9 | 662 | 8.4 | 28 | 10.6 |
| Hispanic | 17 | 2.0 | 16 | 3.1 | 896 | 11.4 | 50 | 18.9 |
| Other ǂ | 23 | 2.6 | 10 | 2.0 | 672 | 8.5 | 21 | 7.9 |
| Missing | 0 | 0.0 | 0 | 0.0 | 13 | 0.2 | 0 | 0.0 |
| Maternal age at conception | ||||||||
| <20 years | 24 | 2.8 | 44 | 8.6 | 555 | 7.0 | 20 | 7.6 |
| 20–24 years | 91 | 10.5 | 102 | 20.0 | 1,149 | 14.6 | 43 | 16.2 |
| 25–29 years | 298 | 34.3 | 164 | 32.1 | 2,065 | 26.2 | 88 | 33.2 |
| 30–34 years | 325 | 37.4 | 144 | 28.2 | 2,641 | 33.5 | 72 | 27.2 |
| ≥35 years | 130 | 15.0 | 57 | 11.2 | 1,457 | 18.5 | 42 | 15.9 |
| Missing | 0 | 0.0 | 0 | 0.0 | 21 | 0.3 | 0 | 0.0 |
| Maternal Education | ||||||||
| < 12 years | 55 | 6.3 | 83 | 16.2 | 720 | 9.1 | 40 | 15.1 |
| 12 years | 187 | 21.5 | 181 | 35.4 | 1,452 | 18.4 | 64 | 24.2 |
| > 12 years | 625 | 72.0 | 247 | 48.3 | 5,708 | 72.4 | 160 | 60.4 |
| Missing | 1 | 0.1 | 0 | 0.0 | 8 | 0.1 | 1 | 0.4 |
| Study center (years in study) | ||||||||
| Boston, MA (1976+) | 314 | 36.2 | 195 | 38.2 | 3,991 | 50.6 | 41 | 15.5 |
| Philadelphia (1976+) | 186 | 21.4 | 155 | 30.3 | 1,567 | 19.9 | 91 | 34.3 |
| Toronto (1979–2005) | 368 | 42.4 | 161 | 31.5 | 645 | 8.2 | 60 | 22.6 |
| San Diego (2001+) | 0 | 0.0 | 0 | 0.0 | 1,131 | 14.3 | 38 | 14.3 |
| New York (2004+) | 0 | 0.0 | 0 | 0.0 | 554 | 7.0 | 35 | 13.2 |
| BMI * (1993+) | ||||||||
| Underweight | 60 | 6.9 | 11 | 2.2 | 376 | 4.8 | 7 | 2.6 |
| Normal | 449 | 51.7 | 78 | 15.3 | 4,814 | 61.0 | 128 | 48.3 |
| Overweight | 152 | 17.5 | 34 | 6.7 | 1,549 | 19.6 | 55 | 20.8 |
| Obese | 67 | 7.7 | 27 | 5.3 | 965 | 12.2 | 60 | 22.6 |
| Missing | 140 | 16.1 | 361 | 70.6 | 184 | 2.3 | 15 | 5.7 |
| Folic Acid | ||||||||
| <400μg | 561 | 64.6 | 386 | 75.5 | 3,499 | 44.4 | 123 | 46.4 |
| ≥400μg | 297 | 34.2 | 112 | 21.9 | 4,222 | 53.5 | 131 | 49.4 |
| Missing | 10 | 1.2 | 13 | 2.5 | 167 | 2.1 | 11 | 4.2 |

| Smoking (1988–1997) | Smoking (1998–2012) | Alcohol Consumption (1988–1997) | Alcohol Consumption (1998–2012) | Coffee Consumption (1998–2012) | ||||||
|---|---|---|---|---|---|---|---|---|---|---|
| <1 | ≥1 | <1 | ≥1 | No | Yes | <1 | ≥1 | <1 | ≥1 | |
| n (%) | n (%) | n (%) | n (%) | n (%) | n (%) | n (%) | n (%) | n (%) | n (%) | |
| Maternal race/ethnicity | ||||||||||
| White, non-Hispanic | 606 (89.8) | 176 (91.2) | 4,721 (70.6) | 924 (76.9) | 354 (87) | 428 (92.8) | 2,769 (61.8) | 2,876 (84.4) | 3,777 (68.4) | 1,868 (79) |
| Black, non-Hispanic | 38 (5.6) | 8 (4.1) | 554 (8.3) | 108 (9) | 26 (6.4) | 20 (4.3) | 487 (10.9) | 175 (5.1) | 579 (10.5) | 170 (7.2) |
| Hispanic | 12 (1.8) | 5 (2.6) | 789 (11.8) | 107 (8.9) | 13 (3.2) | 4 (0.9) | 706 (15.8) | 190 (5.6) | 654 (11.8) | 83 (3.5) |
| Otherǂ | 19 (2.8) | 4 (2.1) | 610 (9.1) | 62 (5.2) | 14 (3.4) | 9 (2) | 509 (11.4) | 163 (4.8) | 502 (9.1) | 242 (10.2) |
| Missing | 0 (0) | 0 (0) | 12 (0.2) | 1 (0.1) | 0 (0) | 0 (0) | 9 (0.2) | 4 (0.1) | 11 (0.2) | 2 (0.1) |
| Maternal Age | ||||||||||
| <20 years | 10 (1.5) | 14 (7.3) | 393 (5.9) | 162 (13.5) | 14 (3.4) | 10 (2.2) | 435 (9.7) | 120 (3.5) | 473 (8.6) | 82 (3.5) |
| 20–24 years | 57 (8.4) | 34 (17.6) | 822 (12.3) | 327 (27.2) | 42 (10.3) | 49 (10.6) | 734 (16.4) | 415 (12.2) | 884 (16) | 265 (11.2) |
| 25–29 years | 228 (33.8) | 70 (36.3) | 1,751 (26.2) | 314 (26.1) | 152 (37.3) | 146 (31.7) | 1,202 (26.8) | 863 (25.3) | 1,473 (26.7) | 592 (25) |
| 30–34 years | 270 (40) | 55 (28.5) | 2,391 (35.8) | 250 (20.8) | 142 (34.9) | 183 (39.7) | 1,342 (30) | 1,299 (38.1) | 1,757 (31.8) | 884 (37.4) |
| ≥35 years | 110 (16.3) | 20 (10.4) | 1,308 (19.6) | 149 (12.4) | 57 (14) | 73 (15.8) | 753 (16.8) | 704 (20.7) | 918 (16.6) | 539 (22.8) |
| Missing | 0 (0) | 0 (0) | 21 (0.3) | 0 (0) | 0 (0) | 0 (0) | 14 (0.3) | 7 (0.2) | 18 (0.3) | 3 (0.1) |
| Maternal Education | ||||||||||
| < 12 years | 29 (4.3) | 26 (13.5) | 498 (7.4) | 222 (18.5) | 31 (7.6) | 24 (5.2) | 584 (13) | 136 (4) | 564 (10.2) | 156 (6.6) |
| 12 years | 118 (17.5) | 69 (35.8) | 1,010 (15.1) | 442 (36.8) | 103 (25.3) | 84 (18.2) | 971 (21.7) | 481 (14.1) | 1,002 (18.1) | 450 (19) |
| > 12 years | 527 (78.1) | 98 (50.8) | 5,170 (77.3) | 538 (44.8) | 273 (67.1) | 352 (76.4) | 2,918 (65.1) | 2,790 (81.9) | 3,950 (71.5) | 1,758 (74.3) |
| Missing | 1 (0.1) | 0 (0) | 8 (0.1) | 0 (0) | 0 (0) | 1 (0.2) | 7 (0.2) | 1 (0) | 7 (0.1) | 1 (0) |
| Folic Acid | ||||||||||
| <400 | 419 (62.1) | 142 (73.6) | 2,705 (40.5) | 794 (66.1) | 251 (61.7) | 310 (67.2) | 2,055 (45.9) | 1,444 (42.4) | 2,459 (44.5) | 1,040 (44) |
| 400+ | 249 (36.9) | 48 (24.9) | 3,848 (57.6) | 374 (31.1) | 151 (37.1) | 146 (31.7) | 2,300 (51.3) | 1,922 (56.4) | 2,945 (53.3) | 1,277 (54) |
| Missing | 7 (1) | 3 (1.6) | 133 (2) | 34 (2.8) | 5 (1.2) | 5 (1.1) | 125 (2.8) | 42 (1.2) | 119 (2.2) | 48 (2) |
| Study center (years in study) | ||||||||||
| Boston, MA (1976+) | 243 (36) | 71 (36.8) | 3,324 (49.7) | 667 (55.5) | 133 (32.7) | 181 (39.3) | 2,182 (48.7) | 1,809 (53.1) | 2,619 (47.4) | 1,372 (58) |
| Philadelphia (1976+) | 153 (22.7) | 33 (17.1) | 1,311 (19.6) | 256 (21.3) | 120 (29.5) | 66 (14.3) | 942 (21) | 625 (18.3) | 1,201 (21.7) | 366 (15.5) |
| Toronto (1979-2005) | 279 (41.3) | 89 (46.1) | 536 (8) | 109 (9.1) | 154 (37.8) | 214 (46.4) | 334 (7.5) | 311 (9.1) | 435 (7.9) | 210 (8.9) |
| San Diego (2001+) | 0 (0) | 0 (0) | 1,050 (15.7) | 81 (6.7) | 0 (0) | 0 (0) | 674 (15) | 457 (13.4) | 880 (15.9) | 251 (10.6) |
| New York (2004+) | 0 (0) | 0 (0) | 465 (7) | 89 (7.4) | 0 (0) | 0 (0) | 348 (7.8) | 206 (6) | 388 (7) | 166 (7) |
3.2. Alcohol
3.3. Coffee
| Cases | Controls | cOR (95% CI) | aOR (95% CI) | |||
|---|---|---|---|---|---|---|
| n | % | n | % | |||
| Smoking | ||||||
| 1988–1997 1 | ||||||
| None | 342 | 66.9 | 675 | 77.8 | Ref | Ref |
| 1–9 cig/day | 38 | 7.4 | 53 | 6.1 | 1.4 (0.9, 2.2) | 1.2 (0.8, 2.0) |
| 10+ cigs/day | 125 | 24.5 | 135 | 15.6 | 1.8 (1.4, 2.4) | 1.3 (0.9, 1.7) |
| Missing | 6 | 1.2 | 5 | 0.6 | - | - |
| 1998+ 2 | ||||||
| None | 218 | 82.3 | 6,686 | 84.8 | Ref | Ref |
| 1–9 cig/day | 22 | 8.3 | 522 | 6.6 | 1.3 (0.8, 2.0) | 1.1 (0.7, 1.8) |
| 10+ cigs/day | 25 | 9.4 | 677 | 8.6 | 1.1 (0.7, 1.7) | 1.0 (0.7, 1.6) |
| Missing | 0 | 3 | <0.1 | - | - | |
| Alcohol | ||||||
| 1988–1997 3 | ||||||
| No heavy drinking | 456 | 89.2 | 805 | 92.7 | Ref | Ref |
| Heavy drinking φ | 55 | 10.8 | 63 | 7.3 | 1.5 (1.1, 2.3) | 1.1 (0.7, 1.6) |
| 1998+ 4 | ||||||
| No heavy drinking | 239 | 90.6 | 7,385 | 93.6 | Ref | Ref |
| Heavy drinking φ | 25 | 9.4 | 496 | 6.3 | 1.6 (1.0, 2.4) | 1.2 (0.8, 2.0) |
| Missing | 1 | 0.4 | 7 | <0.1 | - | - |
| Smoking and Alcohol use | ||||||
| 1988–1997 5 | ||||||
| No smoking/ not heavy drinking | 322 | 69.0 | 646 | 79.8 | Ref | Ref |
| 10+ cigs per day/ heavy drinking | 29 | 6.2 | 24 | 3.0 | 2.4 (1.4, 4.2) | 1.3 (0.7, 2.3) |
| Missing | 6 | 1.3 | 5 | 0.6 | - | - |
| 1998+ 6 | ||||||
| No smoking/ not heavy drinking | 214 | 88.1 | 6,433 | 87.4 | Ref | Ref |
| 10+ cigs per day/ heavy drinking | 11 | 4.5 | 149 | 2.0 | 2.2 (1.2, 4.2) | 2.0 (1.0, 3.8) |
| Missing | 1 | 0.4 | 10 | 0.1 | - | - |
| Caffeine from coffee | ||||||
| 1998+ 7 | ||||||
| None | 205 | 77.4 | 5,523 | 70.0 | Ref | Ref |
| <1 cup/day | 21 | 7.9 | 844 | 10.7 | 0.7 (0.4, 1.1) | 0.7 (0.4, 1.1) |
| 1 cup/day | 31 | 11.7 | 1084 | 13.7 | 0.8 (0.5, 1.1) | 0.9 (0.6, 1.3) |
| 2+ cups/day | 8 | 3.0 | 437 | 5.5 | 0.5 (0.2, 1.0) | 0.6 (0.3, 1.2) |
| Average number of drinking days per week | Total | ||||||
|---|---|---|---|---|---|---|---|
| <1 | 1 | 2 | 3+ | ||||
| Average number of drinks per drinking day | <1 | Cases | 424 | 0 | 0 | 0 | 424 |
| Controls | 4,882 | 3 | 0 | 1 | 4,886 | ||
| cOR | Ref | - | - | - | Ref | ||
| aOR (95% CI) * | - | - | - | - | - | ||
| 1 | Cases | 76 | 15 | 9 | 14 | 114 | |
| Controls | 487 | 239 | 178 | 270 | 1,174 | ||
| cOR | 1.8 | 0.7 | 0.6 | 0.6 | 1.1 | ||
| aOR (95% CI) * | 0.7 (0.5, 1.1) | 0.5 (0.3, 1.1) | 0.5 (0.2, 1.1) | 0.6 (0.3, 1.1) | 0.7 (0.5, 0.9) | ||
| 2 | Cases | 61 | 20 | 21 | 11 | 113 | |
| Controls | 615 | 383 | 297 | 198 | 1,493 | ||
| cOR | 1.1 | 0.6 | 0.8 | 0.6 | 0.9 | ||
| aOR (95% CI) * | 1 (0.7, 1.5) | 0.6 (0.4, 1.1) | 0.8 (0.5, 1.4) | 0.6 (0.3, 1.2) | 0.8 (0.6, 1.1) | ||
| 3+ | Cases | 52 | 36 | 15 | 22 | 125 | |
| Controls | 513 | 316 | 249 | 123 | 1,201 | ||
| cOR | 1.2 | 1.3 | 0.7 | 2.1 | 1.2 | ||
| aOR (95% CI) * | 0.7 (0.5, 1.0) | 1 (0.6, 1.6) | 0.3 (0.2, 0.6) | 1.2 (0.6, 2.3) | 0.7 (0.6, 1.0) | ||
| Total | Cases | 613 | 71 | 45 | 47 | ||
| Controls | 6,497 | 941 | 724 | 592 | |||
| cOR | Ref | 0.9 | 0.7 | 0.9 | |||
| aOR (95% CI) * | - | 0.8 (0.5, 1.1) | 0.8 (0.4, 0.8) | 0.7 (0.5, 1.3) | |||
3.4. Smoking, Alcohol, and Coffee Interaction
4. Discussion
4.1. Smoking
4.2. Alcohol
4.3. Coffee
4.4. Smoking, Alcohol, and Coffee Interaction
4.5. Bias/Limitations
5. Conclusions
Acknowledgments
Conflict of Interest
References
- Parker, S.E.; Mai, C.T.; Canfield, M.A.; Rickard, R.; Wang, Y.; Meyer, R.E.; Anderson, P.; Mason, C.A.; Collins, J.S.; Kirby, R.S.; et al. Updated national birth prevalence estimates for selected birth defects in the United States, 2004–2006. Birth Defects Res. A: Clin. Mol. Teratol 2010, 88, 1008–1016. [Google Scholar] [CrossRef]
- Botto, L.D.; Moore, C.A.; Khoury, M.J.; Erickson, J.D. Neural-tube defects. N. Engl. J. Med. 1999, 341, 1509–1519. [Google Scholar] [CrossRef]
- Berry, R.J.; Li, Z.; Erickson, J.D.; Li, S.; Moore, C.A.; Wang, H.; Mulinare, J.; Zhao, P.; Wong, L.-Y.C.; Gindler, J.; et al. Prevention of neural-tube defects with folic acid in China. N. Engl. J. Med. 1999, 341, 1485–1490. [Google Scholar] [CrossRef]
- Czeizel, A.E.; Dudas, I. Prevention of the first occurrence of neural-tube defects by periconceptional vitamin supplementation. N. Engl. J. Med. 1992, 327, 1832–1835. [Google Scholar] [CrossRef]
- Werler, M.M.; Shapiro, S.; Mitchell, A.A. Periconceptional folic acid exposure and risk of occurrent neural tube defects. JAMA 1993, 269, 1257–1261. [Google Scholar] [CrossRef]
- MRC Vitamin Study Research Group. Prevention of neural tube defects: Results of the Medical Research Council Vitamin Study. Lancet. 1991, 338, pp. 131–137. Available online: http://www.thelancet.com/journals/lancet/article/PII0140-6736%2891%2990133-A/abstract (accessed on 30 July 2013).
- Tinker, S.C.; Cogswell, M.E.; Devine, O.; Berry, R.J. Folic acid intake among US women aged 15–44 years, National Health and Nutrition Examination Survey, 2003–2006. Am. J. Prev. Med. 2010, 38, 534–542. [Google Scholar] [CrossRef]
- Dietrich, M.; Brown, C.J.; Block, G. The effect of folate fortification of cereal-grain products on blood folate status, dietary folate intake, and dietary folate sources among adult non-supplement users in the United States. J. Am. Coll. Nutr. 2005, 24, 266–274. [Google Scholar] [CrossRef]
- Jacques, P.F.; Selhub, J.; Bostom, A.G.; Wilson, P.W.; Rosenberg, I.H. The effect of folic acid fortification on plasma folate and total homocysteine concentrations. N. Engl. J. Med. 1999, 340, 1449–1454. [Google Scholar] [CrossRef]
- Wasserman, C.R.; Shaw, G.M.; O’Malley, C.D.; Tolarova, M.M.; Lammer, E.J. Parental cigarette smoking and risk for congenital anomalies of the heart, neural tube, or limb. Teratology 1998, 53, 261–267. [Google Scholar]
- Suarez, L.; Felkner, M.; Brender, J.D.; Canfield, M.; Hendricks, K. Maternal exposures to cigarette smoke, alcohol, and street drugs and neural tube defect occurrence in offspring. Matern. Child Health J. 2008, 12, 394–401. [Google Scholar] [CrossRef]
- Schmidt, R.J.; Romitti, P.A.; Burns, T.L.; Browne, M.L.; Druschel, C.M.; Olney, R.S. Maternal caffeine consumption and risk of neural tube defects. Birth Defects Res. A: Clin. Mol. Teratol. 2009, 85, 879–889. [Google Scholar] [CrossRef]
- McDonald, A.D.; Armstrong, B.G.; Sloan, M. Cigarette, alcohol, and coffee consumption and congenital defects. Am. J. Public Health 1992, 82, 91–93. [Google Scholar] [CrossRef]
- Grewal, J.; Carmichael, S.L.; Ma, C.; Lammer, E.J.; Shaw, G.M. Maternal periconceptional smoking and alcohol consumption and risk for select congenital anomalies. Birth Defects Res. A: Clin. Mol. Teratol. 2008, 82, 519–526. [Google Scholar] [CrossRef]
- Källén, K. Maternal smoking, body mass index, and neural tube defects. Am. J. Epidemiol. 1998, 147, 1103–1111. [Google Scholar] [CrossRef]
- Friedman, J.M. Can maternal alcohol ingestion cause neural tube defects? J. Pediatr. 1982, 101, 232–234. [Google Scholar] [CrossRef]
- Makelarski, J.A.; Romitti, P.A.; Sun, L.; Burns, T.L.; Druschel, C.M.; Suarez, L.; Olshan, A.F.; Siega-Riz, A.M.; Olney, R.S.; National Birth Defects Prevention Study. Periconceptional maternal alcohol consumption and neural tube defects. Birth Defects Res. A: Clin. Mol. Teratol. 2013, 97, 152–160. [Google Scholar] [CrossRef]
- Momoi, N.; Tinney, J.P.; Liu, L.J.; Elshershari, H.; Hoffmann, P.J.; Ralphe, J.C.; Keller, B.B.; Tobita, K. Modest maternal caffeine exposure affects developing embryonic cardiovascular function and growth. Am. J. Physiol. Heart Circ. Physiol. 2008, 294, H2248–H2256. [Google Scholar] [CrossRef]
- Lewis, D.P.; van Dyke, D.C.; Stumbo, P.J.; Berg, M.J. Drug and environmental factors associated with adverse pregnancy outcomes. Part I: Antiepileptic drugs, contraceptives, smoking, and folate. Ann. pharmacother 1998, 32, 802–817. [Google Scholar] [CrossRef]
- Piyathilake, C.J.; Macaluso, M.; Hine, R.J.; Richards, E.W.; Krumdieck, C.L. Local and systemic effects of cigarette smoking on folate and vitamin B-12. Am. J. Clin. Nutr. 1994, 60, 559–566. [Google Scholar]
- Hillman, R.; Steinberg, S. The effects of alcohol on folate metabolism. Annu. Rev. Med. 1982, 33, 345–354. [Google Scholar] [CrossRef]
- Russell, R.M.; Rosenberg, I.H.; Wilson, P.D.; Iber, F.L.; Oaks, E.B.; Giovetti, A.C.; Otradovec, C.; Karwoski, P.; Press, A. Increased urinary excretion and prolonged turnover time of folic acid during ethanol ingestion. Am. J. Clin. Nutr. 1983, 38, 64–70. [Google Scholar]
- Ulvik, A.; Vollset, S.E.; Hoff, G.; Ueland, P.M. Coffee consumption and circulating B-vitamins in healthy middle-aged men and women. Clin. Chem. 2008, 54, 1489–1496. [Google Scholar] [CrossRef]
- Ahrens, K.; Yazdy, M.M.; Mitchell, A.A.; Werler, M.M. Folic acid intake and spina bifida in the era of dietary folic acid fortification. Epidemiology 2011, 22, 731–737. [Google Scholar] [CrossRef]
- Louik, C.; Lin, A.E.; Werler, M.M.; Hernández-Díaz, S.; Mitchell, A.A. First-trimester use of selective serotonin-reuptake inhibitors and the risk of birth defects. N. Engl. J. Med. 2007, 356, 2675–2683. [Google Scholar] [CrossRef]
- Mitchell, A.A.; Rosenberg, L.; Shapiro, S.; Slone, D. Birth defects related to Bendectin use in pregnancy. JAMA 1981, 245, 2311–2314. [Google Scholar] [CrossRef]
- Werler, M.M.; Hayes, C.; Louik, C.; Shapiro, S.; Mitchell, A.A. Multivitamin supplementation and risk of birth defects. Am. J. Epidemiol. 1999, 150, 675–682. [Google Scholar] [CrossRef]
- Institute of Medicine, Dietary Reference Intakes for Thiamin, Riboflavin, Niacin, Vitamin B6, Folate, Vitamin B12, Pantothenic Acid, Biotin, and Choline; National Academies Press: Washington, DC, USA, 1998.
- Willett, W.; Stampfer, M.J. Total energy intake: Implications for epidemiologic analyses. Am. J. Epidemiol. 1986, 124, 17–27. [Google Scholar]
- Release Version 9.2. SAS Institute Inc: Cary, NC., 2002–2008. Available online: http://www.sas.com/presscenter/guidelines.html (accessed on 30 July 2013).
- Yazdy, M.M.; Liu, S.; Mitchell, A.A.; Werler, M.M. Maternal dietary glycemic intake and the risk of neural tube defects. Am. J. Epidemiol. 2010, 171, 407–414. [Google Scholar] [CrossRef]
- Yau, W.P.; Mitchell, A.A.; Lin, K.J.; Werler, M.M.; Hernandez-Diaz, S. Use of decongestants during pregnancy and the risk of birth defects. Am. J. Epidemiol. 2013, 178, 198–208. [Google Scholar] [CrossRef]
- Martínez-Frías, M.L.; Bermejo, E.; Rodríguez-Pinilla, E.; Frías, J.L. Risk for congenital anomalies associated with different sporadic and daily doses of alcohol consumption during pregnancy: A case-control study. Birth Defects Res. A: Clin. Mol. 2004, 70, 194–200. [Google Scholar] [CrossRef]
- Shaw, G.M.; Nelson, V.; Carmichael, S.L.; Lammer, E.J.; Finnell, R.H.; Rosenquist, T.H. Maternal periconceptional vitamins: Interactions with selected factors and congenital anomalies? Epidemiology 2002, 13, 625–630. [Google Scholar] [CrossRef]
- Kurppa, K.; Holmberg, P.C.; Kuosma, E.; Saxén, L. Coffee consumption during pregnancy and selected congenital malformations: A nationwide case-control study. Am. J. Public Health 1983, 73, 1397–1399. [Google Scholar] [CrossRef]
- Rosenberg, L.; Mitchell, A.A.; Shapiro, S.; Slone, D. Selected birth defects in relation to caffeine-containing beverages. JAMA 1982, 247, 1429–1432. [Google Scholar] [CrossRef]
- Seidman, D.S.; Ever-Hadani, P.; Gale, R. Effect of maternal smoking and age on congenital anomalies. Obstet. Gynecol. 1990, 76, 1046–1050. [Google Scholar]
- Evans, D.R.; Newcombe, R.G.; Campbell, H. Maternal smoking habits and congenital malformations: A population study. Br. Med. J. 1979, 2, 171–173. [Google Scholar] [CrossRef]
- Malloy, M.H.; Kleinman, J.C.; Bakewell, J.M.; Schramm, W.F.; Land, G.H. Maternal smoking during pregnancy: No association with congenital malformations in Missouri 1980–83. Am. J. Public Health 1989, 79, 1243–1246. [Google Scholar] [CrossRef]
- Shiono, P.H.; Klebanoff, M.A.; Berendes, H.W. Congenital malformations and maternal smoking during pregnancy. Teratology 1986, 34, 65–71. [Google Scholar] [CrossRef]
- Kelsey, J.L.; Dwyer, T.; Holford, T.R.; Bracken, M.B. Maternal smoking and congenital malformations: An epidemiological study. J. Epidemiol. Community Health 1978, 32, 102–107. [Google Scholar] [CrossRef]
- Shaw, G.M.; Velie, E.M.; Morland, K.B. Parental recreational drug use and risk for neural tube defects. Am. J. Epidemiol. 1996, 144, 1155–1160. [Google Scholar] [CrossRef]
- Suarez, L.; Ramadhani, T.; Felkner, M.; Canfield, M.A.; Brender, J.D.; Romitti, P.A.; Sun, L. Maternal smoking, passive tobacco smoke, and neural tube defects. Birth Defects Res. A: Clin. Mol. Teratol. 2011, 91, 29–33. [Google Scholar] [CrossRef]
- Colman, G.J.; Joyce, T. Trends in smoking before, during, and after pregnancy in ten states. Am. J. Prev. Med. 2003, 24, 29–35. [Google Scholar] [CrossRef]
- Mathews, T.J. Smoking During Pregnancy in the 1990s. In National Vital Statistics Reports; National Center for Health Statistics: Hyattsville, MD, USA, 2001; Volume 49. [Google Scholar]
- Ebrahim, S.H.; Floyd, R.L.; Merritt, R.K., II; PDecoufle, P. Trends in pregnancy-related smoking rates in the united states, 1987–1996. JAMA 2000, 283, 361–366. [Google Scholar] [CrossRef]
- Mateja, W.A.; Nelson, D.B.; Kroelinger, C.D.; Ruzek, S.; Segal, J. The association between maternal alcohol use and smoking in early pregnancy and congenital cardiac defects. J. Womens Health 2012, 21, 26–34. [Google Scholar] [CrossRef]
- Jacobson, S.W.; Jacobson, J.L.; Sokol, R.J.; Martier, S.S.; Ager, J.W.; Kaplan, M.G. Maternal recall of alcohol, cocaine, and marijuana use during pregnancy. Neurotoxicol. Teratol. 1991, 13, 535–540. [Google Scholar] [CrossRef]
- Paganini-Hill, A.; Ross, R.K. Reliability of recall of drug usage and other health-related information. Am. J. Epidemiol. 1982, 116, 114–122. [Google Scholar]
- Tomeo, C.A.; Rich-Edwards, J.W.; Michels, K.B.; Berkey, C.S.; Hunter, D.J.; Frazier, A.L.; Willett, W.C.; Buka, S.L. Reproducibility and validity of maternal recall of pregnancy-related events. Epidemiology 1999, 10, 774–776. [Google Scholar] [CrossRef]
- Yawn, B.P.; Suman, V.J.; Jacobsen, S.J. Maternal recall of distant pregnancy events. J. Clin. Epidemiol. 1998, 51, 399–405. [Google Scholar] [CrossRef]
- George, L.; Granath, F.; Johansson, A.L.; Cnattingius, S. Self-reported nicotine exposure and plasma levels of cotinine in early and late pregnancy. Acta obstetricia et gynecologica Scandinavica 2006, 85, 1331–1337. [Google Scholar] [CrossRef]
- Ford, R.; Tappin, D.; Schluter, P.; Wild, C. Smoking during pregnancy: How reliable are maternal self reports in New Zealand? J. Epidemiol. Community Health 1997, 51, 246–251. [Google Scholar] [CrossRef]
- Schliep, K.C.; Schisterman, E.F.; Mumford, S.L.; Perkins, N.J.; Ye, A.; Pollack, A.Z.; Zhang, C.; Porucznik, C.A.; VanDerslice, J.A.; Stanford, J.B. Validation of different instruments for caffeine measurement among premenopausal women in the BioCycle study. Am. J. Epidemiol. 2013, 177, 690–699. [Google Scholar] [CrossRef]
© 2013 by the authors; licensee MDPI, Basel, Switzerland. This article is an open access article distributed under the terms and conditions of the Creative Commons Attribution license (http://creativecommons.org/licenses/by/3.0/).
Share and Cite
Benedum, C.M.; Yazdy, M.M.; Mitchell, A.A.; Werler, M.M. Risk of Spina Bifida and Maternal Cigarette, Alcohol, and Coffee Use during the First Month of Pregnancy. Int. J. Environ. Res. Public Health 2013, 10, 3263-3281. https://doi.org/10.3390/ijerph10083263
Benedum CM, Yazdy MM, Mitchell AA, Werler MM. Risk of Spina Bifida and Maternal Cigarette, Alcohol, and Coffee Use during the First Month of Pregnancy. International Journal of Environmental Research and Public Health. 2013; 10(8):3263-3281. https://doi.org/10.3390/ijerph10083263
Chicago/Turabian StyleBenedum, Corey M., Mahsa M. Yazdy, Allen A. Mitchell, and Martha M. Werler. 2013. "Risk of Spina Bifida and Maternal Cigarette, Alcohol, and Coffee Use during the First Month of Pregnancy" International Journal of Environmental Research and Public Health 10, no. 8: 3263-3281. https://doi.org/10.3390/ijerph10083263