Article

Genome-Wide Identification and Characterization of SODs in Zhikong Scallop Reveals Gene Expansion and Regulation Divergence after Toxic Dinoflagellate Exposure

1
MOE Key Laboratory of Marine Genetics and Breeding, Ocean University of China, Qingdao 266003, China
2
Laboratory for Marine Fisheries Science and Food Production Processes, Qingdao National Laboratory for Marine Science and Technology, Qingdao 266237, China
3
Laboratory for Marine Biology and Biotechnology, Qingdao National Laboratory for Marine Science and Technology, Qingdao 266237, China
*
Author to whom correspondence should be addressed.
These authors contributed equally to this work.
Mar. Drugs 2019, 17(12), 700; https://doi.org/10.3390/md17120700
Submission received: 12 November 2019 / Revised: 29 November 2019 / Accepted: 5 December 2019 / Published: 12 December 2019
(This article belongs to the Special Issue Chemical Defense in Marine Organisms)

Abstract

:
As filter-feeding animals mainly ingesting microalgae, bivalves could accumulate paralytic shellfish toxins (PSTs) produced by harmful algae through diet. To protect themselves from the toxic effects of PSTs, especially the concomitant oxidative damage, the production of superoxide dismutase (SOD), which is the only eukaryotic metalloenzyme capable of detoxifying superoxide, may assist with toxin tolerance in bivalves. To better understand this process, in the present study, we performed the first systematic analysis of SOD genes in bivalve Chlamys farreri, an important aquaculture species in China. A total of six Cu/Zn-SODs (SOD1-6) and two Mn-SODs (SOD7, SOD8) were identified in C. farreri, with gene expansion being revealed in Cu/Zn-SODs. In scallops exposed to two different PSTs-producing dinoflagellates, Alexandrium minutum and A. catenella, expression regulation of SOD genes was analyzed in the top ranked toxin-rich organs, the hepatopancreas and the kidney. In hepatopancreas, which mainly accumulates the incoming PSTs, all of the six Cu/Zn-SODs showed significant alterations after A. minutum exposure, with SOD1, 2, 3, 5, and 6 being up-regulated, and SOD4 being down-regulated, while no significant change was detected in Mn-SODs. After A. catenella exposure, up-regulation was observed in SOD2, 4, 6, and 8, and SOD7 was down-regulated. In the kidney, where PSTs transformation occurs, SOD4, 5, 6, and 8 were up-regulated, and SOD7 was down-regulated in response to A. minutum feeding. After A. catenella exposure, all the Cu/Zn-SODs except SOD1 were up-regulated, and SOD7 was down-regulated in kidney. Overall, in scallops after ingesting different toxic algae, SOD up-regulation mainly occurred in the expanded Cu/Zn-SOD group, and SOD6 was the only member being up-regulated in both toxic organs, which also showed the highest fold change among all the SODs, implying the importance of SOD6 in protecting scallops from the stress of PSTs. Our results suggest the diverse function of scallop SODs in response to the PST-producing algae challenge, and the expansion of Cu/Zn-SODs might be implicated in the adaptive evolution of scallops or bivalves with respect to antioxidant defense against the ingested toxic algae.

1. Introduction

Reactive oxygen species (ROS) are the active partially excited forms of oxygen that are usually unavoidably generated as by-products of aerobic metabolism and can damage multiple cellular components [1]. Superoxide dismutase (SOD) (EC 1.15.1.1) is the only eukaryotic metalloenzyme capable of detoxifying superoxide, one type of ROS, principally acting as the first and most important line of antioxidant defense among all eukaryotic organisms [1,2]. Based on distinct catalytic metal cofactors, superoxide dismutases have been classified as copper/zinc SODs and manganese SODs in eukaryotic animals [3]. Usually, Mn-SODs are considered as an early evolutionary form of SODs, since they were found mainly in mitochondria, the organelle which is thought have originally been independent organisms and were symbiotically fused into eukaryotes one billion years ago [4]. Cu/Zn-SODs reside in both the extracellular milieu and numerous intracellular compartments, such as the cytoplasm, lysosomes, peroxisomes, and nuclei, and are likely to be the most recently evolved forms [5]. Multiple lines of evidence have shown that SOD genes are sensitive to stress [2,6], and altered SOD regulation has been implicated in a broad range of physically deteriorative states, including abnormal development [7], neurodegeneration [8,9,10], immunosuppression [11,12], and neoplasm formation [13,14]. Previous studies also revealed that SOD genes were involved in response to toxic challenge. For instance, in zebrafish, researchers found that low concentrations of toxic HgCl2 exposure could significantly induce the expression of Cu/Zn-SOD in muscle, with dose-dependent enhancement of SOD activity [15]. In muscle afferent DRG (dorsal root ganglia) neurons of rats, a lower superoxide level owing to the addition of SOD could modulate the current of voltage-gated sodium channels (Nav), the main target site under tetrodotoxin stress [16].
Bivalve mollusk, as descendants of an early Cambrian lineage that appeared over 500 million years ago, are well adapted to benthic filter feeding and thrive in highly dynamic oceans and freshwater environments with a variety of stressors. SODs are reported to be inducible in bivalves through biotic and/or abiotic factors, such as toxicants [17], hypoxia [18], and pathogenic organisms [19], and SODs could appear in response to large fluctuation in water temperature and salinity [20,21]. As natural filter feeders on algae, bivalve mollusk can accumulate toxins produced by the ingested algae, especially during harmful algal blooms [22,23]. Paralytic shellfish toxins (PSTs) mainly produced by dinoflagellates are among the most potent marine biotoxins [24,25], which can bind to the Nav, causing the blockage of neuronal activity [22,26]. Although bivalves can tolerate much higher concentrations of PSTs than human and other mammals, largely due to possessing toxin-resistant amino acids in Nav, PSTs accumulation causes changes in the behaviors and metabolism processes of bivalves [27,28,29]. ROS production and alternation of SOD activity occurred in PST-contaminated bivalve [28,30], making antioxidant defense a sine qua non for coping with PSTs. For example, Cao et al. documented that, under saxitoxin (STX, the most potent PST) exposure, SOD activity was significantly increased in oyster Crassostrea gigas and scallop Chlamys farreri [31]. SOD activity was also found to be induced in muscle and hepatopancreas of mussels (Mytilus galloprovincialis) fed with toxic Alexandrium tamarense [32]. However, the involvement of bivalve SODs in response to PST producing algae might be species-or tissue-specific, as no change of SOD activity was observed in mantle and hepatopancreas of scallop Nodipecten subnodosus exposed to Gymnodinium catenatum but decreased in gill and muscle [33]. Therefore, more research is needed to explore the functions of SODs and antioxidant system in bivalves. Considering that SOD activity was exerted by the proteins expressed by several SOD genes, the systematic analysis of SODs in bivalve genomes and their expression regulation during PSTs producing algae exposure, could increase our understanding of the roles of SODs in antioxidant defense against toxic algae, as related studies are currently very limited.
Compared with many other bivalve species, the scallop could accumulate PSTs with higher concentrations and longer retention times [34], making it an ideal species for research on toxin stress and tolerance in bivalves. In the present study, we performed systematic identification of SOD genes in Zhikong scallop, C. farreri (Jones et Preston, 1904), a Chinese native species which has been repeatedly reported for PSTs contamination [25,31]. We also analyzed the spatiotemporal expression patterns of all the SOD family members, and their transcriptional responses to the exposure of PST producing algae, A. minutum (strain AM-1) and A. catenella (strain ACDH), in the two most toxic organs, hepatopancreas and kidney of C. farreri. To the best of our knowledge, this is the first comprehensive study of the SOD gene family in bivalves, notably providing valuable information regarding the classification, evolution, and putative functions of these genes. Additionally, the diverse expression regulation of scallop SODs in response to toxic algae exposure between organs and between algae species will improve our understanding of PST-induced antioxidant responses and protection in bivalves.

2. Results and Discussion

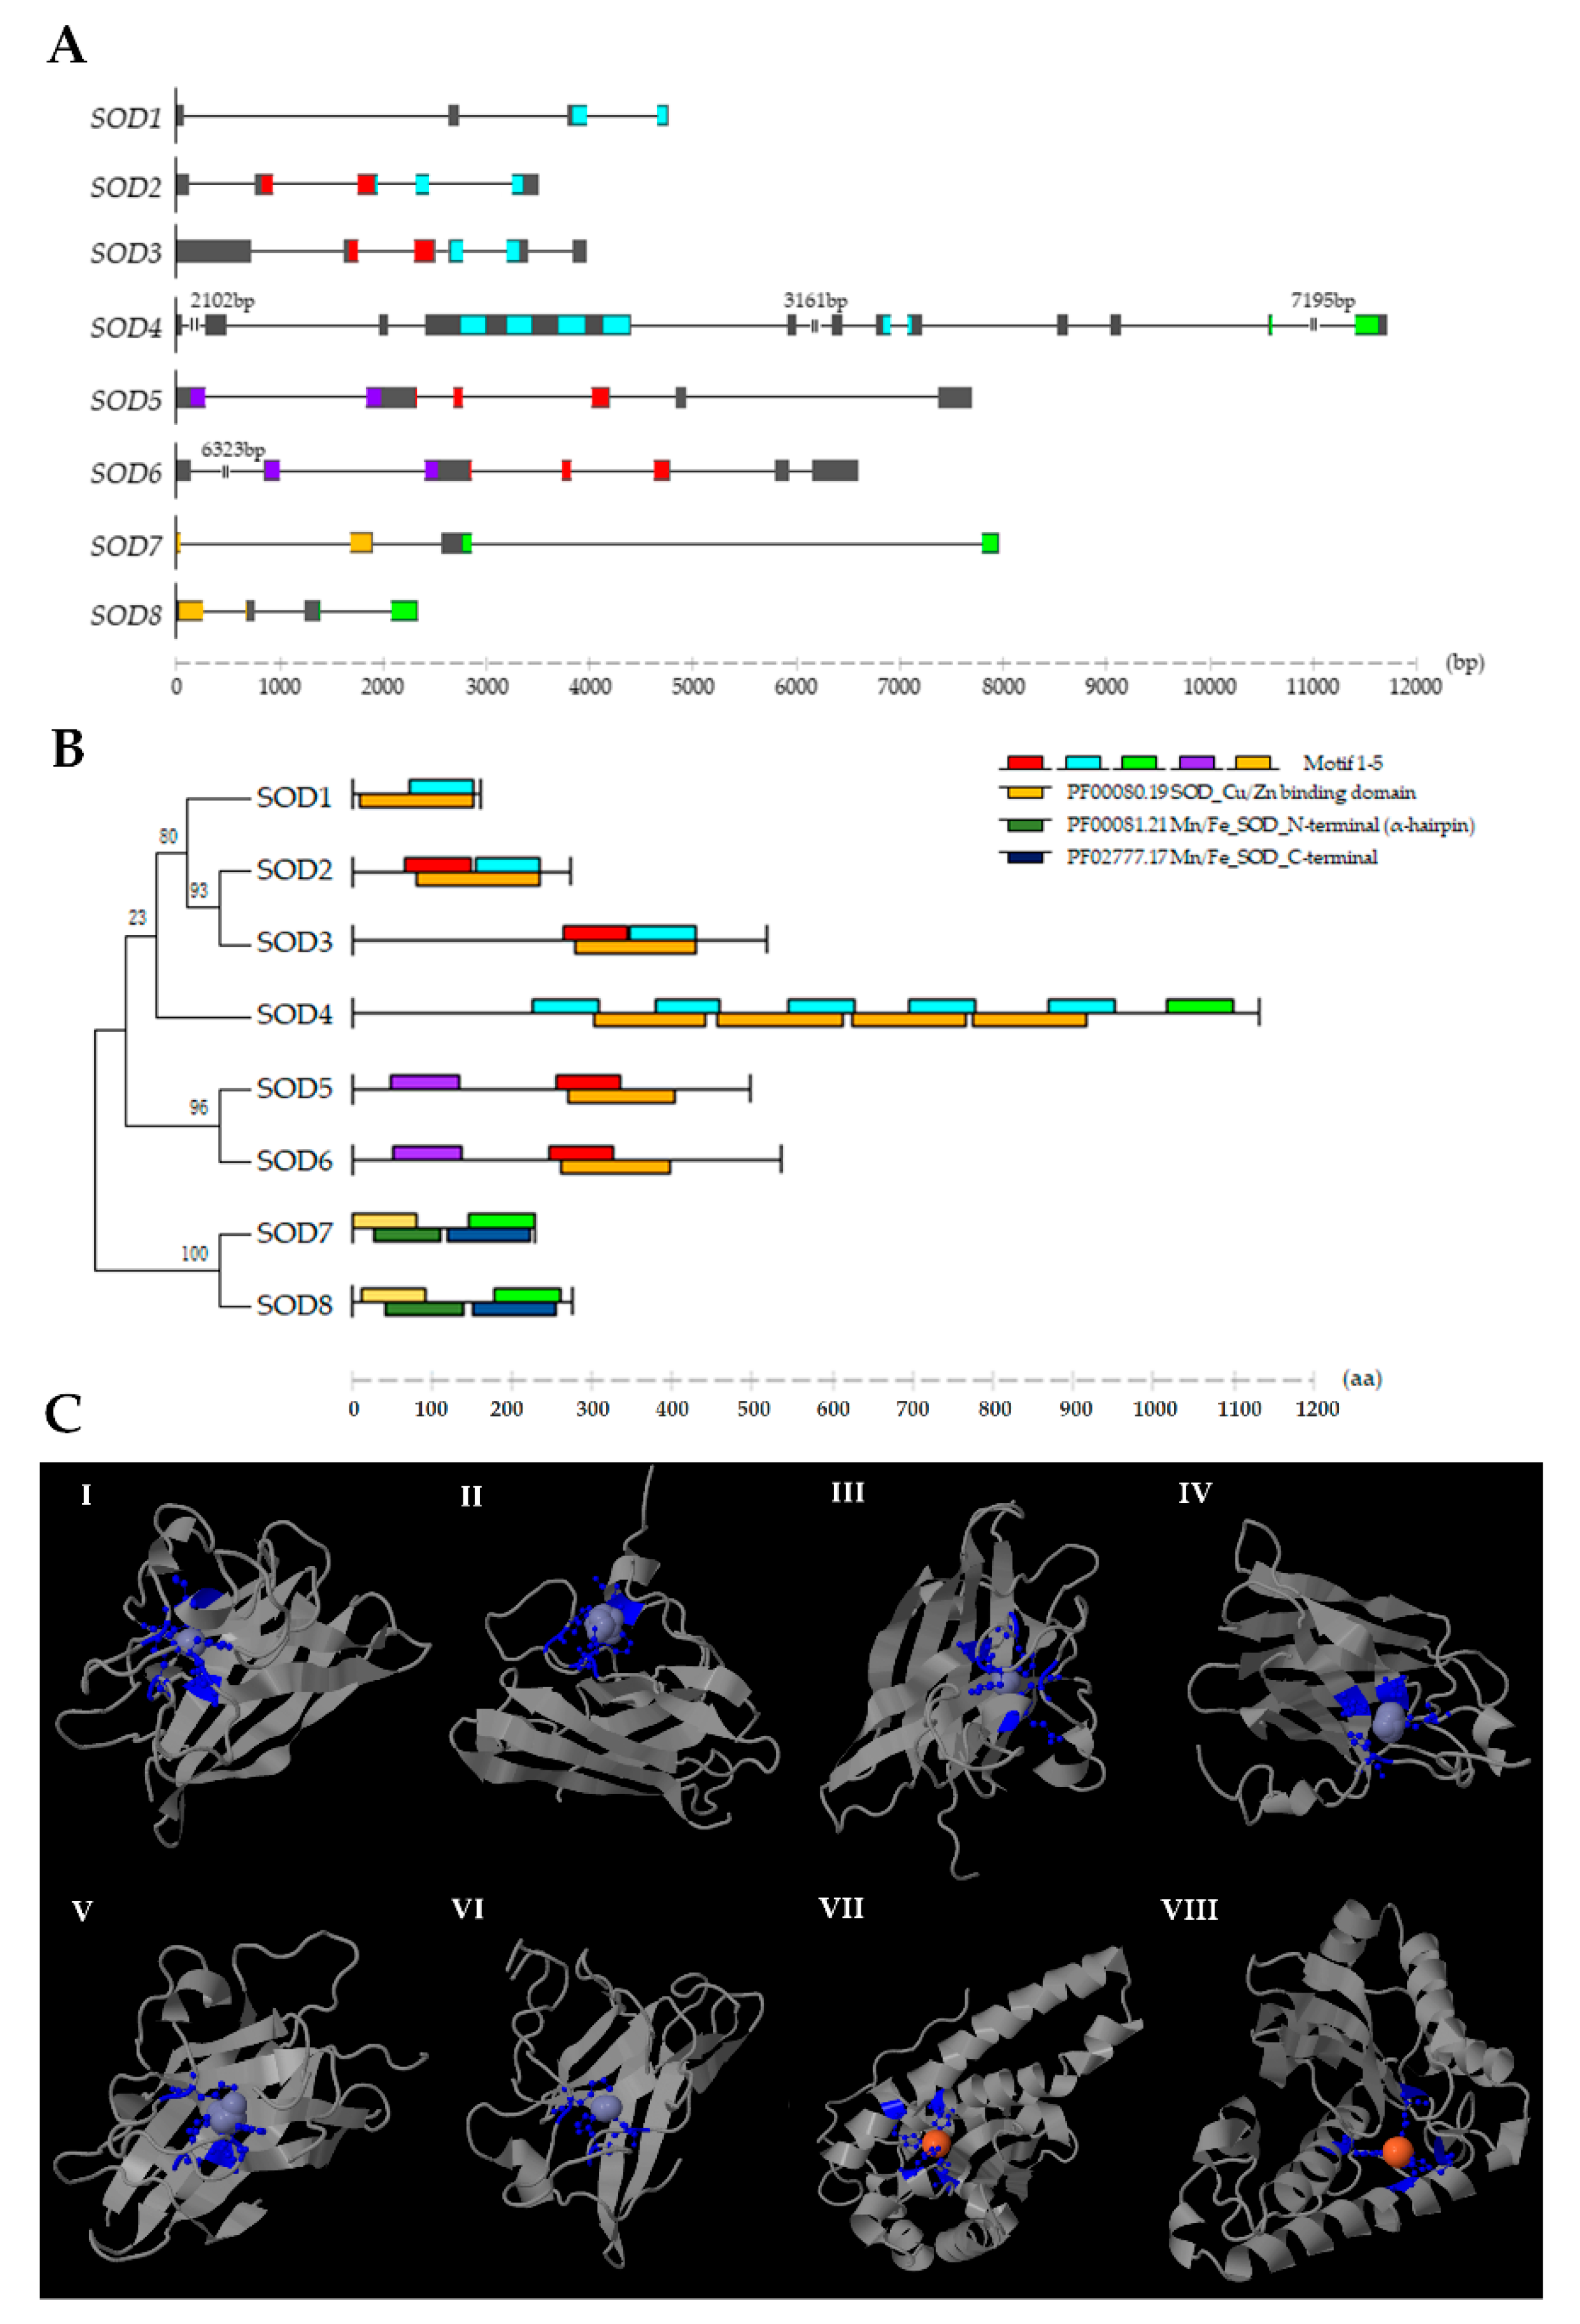
2.1. Identification of SOD Genes in C. farreri

In mammals, only three unique and highly compartmentalized SODs have been identified. By contrast, a total of eight SODs, including six Cu/Zn-SODs (SOD1-6) and two Mn-SODs (SOD7, 8), have been found in the C. farreri genome, revealing the expansion of Cu/Zn-SOD. To further test whether other marine animals showed expansion phenomena of the SOD family, we also retrieved SOD genes in oyster C. gigas, snail Biomphalaria glabrata, and sea urchin Strongylocentrotus purpuratus, and our results showed that more than six SOD members were present in these species. It is noteworthy that, just as in C. farreri, most SOD expansion events in these marine animals occurred within the Cu/Zn group. Among Cu/Zn-SODs, SOD2, and SOD3 were found to be located on the same chromosome in C. farreri, indicating that tandem gene duplication may occur. The two Mn-SODs in C. farreri were found respectively localized on chromosomes 2 and 19.
Various exon/intron organization patterns of SOD genes are presented in C. farreri (Figure 1A), and the number of introns were identified to range between three and nine. According to sequence analysis, the ORF lengths of SOD genes in C. farreri were from 462 to 3348 bp, and the encoded proteins containing 153 to 1115 amino acids. Most of the SOD proteins were predicted to be stable (instability index ≤40), and all the SODs were found to be hydrophilic based on a grand average of hydropathicity (GRAVY) analysis (the aliphatic index ranged from 44.73 to 88.45) (Table 1). The C. farreri Mn-SODs were found to be acidic, whereas the Cu/Zn-SODs showed variable isoelectric point (pI) values, with two members (SOD3 and SOD4) being basic in character.
For all Cu/Zn-SODs in C. farreri, Motif 1 or 2 which contained conserved copper ligands and the site involved in a disulfide bond could be detected (Figure 1B and Table 2), and they possess the topological signature of β-barrels with ligand clusters localized on the exterior (Figure 1C). The sub-cellular predictions showed that SOD1 was localized in the cytoplasm; SOD2, SOD3, and SOD4 were mainly transported to the extracellular milieu; and first time in animals, we found two specific nucleus localized Cu/Zn-SODs (SOD5 and SOD6) in C. farreri. This finding was consistent with the results from the motif analysis that revealed a motif 4 which was classified as a specific ZapB domain (E-value: 1.2e-06) with a nuclear localization signal (score: 10) present in SOD5 and SOD6, and this ZapB domain has been reported to contribute to forming a coiled-coil structure and being involved in cell division [35] (Figure 1B). Notably, an unexpected motif 3 which contained manganese/iron ligands and showed conserved “D-x-[WF]-E-H-[STA]-[FY] (2)” Mn/Fe-SOD signature was found to be present at the C terminus of the “extremely long” Cu/Zn-SOD4 (Table 2). Meantime, a Fe ligand-bound Cys283 was also detected in SOD4 (Table S1), indicating that SOD4 might be a novel combined or transient SOD type with a complex catalytic metal ion-binding activity in C. farreri. In addition, SOD4 caught our notice due to its quadruple SOD_Cu domains, which were not found or reported in animals. We further retrieved SOD proteins from several mollusk species, and Cu/Zn-SODs with triple/quadruple SOD_Cu domains were also found in B. glabrata (XP_013062920.1), C. gigas (XP_019923318.1; XP_011414606.1), Pinctada fucata (ALK82329.1), and Lottia gigantea (V4AP91), which is suggestive of a mollusk-specific SOD type which originated from the common ancestor of these animals.
Mn-SODs in C. farreri possess both Motif 3 and 5, and SOD7 exhibited mitochondrial localization, while SOD8, for the first time in bivalves, was a SOD demonstrated to be a specific cytosolic type. Similar to bay scallop [36], the polypeptide chains of C. farreri Mn-SODs are divided into N-terminal helices and a C-terminal α/β domain, with the active metal ligand in the interior. The metal ion of Mn-SODs in C. farreri was found to be coordinated in a strained trigonal bipyramidal geometry by four amino acid side chains: His52-His100-Asp185-His189 and His61-His125-Asp214-His218 in SOD7 and SOD8, respectively. In the present study, all 3D models were validated by Ramachandran plot analysis (Figure S1), and the results showed that residues in the favored region ranged from 87.0% to 98.5%, and less than 3.8% were found in the outlier region, indicating fairly good quality (Table S3).

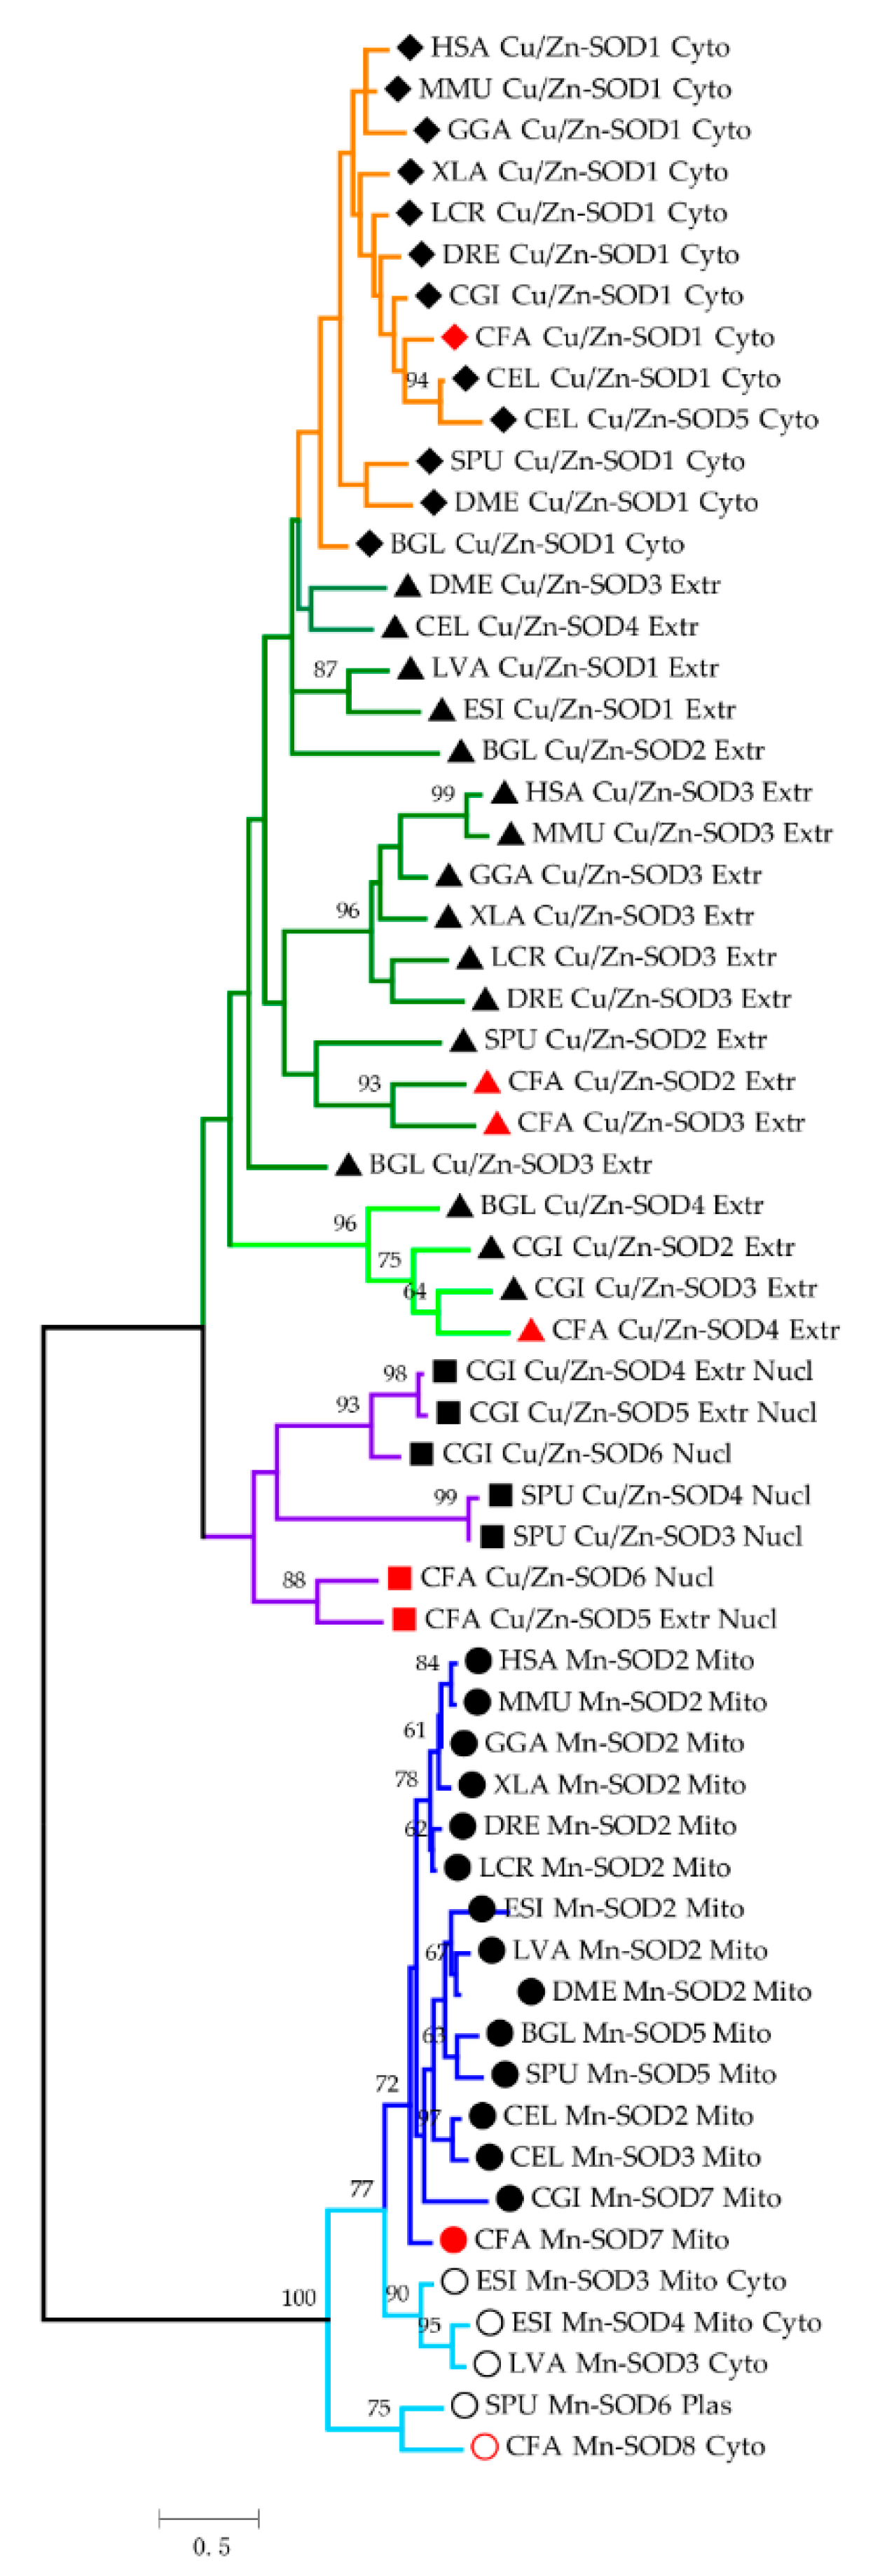
2.2. Phylogenetic Analysis of SODs

Based on polygenetic analysis (Figure 2), distinct evolutionary paths for Mn- SODs and Cu/Zn-SODs with varying degrees of protein conservation were observed. In addition, SOD members with different subcellular locations diverged from each other at early stages of evolution, prior to the differentiation of invertebrates and vertebrates, suggesting the rapid sequence divergence of SODs. All mitochondrial Mn-SODs across 14 species were clustered together, and two branches formed by vertebrates and invertebrates could be tracked, indicating highly conserved protein structures and evolutionary lineages. Prior to mitochondrial Mn-SODs, the cytosolic Mn-SODs near the phylogenetic root were clustered together firstly, indicating that these two types of Mn-SODs diverged long ago.
All the Cu/Zn-SODs in eukaryotes formed a large clade and comprising three subgroups, highly consistent with the subcellular predictions. Obviously, the cytosolic Cu/Zn-SODs (indicated by an orange color) detected across all species were clustered together, except in L. vannamei and E. sinensis since they do not have cytosolic Cu/Zn-SOD in their genome. Aquatic crustaceans have been reported to usually lack cytosolic Cu/Zn-SODs, and the relatively ancient cytosolic Mn-SODs might be linked to the fluctuation in copper metabolism induced by the special copper-dependent oxygen carrier protein hemocyanin [37,38,39,40]. For extracellular Cu/Zn-SODs with single functional domain, a clear branch for vertebrate Cu/Zn-SOD3 was detected, with conserved vertebrate-specific residues being found (Figure S2). In this context, the branch represented in light green (96% bootstrap value) was restricted to mollusk-specific extracellular Cu/Zn-SODs, which is attributed to the multiple tandem SOD_Cu domains. In addition, the potential ancient nuclear Cu/Zn-SODs (purple color) were only found from the phyla Molluska (C. farreri, C. gigas) and Echinodermata (S. purpuratus). The complex phylogenetic relationship of Cu/Zn-SODs may be due to their flexible plastic N- and C-termini decorated with localization signal peptides, and Cu/Zn-SODs may have evolved independently multiple times after the divergence of different lineages [41,42], indicating the differential interspecific evolution rates as well as rapid intraspecific sequence divergence of these proteins.

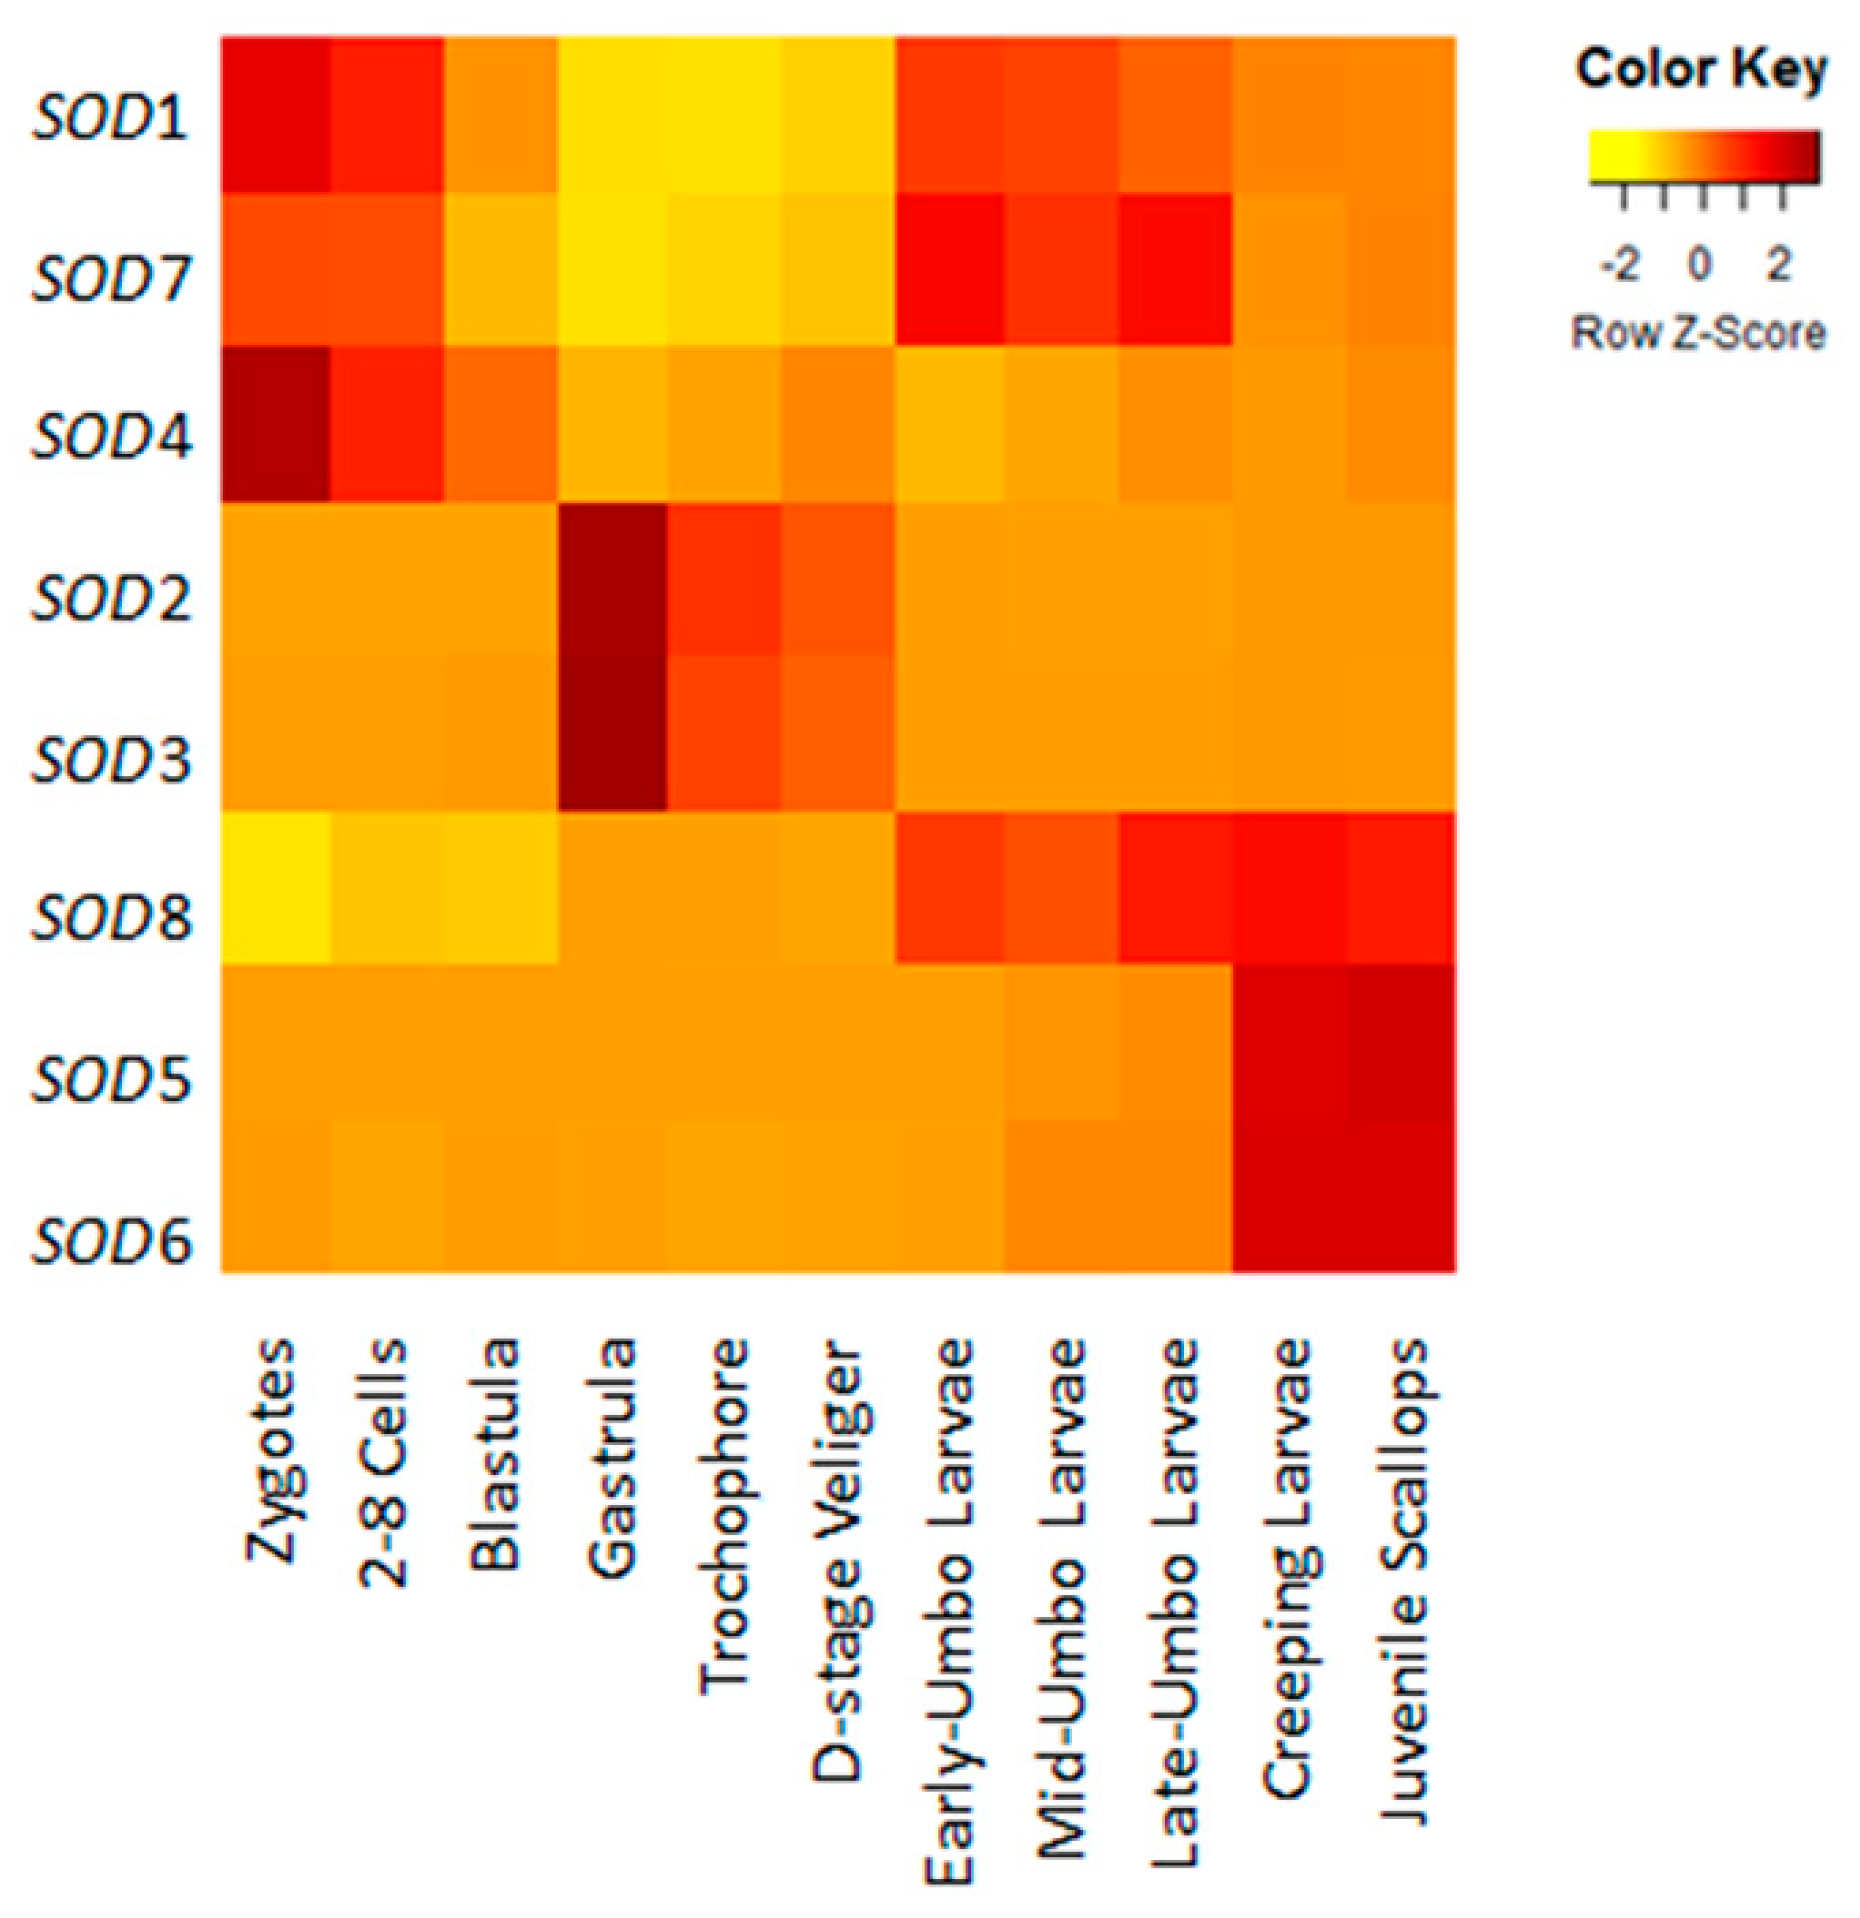
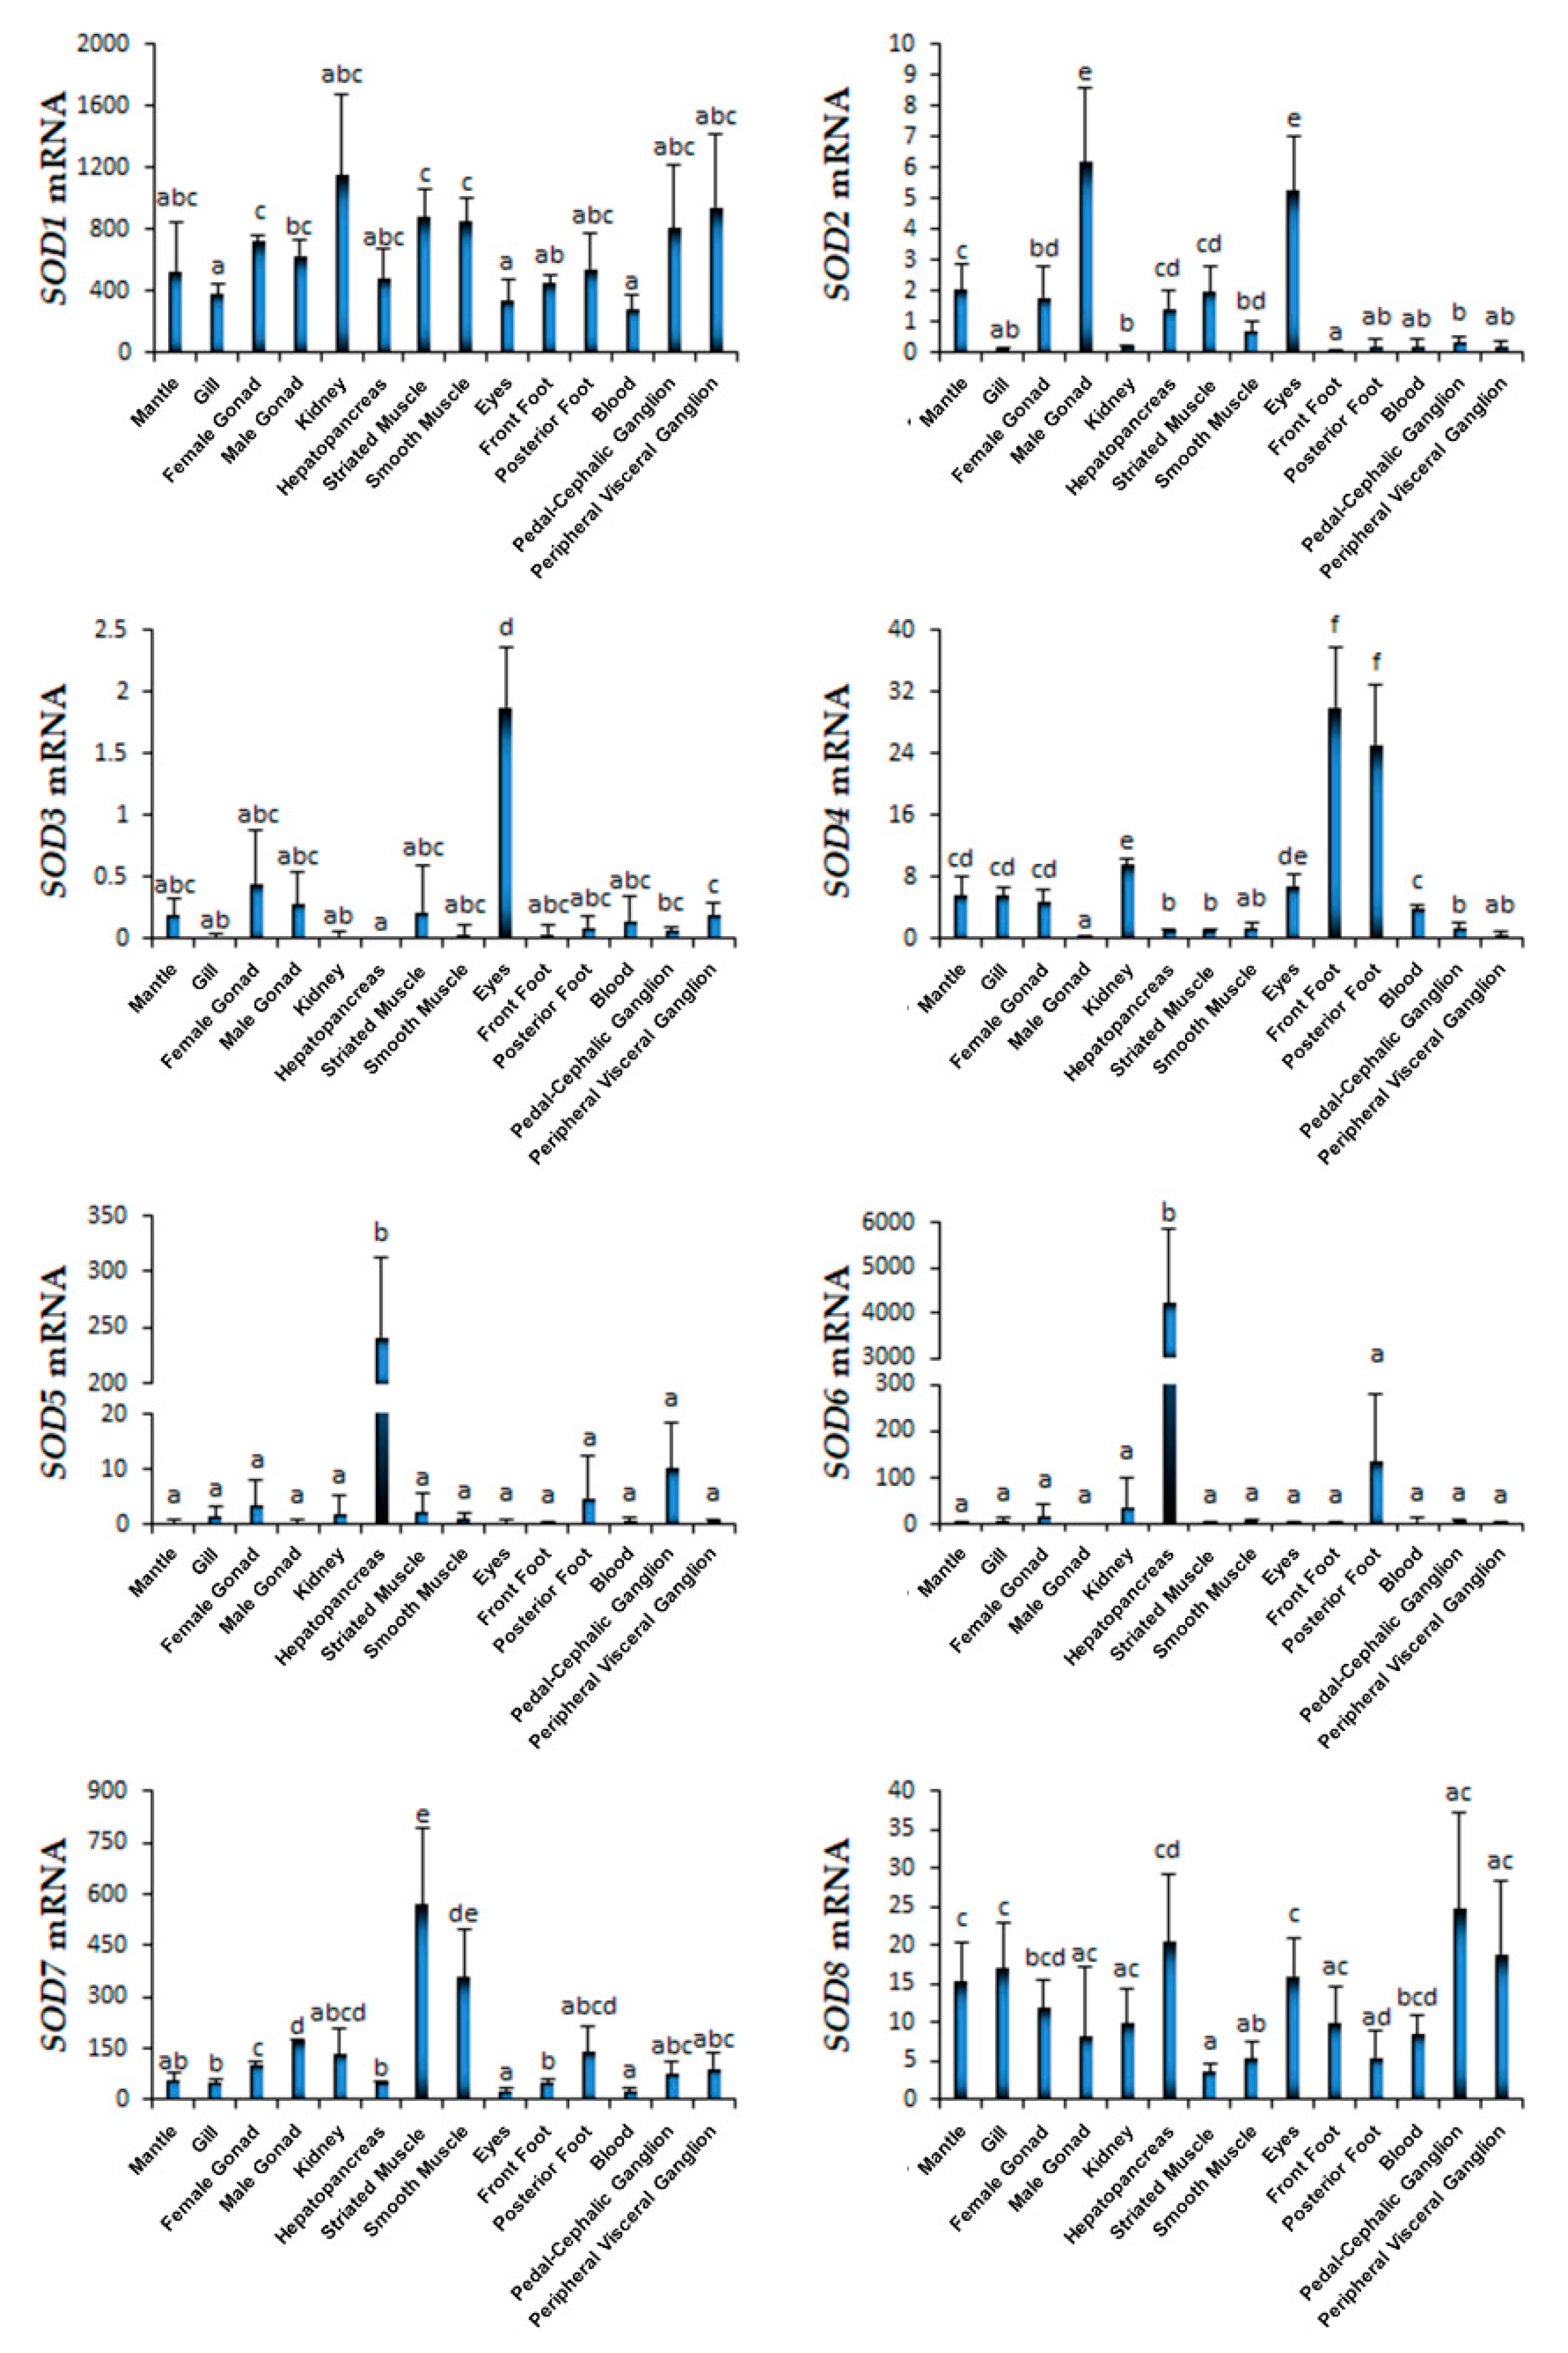
2.3. Spatiotemporal Expression Profiles of Scallop SODs During Development and in Adult Organs/Tissues

During embryonic and larval development, the temporal activation of SOD genes and their expression patterns could be clearly distinguished in C. farreri (Figure 3). In multicellular stage, a set of SOD transcripts, including cytosolic Cu/Zn-SOD1, extracellular Cu/Zn-SOD4, and mitochondrial Mn-SOD7, were detected at the very beginning of fertilization and exhibited high expression until blastula formation, suggesting their maternal origin to play protective roles and to help maintain a redox balance during fertilization and cell cleavage. Afterwards, dominant expression was observed for extracellular Cu/Zn-SOD2 and Cu/Zn-SOD3 during gastrulation, from which more than 200-fold elevated mRNA level was detected, and their high expression was maintained until D-stage veliger formation. When get into umbo larvae development, the expression levels of SOD1 and SOD7 were respectively enhanced 3.3-and 12.2-fold again, together with a significant activation of cytosolic Mn-SOD8. Nevertheless, only Mn-SOD8 could exhibit persistent high expression in creeping larvae as well as in juvenile scallops, during which the expression of nuclear Cu/Zn-SOD5 and Cu/Zn-SOD6 was remarkedly increased. The participation of SODs in gastrulation and metamorphosis has been found by several lines of evidence, including in prawn [43], seabass [44], frog [45], fruit fly [46], and chicken [47], which may due to the elevation of oxygen consumption to meet the high demands of energy reserve utilization during organ initiation and structural remodelling. Studies in mouse embryos also found that, regardless of whether fertilization had occurred in vivo or in vitro, addition of SOD led to a protective effect against oxidative stress on both sperm viability and fertilized embryos [48]. Thus, the explicit temporal expression patterns of SODs observed in the present study may suggest their important roles in key processes during development, indicating the indispensability of SODs for organ/tissue initiation and maturation in C. farreri.
We further investigated the transcriptional profiles of SOD genes in 14 organs/tissues of adult scallop (Figure 4). Clearly, SOD1 was the only Cu/Zn-SOD showed widespread expression in all the examined organs/tissues with significantly higher read per kilobase of exon model per million mapped reads (RPKM) values (p < 0.001) than most of the other SODs; relatively high levels were detected in kidneys, muscles, and ganglions. Similar widespread tissue expression was observed for cytosolic Mn-SOD8, while the transcript amount was much lower than that of SOD1. Hepatopancreas and ganglions showed higher expression of Mn-SOD8 than other organs/tissues. The expression of extracellular Cu/Zn-SOD2 and Cu/Zn-SOD3 was much lower than other SOD genes, with the male gonad exhibiting a high level of SOD2 and the eye showing a high expression for both SOD2 and SOD3. Similar results have been reported during investigation of mammal extracellular SODs, which revealed the protective function of extracellular SOD in the corneal endothelium [49,50] and on the Sertoli/germ cell surface in testicles [51]. Of note, the dominant transcript mRNA of extracellular Cu/Zn-SOD4 was found in the foot/byssus of C. farreri. Similarly, the same extracellular Cu/Zn-SOD (ALK82329.1) with a quadruple SOD_Cu domain was identified from the distal thread region of the byssus in P. fucata, and the researchers proposed that extracellular SOD could be required for prevention of the degradation of threads within the oxidative seawater environment [52]. The tissue expression of nuclear Cu/Zn-SOD5 and Cu/Zn-SOD6 caught our attention due to their outstanding hepatopancreas-specific expression, with more than 900-fold enhancement compared with other tissues, indicating a specialized tissue-specific function. Interestingly, the mitochondrial Mn-SOD7 in C. farreri showed rather high levels in the striated muscle and smooth muscle, the primary organs associated with energy and mobility in scallops [25], implying this gene play important roles against oxidative stress in muscle. Previous study of mice found that conditional knockout of Mn-SOD targeted to type IIB skeletal muscle fibers not only can lead to oxidative stress enhance, but also is sufficient to reduce contractile muscle force and alter aerobic exercise capacity [53].

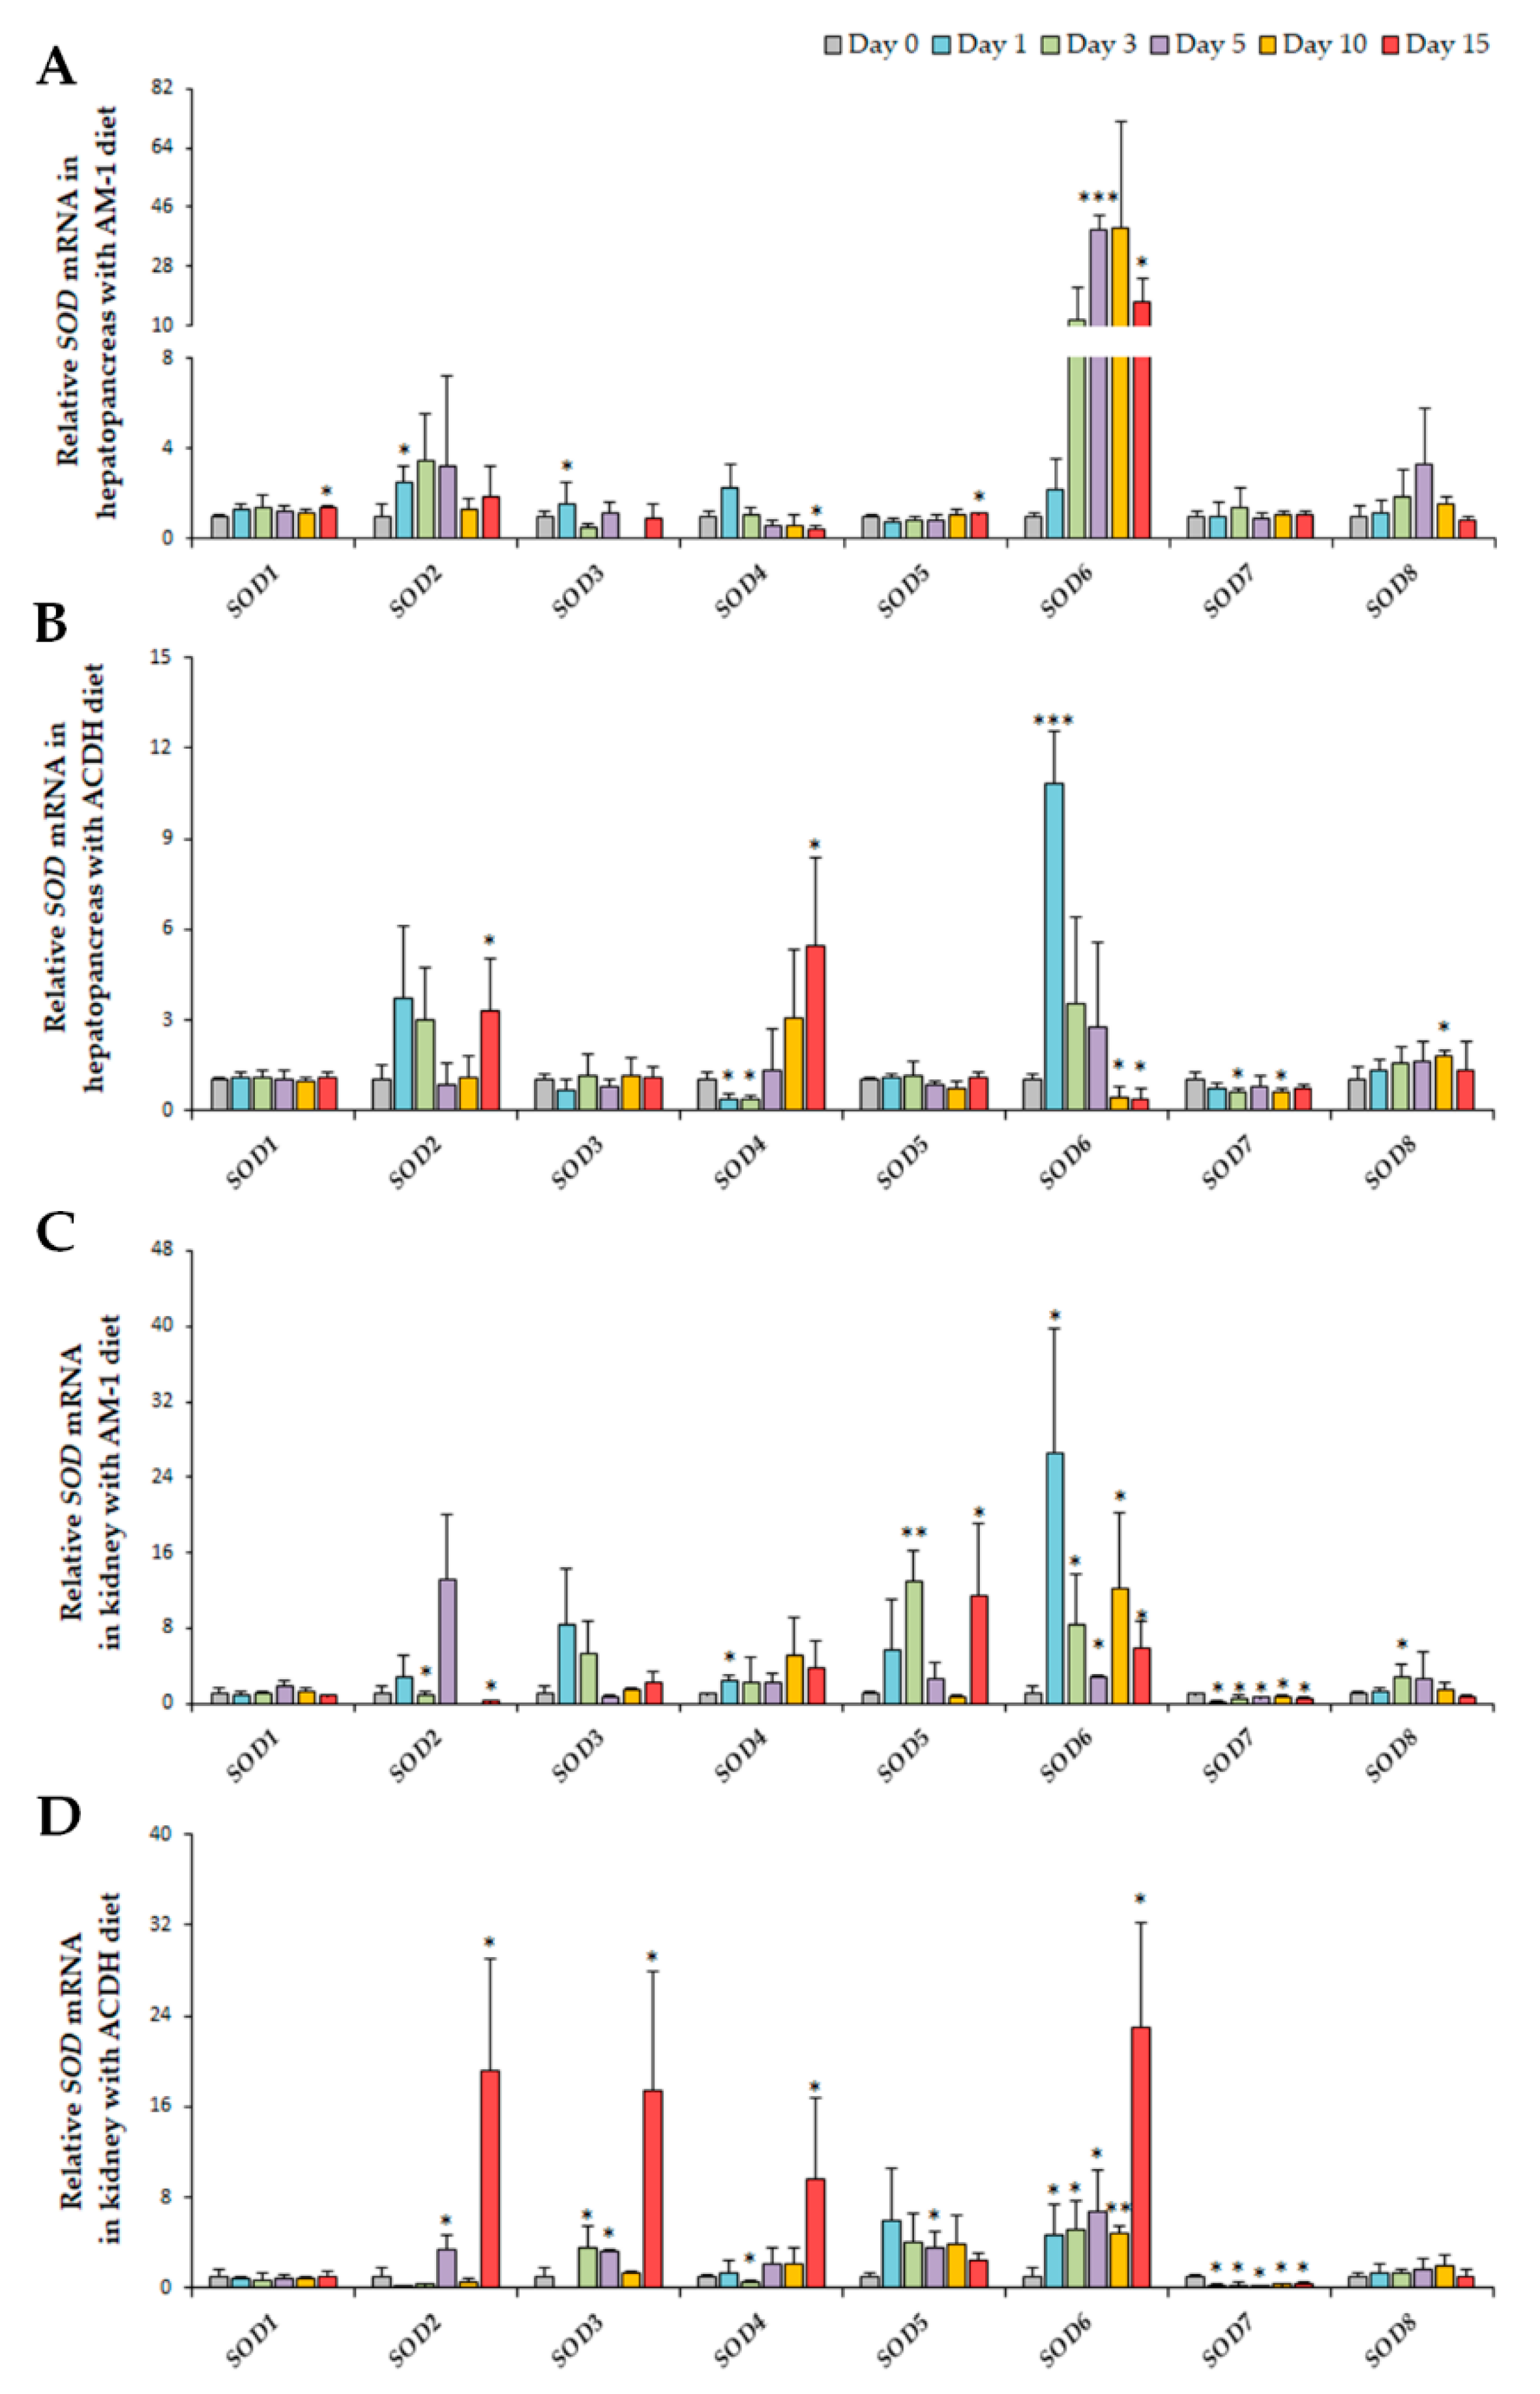
2.4. Diversified Expression Regulation of SODs in Response to PSTs Producers

Previous studies have documented that SOD activities were induced in bivalves when exposed to toxic algae [31,32], but the expression of underlying SOD genes has not been revealed. Our previous study indicated that the hepatopancreas and kidney in C. farreri are both toxin-rich organs containing the highest concentrations of PSTs [25]. To gain a deeper understanding of the defensive mechanism of bivalve SOD genes in response to PST-producing algae challenge, expression regulation of the SOD gene family in these two vulnerable organs of C. farreri challenged with PST-producing algae A. minutum (strain AM-1) and A. catenella (strain ACDH) were analyzed.
In scallop hepatopancreas which is the main organ for PST uptake from algae, all the six Cu/Zn-SODs showed significant alterations after A. minutum exposure, with SOD1, 2, 3, 5, and 6 being upregulated and SOD4 being downregulated, while no significant change was detected in Mn-SODs (Figure 5A). Notably, the most dramatic upregulation was observed in SOD6, and the fold changes reached 39.01 and 17.10, respectively, on days 5 and 15. Chronic induction was also observed in SOD1 and SOD5 at 15 days post exposure, while SOD2 and SOD3 showed acute up-regulation on day 1. For SOD4, chronic suppression was detected on day 15. After exposure to A. catenella, up-regulation was observed in SOD2, 4, 6, and 8, while SOD7 was down-regulated. As shown in Figure 5B, significant acute induction of SOD6 (10.82-fold) was observed on day 1, and chronic induction was found in SOD2 (day 15), SOD4 (day 15), and SOD8 (day 10). Acute and chronic suppression of SOD4 (on day 1 and 3) and SOD6 (on day 10 and 15) was also observed, respectively. In addition, acute and chronic suppression of SOD7 was detected on day 3 and day 10, respectively. Taken together, Cu/Zn-SOD6 showed the most dramatic induction for both A. minutum and A. catenella exposure, implying that SOD6 plays an important role in the antioxidant protection during PST accumulation in the hepatopancreas and may be a promising hepatopancreatic indicator gene during toxic dinoflagellate challenge in C. farreri. Furthermore, as the two algae contained different PST members, with A. minutum mainly synthesizing GTX1-4 and A. catenella synthesizing C1-2, the chronic response of SOD6 for A. minutum exposure and its acute response for A. catenella exposure suggests that the activation of SOD6 for antioxidant defense is dependent on the species or toxicity of the PSTs accumulated. Similar phenomena were also observed for SOD4, from which we could detect its chronically suppressed expression after A. minutum exposure, while acute suppression followed by chronic stimulation of SOD4 was observed after A. catenella exposure. These findings all indicate dinoflagellate-dependent responses of SOD members in hepatopancreas. Meanwhile, we further found that expression of SOD3 and SOD5 was negatively correlated (p < 0.05) for both A. minutum and A. catenella exposure (Figure S3A,B), suggesting their complementary or substitutionary function in scallop hepatopancreas to cope with PSTs producing algae exposure.
In the kidney, where the ingested PSTs are transformed to more toxic analogs [25], all the SODs except SOD1 showed significant alteration at least at one time point (Figure 5C,D). Among Cu/Zn-SODs, after A. minutum exposure, rapid elevation of SOD4 (2.47-fold), SOD5 (12.89-fold), SOD6 (26.58-fold), and SOD8 (2.81-fold) expression was observed, and significant activation was maintained until day 15 for SOD6. In addition, acute suppression of SOD2 and SOD7 was observed, and SOD7 was supressed at all the time points examined. After A. catenella exposure, all the up-regulated members were from Cu/Zn-SODs, including SOD2, 3, 4, 5, and 6, and except for SOD5, the highest fold change of these genes was present at 15 days after exposure. Like the regulation pattern during A. minutum exposure, SOD6 was up-regulated and SOD7 was down-regulated at all the sampling time points after the A. catenella challenge. Meanwhile, in the kidney, SOD6 showed the highest fold change among all the SODs after the challenge of both algae, similar to the results in hepatopancreas. In addition, highly positive correlation was observed between the expression of SOD3 and SOD6 (p < 0.01) in scallop kidney, for both A. minutum and A. catenella exposure, with the coefficients of 0.67 and 0.74, respectively (Figure S3C,D), indicating their co-regulation in response to PSTs producing algae challenge in kidney.
Overall, in scallops after exposure to different toxic algae, SOD up-regulation mainly occurred in the expanded Cu/Zn-SOD group, and SOD6 could be the promising indicator gene due to its highest fold change among all the SODs and being up-regulated under all PST-producer challenge scenarios. These findings may indicate the importance of Cu/Zn-SODs, especially SOD6 in protecting scallop from the stress of PSTs. In addition, diversified responsive patterns of SOD genes were detected in two toxin-rich organs after a A. minutum or A. catenella challenge according to the present data, with some members being up-regulated, some down-regulated, and some other members showing different regulation directions at different sampling times, depending on the examined organs and ingested algae. The diverse regulation pattern of SODs provides important information for understanding the mechanism of SOD enzymes in protecting scallop organs/tissues against PSTs accumulation, as the enzyme activities were determined by the expression regulation of all the SOD genes. Our results suggest the diverse function of scallop SODs during development and in response to PST-producing algae challenge, and the expansion of Cu/Zn-SODs might be implicated in the adaptive evolution of scallop or bivalve with respect to antioxidant defense against the ingested toxic algae.

3. Conclusions

Through genome and transcriptome screening, we performed the first systematic analysis of SOD gene family in bivalves, and found the expansion of Cu/Zn-SOD in scallop. The considerable structural diversity, distinct sub-cellular localization, conserved domains and motifs, as well as various spatiotemporal expression patterns during development and in adult tissues/organs were also revealed. After exposure to two different toxic Alexandrium spp., scallop SODs exhibited different regulation patterns depending on the algae strain ingested and scallop organ analyzed, with up-regulation mainly occurring in the expanded Cu/Zn-SOD group. In addition, SOD6 was the only member that was dramatically up-regulated in both hepatopancreas and kidney among all the SODs, implying the importance of Cu/Zn-SOD, especially SOD6 in protecting scallop from the stress of PSTs.

4. Materials and Methods

4.1. Genome-Wide Identification and Sequence Analysis of SOD Genes in C. farreri

The C. farreri genomic and transcriptomic files were used for gene prediction and sequence analysis [25]. De novo predicted SOD genes were aligned to the genome to support the mRNA’s existence. The retrieved SODs candidate sequences were translated through ORF finder (http://www.ncbi.nlm.nih.gov/gorf/gorf.html). Then, the predicted C. farreri SOD proteins were aligned to KEGG (http://www.kegg.jp/), UniProt (http://www.uniprot.org/), and the NCBI non-redundant protein sequence database with BLASTP (E-Value set: 1.00 × 10⁻⁵). All candidate SODs with a significant BLAST hit (E-value ≤ 1.00 × 10⁻¹⁰) were collected, and the presence of SOD domain was further verified by HMMER search (http://www.ebi.ac.uk/Tools/hmmer/search/phmmer) and SMART (http://smart.embl-heidelberg.de/) tools. To find conserved motifs in C. farreri SOD proteins, “Multiple EM for Motif Elicitation” (MEME) version 3.5.4 (http://meme-suite.org/tools/meme) was used with the following parameter settings: number of repetitions, any; maximum number of motifs, 6; optimum width of motif, 80–150 aa [54].
Characterization of the C. farreri SOD proteins, including the length (aa), molecular weight (kDa), isoelectric point (pI), instability index, aliphatic index, and grand average of hydropathicity (GRAVY) values, were performed using the ProtParam tool (http://www.expasy.org/tools/protparam.html), and the subcellular localization prediction of the SOD proteins was analyzed through CELLO v.2.5 (http://cello.life.nctu.edu.tw/) [55], Euk-mPLoc 2.0 (http://www.csbio.sjtu.edu.cn/bioinf/euk-multi-2/) [56] as well as WoLF PSORT II (https://www.genscript.com/wolf-psort.html) [57]. The nuclear localization signal was predicted by the cNLS Mapper program (http://nls-mapper.iab.keio.ac.jp/cgi-bin/NLS_Mapper_form.cgi) [58]. The signal peptide for mitochondrial translocation was predicted by using MitoFates (http://mitf.cbrc.jp/MitoFates/cgi-bin/top.cgi) [59]. The structures of SOD proteins were predicted using the Phyre server (http://www.sbg.bio.ic.ac.uk/phyre) [60]. We performed further ligand clustering and binding site prediction for C. farreri SODs using the 3D LigandSite server (http://www.sbg.bio.ic.ac.uk/3dligandsite/) [61] and their conserved disulfide bonds with cysteine residues were predicted by the DiANNA 1.1 server (http://clavius.bc.edu/~clotelab/DiANNA/) [62]. Structural evaluation was assessed using Ramachandran plot analysis (http://mordred.bioc.cam.ac.uk/~rapper/rampage.php) [63].

4.2. Multiple Alignment and Phylogenetic Analysis

Phylogenetic tree of C. farreri SODs was constructed with MEGA 7.0 by using the maximum likelihood method with bootstrap values as 1000 replicates. The protein sequences encoded by SOD genes identified from C. farreri and other selected species, including human (Homo sapiens), mouse (Mus musculus), chicken (Gallus gallus), frog (Xenopus laevis), zebrafish (Danio rerio), large yellow croaker (Larimichthys crocea), sea urchin (Strongylocentrotus purpuratus), freshwater snail (Biomphalaria glabrata), Pacific oyster (Crassostrea gigas), shrimp (Litopenaeus vannamei), crab (Eriocheir sinensis), fruit fly (Drosophila melanogaster), and nematode (Caenorhabditis elegans), were used to perform phylogenetic analysis with the maximum-likelihood method [64]. The SOD protein sequences from these species were retrieved from UniProt (http://www.uniprot.org/), Ensembl (http://asia.ensembl.org/index.html) and NCBI (http://www.ncbi.nlm.nih.gov/) databases, and the accession numbers, SOD type, as well as sub-cellular prediction are summarized in Table S4. Multiple protein sequences alignments were conducted using the Clustal W program, and the Jones-Taylor-Thornton (JTT) model with a bootstrap analysis of 1000 replicates was selected as the best fit model by MEGA 7 [65].

4.3. Expression Profiles of SOD Genes During C. farreri Development and in Adult Organs/Tissues

All experiments on scallops were conducted following institutional and national guidelines. The expression profiles of SOD genes in scallop developmental stages and adult organs/tissues were analyzed based on the RNA-seq data [25,66]. Briefly, embryos/larvae and adults of C. farreri were collected from the hatchery of Xunshan Group Co., Ltd. (Shandong, China). Embryo/larva samples were harvested at different developmental stages, including zygotes; 2–8 cells; blastula; gastrula; trochophore; D-stage veliger; early-, mid-, and late-term umbo larvae; creeping larvae and juvenile scallops, which were frozen in liquid nitrogen and stored at −80 °C until RNA extraction. The adults were acclimated in filtered and aerated seawater at 12–13 °C for one week. Then, 14 soft tissues (mantle, gill, female gonad, male gonad, kidney, digestive gland, striated muscle, smooth muscle, eyes, front foot, posterior foot, blood, pedal-cephalic ganglion, and peripheral visceral ganglion) were dissected and were frozen in liquid nitrogen and stored at −80 °C until RNA extraction.
Total mRNA was extracted using the conventional guanidinium isothiocyanate method. In brief, tissues were homogenized in lysis buffer (4 M guanidium thiocyanide, 25 mM sodium citrate pH 7.0, 0.5% sarcosyl, 0.1 M 2-mercaptoethanol) followed by phenol/chloroform extraction. Total RNA was precipitated in ethanol, washed, and dissolved in DEPC water. The RNA-seq libraries were constructed using the NEB Next mRNA Library Prep Kit following the manufacturer’s instructions and were subjected to PE125 sequencing on the Illumina HiSeq 2000 platform. The generated RNA-seq reads were mapped to the C. farreri genome using Tophat (ver 2.0.9), and the expression of all SOD genes was normalized and represented in the form of reads per kb of exon model per million mapped reads (RPKMs).

4.4. Expression Response of SOD Genes to A. minutum and A. catenella Exposure

Previously, adult C. farreri was challenged with the PST-producing dinoflagellates A. minutum (strain AM-1) and A. catenella (strain ACDH) via feeding prior to sample collection [66]. No other noxious metabolites were previously reported in these two strains, but the main PST analogs in AM-1 and ACDH were gonyautoxins (GTX1-4) and N-sulfocarbamoyl-gonyautoxins (C-1,2), respectively [25,66,67]. The dinoflagellate cultures were grown in L1 medium at 17 °C/25 °C with a light: dark cycle of 12:12 h and were collected during the exponential growth phase at a cell density approaching 5 × 10⁴ cells mL−1 [68,69]. Microalgal ration was provided once each day, with a final cell density of 2.5 × 10³ cells mL−1 during the feeding experiments. Three hours after feeding, three scallops were sampled at 0 days (control), 1 day, 3 days (acute response), 5, 10, and 15 days (chronic response). In addition, the hepatopancreas as well as kidneys from each scallop were harvested, washed with sterile seawater, and frozen at −80 °C for subsequent RNA extraction. RNA-seq data generated from the sampled scallop tissue were used to examine the expression profiles of SOD genes. Barcodes were used to discriminate the sequencing reads from different sampled individuals. The expression estimation of all SOD genes was normalized and represented in the form of RPKM. The fold changes in SOD expression at each test point were calculated and normalized to the data from the control group. Significant differences between the test and control groups were determined using an independent-samples T-Test (p < 0.05, n = 3).

Supplementary Materials

The following are available online at https://www.mdpi.com/1660-3397/17/12/700/s1, Figure S1: Conserved motif logos as well as Ramachandran plots of C. farreri SODs, Figure S2: Amino acid sequence alignments of extracellular SODs, Figure S3: The Correlation Matrix Plots for expression of SODs on A. minutum and A. catenella diet in hepatopancreas and kidney of C. farreri, Table S1: Conserved disulfide bonds with cysteine residues prediction of Cu/Zn-SODs in C. farreri, Table S2: The location and E-value for predicted Pfam domains as well as Motif arrays of C. farreri SODs, Table S3: The Ramachandran plot analysis of SOD proteins in C. farreri, Table S4: Species accession numbers of SOD used for phylogenetic analysis.

Author Contributions

Conceptualization and methodology, X.H. and S.L.; sample collaboration, L.Z.; investigation, S.L., L.Z., J.L. and M.L.; software, X.X.; data curation, L.Z.; Formal analysis, X.L.; writing—original draft preparation, S.L.; writing—review and editing, X.H., S.W. and L.Z.; supervision, Z.B.

Funding

This work was funded by the grant support from the National Key R&D Program of China (2018YDF0900604), the National Natural Science Foundation of China (31630081 and 31802292), and Youth Talent Program Supported by Laboratory for Marine Fisheries Science and Food Production Processes, Pilot National Laboratory for Marine Science and Technology (2018-MFS-T06).

Acknowledgments

We thank Xunshan Group Co., Ltd. (Shandong, China) for providing scallop populations, and Center for High Performance Computing and System Simulation, Pilot National Laboratory for Marine Science and Technology (Qingdao), for providing computing resources.

Conflicts of Interest

The authors declare no conflict of interest.

References

  1. Nathan, C.; Cunningham-Bussel, A. Beyond oxidative stress: An immunologist’s guide to reactive oxygen species. Nat. Rev. Immunol. 2013, 13, 349–361. [Google Scholar] [CrossRef] [PubMed] [Green Version]
  2. Van Raamsdonk, J.M.; Hekimi, S. Superoxide dismutase is dispensable for normal animal lifespan. Proc. Natl. Acad. Sci. USA 2012, 109, 5785–5790. [Google Scholar] [CrossRef] [PubMed] [Green Version]
  3. Zelko, I.N.; Mariani, T.J.; Folz, R.J. Superoxide dismutase multigene family: A comparison of the CuZn-SOD (SOD1), Mn-SOD (SOD2), and EC-SOD (SOD3) gene structures, evolution, and expression. Free Radic. Biol. Med. 2002, 33, 337–349. [Google Scholar] [CrossRef]
  4. Benzie, I.F.F. Evolution of antioxidant defence mechanisms. Eur. J. Nutr. 2000, 39, 53–61. [Google Scholar] [CrossRef] [PubMed]
  5. Culotta, V.C.; Yang, M.; O’Halloran, T.V. Activation of superoxide dismutases: Putting the metal to the pedal. BBA Mol. Cell Res. 2006, 1763, 747–758. [Google Scholar] [CrossRef] [PubMed] [Green Version]
  6. Scandalios, J.G. Oxygen stress and superoxide dismutases. Plant Physiol. 1993, 101, 7–12. [Google Scholar] [CrossRef] [PubMed] [Green Version]
  7. Fantel, A.G.; Person, R.E. Involvement of mitochondria and other free radical sources in normal and abnormal fetal development. Ann. N. Y. Acad. Sci. 2002, 959, 424–433. [Google Scholar] [CrossRef]
  8. Barnham, K.J.; Masters, C.L.; Bush, A.I. Neurodegenerative diseases and oxidative stress. Nat. Rev. Drug Discov. 2004, 3, 205–214. [Google Scholar] [CrossRef]
  9. Keskin, I.; Birve, A.; Berdynski, M.; Hjertkvist, K.; Rofougaran, R.; Nilsson, T.K.; Glass, J.D.; Marklund, S.L.; Andersen, P.M. Comprehensive analysis to explain reduced or increased SOD1 enzymatic activity in ALS patients and their relatives. Amyotroph. Lat. Scler. Front. Degener. 2017, 18, 457–463. [Google Scholar] [CrossRef]
  10. Silverman, J.M.; Fernando, S.M.; Grad, L.I.; Hill, A.F.; Turner, B.J.; Yerbury, J.J.; Cashman, N.R. Disease Mechanisms in ALS: Misfolded SOD1 transferred through exosome-dependent and exosome-independent pathways. Cell Mol. Neurobiol. 2016, 36, 377–381. [Google Scholar] [CrossRef]
  11. McCord, J.M.; Edeas, M.A. SOD, oxidative stress and human pathologies: A brief history and a future vision. Biomed. Pharmacother. 2005, 59, 139–142. [Google Scholar] [CrossRef] [PubMed]
  12. Zhang, Z.W.; Wang, Q.H.; Zhang, J.L.; Li, S.; Wang, X.L.; Xu, S.W. Effects of oxidative stress on immunosuppression induced by selenium deficiency in chickens. Biol. Trace Elem. Res. 2012, 149, 352–361. [Google Scholar] [CrossRef] [PubMed]
  13. Che, M.X.; Wang, R.; Li, X.X.; Wang, H.Y.; Zheng, X.F.S. Expanding roles of superoxide dismutases in cell regulation and cancer. Drug Discov. Today 2016, 21, 143–149. [Google Scholar] [CrossRef] [PubMed] [Green Version]
  14. Robbins, D.; Zhao, Y.F. Manganese superoxide dismutase in cancer prevention. Antioxid. Redox Sign. 2014, 20, 1628–1645. [Google Scholar] [CrossRef] [PubMed] [Green Version]
  15. Zhen, H.; Wen, M.; Yang, Y.; Can, Z.; Hui, G.; Li, X.; Deli, L. Toxic effects of HgCl2 on activities of SOD, AchE and relative expression of SOD, AChE, CYP1A1 of zebrafish. Ecotoxicology 2014, 23, 1842–1845. [Google Scholar] [CrossRef] [PubMed]
  16. Wang, H.J.; Li, Y.L.; Zhang, L.B.; Zucker, I.H.; Gao, L.; Zimmerman, M.C.; Wang, W. Endogenous reactive oxygen species modulates voltage-gated sodium channels in dorsal root ganglia of rats. J. Appl. Physiol. 2011, 110, 1439–1447. [Google Scholar] [CrossRef] [PubMed]
  17. Sarkar, A.; Ray, D.; Shrivastava, A.N.; Sarker, S. Molecular biomarkers: Their significance and application in marine pollution monitoring. Ecotoxicology 2006, 15, 333–340. [Google Scholar] [CrossRef] [PubMed]
  18. Philipp, E.E.R.; Wessels, W.; Gruber, H.; Strahl, J.; Wagner, A.E.; Ernst, I.M.A.; Rimbach, G.; Kraemer, L.; Schreiber, S.; Abele, D.; et al. Gene expression and physiological changes of different populations of the long-lived bivalve Arctica islandica under low oxygen conditions. PLoS ONE 2012, 7. [Google Scholar] [CrossRef]
  19. Maldonado-Aguayo, W.; Lafarga-De la Cruz, F.; Gallardo-Escarate, C. Identification and expression of antioxidant and immune defense genes in the surf clam Mesodesma donacium challenged with Vibrio anguillarum. Mar. Genomics 2015, 19, 65–73. [Google Scholar] [CrossRef]
  20. Carregosa, V.; Velez, C.; Soares, A.M.V.M.; Figueira, E.; Freitas, R. Physiological and biochemical responses of three Veneridae clams exposed to salinity changes. Comp. Biochem. Phys. B 2014, 177, 1–9. [Google Scholar] [CrossRef]
  21. Yu, J.H.; Song, J.H.; Choi, M.C.; Park, S.W. Effects of water temperature change on immune function in surf clams, Mactra veneriformis (Bivalvia: Mactridae). J. Invertebr. Pathol. 2009, 102, 30–35. [Google Scholar] [CrossRef] [PubMed]
  22. Anderson, D.M.; Cembella, A.D.; Hallegraeff, G.M. Progress in understanding harmful algal blooms: Paradigm shifts and new technologies for research, monitoring, and management. Annu. Rev. Mar. Sci. 2012, 4, 143–176. [Google Scholar] [CrossRef] [PubMed] [Green Version]
  23. Wang, J.H.; Wu, J.Y. Occurrence and potential risks of harmful algal blooms in the East China Sea. Sci. Total Environ. 2009, 407, 4012–4021. [Google Scholar] [CrossRef]
  24. Shumway, S.E. A review of the effects of algal blooms on shellfish and aquaculture. J. World Aquacult. Soc. 1990, 21, 65–104. [Google Scholar] [CrossRef]
  25. Li, Y.L.; Sun, X.Q.; Hu, X.L.; Xun, X.G.; Zhang, J.B.; Guo, X.M.; Jiao, W.Q.; Zhang, L.L.; Liu, W.Z.; Wang, J.; et al. Scallop genome reveals molecular adaptations to semi-sessile life and neurotoxins. Nat. Commun. 2017, 8. [Google Scholar] [CrossRef]
  26. Whittle, K.; Gallacher, S. Marine toxins. Brit. Med. Bull. 2000, 56, 236–253. [Google Scholar] [CrossRef]
  27. Tran, D.; Haberkorn, H.; Soudant, P.; Ciret, P.; Massabuau, J.C. Behavioral responses of Crassostrea gigas exposed to the harmful algae Alexandrium minutum. Aquaculture 2010, 298, 338–345. [Google Scholar] [CrossRef]
  28. Manfrin, C.; De Moro, G.; Torboli, V.; Venier, P.; Pallavicini, A.; Gerdol, M. Physiological and molecular responses of bivalves to toxic dinoflagellates. ISJ Invertebr. Surviv. J. 2012, 9, 184–199. [Google Scholar]
  29. Bricelj, V.M.; Ford, S.E.; Lambert, C.; Barbou, A.; Paillard, C. Effects of toxic Alexandrium tamarense on behavior, hemocyte responses and development of brown ring disease in Manila clams. Mar. Ecol. Prog. Ser. 2011, 430, 35–48. [Google Scholar] [CrossRef] [Green Version]
  30. Haberkorn, H.; Lambert, C.; Le Goic, N.; Gueguen, M.; Moal, J.; Palacios, E.; Lassus, P.; Soudant, P. Effects of Alexandrium minutum exposure upon physiological and hematological variables of diploid and triploid oysters, Crassostrea gigas. Aquat. Toxicol. 2010, 97, 96–108. [Google Scholar] [CrossRef] [Green Version]
  31. Cao, R.W.; Wang, D.; Wei, Q.Y.; Wang, Q.; Yang, D.L.; Liu, H.; Dong, Z.J.; Zhang, X.L.; Zhang, Q.Q.; Zhao, J.M. Integrative biomarker assessment of the influence of saxitoxin on marine bivalves: A comparative study of the two bivalve species oysters, Crassostrea gigas, and scallops, Chlamys farreri. Front. Physiol. 2018, 9. [Google Scholar] [CrossRef] [PubMed] [Green Version]
  32. Qiu, J.B.; Ma, F.F.; Fan, H.; Li, A.F. Effects of feeding Alexandrium tamarense, a paralytic shellfish toxin producer, on antioxidant enzymes in scallops (Patinopecten yessoensis) and mussels (Mytilus galloprovincialis). Aquaculture 2013, 396, 76–81. [Google Scholar] [CrossRef]
  33. Estrada, N.; Romero, M.D.; Campa-Cordova, A.; Luna, A.; Ascencio, F. Effects of the toxic dinoflagellate, Gymnodinium catenatum on hydrolytic and antioxidant enzymes, in tissues of the giant lions-paw scallop Nodipecten subnodosus. Comp. Biochem. Phys. C 2007, 146, 502–510. [Google Scholar] [CrossRef] [PubMed]
  34. Li, A.; Ma, J.; Cao, J.; Wang, Q.; Yu, R.; Thomas, K.; Quilliam, M.A. Analysis of paralytic shellfish toxins and their metabolites in shellfish from the North Yellow Sea of China. Food Addit. Contam. A 2012, 29, 1455–1464. [Google Scholar] [CrossRef]
  35. Ebersbach, G.; Galli, E.; Moller-Jensen, J.; Lowe, J.; Gerdes, K. Novel coiled-coil cell division factor ZapB stimulates Z ring assembly and cell division. Mol. Microbiol. 2008, 68, 720–735. [Google Scholar] [CrossRef]
  36. Bao, Y.B.; Li, L.; Zhang, G.F. The manganese superoxide dismutase gene in bay scallop Argopecten irradians: Cloning, 3D modelling and mRNA expression. Fish Shellfish Immun. 2008, 25, 425–432. [Google Scholar] [CrossRef]
  37. Brouwer, M.; Brouwer, T.H.; Grater, W.; Brown-Peterson, N. Replacement of a cytosolic copper/zinc superoxide dismutase by a novel cytosolic manganese superoxide dismutase in crustaceans that use copper (haemocyanin) for oxygen transport. Biochem. J. 2003, 374, 219–228. [Google Scholar] [CrossRef]
  38. Brouwer, M.; Brouwer, T.H.; Grater, W.; Enghild, J.J.; Thogersen, I.B. The paradigm that all oxygen-respiring eukaryotes have cytosolic CuZn-superoxide dismutase and that Mn-superoxide dismutase is localized to the mitochondria does not apply to a large group of marine arthropods. Biochemistry 1997, 36, 13381–13388. [Google Scholar] [CrossRef]
  39. Gomez-Anduro, G.A.; Barillas-Mury, C.V.; Peregrino-Uriarte, A.B.; Gupta, L.; Gollas-Galvan, T.; Hernandez-Lopez, J.; Yepiz-Plascencia, G. The cytosolic manganese superoxide dismutase from the shrimp Litopenaeus vannamei: Molecular cloning and expression. Dev. Comp. Immunol. 2006, 30, 893–900. [Google Scholar] [CrossRef]
  40. Wang, M.Q.; Wang, L.L.; Yi, Q.L.; Gai, Y.L.; Song, L.H. Molecular cloning and characterization of a cytoplasmic manganese superoxide dismutase and a mitochondrial manganese superoxide dismutase from Chinese mitten crab Eriocheir sinensis. Fish Shellfish Immun. 2015, 47, 407–417. [Google Scholar] [CrossRef]
  41. Rodriguez-Trelles, F.; Tarrio, R.; Ayala, F.J. Erratic overdispersion of three molecular clocks: GPDH, SOD, and XDH. Proc. Natl. Acad. Sci. USA 2001, 98, 11405–11410. [Google Scholar] [CrossRef] [PubMed] [Green Version]
  42. Smith, M.W.; Doolittle, R.F. A comparison of evolutionary rates of the two major kinds of superoxide-dismutase. J. Mol. Evol. 1992, 34, 175–184. [Google Scholar] [CrossRef] [PubMed]
  43. Dandapat, J.; Chainy, G.B.N.; Rao, K.J. Lipid peroxidation and antioxidant defence status during larval development and metamorphosis of giant prawn, Macrobrachium rosenbergii. Comp. Biochem. Phys. C 2003, 135, 221–233. [Google Scholar] [CrossRef]
  44. Kalaimani, N.; Chakravarthy, N.; Shanmugham, R.; Thirunavukkarasu, A.R.; Alavandi, S.V.; Santiago, T.C. Anti-oxidant status in embryonic, post-hatch and larval stages of Asian seabass (Lates calcarifer). Fish Physiol. Biochem. 2008, 34, 151–158. [Google Scholar] [CrossRef] [PubMed]
  45. Menon, J.; Roman, R. Oxidative stress, tissue remodeling and regression during amphibian metamorphosis. Comp. Biochem. Phys. C 2007, 145, 625–631. [Google Scholar] [CrossRef]
  46. Hilliker, A.J.; Duyf, B.; Evans, D.; Phillips, J.P. Urate-null rosy mutants of Drosophila-melanogaster are hypersensitive to oxygen stress. Proc. Natl. Acad. Sci. USA 1992, 89, 4343–4347. [Google Scholar] [CrossRef] [Green Version]
  47. Dhage, P.A.; Kamble, L.K.; Bhargava, S.Y. Localization and distribution of superoxide dismutase-1 in the neural tube morphogenesis of chick embryo. Int. J. Dev. Neurosci. 2017, 56, 1–9. [Google Scholar] [CrossRef]
  48. Nonogaki, T.; Noda, Y.; Narimoto, K.; Umaoka, Y.; Mori, T. Effects of superoxide dismutase on mouse in vitro fertilization and embryo culture system. J. Assist. Reprod. Genet. 1992, 9, 274–280. [Google Scholar] [CrossRef]
  49. Behndig, A.; Karlsson, K.; Brannstrom, T.; Sentman, M.L.; Marklund, S.L. Corneal endothelial integrity in mice lacking extracellular superoxide dismutase. Investig. Ophthalmol. Vis. Sci. 2001, 42, 2784–2788. [Google Scholar] [PubMed]
  50. Behndig, A.; Karlsson, K.; Johansson, B.O.; Brannstrom, T.; Marklund, S.L. Superoxide dismutase isoenzymes in the normal and diseased human cornea. Investig. Ophthalmol. Vis. Sci. 2001, 42, 2293–2296. [Google Scholar] [PubMed]
  51. Mruk, D.; Cheng, C.H.; Cheng, Y.H.; Mo, M.Y.; Grima, J.; Silvestrini, B.; Lee, W.M.; Cheng, C.Y. Rat testicular extracellular superoxide dismutase: Its purification, cellular distribution, and regulation. Biol. Reprod. 1998, 59, 298–308. [Google Scholar] [CrossRef] [PubMed] [Green Version]
  52. Liu, C.; Li, S.G.; Huang, J.L.; Liu, Y.J.; Jia, G.C.; Xie, L.P.; Zhang, R.Q. Extensible byssus of Pinctada fucata: Ca2+-stabilized nanocavities and a thrombospondin-1 protein. Sci. Rep. 2015, 5. [Google Scholar] [CrossRef] [PubMed] [Green Version]
  53. Lustgarten, M.S.; Jang, Y.C.; Liu, Y.H.; Muller, F.L.; Qi, W.B.; Steinhelper, M.; Brooks, S.V.; Larkin, L.; Shimizu, T.; Shirasawa, T.; et al. Conditional knockout of Mn-SOD targeted to type IIB skeletal muscle fibers increases oxidative stress and is sufficient to alter aerobic exercise capacity. Am. J. Physiol. Cell Physiol. 2009, 297, C1520–C1532. [Google Scholar] [CrossRef] [PubMed] [Green Version]
  54. Bailey, T.L.; Johnson, J.; Grant, C.E.; Noble, W.S. The MEME Suite. Nucleic Acids Res. 2015, 43, W39–W49. [Google Scholar] [CrossRef] [Green Version]
  55. Yu, C.S.; Chen, Y.C.; Lu, C.H.; Hwang, J.K. Prediction of protein subcellular localization. Proteins 2006, 64, 643–651. [Google Scholar] [CrossRef]
  56. Chou, K.C.; Shen, H.B. A new method for predicting the subcellular localization of eukaryotic proteins with both single and multiple sites: Euk-mPLoc 2.0. PLoS ONE 2010, 5. [Google Scholar] [CrossRef]
  57. Horton, P.; Park, K.J.; Obayashi, T.; Fujita, N.; Harada, H.; Adams-Collier, C.J.; Nakai, K. WoLF PSORT: Protein localization predictor. Nucleic Acids Res. 2007, 35, W585–W587. [Google Scholar] [CrossRef] [Green Version]
  58. Kosugi, S.; Hasebe, M.; Matsumura, N.; Takashima, H.; Miyamoto-Sato, E.; Tomita, M.; Yanagawa, H. Six classes of nuclear localization signals specific to different binding grooves of importin alpha. J. Biol. Chem. 2009, 284, 478–485. [Google Scholar] [CrossRef] [Green Version]
  59. Fukasawa, Y.; Tsuji, J.; Fu, S.C.; Tomii, K.; Horton, P.; Imai, K. MitoFates: Improved prediction of mitochondrial targeting sequences and their cleavage sites. Mol. Cell Proteomics 2015, 14, 1113–1126. [Google Scholar] [CrossRef] [Green Version]
  60. Kelley, L.A.; Sternberg, M.J.E. Protein structure prediction on the Web: A case study using the Phyre server. Nat. Protoc. 2009, 4, 363–371. [Google Scholar] [CrossRef] [Green Version]
  61. Wass, M.N.; Kelley, L.A.; Sternberg, M.J.E. 3DLigandSite: Predicting ligand-binding sites using similar structures. Nucleic Acids Res. 2010, 38, W469–W473. [Google Scholar] [CrossRef] [PubMed] [Green Version]
  62. Ferre, F.; Clote, P. DiANNA 1.1: An extension of the DiANNA web server for ternary cysteine classification. Nucleic Acids Res. 2006, 34, W182–W185. [Google Scholar] [CrossRef] [PubMed] [Green Version]
  63. Carugo, O.; Djinovic-Carugo, K. A proteomic Ramachandran plot (PRplot). Amino Acids 2013, 44, 781–790. [Google Scholar] [CrossRef] [PubMed]
  64. Guindon, S.; Gascuel, O. A simple, fast, and accurate algorithm to estimate large phylogenies by maximum likelihood. Syst. Biol. 2003, 52, 696–704. [Google Scholar] [CrossRef] [PubMed] [Green Version]
  65. Kumar, S.; Stecher, G.; Tamura, K. MEGA7: Molecular evolutionary genetics analysis version 7.0 for bigger datasets. Mol. Biol. Evol. 2016, 33, 1870–1874. [Google Scholar] [CrossRef] [Green Version]
  66. Hu, B.Y.; Li, M.L.; Yu, X.H.; Xun, X.G.; Lu, W.; Li, X.; Li, Y.J.; Lou, J.R.; Wang, S.; Zhang, L.L.; et al. Diverse expression regulation of Hsp70 genes in scallops after exposure to toxic Alexandrium dinoflagellates. Chemosphere 2019, 234, 62–69. [Google Scholar] [CrossRef]
  67. Xun, X.; Cheng, J.; Wang, J.; Li, Y.; Li, X.; Li, M.; Lou, J.; Kong, Y.; Bao, Z.; Hu, X. Solute carriers in scallop genome: Gene expansion and expression regulation after exposure to toxic dinoflagellate. Chemosphere 2019, 241, 124968. [Google Scholar] [CrossRef]
  68. Hwang, D.F.; Lu, Y.H. Influence of environmental and nutritional factors on growth, toxicity, and toxin profile of dinoflagellate Alexandrium minutum. Toxicon 2000, 38, 1491–1503. [Google Scholar] [CrossRef]
  69. Navarro, J.M.; Munoz, M.G.; Contreras, A.M. Temperature as a factor regulating growth and toxin content in the dinofiagellate Alexandrium catenella. Harmful Algae 2006, 5, 762–769. [Google Scholar] [CrossRef]
Figure 1. Exon/intron organization patterns of SOD genes in C. farreri as well as the conserved domain/motif and 3D structure analysis of the encoded proteins. (A) Schematic representation of the exon/intron structures of SOD genes. Each exon is represented in a grey box, and the locations of the nucleotide sequences which encode SOD motifs are indicated by colored boxes. The length of SOD genes can be estimated using the scale at the bottom. (B) Conserved domains and motifs of C. farreri SODs according to their predicted regions (Table S2), respectively, are present on the right side. The length of the protein and motif can be estimated using the scale at the bottom. Phylogenetic tree of C. farreri SODs is present on the left side. (C) Predicted 3D structures and binding sites of C. farreri SODs. I-VI: 3D structures of Cu/Zn-SODs (SOD1-6). VII, VIII: 3D structures of Mn-SOD proteins.
Marinedrugs 17 00700 g001
Figure 2. Phylogenetic tree of SODs from selected organisms. The tree is drawn to scale, with branch lengths measured based on the number of substitutions per site. Different symbols were used to distinguish the sub-cellular prediction, and the cytosolic, extracellular, and nuclear Cu/Zn-SODs are represented by solid diamonds, triangles, and squares, respectively. For Mn-SODs, circles and hollow circles are used to respectively represent mitochondrial and cytosolic Mn-SODs. SODs of C. farreri are specifically highlighted by the reddish symbol. The SODs were classified into two major groups and five subfamilies, which are shown as orange, green, purple, light blue, and dark blue branches, respectively. HSA: Homo sapiens, MMU: Mus musculus, GGA: Gallus gallus, XLA: Xenopus laevis, DRE: Danio rerio, LCR: Larimichthys crocea, SPU: Strongylocentrotus purpuratus, BGL: Biomphalaria glabrata, CGI: Crassostrea gigas, LVA: Litopenaeus vannamei, ESI: Eriocheir sinensis, DME: Drosophila melanogaster, CEL: Caenorhabditis elegans, and CFA: Chlamys farreri.
Marinedrugs 17 00700 g002
Figure 3. Heat map of C. farreri SODs expression during development. Expression of eight SODs from zygotes; 2–8 cells; blastula; gastrula; trochophore; D-stage veliger; early-, mid-, and late-term umbo larvae; creeping larvae; and juvenile scallops were tested. The reads per kilobase of exon model per million mapped reads (RPKMs) calculated from the RNA-seq data are shown as a heat map. The color varies from yellow to brown, representing the scale of the relative expression level.
Marinedrugs 17 00700 g003
Figure 4. Expression of C. farreri SODs in adult tissues/organs. The expression of eight SODs in the mantle, gill, female gonad, male gonad, kidney, digestive gland, striated muscle, smooth muscle, eyes, front foot, posterior foot, blood, pedal-cephalic ganglion, and peripheral visceral ganglion was tested. The RPKMs calculated from the RNA-seq data are shown as a column diagram. Different letters indicate significant differences between groups (p < 0.05).
Marinedrugs 17 00700 g004
Figure 5. Acute (≤ day 3) and chronic (≥ day 5) responses of SODs in C. farreri hepatopancreas (A,B) and kidney (C,D) after exposure to the toxic dinoflagellate A. minutum (A,C) and A. catenella (B,D). The relative variation tendencies after toxic diet exposure and the relative fold changes compared with control group for each test point are shown as a bar chart (significance: *** p < 0.001; ** p < 0.01; * p < 0.05).
Marinedrugs 17 00700 g005
Table 1. Characterization of Chlamys farreri SOD genes and the coding proteins.
Gene CharacteristicsProtein CharacteristicsSub-Cellular Localization Prediction
Gene NameNCBI IDGenomic PositionORF (bp)Length (aa)MW (kDa)pIInstability IndexAliphatic IndexGRAVYCELLO v.2.5 Euk-mPLoc 2.0WoLF PSORT IIFinal
Cu/Zn-SOD1MK37436550981.1: 5129-13060(+)46215315615.356.17.9875.16−0.292CytoCytoCytoCyto
Cu/Zn-SOD2MK3743669607.44: 811894-816438(+)85528430094.365.3332.3467.89−0.341ExtrChloroExtrExtr
Cu/Zn-SOD3MK37436711157.31: 577292-581362(−)153351054202.249.234.3744.73−0.712ExtrExtrExtrExtr
Cu/Zn-SOD4MK37436839551.24: 361068-385243(−)33481115120753.058.8237.5576.36−0.254ExtrExtrNuclExtr
Cu/Zn-SOD5MK37436962345.9: 206833-214902(−)145548455240.855.5735.2958.99−1.26NuclExtrNuclNucl
Cu/Zn-SOD6MK37437010699.65: 1421918-1435004(+)157252358628.125.5836.0553.31−1.283NuclChloroNuclNucl
Mn-SOD7MK37437162487.8: 111489-119434(+)68122625020.536.4438.8288.45−0.16MitoMitoMitoMito
Mn-SOD8MK37437220055.26: 792736-795083(+)78926230332.284.9441.32 (un)87.06−0.346CytoChloroCytoCyto
Cyto: Cytoplasm Extr: Extracellular Nucl: Nuclear Mito: Mitochondrion Chloro: Chloroplast.
Table 2. Two best match motif alignment of C. farreri SOD proteins identified by MEME tools. The Copper/Zinc superoxide dismutase signatures “[GA]-[IMFAT]-H-[LIVF]-H-{S}-x-[GP]-[SDG]-x-[STAGDE]” (SOD_CU_ZN_1, PS00087) and “G-[GNHD]-[SGA]-[GR]-x-R-x-[SGAWRV]-C-x(2)-[IV]” (SOD_CU_ZN_2, PS00332) are underlined, from which the copper ligands and disulfide binding site are in red and yellow box, respectively. Besides, the consensus pattern of manganese superoxide dismutase “D-x-[WF]-E-H-[STA]-[FY] (2)” is double-underlined and manganese/iron ligands are in green box. The predicted monopartite Nuclear localization signal are in blue color (Score = 10).
MotifWidth (aa)Consensus SequencePfam Domain
180EHEL[HY]A[HY]CECM[PF]N[KM][TQ]TPDIA[GY]KI[DR][GF]H[QI]ELTGEPHEDEVSIVYNL[PR]NLKPDTEHGIHIHEYGD[VM]GRCC[DY]SLGPHYNPTHKSsod_Cu/Zn PF00080.19
280R[DN]E[GM][GY]E[LE]RHYGDLGN[VM]RQDGKGVV[KM][TW]D[IF]VDKLLPL[SR]GP[TR]SV[LI]GRS[VM]VIHYD[NR]DD[LM]G[KR]GGN[VA][VM]S[LY][TQ]TGNAGT[RP]LAC[AC]VIARsod_Cu/Zn PF00080.19
380G[GC]WGWLSRNPIS[NK]RPLVASKPT[NY]RPLQPT[DA][GE]LQPIFGIDVWEHAYY[LI][QK]YKNIRPKYVK[DR]WWNIVNW[DR][GK]V[VA]QF[GD]HW[AW][KY][GR]PCSod_Mn/Fe_C PF02777.17
485CCCFAIPEFDPKPENM[DK][LM]KWFGALVALALLNPN[PE]G[DK][GQ]RRKRQRRSTAVVDEIAELKAKVEKLEEQVNKLEEKDLGVHIHIGND[HY]HZapB PF06005.11
581WLLAFCYFIKVMPKKM[GP][AY]E[GF]IFDQRLN[HY]VLP[DK]LPYDFKDLEPFIDEEIMRIH[HY]L[GK]HHAAYVKK[LM]NIAEEKWAEDMEVKNV[NM]Sod_Mn/Fe_N PF00081.21

