Effect of Protonation State and N-Acetylation of Chitosan on Its Interaction with Xanthan Gum: A Molecular Dynamics Simulation Study

Abstract
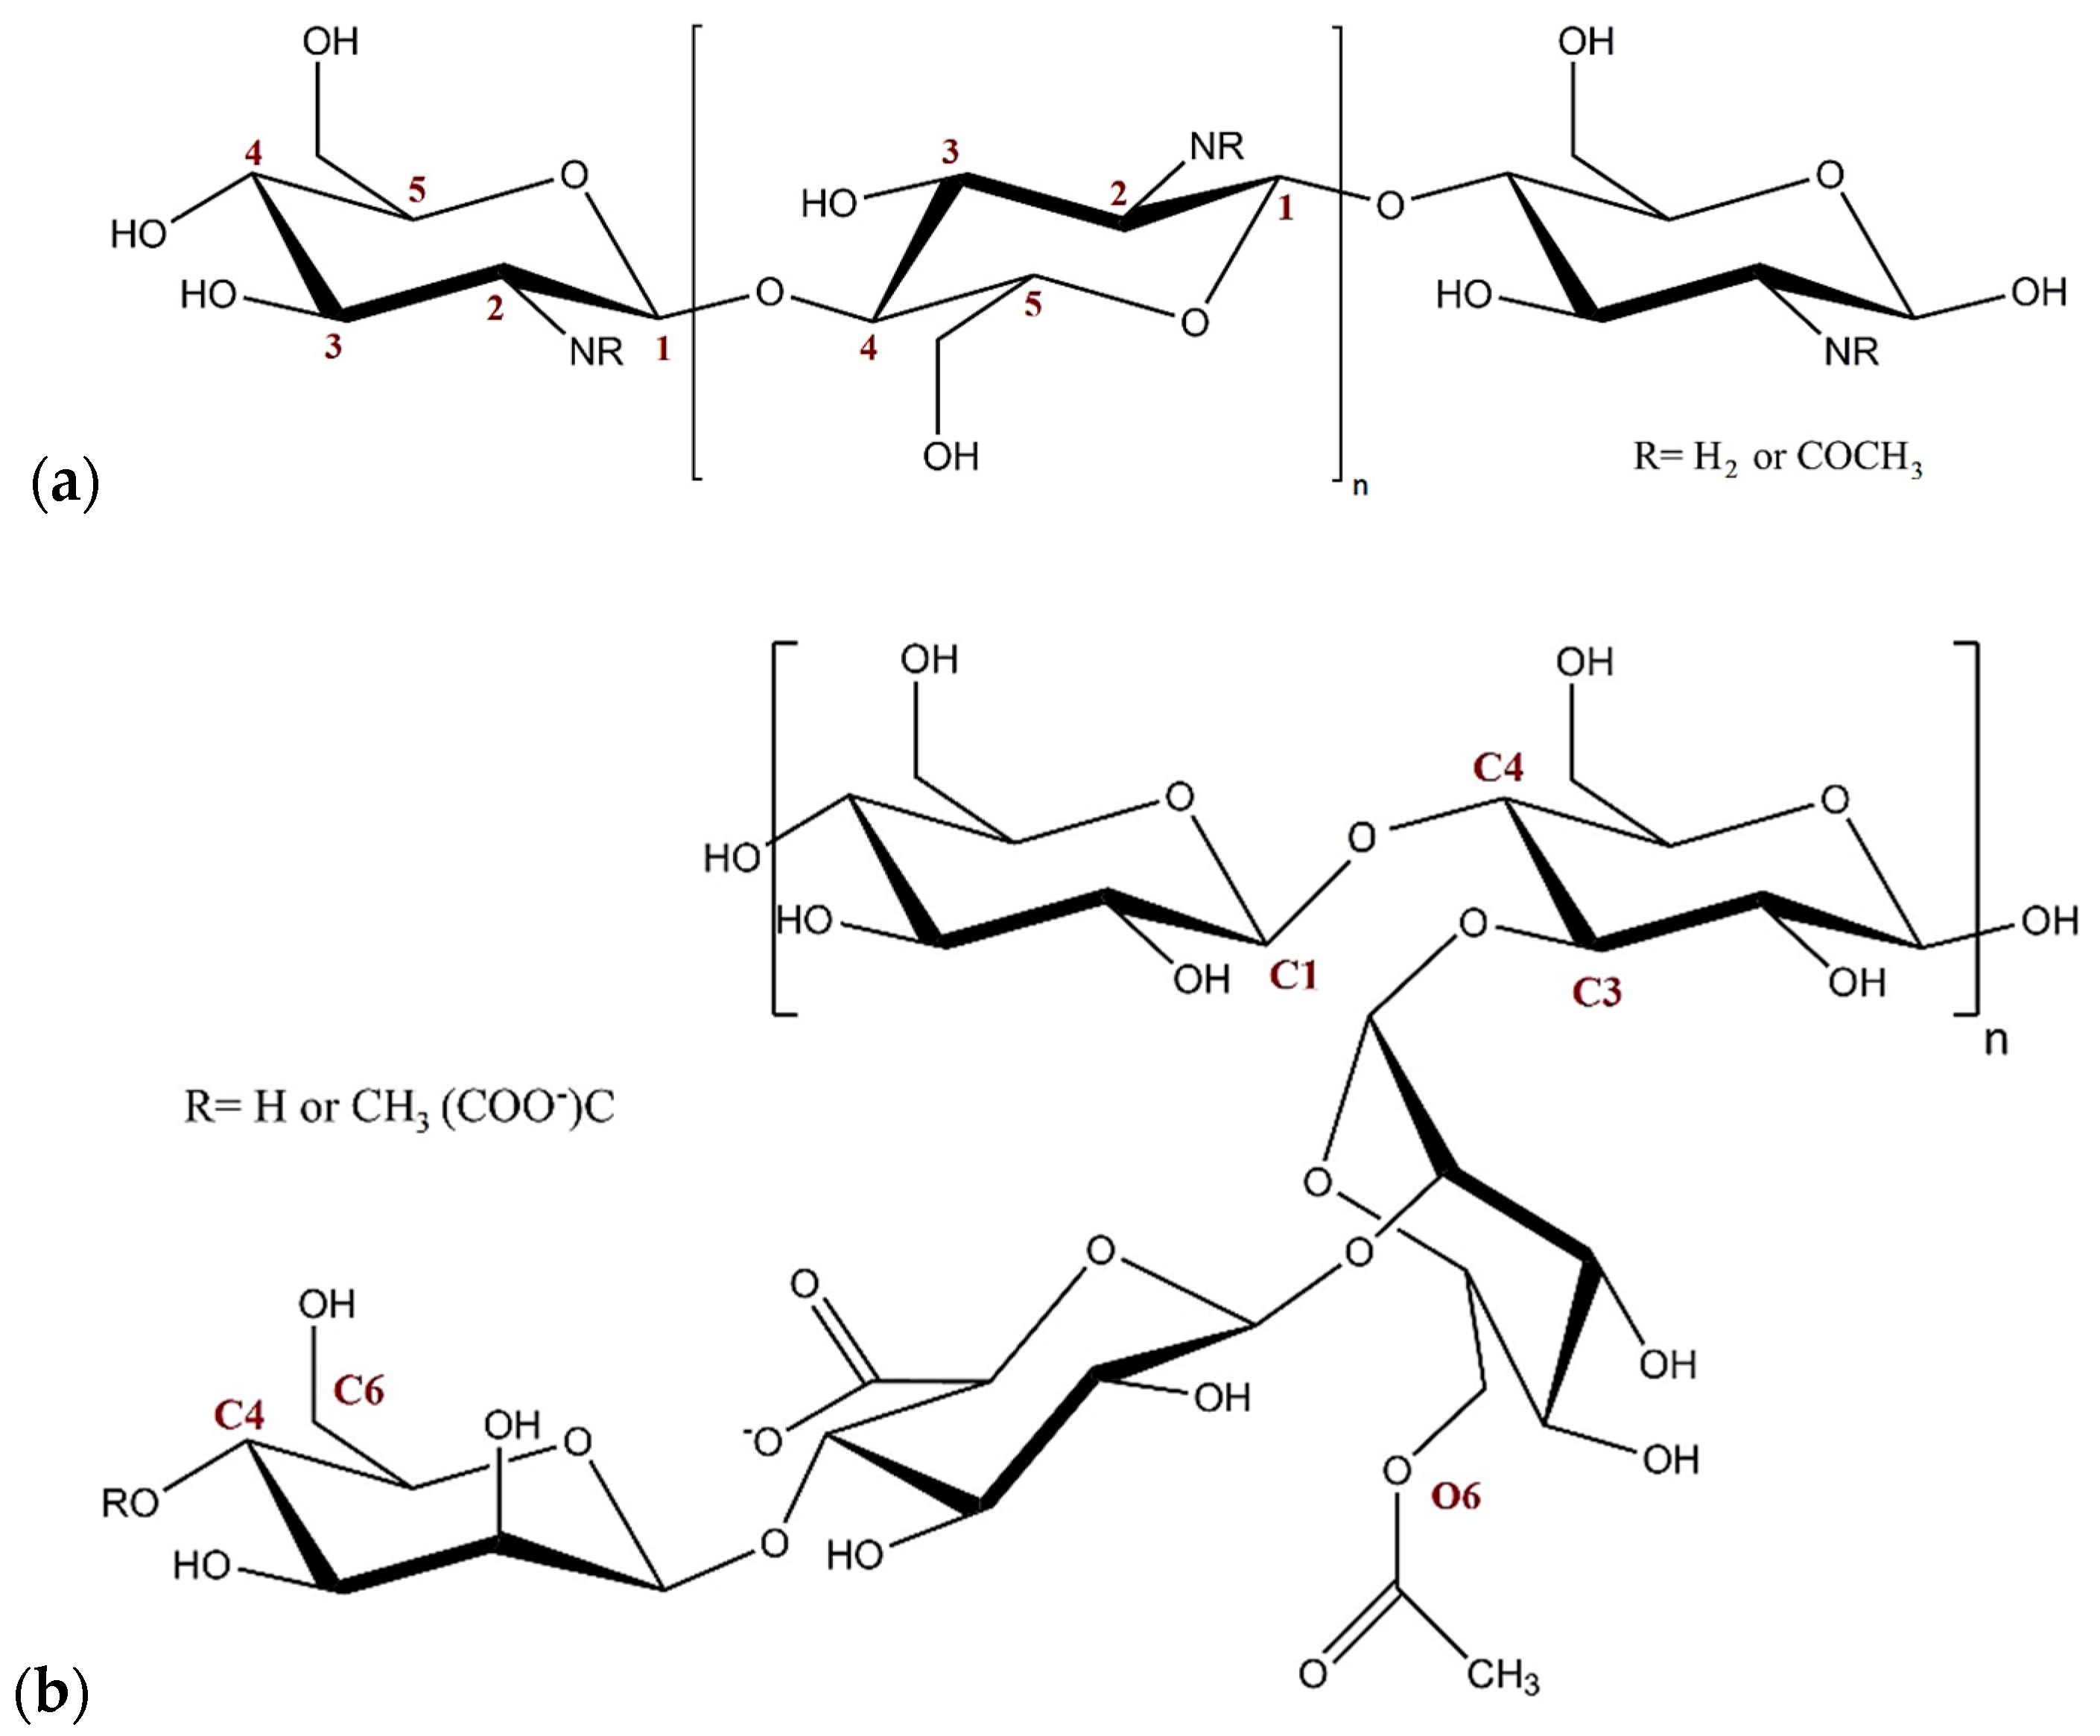
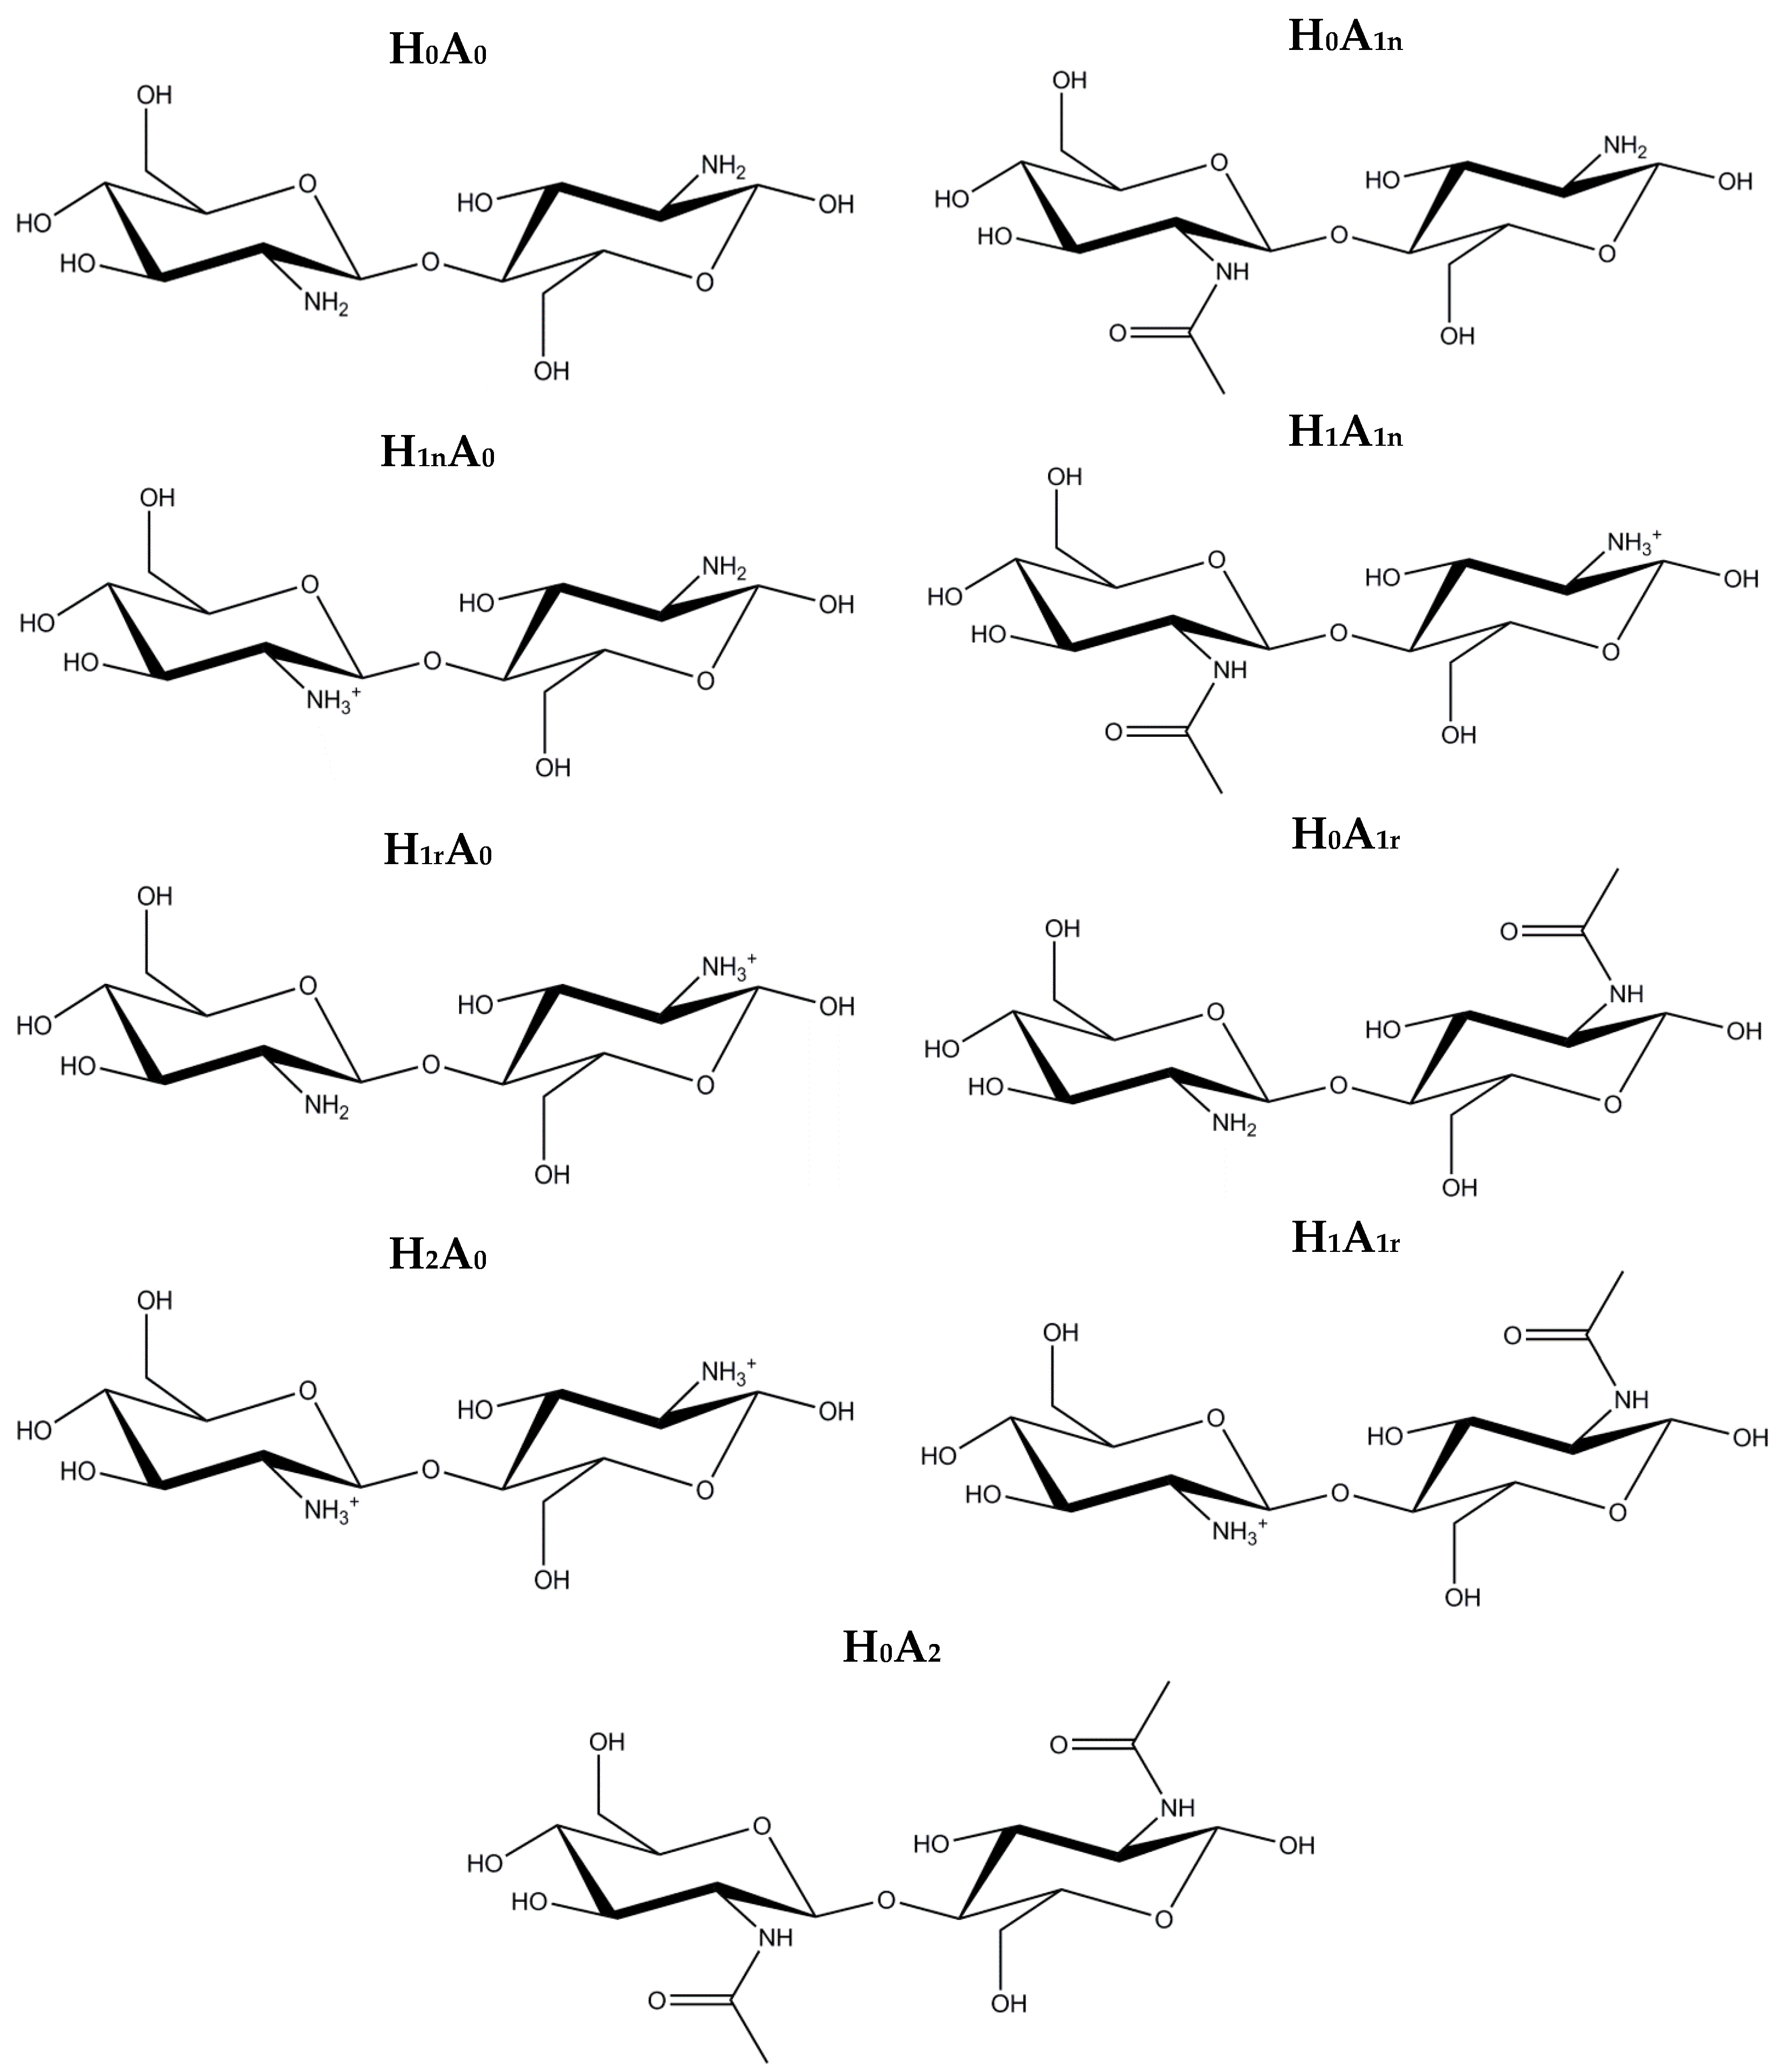
:1. Introduction
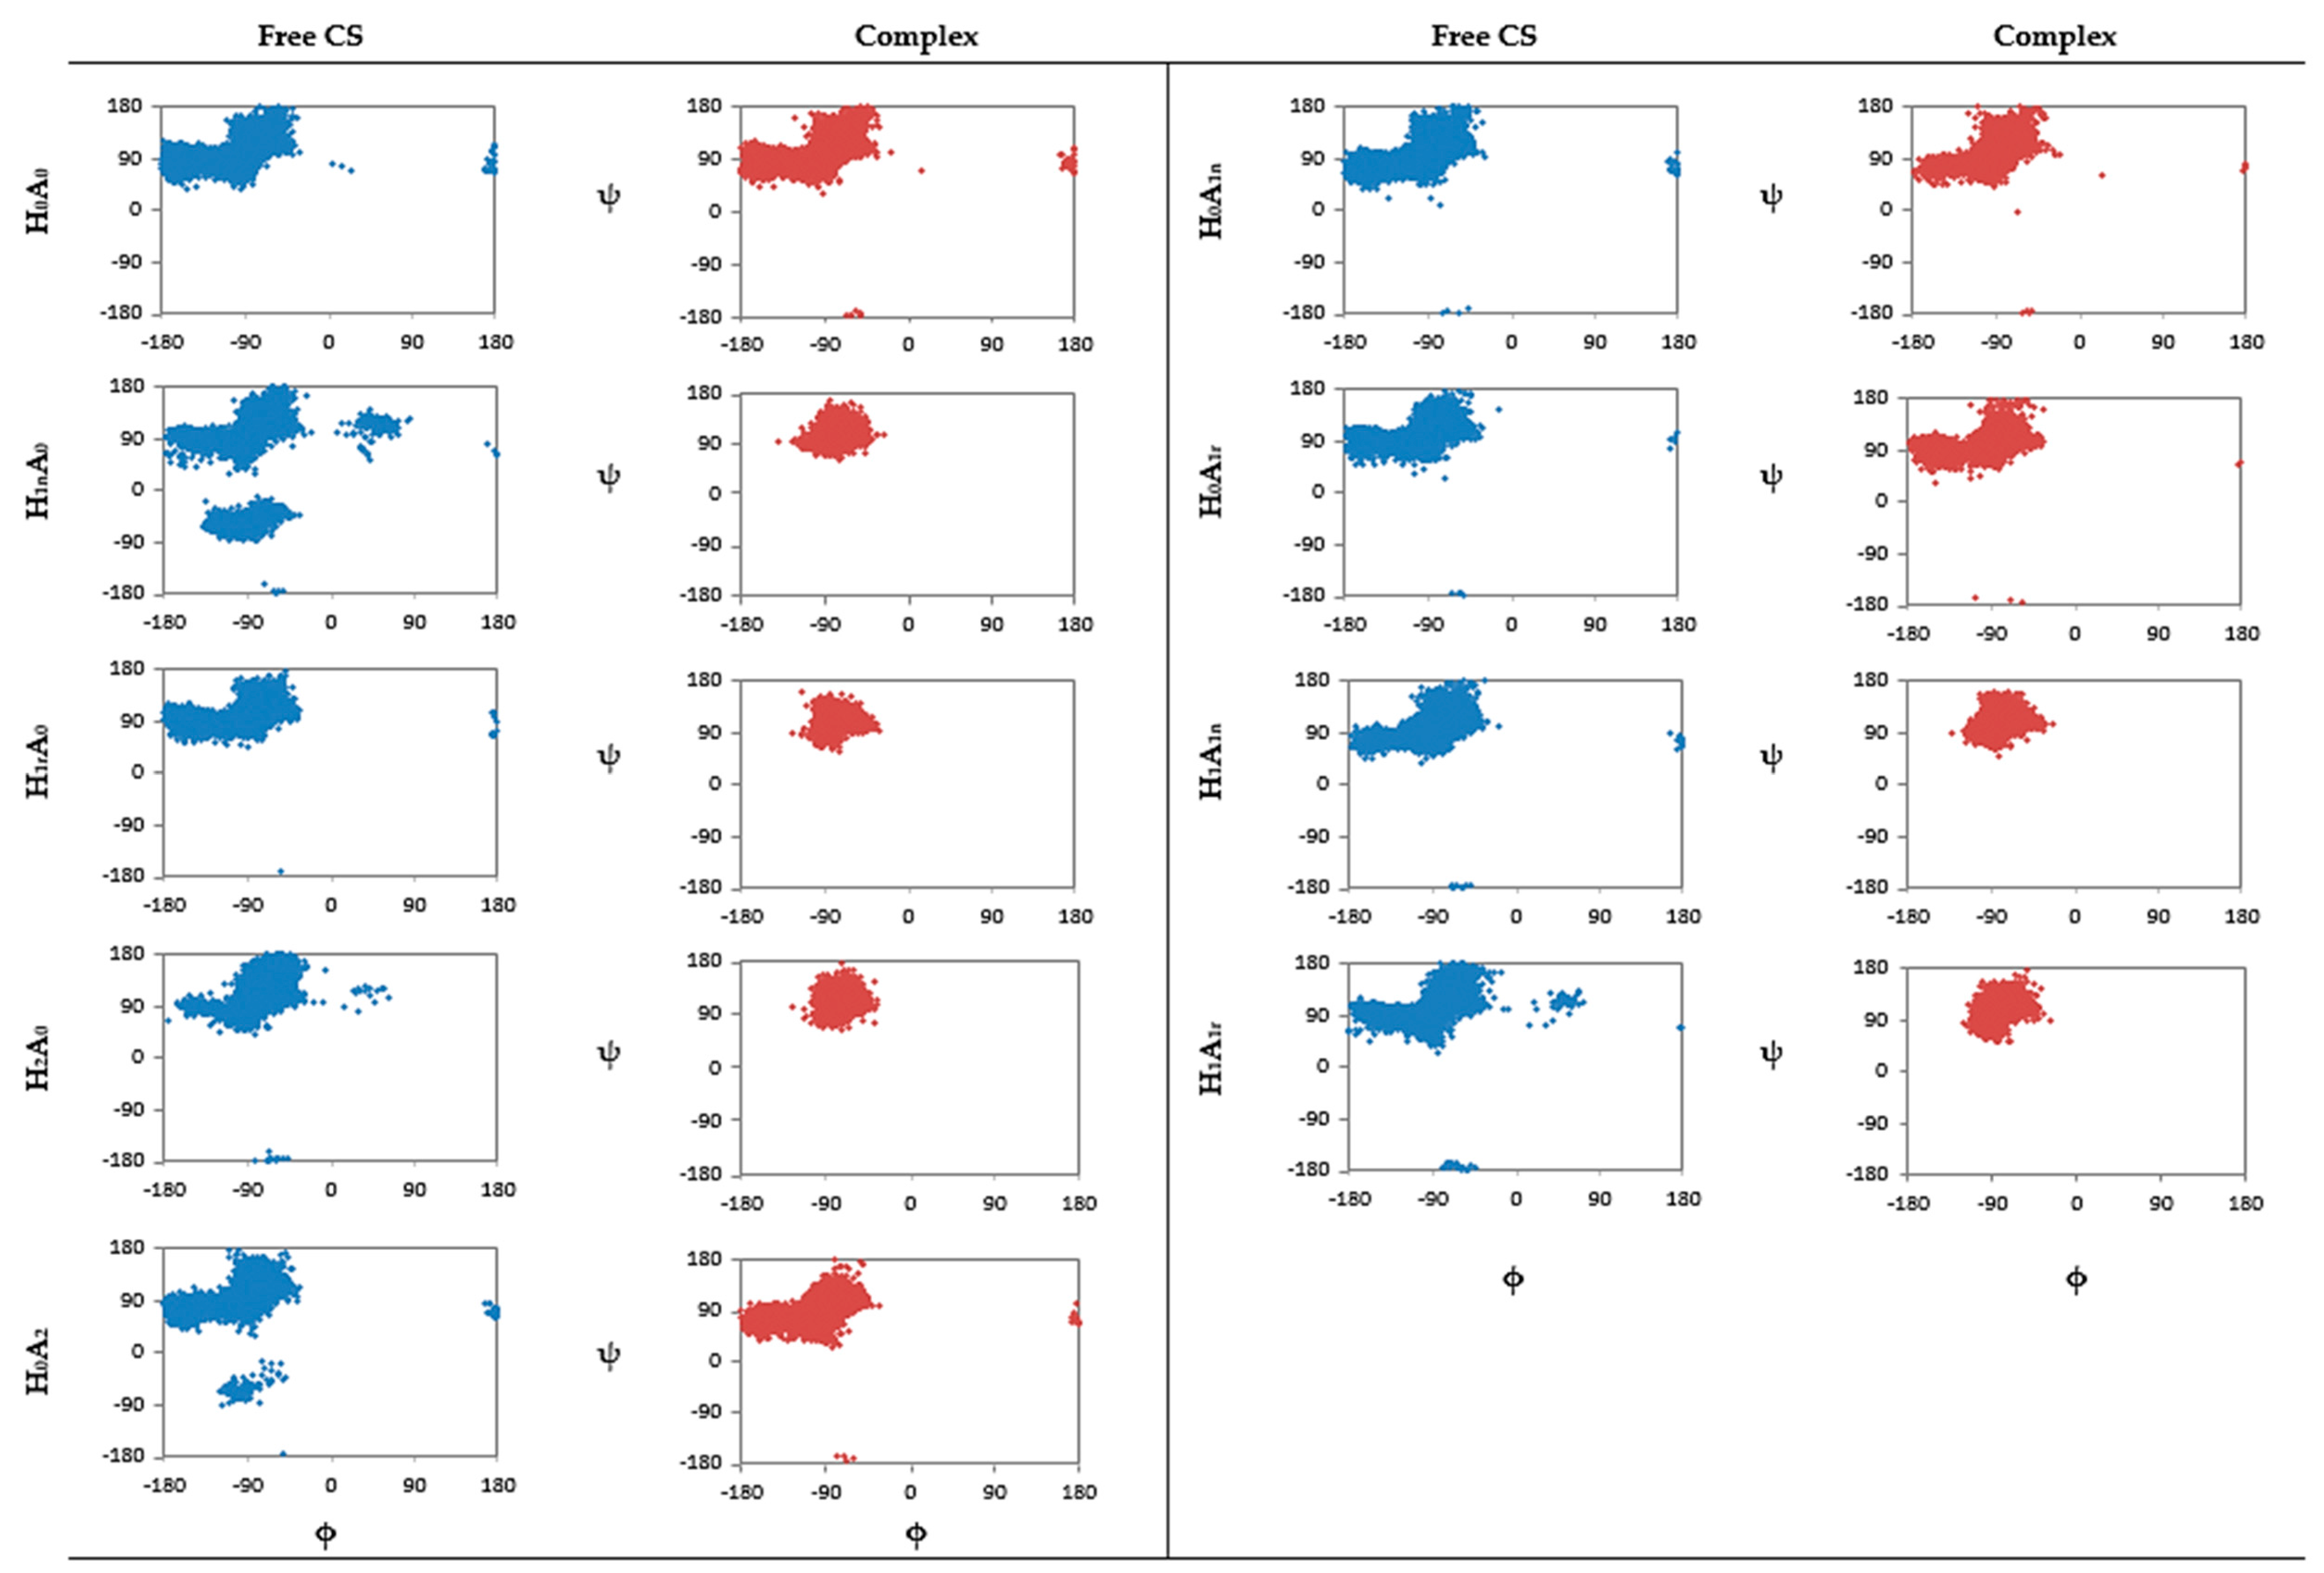
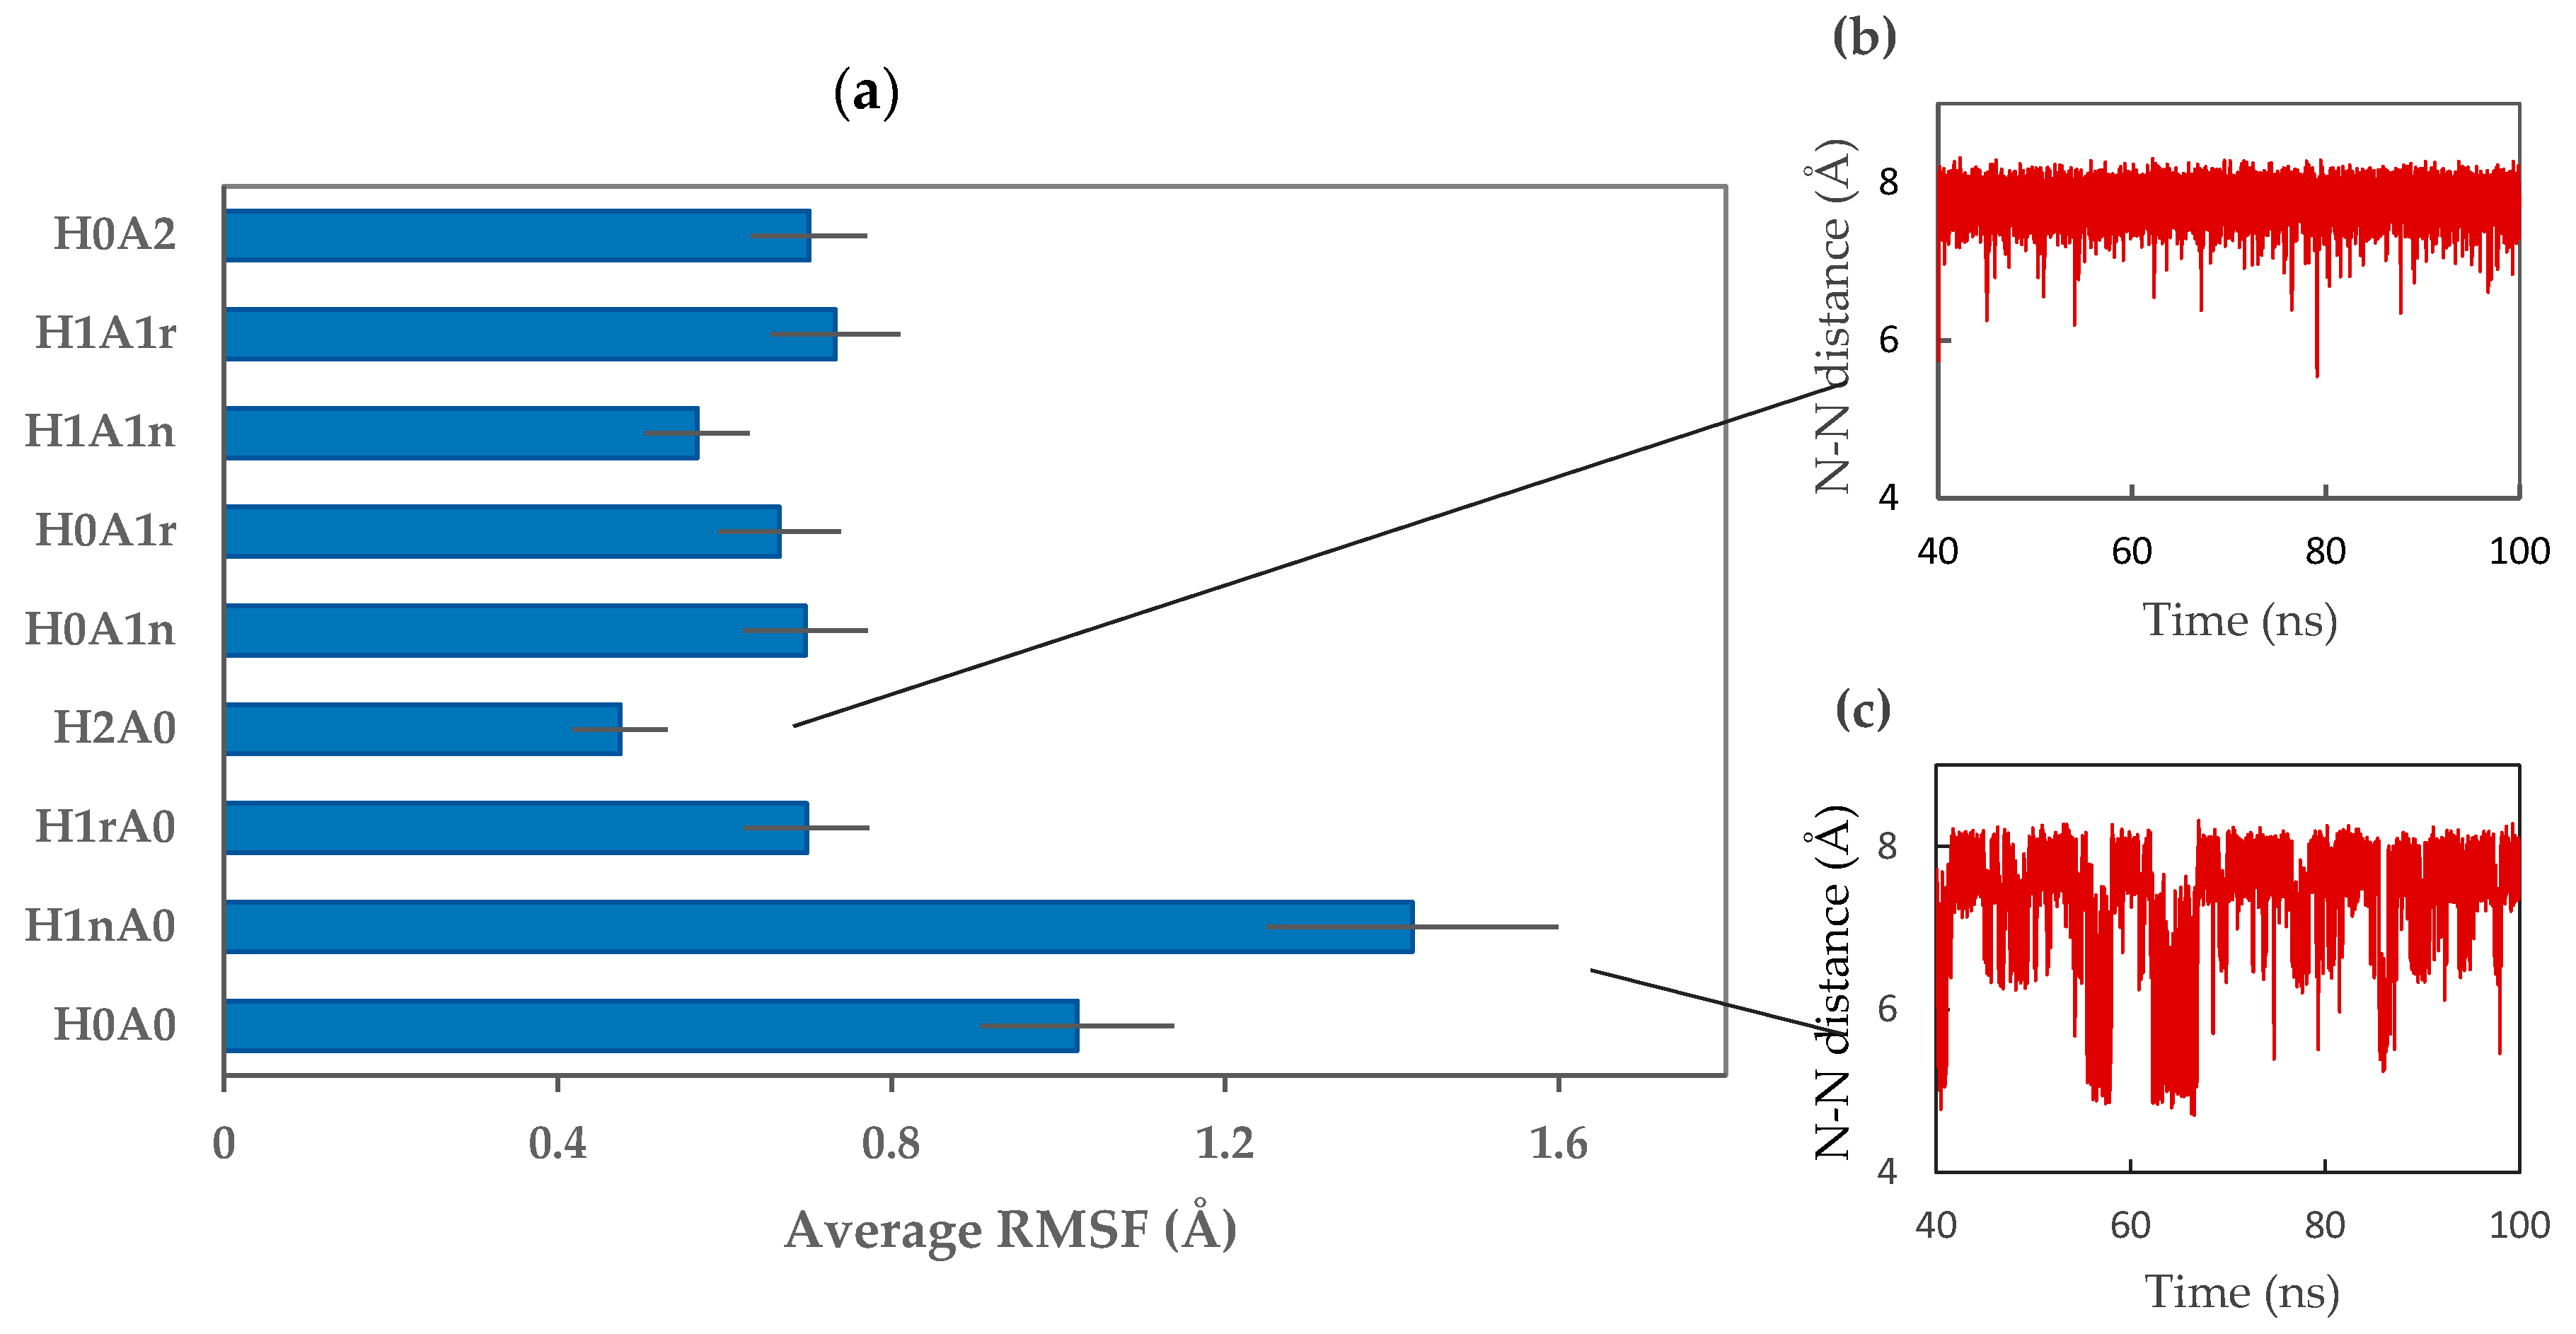
2. Results and Discussion
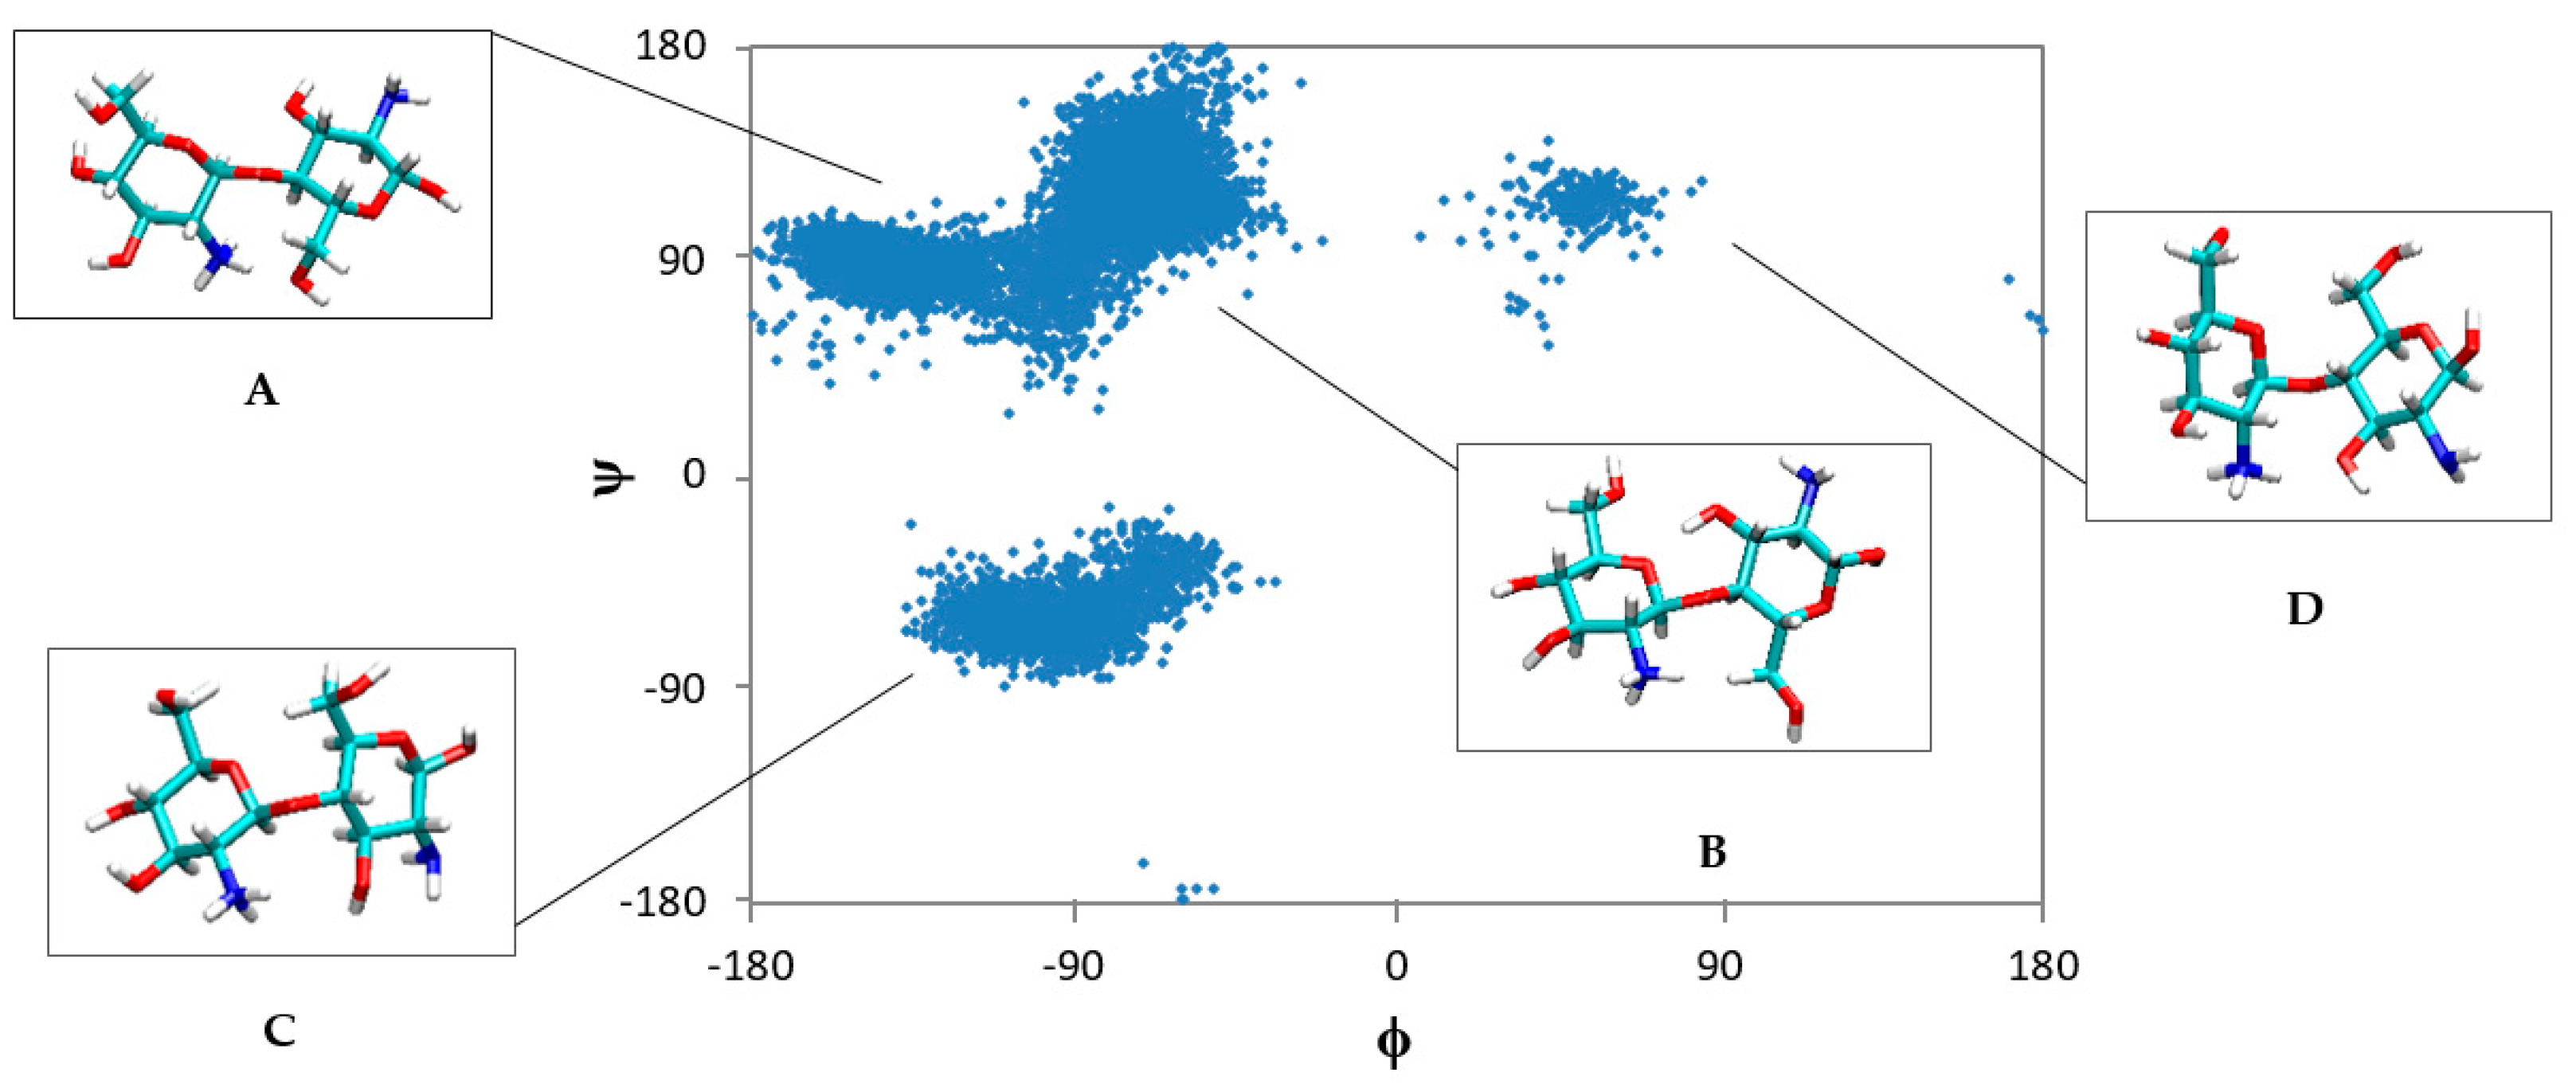
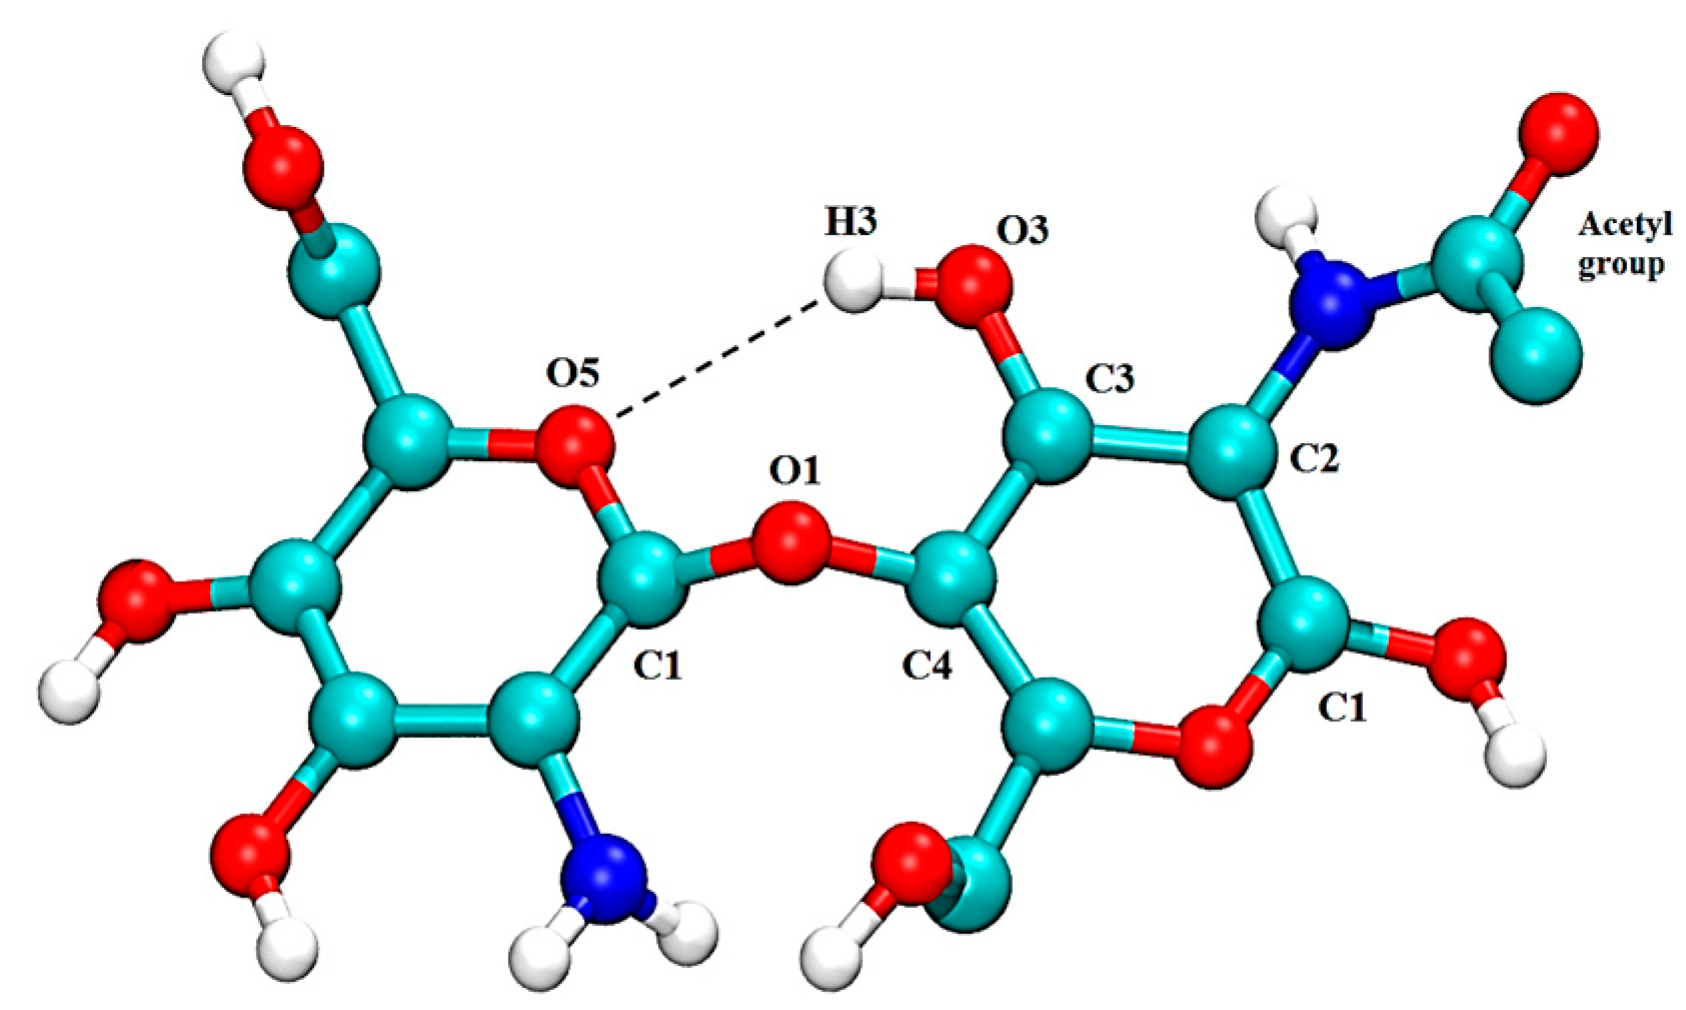
2.1. Free CS Dimers
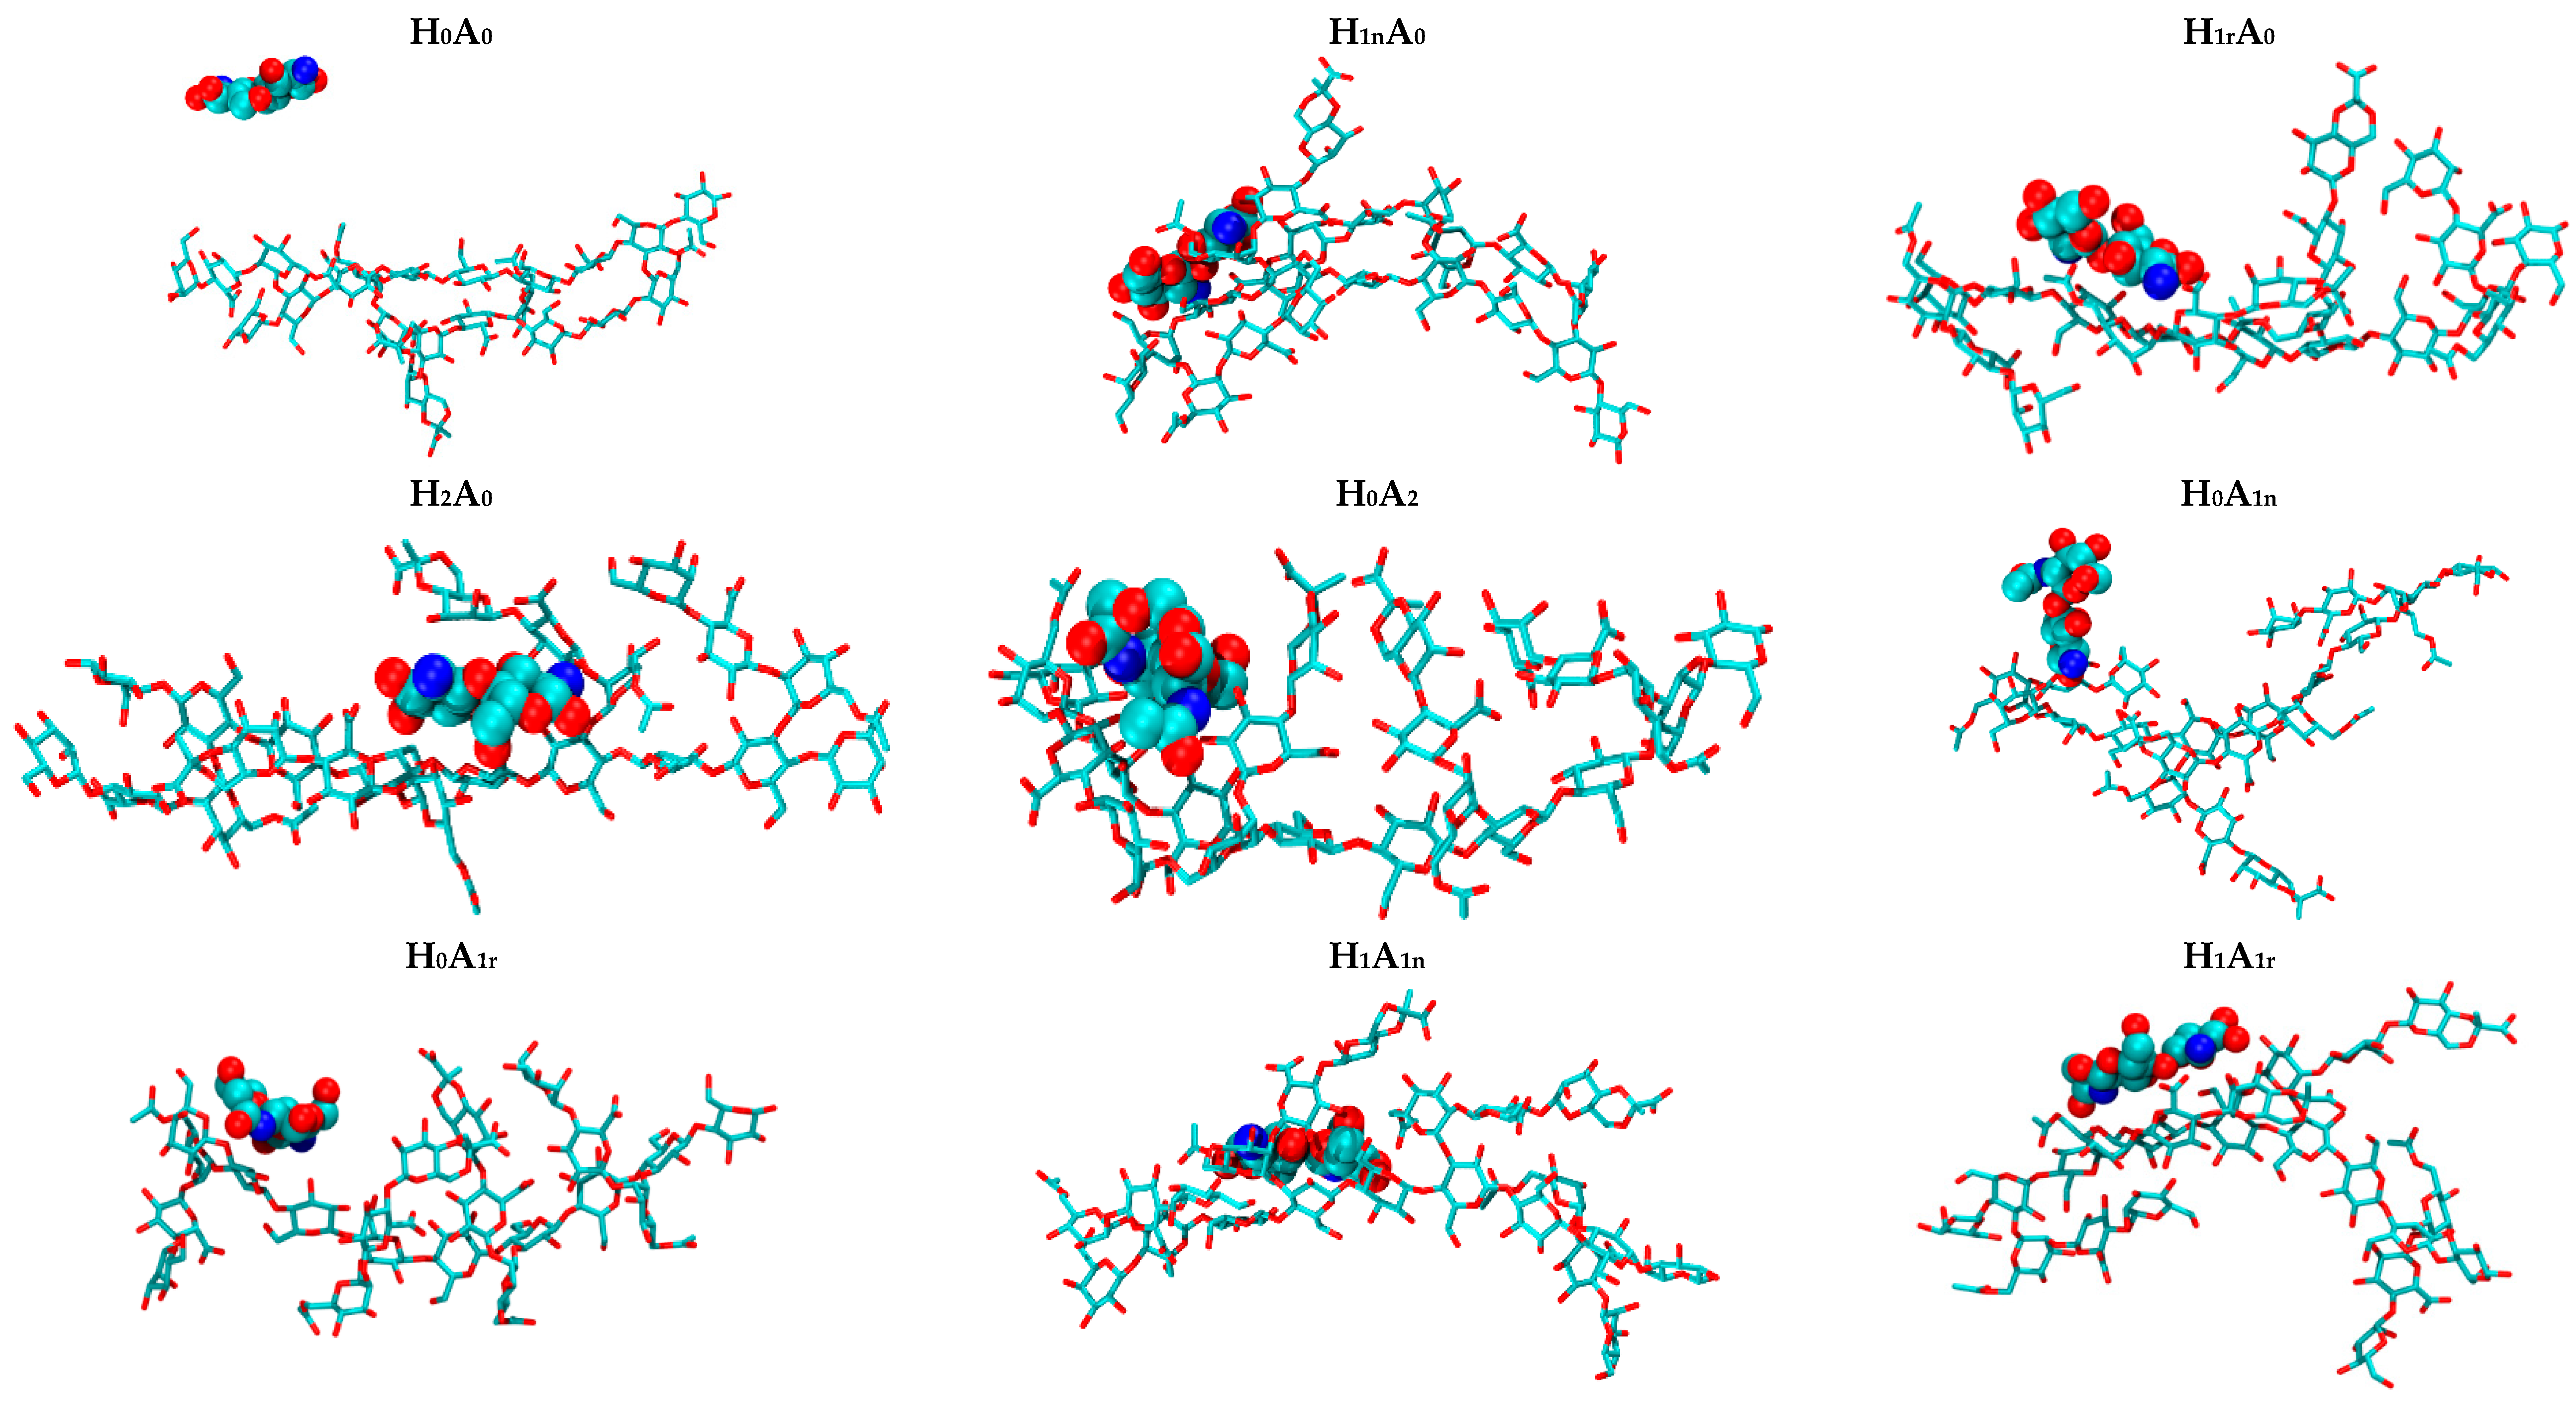
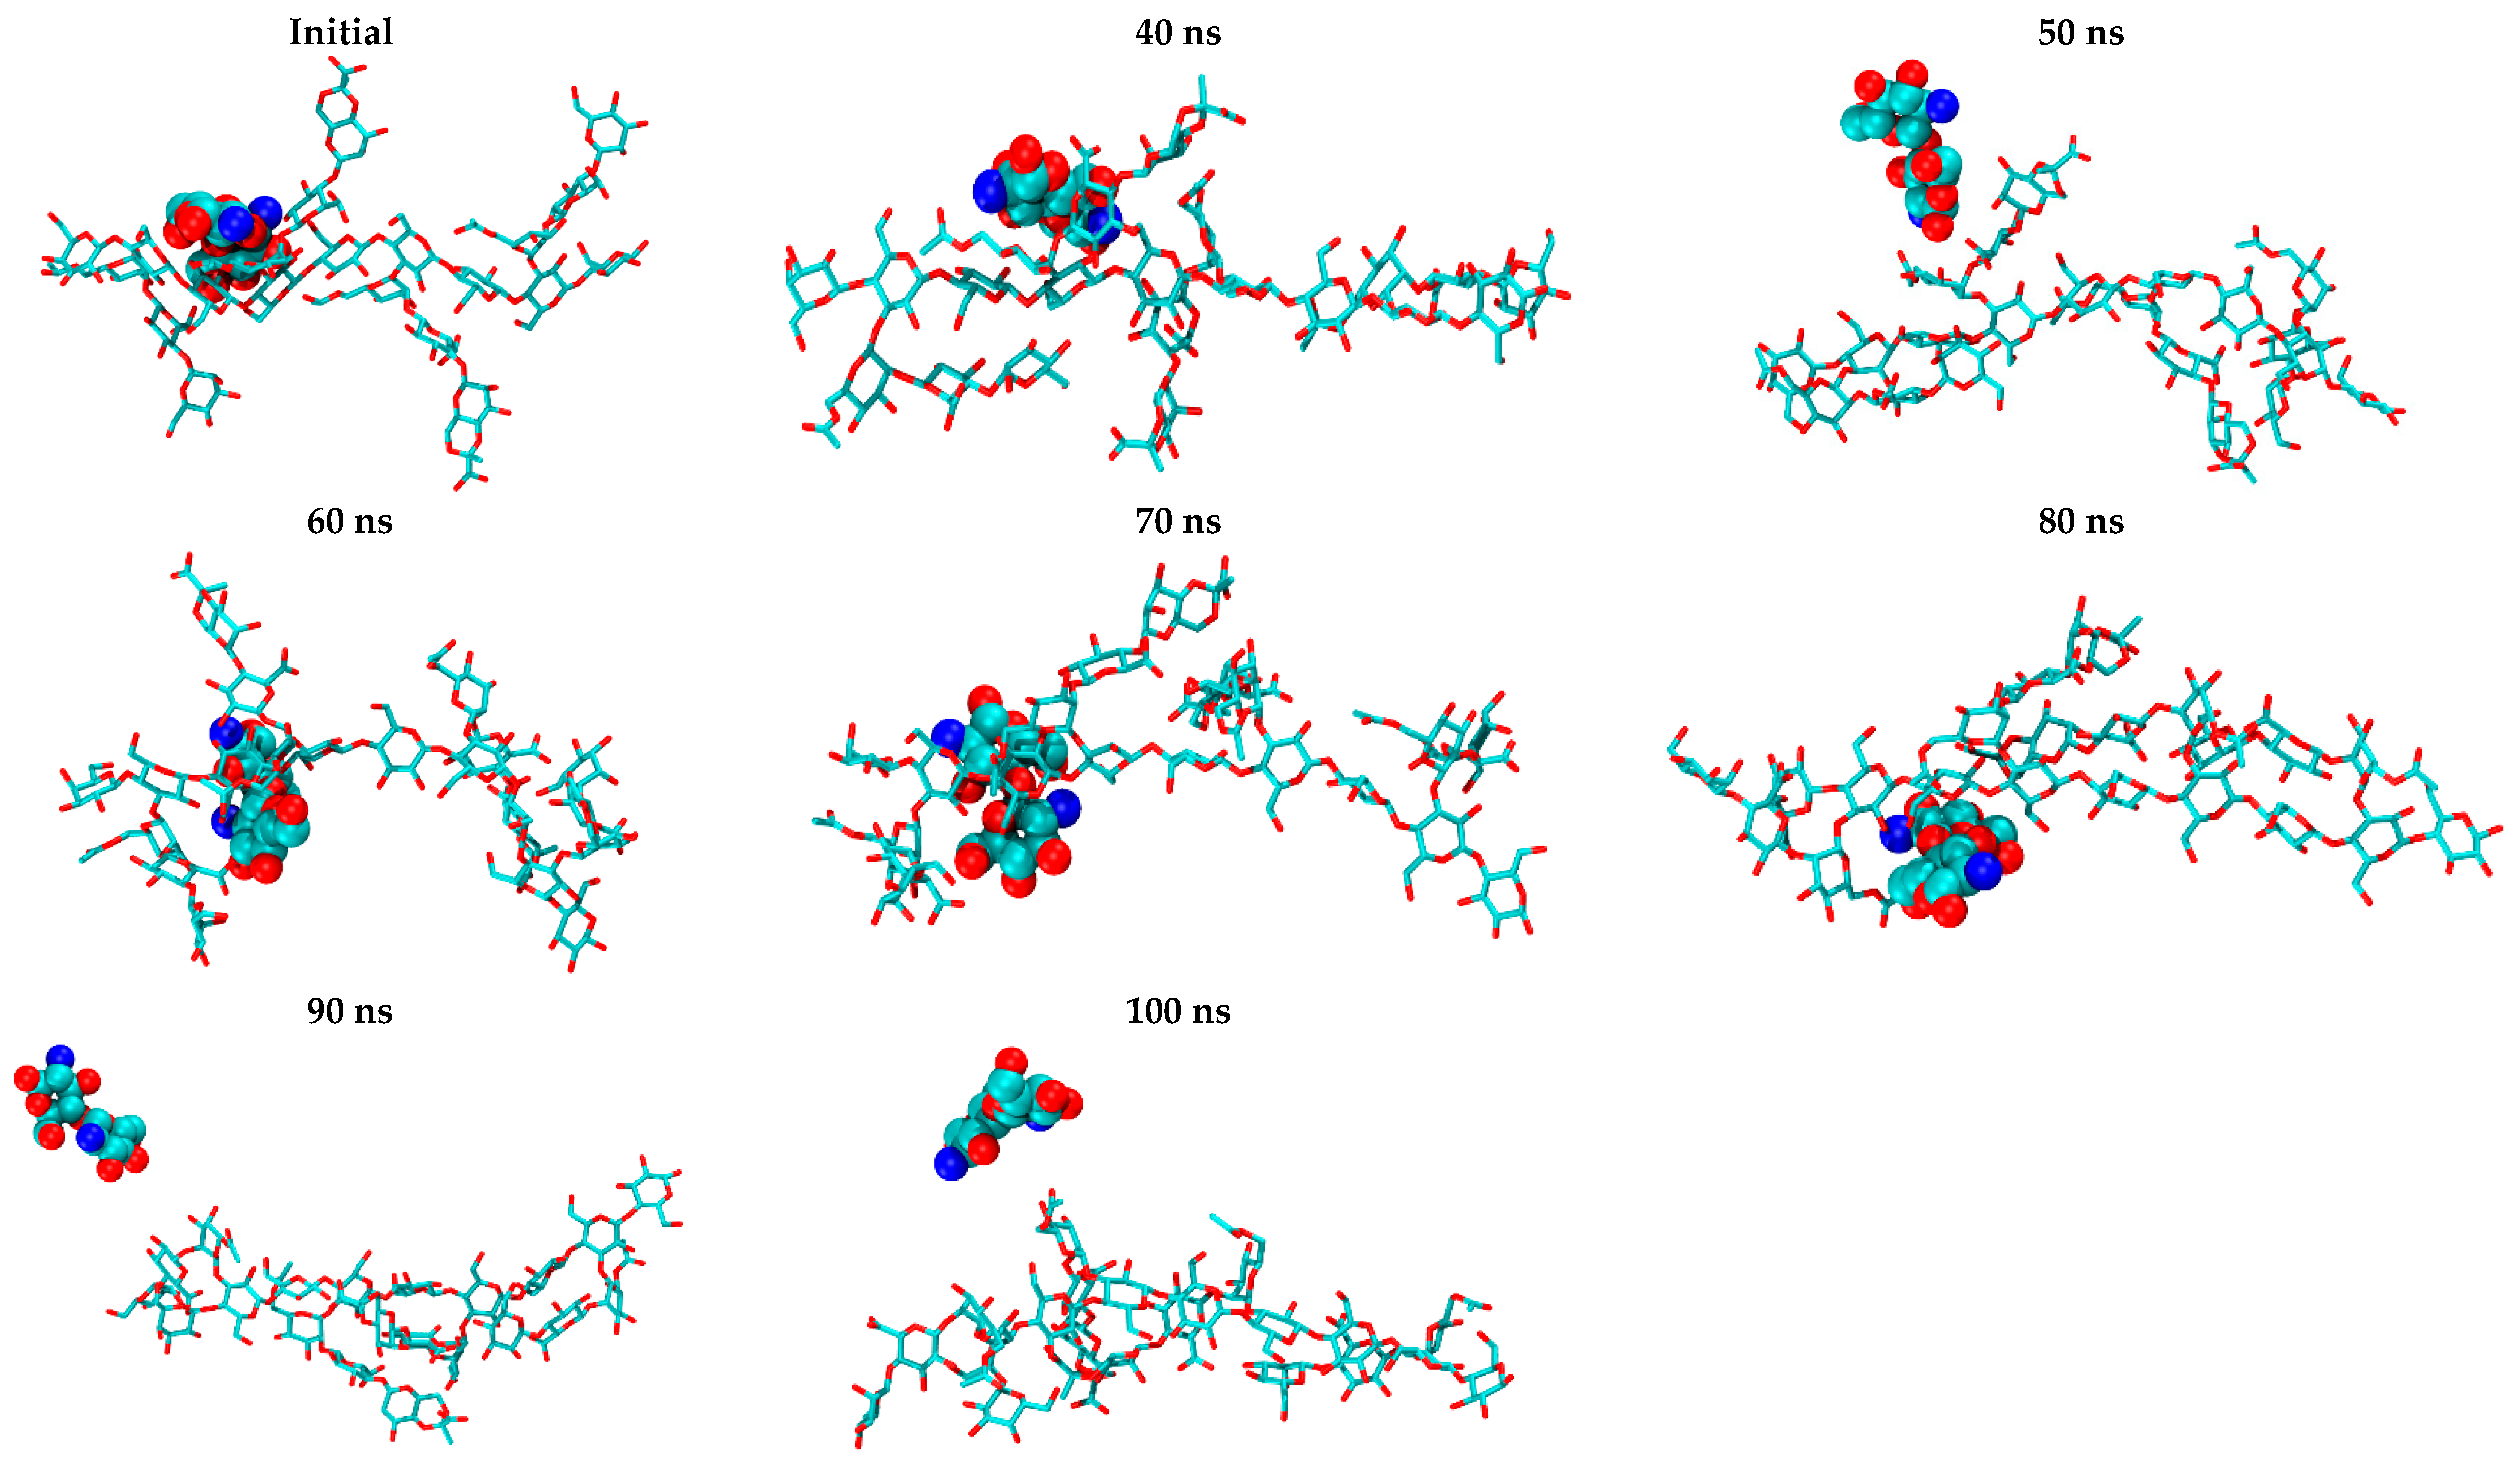
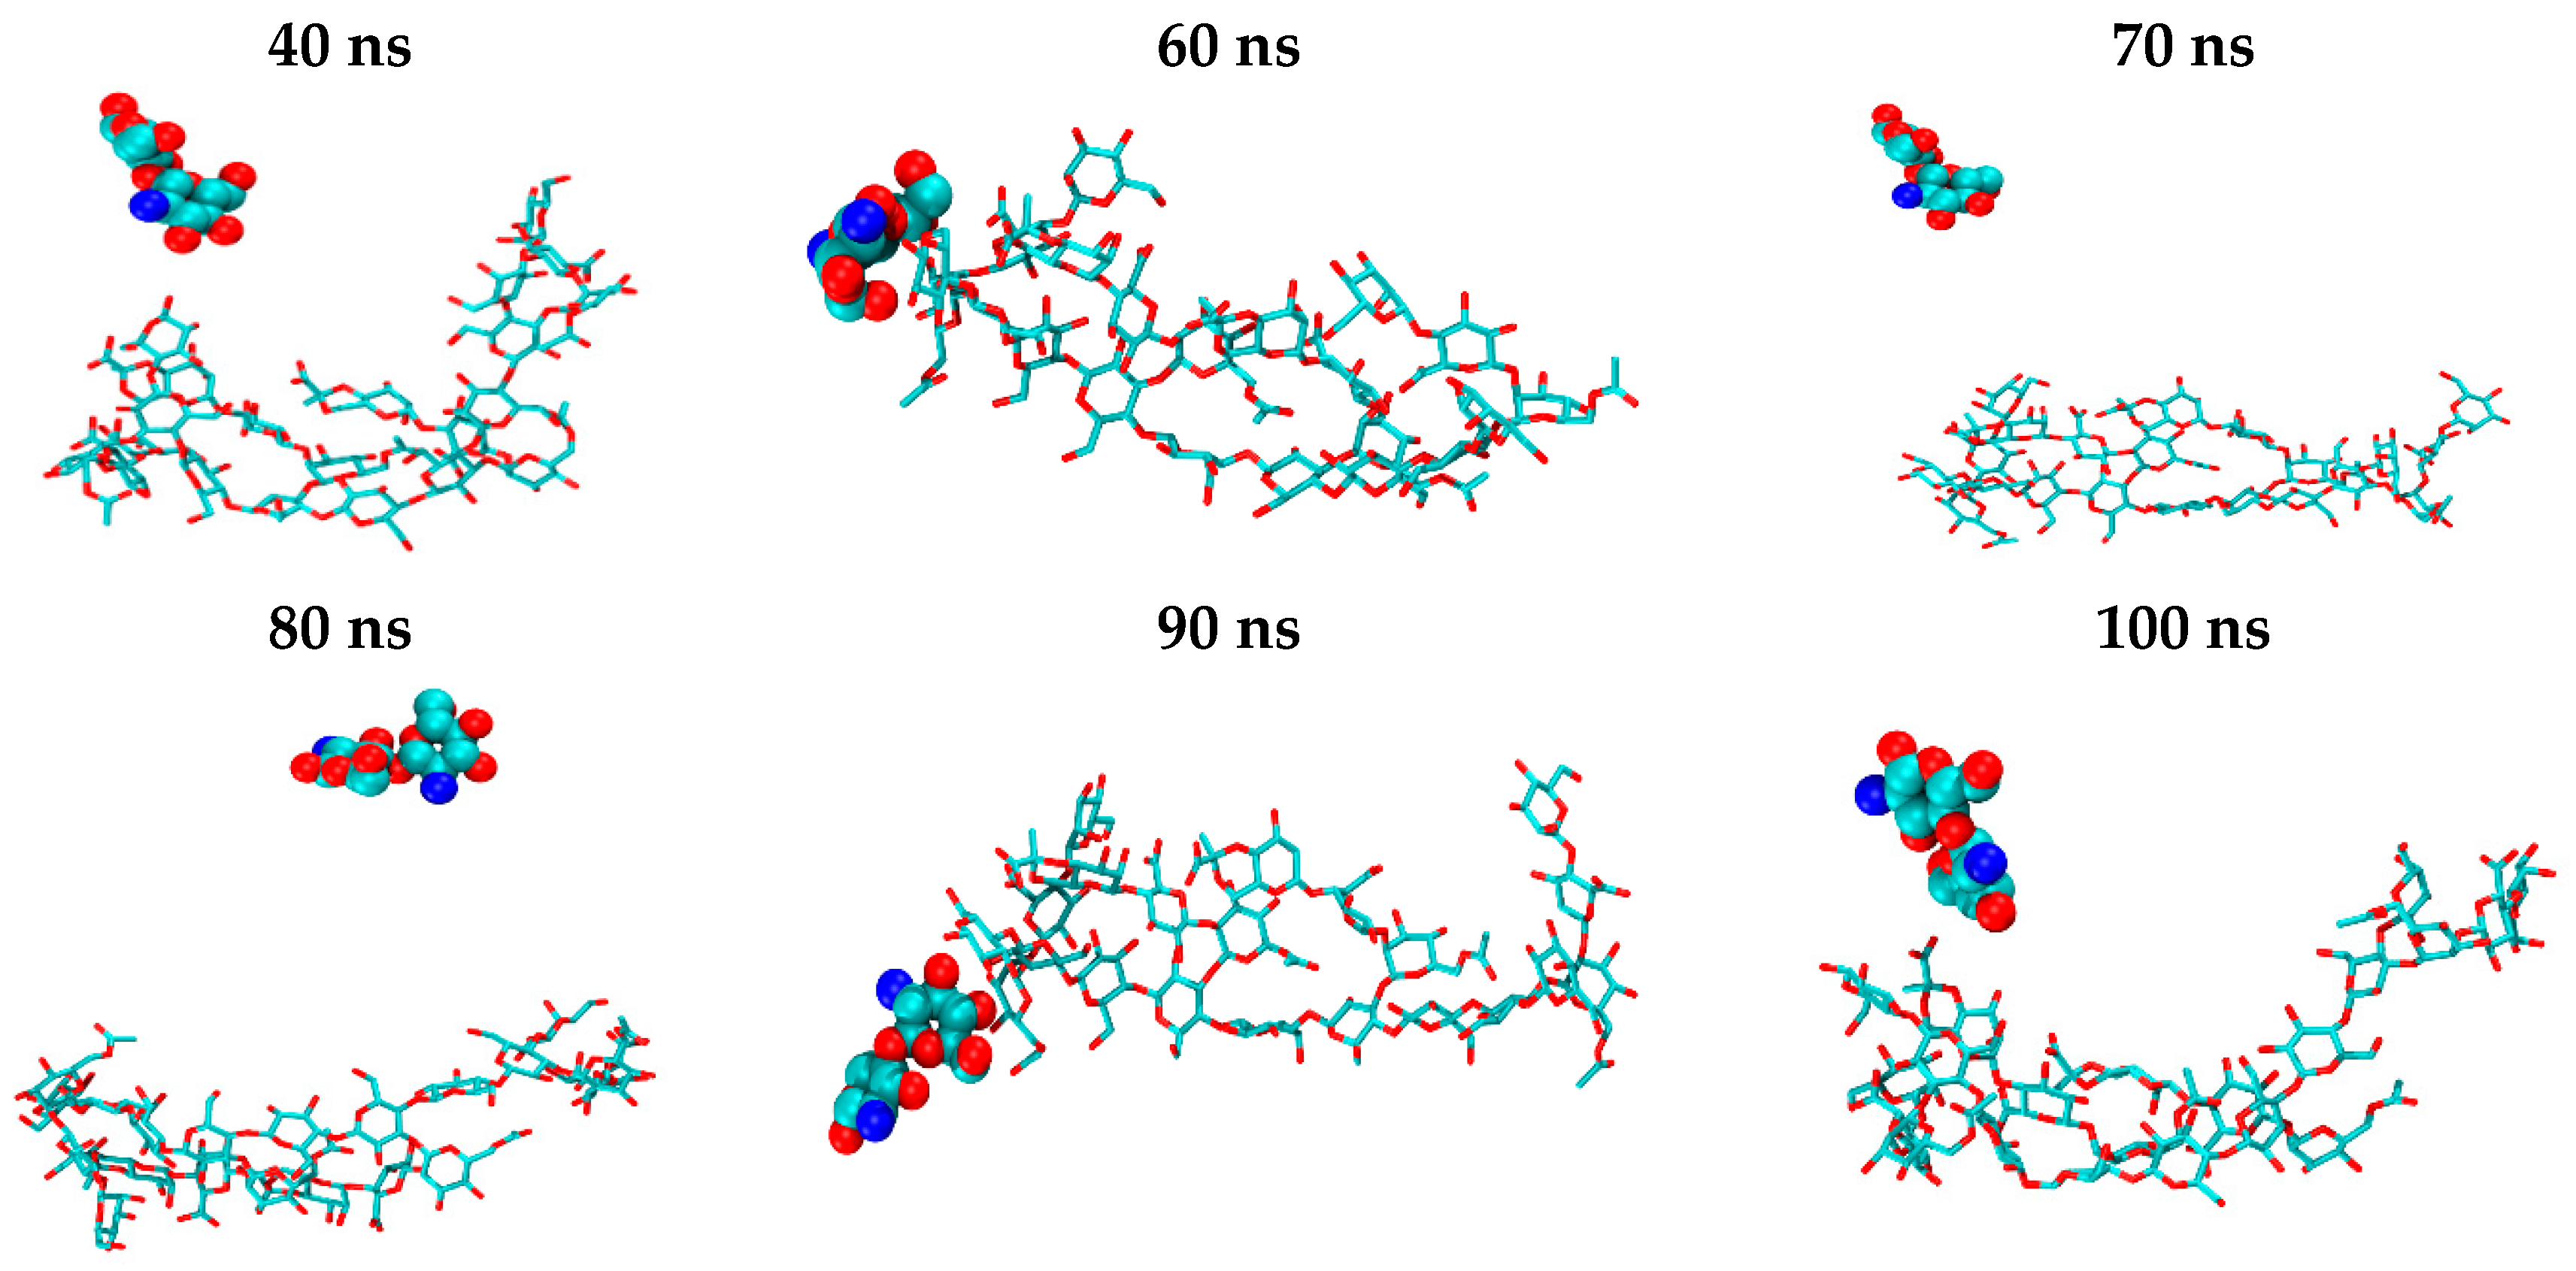
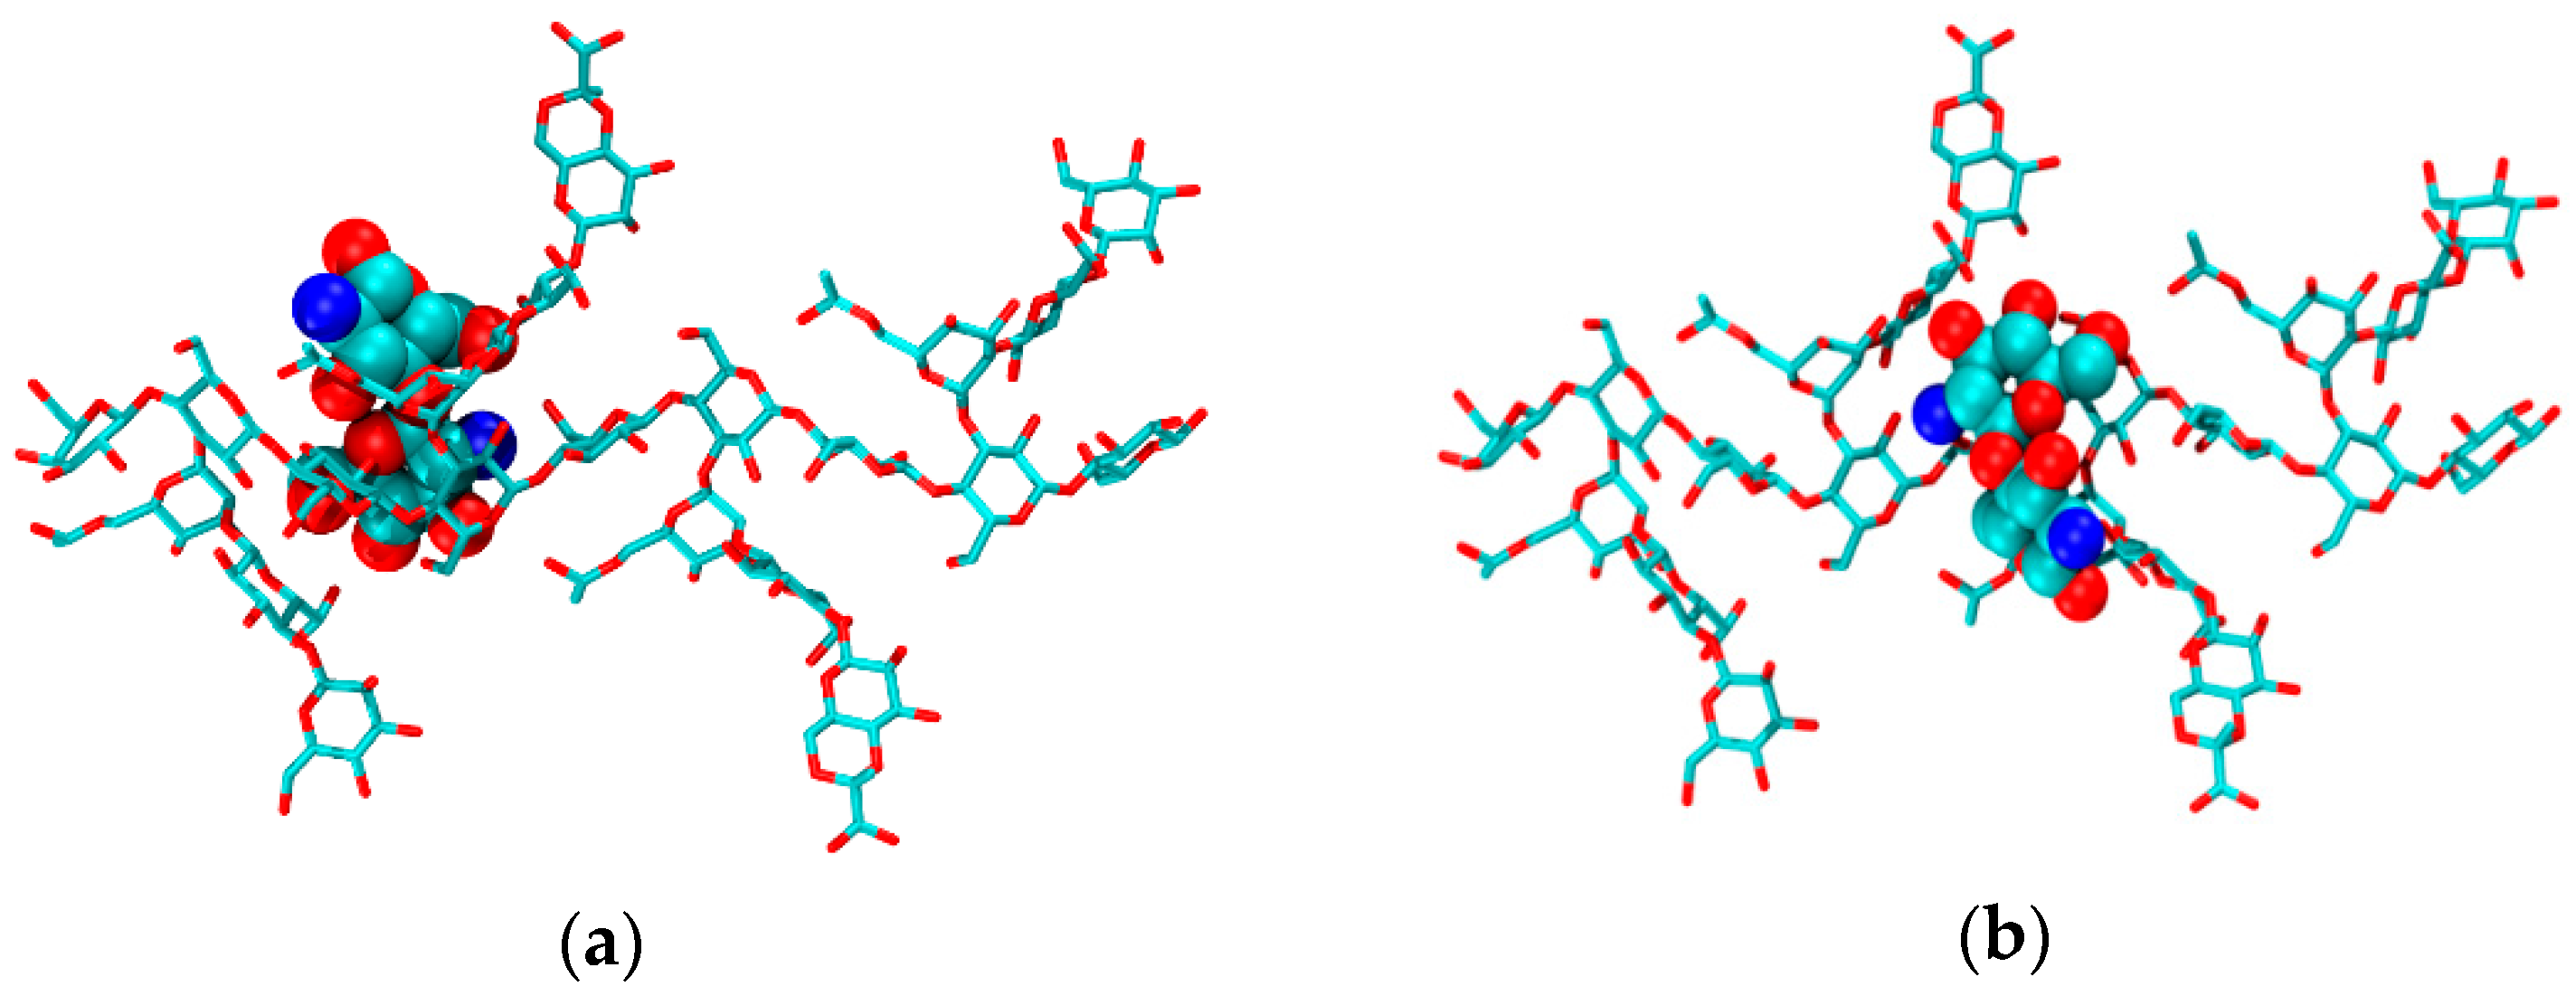
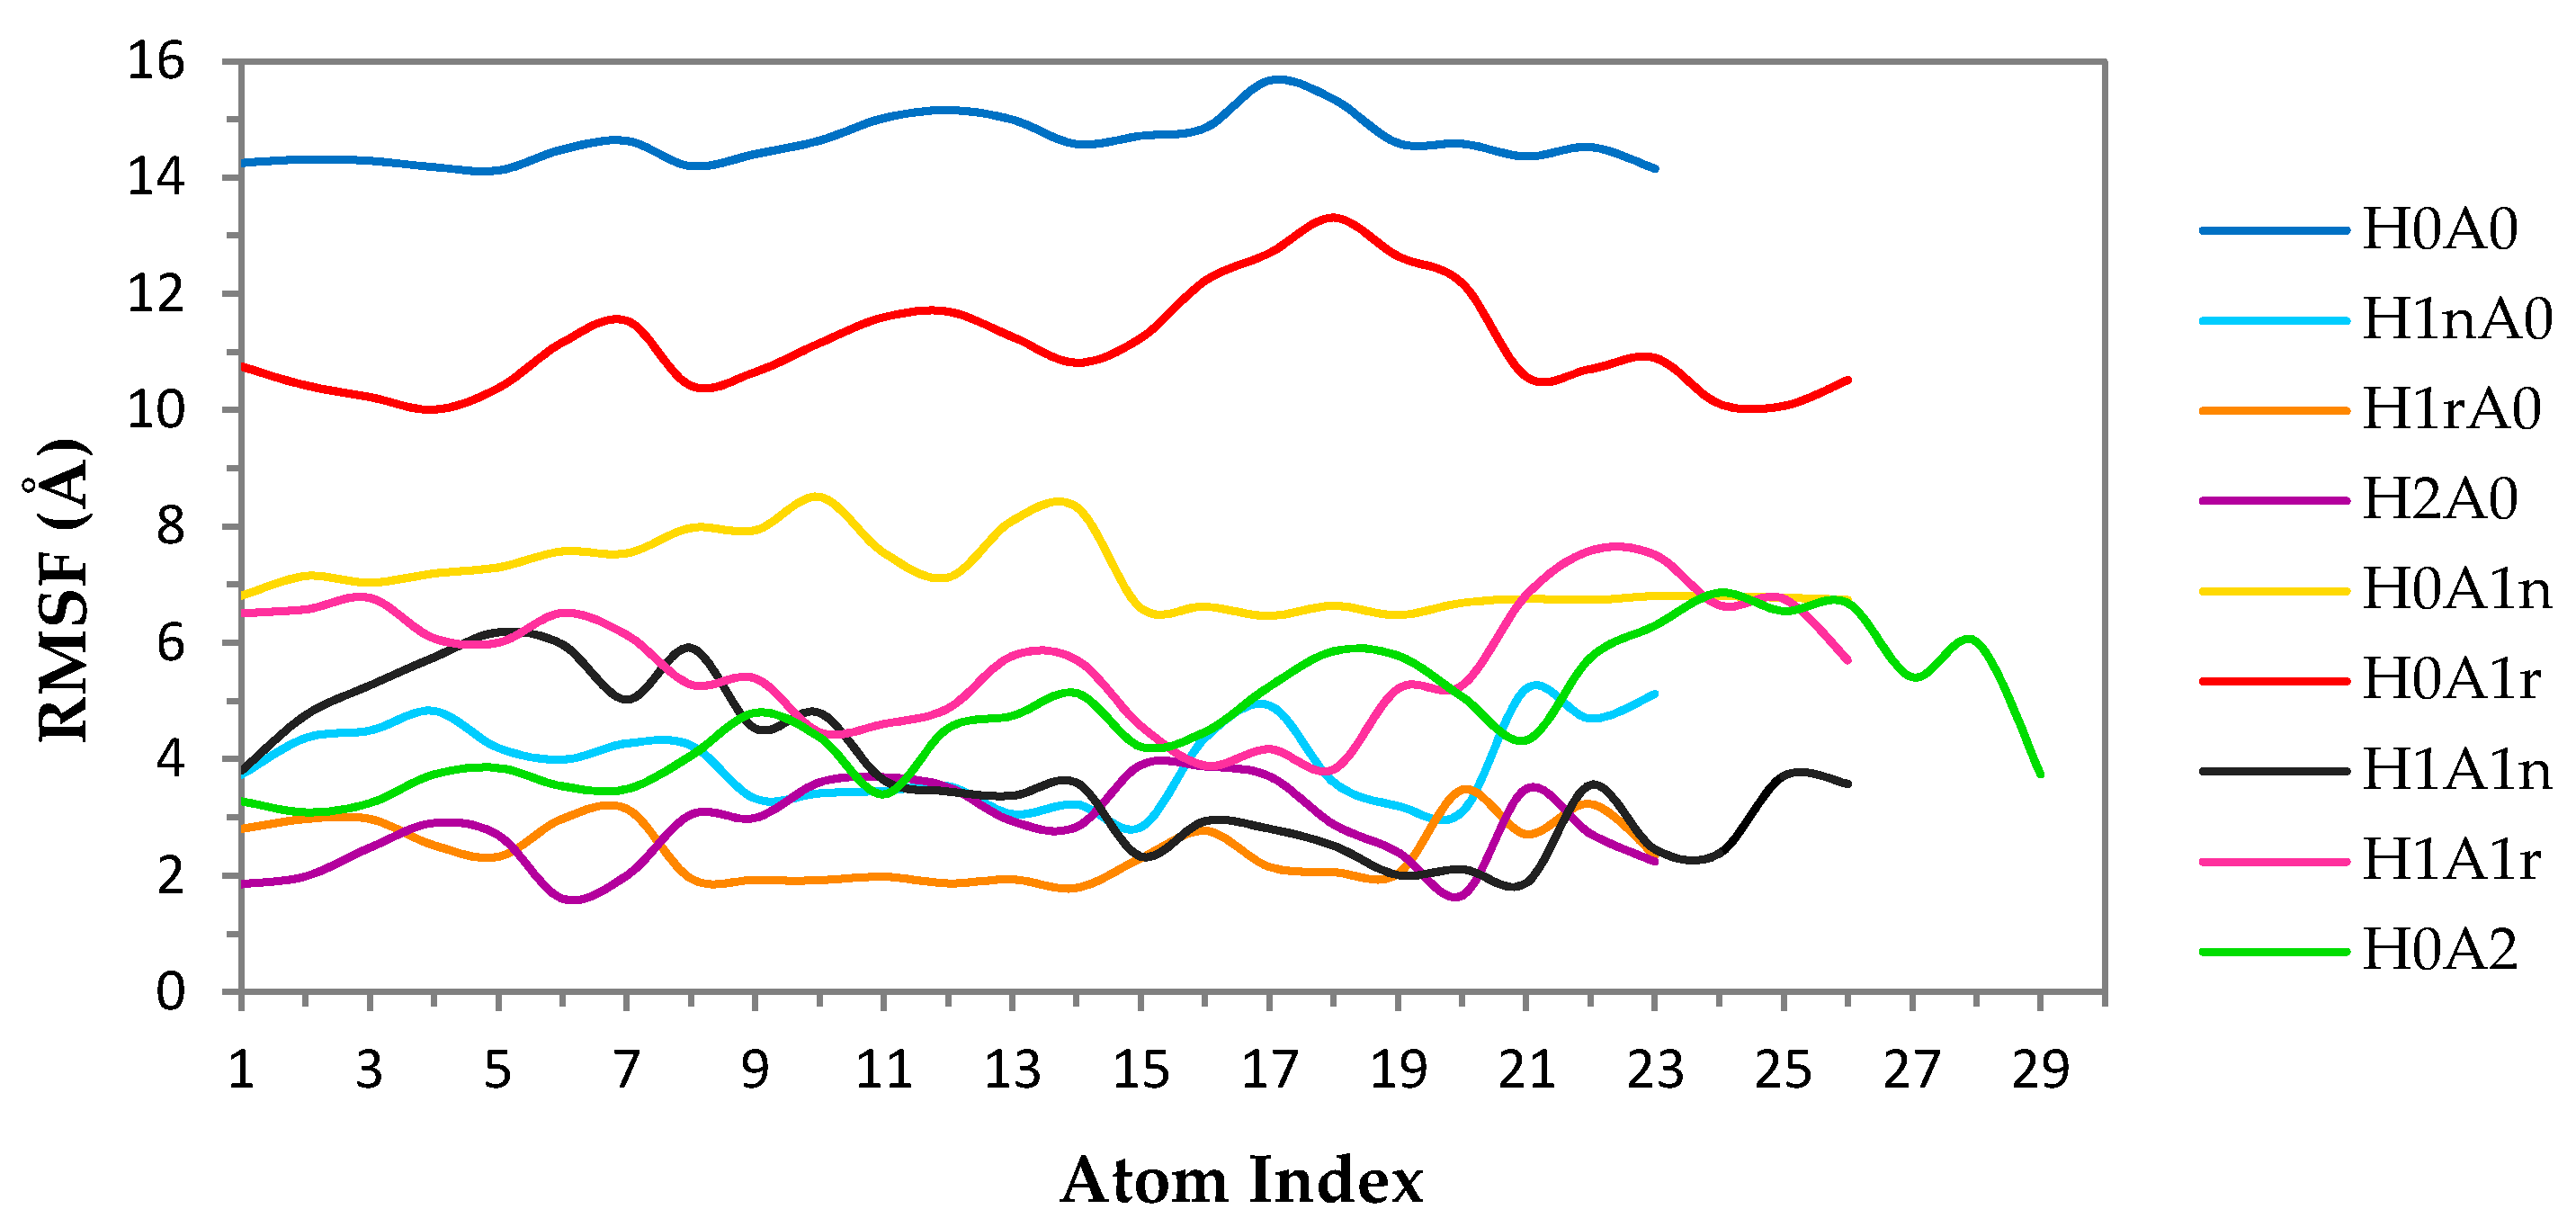
2.2. CS–XG Complexes
2.3. MM-PBSA
3. Computational Methods
4. Conclusions
Acknowledgments
Author Contributions
Conflicts of Interest
Abbreviations
References
- Alvarez-Lorenzo, C.; Blanco-Fernandez, B.; Puga, A.M.; Concheiro, A. Crosslinked ionic polysaccharides for stimuli-sensitive drug delivery. Adv. Drug Deliv. Rev. 2013, 65, 1148–1171. [Google Scholar] [CrossRef] [PubMed]
- Tian, Y.; Shi, C.; Sun, Y.; Zhu, C.; Sun, C.C.; Mao, S. Designing micellar nanocarriers with improved drug loading and stability based on solubility parameter. Mol. Pharm. 2015, 12, 816–825. [Google Scholar] [CrossRef] [PubMed]
- Racoviţă, S.; Vasiliu, S.; Popa, M.; Luca, C. Polysaccharides based on micro-and nanoparticles obtained by ionic gelation and their applications as drug delivery systems. Rev. Roum. Chim. 2009, 54, 709–718. [Google Scholar]
- Lu, B.; Wang, C.F.; Wu, D.Q.; Li, C.; Zhang, X.Z.; Zhuo, R.X. Chitosan based oligoamine polymers: Synthesis, characterization, and gene delivery. J. Control. Release 2009, 137, 54–62. [Google Scholar] [CrossRef] [PubMed]
- Buschmann, M.D.; Merzouki, A.; Lavertu, M.; Thibault, M.; Jean, M.; Darras, V. Chitosans for delivery of nucleic acids. Adv. Drug Deliv. Rev. 2013, 65, 1234–1270. [Google Scholar] [CrossRef] [PubMed]
- Chang, K.L.; Tsai, G.; Lee, J.; Fu, W.R. Heterogeneous N-deacetylation of chitin in alkaline solution. Carbohydr. Res. 1997, 303, 327–332. [Google Scholar] [CrossRef]
- Younes, I.; Sellimi, S.; Rinaudo, M.; Jellouli, K.; Nasri, M. Influence of acetylation degree and molecular weight of homogeneous chitosans on antibacterial and antifungal activities. Int. J. Food Microbiol. 2014, 185, 57–63. [Google Scholar] [CrossRef] [PubMed]
- Cho, Y.W.; Jang, J.; Park, C.R.; Ko, S.W. Preparation and solubility in acid and water of partially deacetylated chitins. Biomacromolecules 2000, 1, 609–614. [Google Scholar] [CrossRef] [PubMed]
- Brugnerotto, J.; Desbrieres, J.; Heux, L.; Mazeau, K.; Rinaudo, M. Overview on structural characterization of chitosan molecules in relation with their behaviour in solution. Macromol. Symp. 2001, 168, 1–20. [Google Scholar] [CrossRef]
- Amidi, M.; Mastrobattista, E.; Jiskoot, W.; Hennink, W.E. Chitosan-based delivery systems for protein therapeutics and antigens. Adv. Drug Deliv. Rev. 2010, 62, 59–82. [Google Scholar] [CrossRef] [PubMed]
- Makhlof, A.; Tozuka, Y.; Takeuchi, H. Design and evaluation of novel pH-sensitive chitosan nanoparticles for oral insulin delivery. Eur. J. Pharm. Sci. 2011, 42, 445–451. [Google Scholar] [CrossRef] [PubMed]
- Amoozgar, Z.; Park, J.; Lin, Q.; Yeo, Y. Low molecular-weight chitosan as a pH-sensitive stealth coating for tumour-specific drug delivery. Mol. Pharm. 2012, 9, 1262–1270. [Google Scholar] [PubMed]
- Moreno, P.M.; Santos, J.C.; Gomes, C.P.; Varela-Moreira, A.; Costa, A.; Leiro, V.; Peego, A.P. Delivery of splice switching oligonucleotides by amphiphilic chitosan-based nanoparticles. Mol. Pharm. 2016, 13, 344–356. [Google Scholar] [CrossRef] [PubMed]
- Kassai, M.R. Determination of the degree of N-acetylation for chitin and chitosan by various NMR spectroscopy techniques: A review. Carbohydr. Polym. 2010, 79, 801–810. [Google Scholar] [CrossRef]
- Christensen, B.E.; Smidsrød, O. Hydrolysis of xanthan in dilute acid: Effects on chemical composition, conformation, and intrinsic viscosity. Carbohydr. Res. 1991, 214, 55–69. [Google Scholar] [CrossRef]
- Arendt, O.; Kulicke, W. Determination of the viscoelastic properties of a homologous series of the fermentation polymer xanthan gum. Angew. Makromol. Chem. 1998, 259, 61–67. [Google Scholar] [CrossRef]
- Garcia-Ochoa, F.; Santos, V.; Casas, J.; Gomez, E. Xanthan gum: Production, recovery, and properties. Biotechnol. Adv. 2000, 18, 549–579. [Google Scholar] [CrossRef]
- Mikac, U.; Sepe, A.; Baumgartner, S.; Kristl, J. The influence of high drug loading in xanthan tablets and media with different physiological pH and ionic strength on swelling and release. Mol. Pharm. 2016, 13, 1147–1157. [Google Scholar] [CrossRef] [PubMed]
- Bueno, B.V.; Petri, D. Xanthan hydrogel films, molecular conformation, charge density and protein carriers. Carbohydr. Polym. 2014, 101, 897–904. [Google Scholar] [CrossRef] [PubMed]
- Phaechamud, T.; Ritthidej, G.C. Formulation variables influencing drug release from layered matrix system comprising chitosan and xanthan gum. AAPS PharmSciTech 2008, 9, 870–877. [Google Scholar] [CrossRef] [PubMed]
- Chu, C.H.; Kumagai, H.; Nakamura, K. Application of polyelectrolyte complex gel composed of xanthan and chitosan to the immobilization of corynebacterium glutamicum. J. Appl. Polym. Sci. 1996, 60, 1041–1047. [Google Scholar] [CrossRef]
- Martínez-Ruvalcaba, A.; Chornet, E.; Rodrigue, D. Viscoelastic properties of dispersed chitosan/xanthan hydrogels. Carbohydr. Polym. 2007, 67, 586–595. [Google Scholar] [CrossRef]
- Luo, Y.; Wang, Q. Recent development of chitosan-based polyelectrolyte complexes with natural polysaccharides for drug delivery. Int. J. Biol. Macromol. 2014, 64, 353–367. [Google Scholar] [CrossRef] [PubMed]
- Chu, C.H.; Sakiyama, T.; Yano, T. pH-sensitive swelling of a polyelectrolyte complex gel prepared from xanthan and chitosan. Biosci. Biotechnol. Biochem. 1995, 59, 717–719. [Google Scholar] [CrossRef]
- Magnin, D.; Dumitriu, S.; Chornet, E. Immobilization of enzymes into a polyionic hydrogel: Chitoxan. J. Bioact. Compat. Polym. 2003, 18, 355–373. [Google Scholar] [CrossRef]
- Argin-Soysal, S.; Kofinas, P.; Lo, Y.M. Effect of complexation conditions on xanthan–chitosan polyelectrolyte complex gels. Food Hydrocoll. 2009, 23, 202–209. [Google Scholar] [CrossRef]
- Chellat, F.; Tabrizian, M.; Dumitriu, S.; Chornet, S.; Rivard, C.H.; Yahia, L. Study of biodegradation behavior of chitosan–xanthan microspheres in simulated physiological media. J. Biomed. Mater. Res. 2000, 53, 592–599. [Google Scholar] [CrossRef]
- Prathab, B.; Tejraj, A.M. Molecular modelling study on surface, thermal, mechanical and gas diffusion properties of chitosan. J. Polym. Sci. Part B Polym. Phys. 2006, 45, 1260–1270. [Google Scholar] [CrossRef]
- Skovstrup, S.; Hansen, S.G.; Skrydstrup, T.; Schiøtt, B. Conformational flexibility of chitosan: A molecular modelling study. Biomacromolecules 2010, 11, 3196–3207. [Google Scholar] [CrossRef] [PubMed]
- Franca, E.F.; Lins, R.D.; Freitas, L.C.; Straatsma, T.P. Characterization of chitin and chitosan molecular structure in aqueous solution. J. Chem. Theory Comput. 2008, 4, 2141–2149. [Google Scholar] [CrossRef] [PubMed]
- Franca, E.F.; Freitas, L.C.; Lins, R.D. Chitosan molecular structure as a function of N-acetylation. Biopolymers 2011, 95, 448–460. [Google Scholar] [CrossRef] [PubMed]
- Fariba, R.; Sepideh, A.-I.; Hamid, M. Molecular dynamics simulation study of chitosan and gemcitabine as a drug delivery system. J. Mol. Model. 2015, 21, 165. [Google Scholar]
- Koukaras, E.N.; Papadimitriou, S.A.; Bikiaris, D.N.; Froudakis, G.E. Insight on the formation of chitosan nanoparticles through ionotropic gelation with tripolyphosphate. Mol. Pharm. 2012, 9, 2856–2862. [Google Scholar] [CrossRef] [PubMed]
- Pérez, S.; Vergelati, C. Molecular modelling of the xanthan chain conformations. Int. J. Biol. Macromol. 1987, 9, 211–218. [Google Scholar] [CrossRef]
- Levy, S.; Schuyler, S.C.; Maglothin, R.K.; Staehelin, L.A. Dynamic simulations of the molecular conformations of wild type and mutant xanthan polymers suggest that conformational differences may contribute to observed differences in viscosity. Biopolymers 1996, 38, 251–272. [Google Scholar] [CrossRef]
- Faria, R.R.; Guerra, R.F.; Netoa, L.R.; Motta, L.F.; Franca, E.D. Computational study of polymorphic structures of α- and β- chitin and chitosan in aqueous solution. J. Mol. Graph. Model. 2016, 63, 78–84. [Google Scholar] [CrossRef] [PubMed]
- Ogawa, K.; Yui, T.; Okuyama, K. Three D structures of chitosan. Int. J. Biol. Macromol. 2004, 34, 1–8. [Google Scholar] [CrossRef] [PubMed]
- Mazeau, K.; Pérez, S.; Rinaudo, M. Predicted influence of N-acetyl group content on the conformational extension of chitin and chitosan chains. J. Carbohydr. Chem. 2000, 19, 1269–1284. [Google Scholar] [CrossRef]
- Kawahara, M.; Yui, T.; Oka, K.; Zugenmaier, P.; Suzuki, S.; Kitamura, S.; Ogawa, K. Fourth 3d structure of the chitosan molecule: conformation of chitosan in its salts with medical organic acids having a phenyl group. Biosci. Biotechnol. Biochem. 2003, 67, 1545–1550. [Google Scholar] [CrossRef] [PubMed]
- Okuyama, K.; Noguchi, K.; Miyazawa, T.; Yui, T.; Ogawa, K. Molecular and crystal structure of hydrated chitosan. Macromolecules 1997, 30, 5849–5855. [Google Scholar] [CrossRef]
- Trott, O.; Olson, A.J. AutoDock Vina: Improving the speed and accuracy of docking with a new scoring function, efficient optimization, and multithreading. J. Comput. Chem. 2010, 31, 455–461. [Google Scholar] [CrossRef] [PubMed]
- Moorhouse, R.; Walkinshaw, M.D.; Arnott, S. Xanthan Gum—Molecular Conformation and Interactions. Extracell. Microb. Polysacch. 1977, 45, 90–102. [Google Scholar]
- Sarkar, A.; Pérez, S. PolySac3DB: An annotated data base of 3 dimensional structures of polysaccharides. BMC Bioinform. 2012, 13, 302. [Google Scholar] [CrossRef] [PubMed]
- HyperChem(TM) Professional 7.51, Hypercube, Inc.: Gainesville, FL, USA, 2002.
- McDonnell, M.; Greeley, D.; Kit, K.; Keffer, D. Molecular dynamics simulations of hydration effects on solvation, diffusivity, and permeability in chitosan/chitin films. J. Phys. Chem. B 2016, 120, 8997–9010. [Google Scholar] [CrossRef] [PubMed]
- Case, D.A.; Darden, T.A.; Cheatham, T.E.; Simmerling, C.L.; Wang, J.; Duke, R.E.; Luo, R.; Walker, R.C.; Zhang, W.; Merz, K.M.; et al. AMBER 11, University of California: San Francisco, CA, USA, 2010.
- Homans, S.W. A molecular mechanical force field for the conformational analysis of oligosaccharides: Comparison of theoretical and crystal structures of Man alpha 1-3Man beta 1-4GlcNAc. Biochemistry 1990, 29, 9110–9118. [Google Scholar] [CrossRef] [PubMed]
- Wang, J.; Cieplak, P.; Kollman, P. How well does a restrained electrostatic potential (resp) model perform in calculating conformational energies of organic and biological molecules. J. Comput. Chem. 2000, 21, 1049–1074. [Google Scholar] [CrossRef]
- Jorgensen, W.L.; Chandrasekhar, J.; Madura, J.D.; Impey, R.W.; Klein, M.L. Comparison of simple potential functions for simulating liquid water. J. Chem. Phys. 1983, 79, 926–935. [Google Scholar] [CrossRef]
- Jakalian, A.; Bush, B.L.; Jack, D.B.; Bayly, C.I. Fast, efficient generation of high quality atomic charges. AM1-BCC model: I. Method. J. Comput. Chem. 2000, 21, 132–146. [Google Scholar] [CrossRef]
- El-Barghouthi, M.I.; Assaf, K.I.; Rawashdeh, A.M. Molecular dynamics of methyl viologen-cucurbit[n]uril complexes in aqueous solution. J. Chem. Theory Comput. 2010, 6, 984–992. [Google Scholar] [CrossRef]
- Darden, T.; York, D.; Pederson, L. Particle mesh Ewald: An N·log(N) method for Ewald sums in large systems. J. Chem. Phys. 1993, 98, 10089–10092. [Google Scholar] [CrossRef]
- Humphrey, W.; Dalke, A.; Schulten, K. VMD—Visual Molecular Dynamics. J. Mol. Graph. 1996, 14, 33–38. [Google Scholar] [CrossRef]
- Feig, M.; Karanicolas, J.; Brooks, C.L. MMTSB tool set: Enhanced sampling and multiscale modelling methods for applications in structural biology. J. Mol. Graph. Model. 2004, 22, 377–395. [Google Scholar] [CrossRef] [PubMed]
- Malhis, L.D.; Bodoor, K.; Assaf, K.I.; Al-Sakhen, N.A.; El-Barghouthi, M.I. Molecular dynamics simulation of a cucurbituril based molecular switch triggered by pH changes. Comp. Theor. Chem. 2015, 1066, 104–112. [Google Scholar] [CrossRef]
- Honig, B.; Nicholls, A. Classical electrostatics in biology and chemistry. Science 1995, 268, 1144. [Google Scholar] [CrossRef] [PubMed]
- El-Barghouthi, M.I.; Abdel-Halim, H.M.; Haj-Ibrahim, F.J.; Bodoor, K.; Assaf, K.I. Molecular dynamics of nor-seco-cucurbit[10]uril complexes. J. Incl. Phenom. Macrocycl. Chem. 2015, 82, 323–333. [Google Scholar] [CrossRef]


| Free CS | CS–XG Complex | |||||
|---|---|---|---|---|---|---|
| Distance (Å) | Angle (°) | %Occupancy | Distance (Å) | Angle (°) | %Occupancy | |
| H0A0 | 3.25 (1.19) | 94.601 (54.9) | 46.72 | 3.10 (1.17) | 99.703 (54.6) | 53.37 |
| H1nA0 | 3.05 (1.30) | 127.16 (51.6) | 60.58 | 1.90 (0.32) | 152.26 (19.9) | 98.67 |
| H1rA0 | 2.47 (0.90) | 132.74 (35.2) | 72.87 | 1.85 (0.19) | 157.57 (11.8) | 99.86 |
| H2A0 | 2.62 (0.56) | 134.09 (26.8) | 89.21 | 1.95 (0.28) | 151.32 (18.1) | 99.32 |
| H0A1n | 2.38 (0.93) | 129.65 (45.9) | 80.84 | 2.17 (0.73) | 139.34 (40.3) | 88.76 |
| H0A1r | 2.33 (0.88) | 137.83 (38.3) | 80.94 | 2.52 (1.02) | 131.80 (42.6) | 78.33 |
| H1A1n | 2.13 (0.52) | 145.88 (24.2) | 84.76 | 1.88 (0.28) | 152.56 (16.9) | 99.63 |
| H1A1r | 2.29 (0.93) | 131.09 (43.0) | 82.40 | 1.93 (0.29) | 150.74 (19.6) | 98.66 |
| H0A2 | 2.12 (0.76) | 144.68 (33.9) | 89.61 | 2.20 (0.79) | 140.78 (36.5) | 85.39 |
| Pyruvate COO− | Glucoronate COO− | |||
|---|---|---|---|---|
| N1 | N2 | N1 | N2 | |
| H0A0 | 22.40 ± 9.09 | 21.26 ± 8.74 | 18.17 ± 9.25 | 17.63 ± 8.62 |
| H1nA0 | 13.29 ± 0.96 | 18.99 ± 1.96 | 7.151 ± 0.74 | 13.88 ± 0.99 |
| H1rA0 | 12.91 ± 0.93 | 19.64 ± 1.48 | 6.550 ± 1.23 | 13.73 ± 1.27 |
| H2A0 | 11.50 ± 2.57 | 9.350 ± 3.45 | 6.942 ± 1.89 | 10.66 ± 2.31 |
| H0A1n | 27.21 ± 3.49 | 22.87 ± 2.75 | 19.67 ± 4.01 | 16.65 ± 2.91 |
| H0A1r | 17.95 ± 4.21 | 16.02 ± 4.12 | 16.88 ± 5.29 | 14.06 ± 3.81 |
| H1A1n | 15.87 ± 2.99 | 13.86 ± 1.18 | 12.90 ± 1.98 | 7.002 ± 1.12 |
| H1A1r | 15.37 ± 0.67 | 9.710 ± 1.01 | 7.998 ± 1.16 | 4.021 ± 0.75 |
| H0A2 | 12.57 ± 5.14 | 14.80 ± 3.41 | 11.33 ± 3.48 | 9.052 ± 3.92 |
| Free CS | Complex | ||
|---|---|---|---|
| CS-H2O | CS-H2O | CS–XG b | |
| H0A0 | 16.9 | 8.4 | 2.4 |
| H1nA0 | 16.3 | 4.7 | 4.9 |
| H1rA0 | 15.0 | 5.0 | 4.3 |
| H2A0 | 15.8 | 2.0 | 4.5 |
| H0A1n | 16.9 | 9.5 | 3.7 |
| H0A1r | 16.9 | 8.5 | 2.4 |
| H1A1n | 16.5 | 5.4 | 4.3 |
| H1A1r | 16.3 | 5.4 | 4.4 |
| H0A2 | 16.9 | 8.8 | 3.8 |
| ∆Eele | ∆EvdW | ∆GNP | ∆GPB | ∆Gsol | ∆E | T∆Sconf | ∆G | |
|---|---|---|---|---|---|---|---|---|
| H0A0 | −21.29 | −14.03 | −2.59 | 24.47 | 21.89 | −13.43 | −12.52 | −0.91 |
| H1nA0 | −227.53 | −24.47 | −3.71 | 226.49 | 222.77 | −29.22 | −18.36 | −10.86 |
| H1rA0 | −208.76 | −21.61 | −3.45 | 205.63 | 202.18 | −28.19 | −17.45 | −10.74 |
| H2A0 | −419.95 | −23.27 | −3.89 | 416.46 | 412.57 | −30.65 | −18.25 | −12.4 |
| H0A1n | −41.82 | −17.36 | −3.07 | 41.09 | 38.02 | −21.16 | −15.93 | −5.23 |
| H0A1r | −25.08 | −21.12 | −3.19 | 31.65 | 28.46 | −17.74 | −13.24 | −4.50 |
| H1rA1n | −192.15 | −23.13 | −3.53 | 195.25 | 191.72 | −23.56 | −15.58 | −7.98 |
| H1nA1r | −232.68 | −23.96 | −3.53 | 230.89 | 227.36 | −29.28 | −18.03 | −11.25 |
| H0A2 | −25.07 | −25.79 | −3.63 | 33.78 | 30.15 | −20.71 | −16.00 | −4.71 |
| H1nA0-XG2 * | −164.11 | −11.16 | −2.76 | 159.25 | 156.49 | −18.78 | −14.83 | −3.95 |
© 2017 by the authors. Licensee MDPI, Basel, Switzerland. This article is an open access article distributed under the terms and conditions of the Creative Commons Attribution (CC BY) license (http://creativecommons.org/licenses/by/4.0/).
Share and Cite
Dadou, S.M.; El-Barghouthi, M.I.; Alabdallah, S.K.; Badwan, A.A.; Antonijevic, M.D.; Chowdhry, B.Z. Effect of Protonation State and N-Acetylation of Chitosan on Its Interaction with Xanthan Gum: A Molecular Dynamics Simulation Study. Mar. Drugs 2017, 15, 298. https://doi.org/10.3390/md15100298
Dadou SM, El-Barghouthi MI, Alabdallah SK, Badwan AA, Antonijevic MD, Chowdhry BZ. Effect of Protonation State and N-Acetylation of Chitosan on Its Interaction with Xanthan Gum: A Molecular Dynamics Simulation Study. Marine Drugs. 2017; 15(10):298. https://doi.org/10.3390/md15100298
Chicago/Turabian StyleDadou, Suha M., Musa I. El-Barghouthi, Samer K. Alabdallah, Adnan A. Badwan, Milan D. Antonijevic, and Babur Z. Chowdhry. 2017. "Effect of Protonation State and N-Acetylation of Chitosan on Its Interaction with Xanthan Gum: A Molecular Dynamics Simulation Study" Marine Drugs 15, no. 10: 298. https://doi.org/10.3390/md15100298