Proportion of the CD19-Positive and CD19-Negative Lymphocytes and Monocytes within the Peripheral Blood Mononuclear Cell Set Is Characteristic for Rheumatoid Arthritis

 ,
, 

Abstract
:1. Introduction
2. Materials and Methods
2.1. Patients and Healthy Control Volunteers
2.2. Assessment of the MMP-9 and Cytokines Concentrations in the Plasma
2.3. Cell Frequency and Phenotype Analyses
2.4. Statistical Analyses
3. Results
3.1. Clinical Characteristics of the Patients
3.2. HHV-6, HHV-7, and Parvovirus B19 (B19V) Infection Status
3.3. Expression of CCR1 and CCR2 on Peripheral Blood Lymphocytes
3.4. Frequency of the Peripheral Blood Mononuclear Cell Populations
4. Discussion
5. Conclusions
Supplementary Materials
Author Contributions
Funding
Conflicts of Interest
References
- Hale, L.P.; Haynes, B.F. Pathology of rheumatoid arthritis and associated disorders. In Arthritis and Allied Conditions. A Textbook of Rheumatology, 13th ed.; Koopman, W.J., Ed.; Williams & Wilkins: Baltimore, MD, USA, 1997; pp. 993–1016. [Google Scholar]
- Choy, E.H.; Panayi, G.S. Cytokine pathways and joint inflammation in rheumatoid arthritis. N. Engl. J. Med. 2001, 344, 907–916. [Google Scholar] [CrossRef] [PubMed]
- Szekanecz, Z.; Koch, A.E.; Tak, P.P. Chemokine and chemokine receptor blockade in arthritis, a prototype of immune-mediated inflammatory diseases. Neth. J. Med. 2011, 69, 356–366. [Google Scholar] [PubMed]
- Giacomelli, R.; Afeltra, A.; Alunno, A.; Bartoloni-Bocci, E.; Berardicurti, O.; Bombardieri, M.; Bortoluzzi, A.; Caporali, R.; Caso, F.; Cervera, R.; et al. Guidelines for biomarkers in autoimmune rheumatic diseases -evidence based analysis. Autoimmun. Rev. 2019, 18, 93–106. [Google Scholar] [CrossRef] [PubMed]
- Martinez-Gamboa, L.; Brezinschek, H.-P.; Burmester, G.R.; Dörner, T. Immunopathologic role of B lymphocytes in rheumatoid arthritis: Rationale of B cell-directed therapy. Autoimmun. Rev. 2006, 5, 437–442. [Google Scholar] [CrossRef] [PubMed]
- Roosnek, E.; Lanzavecchia, A. Efficient and selective presentation of antigen-antibody complexes by rheumatoid factor B cells. J. Exp. Med. 1991, 173, 487–489. [Google Scholar] [CrossRef]
- O’Neill, S.K.; Glant, T.T.; Finnegan, A. The role of B cells in animal models of rheumatoid arthritis. Front. Biosci. 2007, 12, 1722–1736. [Google Scholar] [CrossRef] [PubMed]
- Mauri, C.; Ehrenstein, M.R. Cells of the synovium in rheumatoid arthritis. B cells. Arthritis Res. Ther. 2007, 9, 205. [Google Scholar] [CrossRef]
- Haringman, J.J.; Smeets, T.J.M.; Reinders-Blankert, P.; Tak, P.P. Chemokine and chemokine receptor expression in paired peripheral blood mononuclear cells and synovial tissue of patients with rheumatoid arthritis, osteoarthritis, and reactive arthritis. Ann. Rheum. Dis. 2006, 65, 294–300. [Google Scholar] [CrossRef]
- Haringman, J.J.; Tak, P.P. Chemokine blockade: A new era in the treatment of rheumatoid arthritis? Arthritis Res. Ther. 2004, 6, 93–97. [Google Scholar] [CrossRef]
- Vergunst, C.E.; Gerlag, D.M.; von Moltke, L.; Karol, M.; Wyant, T.; Chi, X.; Matzkin, E.; Leach, T.; Tak, P.P. MLN3897 plus methotrexate in patients with rheumatoid arthritis: Safety, efficacy, pharmacokinetics, and pharmacodynamics of an oral CCR1 antagonist in a phase IIa, double-blind, placebo-controlled, randomized, proof-of-concept study. Arthritis Rheum. 2009, 60, 3572–3581. [Google Scholar] [CrossRef]
- Quinones, M.P.; Estrada, C.A.; Kalkonde, Y.; Ahuja, S.K.; Kuziel, W.A.; Mack, M.; Ahuja, S.S. The complex role of the chemokine receptor CCR2 in collagen-induced arthritis: Implications for therapeutic targeting of CCR2 in rheumatoid arthritis. J. Mol. Med. Berl. Ger. 2005, 83, 672–681. [Google Scholar] [CrossRef] [PubMed]
- Zabel, B.A.; Rott, A.; Butcher, E.C. Leukocyte chemoattractant receptors in human disease pathogenesis. Annu. Rev. Pathol. 2015, 10, 51–81. [Google Scholar] [CrossRef] [PubMed]
- Stone, M.J.; Hayward, J.A.; Huang, C.E.; Huma, Z.; Sanchez, J. Mechanisms of regulation of the chemokine-receptor network. Int. J. Mol. Sci. 2017, 18, 342. [Google Scholar] [CrossRef] [PubMed]
- Kholodnyuk, I.; Rudevica, Z.; Leonciks, A.; Ehlin-Henriksson, B.; Kashuba, E. Expression of the chemokine receptors CCR1 and CCR2B is up-regulated in peripheral blood B cells upon EBV infection and in established lymphoblastoid cell lines. Virology 2017, 512, 1–7. [Google Scholar] [CrossRef] [PubMed]
- Proctor, M.J.; McMillan, D.C.; Morrison, D.S.; Fletcher, C.D.; Horgan, P.G.; Clarke, S.J. A derived neutrophil to lymphocyte ratio predicts survival in patients with cancer. Br. J. Cancer 2012, 107, 695–699. [Google Scholar] [CrossRef] [PubMed] [Green Version]
- Mercan, R.; Bitik, B.; Tufan, A.; Bozbulut, U.B.; Atas, N.; Ozturk, M.A.; Haznedaroglu, S.; Goker, B. The Association between Neutrophil/Lymphocyte Ratio and Disease Activity in Rheumatoid Arthritis and Ankylosing Spondylitis. J. Clin. Lab. Anal. 2016, 30, 597–601. [Google Scholar] [CrossRef]
- Chandrashekara, S.; Mukhtar Ahmad, M.; Renuka, P.; Anupama, K.R.; Renuka, K. Characterization of neutrophil-to-lymphocyte ratio as a measure of inflammation in rheumatoid arthritis. Int. J. Rheum. Dis. 2017, 20, 1457–1467. [Google Scholar] [CrossRef]
- Yang, Z.; Zhang, Z.; Lin, F.; Ren, Y.; Liu, D.; Zhong, R.; Liang, Y. Comparisons of neutrophil-, monocyte-, eosinophil-, and basophil-lymphocyte ratios among various systemic autoimmune rheumatic diseases. APMIS 2017, 125, 863–871. [Google Scholar] [CrossRef]
- Du, J.; Chen, S.; Shi, J.; Zhu, X.; Ying, H.; Zhang, Y.; Chen, S.; Shen, B.; Li, J. The association between the lymphocyte-monocyte ratio and disease activity in rheumatoid arthritis. Clin. Rheumatol. 2017, 36, 2689–2695. [Google Scholar] [CrossRef]
- Vassilopoulos, D.; Calabrese, L.H. Risks of immunosuppressive therapies including biologic agents in patients with rheumatic diseases and co-existing chronic viral infections. Curr. Opin. Rheumatol. 2007, 19, 619–625. [Google Scholar] [CrossRef]
- Takahashi, Y.; Murai, C.; Shibata, S.; Munakata, Y.; Ishii, T.; Ishii, K.; Saitoh, T.; Sawai, T.; Sugamura, K.; Sasaki, T. Human parvovirus B19 as a causative agent for rheumatoid arthritis. Proc. Natl. Acad. Sci. USA 1998, 95, 8227–8232. [Google Scholar] [CrossRef] [PubMed] [Green Version]
- Kadiša, A.; Nora-Krūkle, Z.; Kozireva, S.; Svirskis, S.; Studers, P.; Groma, V.; Lejnieks, A.; Murovska, M. Effect of Human Herpesviruses 6 and 7 Infection on the Clinical Course of Rheumatoid Arthritis. Proc. Latv. Acad. Sci. Sect. B Nat. Exact Appl. Sci. 2016, 70, 165–174. [Google Scholar]
- Naciute, M.; Mieliauskaite, D.; Rugiene, R.; Nikitenkiene, R.; Jancoriene, L.; Mauricas, M.; Nora-Krukle, Z.; Murovska, M.; Girkontaite, I. Frequency and significance of parvovirus B19 infection in patients with rheumatoid arthritis. J. Gen. Virol. 2016, 97, 3302–3312. [Google Scholar] [CrossRef] [PubMed]
- Aletaha, D.; Neogi, T.; Silman, A.J.; Funovits, J.; Felson, D.T.; Bingham, C.O.; Birnbaum, N.S.; Burmester, G.R.; Bykerk, V.P.; Cohen, M.D.; et al. 2010 Rheumatoid arthritis classification criteria: An American College of Rheumatology/European League Against Rheumatism collaborative initiative. Arthritis Rheum. 2010, 62, 2569–2581. [Google Scholar] [CrossRef] [PubMed]
- Altman, R.; Alarcón, G.; Appelrouth, D.; Bloch, D.; Borenstein, D.; Brandt, K.; Brown, C.; Cooke, T.D.; Daniel, W.; Feldman, D. The American College of Rheumatology criteria for the classification and reporting of osteoarthritis of the hip. Arthritis Rheum. 1991, 34, 505–514. [Google Scholar] [CrossRef] [PubMed]
- Firestein, G.S. Evolving concepts of rheumatoid arthritis. Nature 2003, 423, 356–361. [Google Scholar] [CrossRef] [PubMed]
- Berneman, Z.N.; Ablashi, D.V.; Li, G.; Eger-Fletcher, M.; Reitz, M.S.; Hung, C.L.; Brus, I.; Komaroff, A.L.; Gallo, R.C. Human herpesvirus 7 is a T-lymphotropic virus and is related to, but significantly different from, human herpesvirus 6 and human cytomegalovirus. Proc. Natl. Acad. Sci. USA 1992, 89, 10552–10556. [Google Scholar] [CrossRef] [PubMed]
- Teschner, S.; Burst, V. Leflunomide: A drug with a potential beyond rheumatology. Immunotherapy 2010, 2, 637–650. [Google Scholar] [CrossRef] [PubMed]
- Hamilton, J.A.; Tak, P.P. The dynamics of macrophage lineage populations in inflammatory and autoimmune diseases. Arthritis Rheum. 2009, 60, 1210–1221. [Google Scholar] [CrossRef] [PubMed]
- Benedetti, G.; Miossec, P. Interleukin 17 contributes to the chronicity of inflammatory diseases such as rheumatoid arthritis. Eur. J. Immunol. 2014, 44, 339–347. [Google Scholar] [CrossRef] [PubMed]
- Melzer, S.; Zachariae, S.; Bocsi, J.; Engel, C.; Löffler, M.; Tárnok, A. Reference intervals for leukocyte subsets in adults: Results from a population-based study using 10-color flow cytometry. Cytom. B Clin. Cytom. 2015, 88, 270–281. [Google Scholar] [CrossRef] [PubMed]
- Burel, J.G.; Qian, Y.; Lindestam Arlehamn, C.; Weiskopf, D.; Zapardiel-Gonzalo, J.; Taplitz, R.; Gilman, R.H.; Saito, M.; de Silva, A.D.; Vijayanand, P.; et al. An Integrated Workflow To Assess Technical and Biological Variability of Cell Population Frequencies in Human Peripheral Blood by Flow Cytometry. J. Immunol. 2017, 198, 1748–1758. [Google Scholar] [CrossRef] [PubMed]
- Daien, C.I.; Gailhac, S.; Mura, T.; Audo, R.; Combe, B.; Hahne, M.; Morel, J. Regulatory B10 cells are decreased in patients with rheumatoid arthritis and are inversely correlated with disease activity. Arthritis Rheumatol. 2014, 66, 2037–2046. [Google Scholar] [CrossRef] [PubMed]
- Zheng, Z.; Li, X.; Li, X.; Ding, J.; Feng, Y.; Miao, J.; Luo, X.; Wu, Z.; Zhu, P. Characteristics of regulatory B10 cells in patients with rheumatoid arthritis with different disease status. Mol. Med. Rep. 2015, 12, 4584–4591. [Google Scholar] [CrossRef] [PubMed] [Green Version]
- Carter, N.A.; Rosser, E.C.; Mauri, C. Interleukin-10 produced by B cells is crucial for the suppression of Th17/Th1 responses, induction of T regulatory type 1 cells and reduction of collagen-induced arthritis. Arthritis Res. Ther. 2012, 14, R32. [Google Scholar] [CrossRef] [PubMed]
- Katschke, K.J.; Rottman, J.B.; Ruth, J.H.; Qin, S.; Wu, L.; LaRosa, G.; Ponath, P.; Park, C.C.; Pope, R.M.; Koch, A.E. Differential expression of chemokine receptors on peripheral blood, synovial fluid, and synovial tissue monocytes/macrophages in rheumatoid arthritis. Arthritis Rheum. 2001, 44, 1022–1032. [Google Scholar] [CrossRef]
- Gottenberg, J.-E.; Dayer, J.-M.; Lukas, C.; Ducot, B.; Chiocchia, G.; Cantagrel, A.; Saraux, A.; Roux-Lombard, P.; Mariette, X. Serum IL-6 and IL-21 are associated with markers of B cell activation and structural progression in early rheumatoid arthritis: Results from the ESPOIR cohort. Ann. Rheum. Dis. 2012, 71, 1243–1248. [Google Scholar] [CrossRef]


| Osteoarthritis (n = 10) 1 | Rheumatoid Arthritis (n = 15) | |
|---|---|---|
| DAS28, score | ||
| Mean ± SD | – | 5.1 ± 1.5 |
| Range | – | 1.1–7.5 |
| ESR, mm/h | ||
| Median (IQR: Q1–Q3) | – | 33.5 (17.8–45.0) |
| Range | – | 14.0–60.0 |
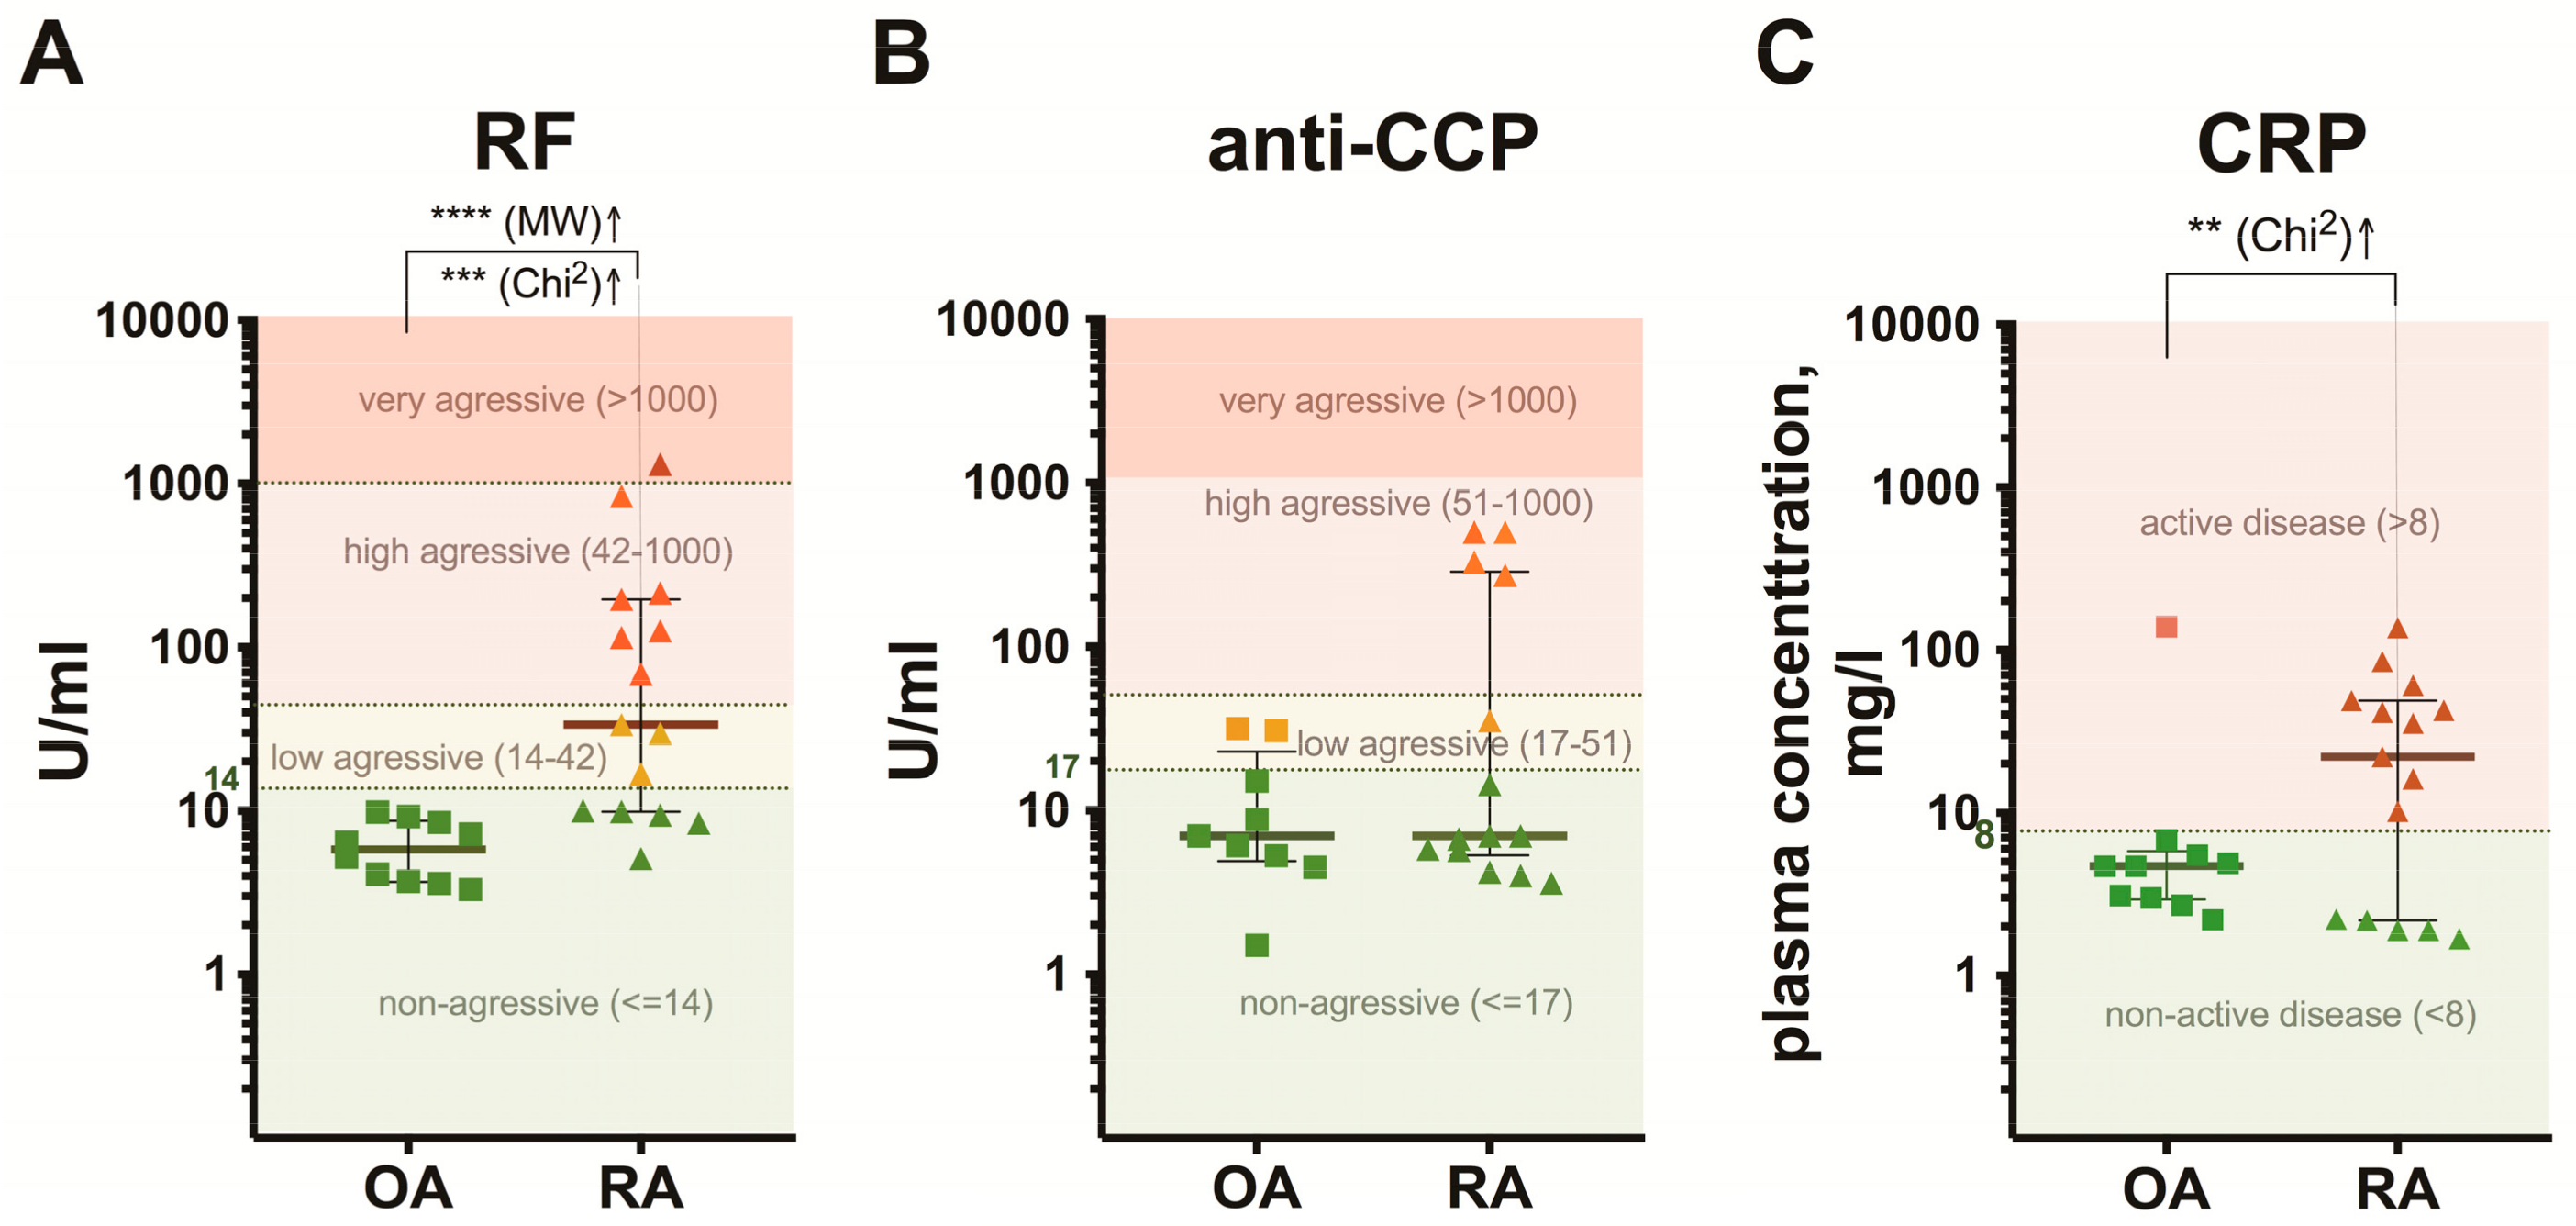
| CRP, mg/L | ||
| Median (IQR: Q1–Q3) | 4.7 (2.9–5.8) | 22.1 (2.2–48.8) |
| Range | 2.2–138.8 | 1.7–137.1 |
| RF, U/mL | ||
| Median (IQR: Q1–Q3) | 5.8 (3.7–8.7) | 33.7 (9.9–196.0) |
| Range | 3.3–9.8 | 5.1–1313.0 |
| anti–CCP, U/mL | ||
| Median (IQR: Q1–Q3) | 7.0 (4.9–22.9) | 7.0 (5.3–286.7) |
| Range | 1.5–31.6 | 3.6–500.0 |
| Disease duration, months | ||
| Median (IQR: Q1–Q3) | 60.0 (24.0–81.0) | 24.0 (9.0–120.0) |
| Range | 6.0–120.0 | 2.0–480.0 |
| MRI, stage (I–IV) | ||
| Median (IQR: Q1–Q3) | – | 2.0 (1.5–3.0) |
| Range | – | 1–4 |
| Treatment 2, no. of patients | ||
| NSAIDs | 10 | 10 |
| MTX | – | 1 |
| LEF | – | 2 |
| Steroids | – | 1 |
| SSZ, MTX, Steroids | – | 1 |
© 2019 by the authors. Licensee MDPI, Basel, Switzerland. This article is an open access article distributed under the terms and conditions of the Creative Commons Attribution (CC BY) license (http://creativecommons.org/licenses/by/4.0/).
Share and Cite
Kholodnyuk, I.; Kadisa, A.; Svirskis, S.; Gravelsina, S.; Studers, P.; Spaka, I.; Sultanova, A.; Lejniece, S.; Lejnieks, A.; Murovska, M. Proportion of the CD19-Positive and CD19-Negative Lymphocytes and Monocytes within the Peripheral Blood Mononuclear Cell Set Is Characteristic for Rheumatoid Arthritis. Medicina 2019, 55, 630. https://doi.org/10.3390/medicina55100630
Kholodnyuk I, Kadisa A, Svirskis S, Gravelsina S, Studers P, Spaka I, Sultanova A, Lejniece S, Lejnieks A, Murovska M. Proportion of the CD19-Positive and CD19-Negative Lymphocytes and Monocytes within the Peripheral Blood Mononuclear Cell Set Is Characteristic for Rheumatoid Arthritis. Medicina. 2019; 55(10):630. https://doi.org/10.3390/medicina55100630
Chicago/Turabian StyleKholodnyuk, Irina, Anda Kadisa, Simons Svirskis, Sabine Gravelsina, Peteris Studers, Irina Spaka, Alina Sultanova, Sandra Lejniece, Aivars Lejnieks, and Modra Murovska. 2019. "Proportion of the CD19-Positive and CD19-Negative Lymphocytes and Monocytes within the Peripheral Blood Mononuclear Cell Set Is Characteristic for Rheumatoid Arthritis" Medicina 55, no. 10: 630. https://doi.org/10.3390/medicina55100630