Effect of Cadmium Chloride on Metallothionein Levels in Carp

Abstract
:1. Introduction
2. Results and Discussion
2.1. Comparison of fish groups exposed to different concentration of cadmium chloride
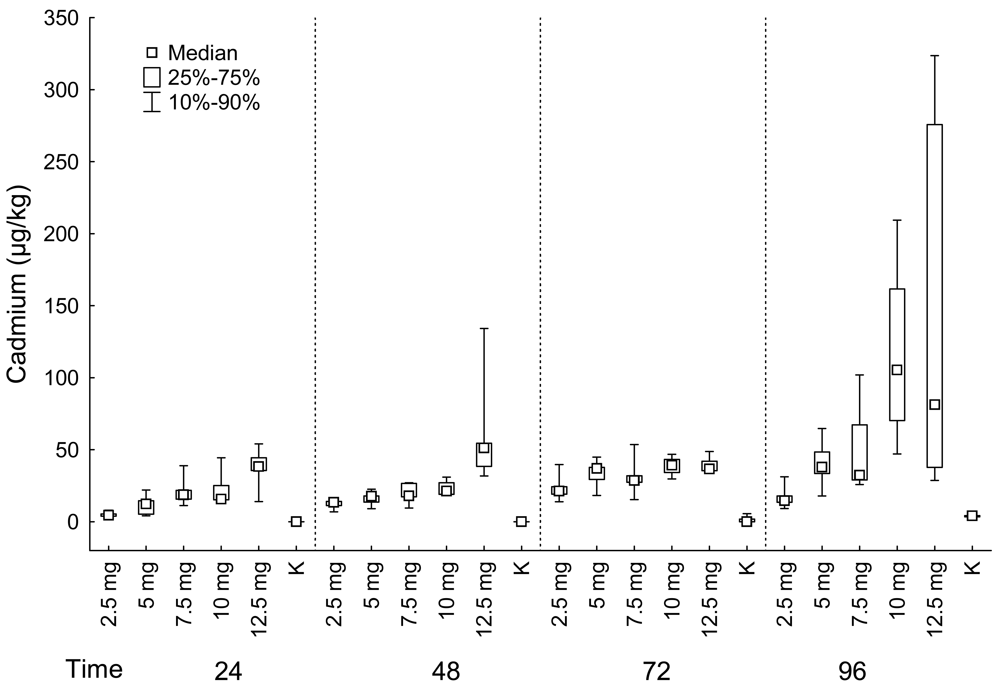
Muscles
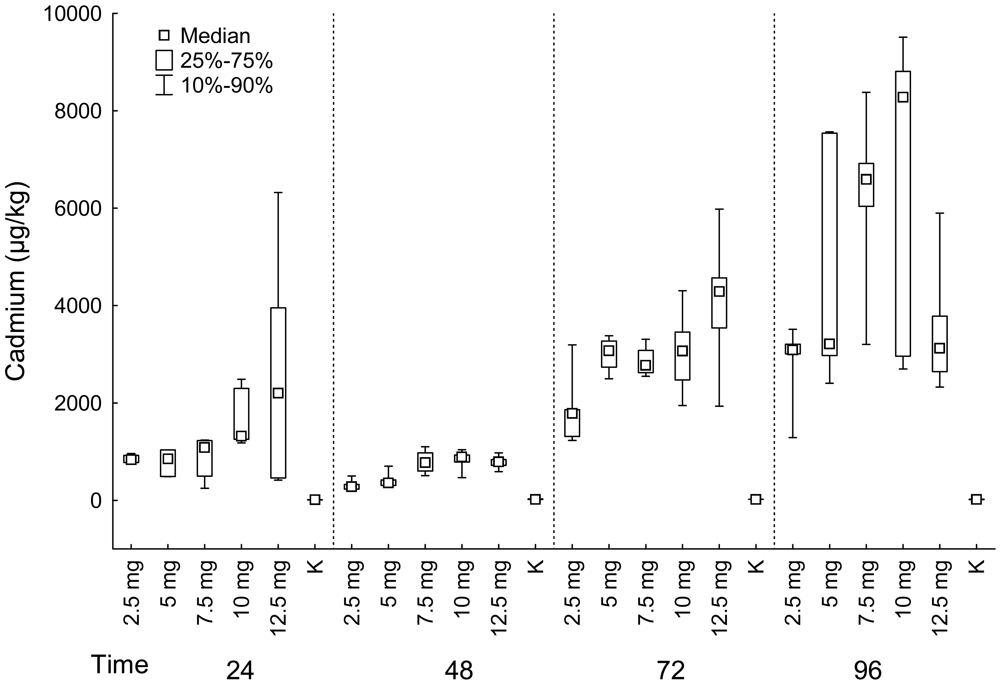
Liver
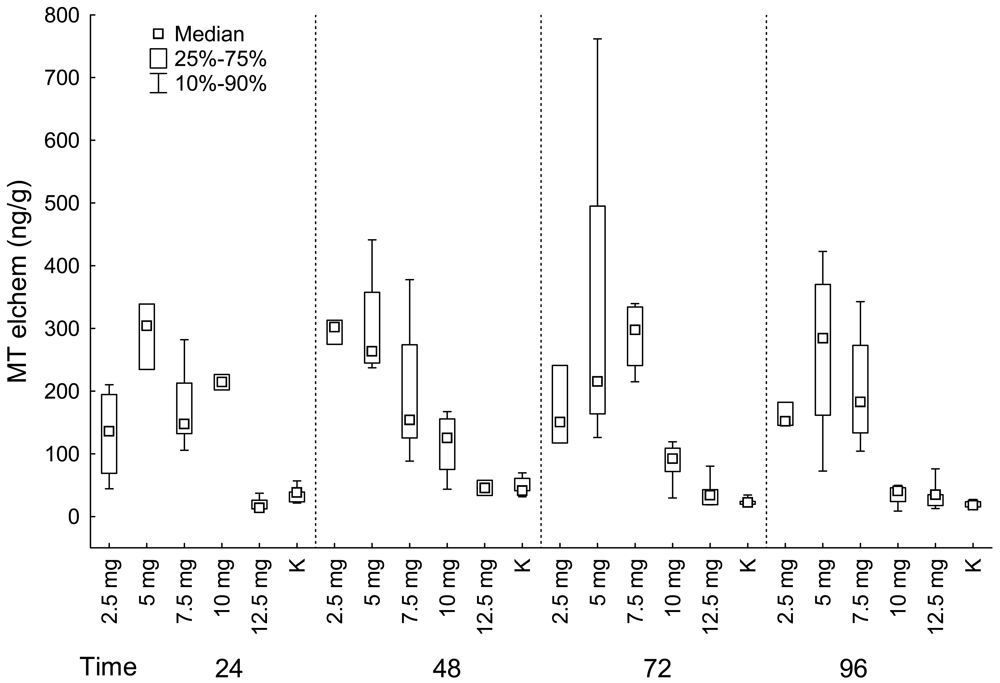
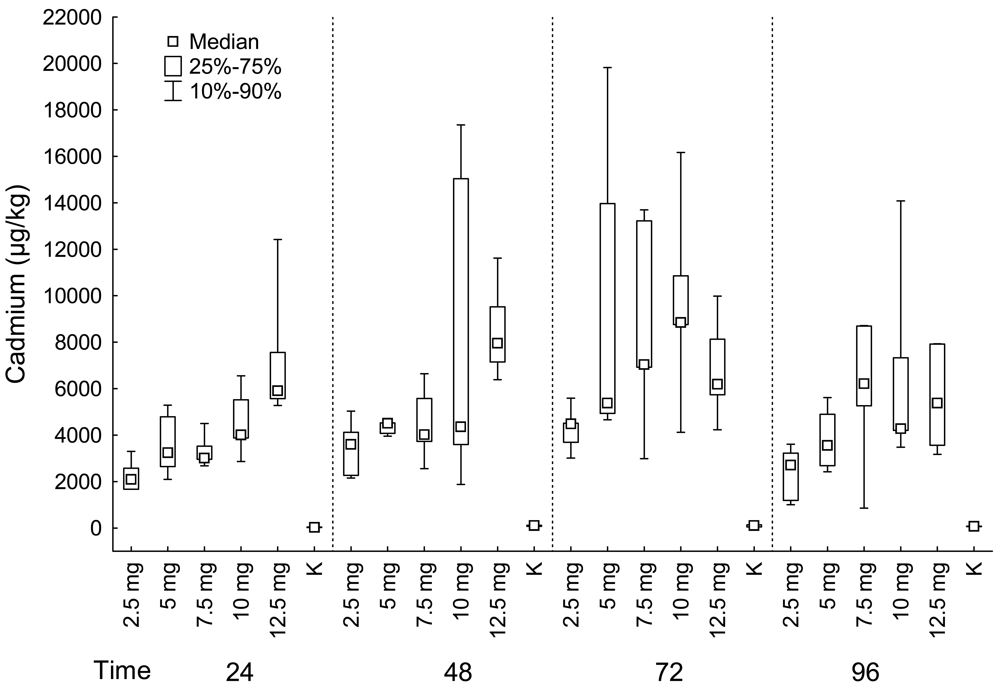
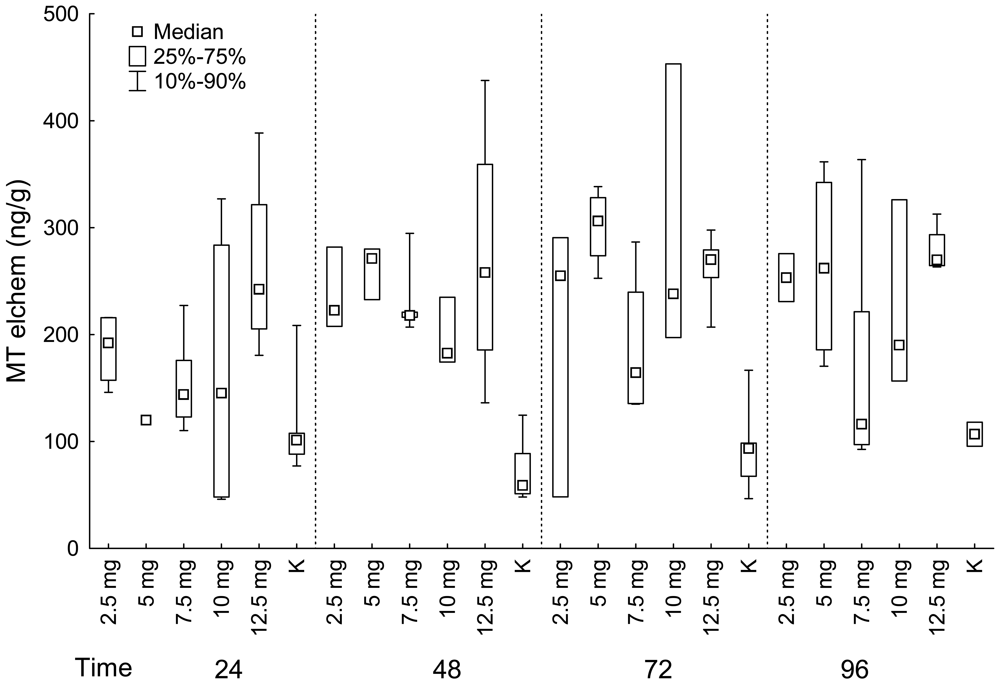
Kidneys
2.2. Comparison of fish groups exposed to cadmium chloride for different time periods
Muscles
Liver
Kidneys
2.3. Correlation between cadmium content and MTs
3. Experimental Section
Cadmium in fish
Metallothioneins in fish
Stationary electrochemical analyser–Adsorptive transfer stripping differential pulse voltammetry Brdicka reaction
Statistics
4. Conclusions
Acknowledgments
References and Notes
- Papina, T.S. Transportation and Peculiarities of heavy metals distribution in the river ecosystems; Nauka: Novosibirsk, USSR, 2001; pp. 123–126. [Google Scholar]
- Drastichova, J.; Svobodova, Z.; Luskova, V.; Machova, J. Effect of cadmium on haematological indices of common carp (Cyprinus carpio L.). Bull. Environ. Contam. Toxicol. 2004, 72, 725–732. [Google Scholar]
- Fabrik, I.; Ruferova, Z.; Hilscherova, K.; Adam, V.; Trnkova, L.; Kizek, R. A Determination of Metallothionein in Larvae of Freshwater Midges (Chironomus riparius) Using Brdicka Reaction. Sensors 2008, 8, 4081–4094. [Google Scholar]
- Ryan, J.A.; Hightower, L.E. Evaluation of heavy-metal ion toxicity in fish cells using a combined stress protein and cytotoxicity assay. Environ. Toxicol. Chem. 1994, 13, 1231–1240. [Google Scholar]
- Hamer, D.H. Metallothionein. Annl. Rev. Bioch. 1986, 55, 913–951. [Google Scholar]
- Kito, H.; Tazawa, T.; Ose, Y.; Sato, T. Separation and purification of (Cd, Cu, Zn)-metallothionein in carp hepatopancreas. Comp. Biochem. Physiol. 1982, 73C, 129–134. [Google Scholar]
- Adam, V.; Baloun, J.; Fabrik, I.; Trnkova, L.; Kizek, R. An electrochemical detection of metallothioneins at the zeptomole level in nanolitre volumes. Sensors 2008, 4, 2293–2305. [Google Scholar]
- Kagi, J.H.R.; Shaeffer, A. Biochemistry of metallothioneins. Biochemistry 1988, 27, 8509–8515. [Google Scholar]
- Bremner, I.; Davies, N.T. Induction of metallothionein in rat liver by zinc injection and restriction of food intake. Biochem. J. 1975, 149, 733–738. [Google Scholar]
- Kille, P.; Kay, J.; Leaver, M.; George, S. Induction of piscine metallothionein as a primary response to heavy metal pollutants: Applicability of new sensitive molecular probes. Aquat. Toxicol. 1992, 22, 279–286. [Google Scholar]
- Petrlova, J.; Potesil, D.; Mikelova, R.; Blastika, O.; Adam, V.; Trnkova, L.; Jelen, F.; Prusa, R.; Kukacka, J.; Kizek, R. Attomole voltammetric determination of metallothionein. Electrochim. Acta 2006, 51, 5112–5119. [Google Scholar]
- Huska, D.; Krizkova, S.; Beklova, M.; Havel, L.; Zehnalek, J.; Diopan, V.; Adam, V.; Zeman, L.; Babula, P.; Kizek, R. Influence of cadmium(II) ions and brewery sludge on metallothionein level in earthworms (Eisenia fetida)–Biotransforming of toxic wastes. Sensors 2008, 2, 1039–1047. [Google Scholar]
- Jezierska, B.; Witeska, M. Metal toxicity to fish; University of Podlasie: Siedlce, Poland, 2001; pp. 51–68. [Google Scholar]
- Kay, J.; Thomas, D.G.; Brown, M.W.; Cryer, A.; Shurben, D.; De Solbe, L.G.; Garvey, J.S. Cadmium accumulation and protein binding patters in tissues of the rainbow trout. Salmo airdneri. Environ. Health. Perspect. 1986, 65, 133–139. [Google Scholar]
- Giles, M.A. Accumulation of cadmium by rainbow trout, Salmo gairdneri, during extended exposure. Can. J. Fish. Aquat. Sci. 1988, 45, 1045–1053. [Google Scholar]
- Glynn, A.W.; Olsson, P.E. Cadmium turnover in minnows (Phoxinus phoxinus) preexposed to waterborn cadmium. Environ. Toxicol. Chem. 1991, 10, 338–394. [Google Scholar]
- Exon, J.H.; Lamberton, J.G.; Koller, L.D. Effect of chronic oral exposure and withdrawal on cadmium residues in organs of mice. Bull. Environ. Contam. Toxicol. 1977, 18, 74–76. [Google Scholar]
- Santovito, G.; Irato, P.; Piccinni, E.; Albergoni, V. Relationship between metallothionein and metal contents in red-blooded and white-blooded Antarctic teleosts. Polar. Biol. 2000, 23, 383–391. [Google Scholar]
- Hylland, K.; Haux, C.; Hogstrand, C. Hepathic metallothionein and heavy metals in dab (Limanda limanda) from the German bright. Mar. Ecol. Progr. 1992, 91, 89–96. [Google Scholar]
- Brown, D.A.; Bay, S.M.; Hershelm, G.P. Exposure of scorpionfish (Scorpaena guttata) to cadmium: effects of acute and chronic exposure on the cytosolic distribution of cadmium, copper and zinc. Aquat. Toxicol. 1990, 16, 295–310. [Google Scholar]
- Bonwick, G.A.; Fielden, P.R.; Davies, D.H. Hepathic metallothioneins levels in roach (Rutilus rutilus L.) continuously exposed to water-born cadmium. Comp. Biochem. Physiol. 1991, 9C(1/2), 119–125. [Google Scholar]
- Chaterjee, A.; Maiti, I.B. Induction and turnover of catfish (Heteropneustes fossilis) metalothionein. Moll. Cell. Biochem. 1991, 108, 29–38. [Google Scholar]
- Dallinger, R.; Egg, M.; Köck, G.; Hoffer, R. The role of metallothionein in cadmium accumulation of Arctic char (Salvelinus alpinus) from high Alpine lakes. Aquat. Toxicol. 1997, 38, 48–66. [Google Scholar]
- Friberg, L.; Piscator, M.; Nordberg, G.F.; Kjellstroem, T. Cadmium in the environment, 2nd ed.; CRC Press: Cleveland, OH, USA, 1974. [Google Scholar]
- Norberg, G.F. Studies on metallothionein and cadmium. Enviroment. Res. 1977, 15, 381–404. [Google Scholar]
- Liu, J.; Cheng, M.L.; Yang, Q.; Shan, K.R.; Shen, J.; Zhou, Y.; Zhang, X.; Dill, A.L.; Waalkes, M.P. Blood metallothionein transcript as a biomarker for metal sensitivity: Low blood metallo-thionein transcripts in arsenicosis patients from Guizhou, China. Environ. Health. Perspect. 2007, 115, 1101–1106. [Google Scholar]
- Campbell, P.G.C.; Giguere, A.; Bonneris, E.; Hare, L. Cadmium-handling strategies in two chronically exposed indigenous freshwater organisms–the yellow perch (Perca flavescens) and the floater mollusc (Pyganodon grandis). Aquat. Toxicol. 2005, 72, 83–97. [Google Scholar]
- Wicklung, A.; Runn, P. Calcium effects on cadmium uptake, redistribution and elimination in minnows, Phoxinus phoxinus, acclimated to different calcium concentrations. Aquat. Toxicol. 1988, 13, 109–122. [Google Scholar]
- Yudkovski, Y.; Rogowska-Wrzesinska, A.; Yankelevich, I.; Shefer, E.; Herut, B.; Tom, M. Quantitative immunochemical evaluation of fish metallothionein upon exposure to cadmium. Mar. Environ. Res. 2008, 65, 427–436. [Google Scholar]
- De Smet, H.; Blust, R. Stress responses and changes in protein metabolism in carp (Cyprinus carpio) during cadmium exposure. Ecotox. Environ. Safe. 2001, 48, 255–262. [Google Scholar]
- Alvarado, N.E.; Quesada, I.; Hylland, K.; Marigomez, I.; Soto, M. Quantitative changes in metallothionein expression in targed cell types in the gills of turbot (Scopthalmus maximus) exposed to Cd, Cu, Zn and after a depuration treatment. Aquatic. Toxicol. 2006, 7, 64–77. [Google Scholar]
- Berntssen, M.H.G.; Aspholm, O.O.; Hylland, K.; Bonga, S.E.W.; Lundebye, A.K. Tissue metallothionein , apoptosis and cell proliferation responses in Atlantic salmon (Salmo salar L.) parrfed elevated dietary cadmium. Comp. Bioch. Physiol. 2001, 128, 299–310. [Google Scholar]
- Huang, Z.Y.; Zhang, Q.; Chen, J.; Zhuang, Z.X.; Wang, X.R. Bioaccumulation of metals and induction of metallothioneins in selected tissues of common carp (Cyprinus carpio). Appl. Organometal. Chem. 2007, 21, 101–107. [Google Scholar]
- Zar, J.H. Biostatistical Analysis, 4th ed.; Prentice Hall: Englewood Cliffs, NJ, USA, 1999. [Google Scholar]
- StatSoft, Inc. STATISTICA (data analysis software system), version 8.0. 2007. www.statsoft.com.
- Linde, A.R.; Sanches-Gallan, S.; Valles-Mota, P.; Garcia-Vasquez, E. Metallothioneins as bioindicator of freshwater metal pollution: European eel and brown trout. Ecotoxicol. Environ. Safe. 2001, 49, 60–63. [Google Scholar]


| Fish group | Muscle | Liver | Kidney | ||||||||
|---|---|---|---|---|---|---|---|---|---|---|---|
| Concentr. | Cd (μg/kg) | Cd (μg/kg) | MTs (ng/g) | Cd (μg/kg) | MTs (ng/g) | ||||||
| Time | N | Median | N | Median | N | Median | N | Median | N | Median | |
| 24 | 2.5 mg | 5 | 4.59 | 4 | 831.50 | 4 | 135.86 | 5 | 2092.00 | 4 | 192.16 |
| 24 | 5 mg | 5 | 12.31 | 5 | 850.00 | 3 | 303.83 | 5 | 3237.00 | 1 | 120.03 |
| 24 | 7.5 mg | 5 | 18.77 | 5 | 1081.00 | 5 | 147.66 | 5 | 3011.00 | 5 | 143.85 |
| 24 | 10 mg | 5 | 15.77 | 5 | 1316.00 | 2 | 214.29 | 5 | 4003.00 | 4 | 145.26 |
| 24 | 12.5 mg | 5 | 38.28 | 5 | 2200.00 | 4 | 13.76 | 5 | 5912.00 | 4 | 242.19 |
| 24 | K | 5 | 0.05 | 5 | 11.22 | 5 | 38.06 | 5 | 26.23 | 5 | 101.19 |
| 48 | 2.5 mg | 5 | 13.54 | 5 | 279.00 | 3 | 302.07 | 5 | 3604.00 | 3 | 222.53 |
| 48 | 5 mg | 5 | 17.74 | 5 | 355.00 | 4 | 263.19 | 5 | 4508.00 | 3 | 271.05 |
| 48 | 7.5 mg | 5 | 18.02 | 4 | 771.00 | 5 | 153.67 | 5 | 4016.00 | 5 | 217.83 |
| 48 | 10 mg | 4 | 21.41 | 5 | 890.00 | 4 | 125.22 | 5 | 4352.00 | 3 | 182.55 |
| 48 | 12.5 mg | 5 | 51.19 | 5 | 790.00 | 2 | 45.52 | 5 | 7956.00 | 4 | 257.84 |
| 48 | K | 5 | 0.05 | 5 | 18.57 | 5 | 40.99 | 5 | 105.60 | 5 | 58.82 |
| 72 | 2.5 mg | 5 | 21.43 | 5 | 1782.00 | 3 | 150.40 | 5 | 4488.00 | 3 | 254.99 |
| 72 | 5 mg | 5 | 37.01 | 4 | 3069.00 | 4 | 215.24 | 5 | 5376.00 | 4 | 306.36 |
| 72 | 7.5 mg | 5 | 28.53 | 4 | 2773.00 | 4 | 297.48 | 5 | 7033.00 | 4 | 164.41 |
| 72 | 10 mg | 4 | 39.26 | 5 | 3067.00 | 5 | 92.13 | 5 | 8841.00 | 3 | 238.00 |
| 72 | 12.5 mg | 5 | 36.73 | 5 | 4288.00 | 5 | 33.92 | 5 | 6196.00 | 5 | 270.14 |
| 72 | K | 5 | 0.05 | 5 | 21.49 | 5 | 22.18 | 5 | 103.10 | 5 | 93.53 |
| 96 | 2.5 mg | 5 | 14.64 | 5 | 3088.00 | 3 | 151.57 | 5 | 2705.00 | 2 | 253.27 |
| 96 | 5 mg | 5 | 38.01 | 5 | 3209.00 | 4 | 284.21 | 4 | 3560.00 | 4 | 262.08 |
| 96 | 7.5 mg | 4 | 32.47 | 5 | 6589.00 | 4 | 182.84 | 5 | 6213.00 | 5 | 116.30 |
| 96 | 10 mg | 5 | 105.46 | 5 | 8276.00 | 4 | 40.57 | 5 | 4268.00 | 3 | 190.16 |
| 96 | 12.5 mg | 5 | 81.18 | 5 | 3121.00 | 5 | 34.58 | 5 | 5370.00 | 4 | 270.01 |
| 96 | K | 5 | 4.02 | 5 | 15.83 | 5 | 17.99 | 5 | 70.75 | 2 | 106.83 |
© 2009 by the authors; licensee Molecular Diversity Preservation International, Basel, Switzerland. This article is an open access article distributed under the terms and conditions of the Creative Commons Attribution license (http://creativecommons.org/licenses/by/3.0/).
Share and Cite
Kovarova, J.; Kizek, R.; Adam, V.; Harustiakova, D.; Celechovska, O.; Svobodova, Z. Effect of Cadmium Chloride on Metallothionein Levels in Carp. Sensors 2009, 9, 4789-4803. https://doi.org/10.3390/s90604789
Kovarova J, Kizek R, Adam V, Harustiakova D, Celechovska O, Svobodova Z. Effect of Cadmium Chloride on Metallothionein Levels in Carp. Sensors. 2009; 9(6):4789-4803. https://doi.org/10.3390/s90604789
Chicago/Turabian StyleKovarova, Jana, Rene Kizek, Vojtech Adam, Danka Harustiakova, Olga Celechovska, and Zdenka Svobodova. 2009. "Effect of Cadmium Chloride on Metallothionein Levels in Carp" Sensors 9, no. 6: 4789-4803. https://doi.org/10.3390/s90604789