
A Reliable Wireless Control System for Tomato Hydroponics


Abstract
:1. Introduction
2. Overview of the Tomato Hydroponics Control System
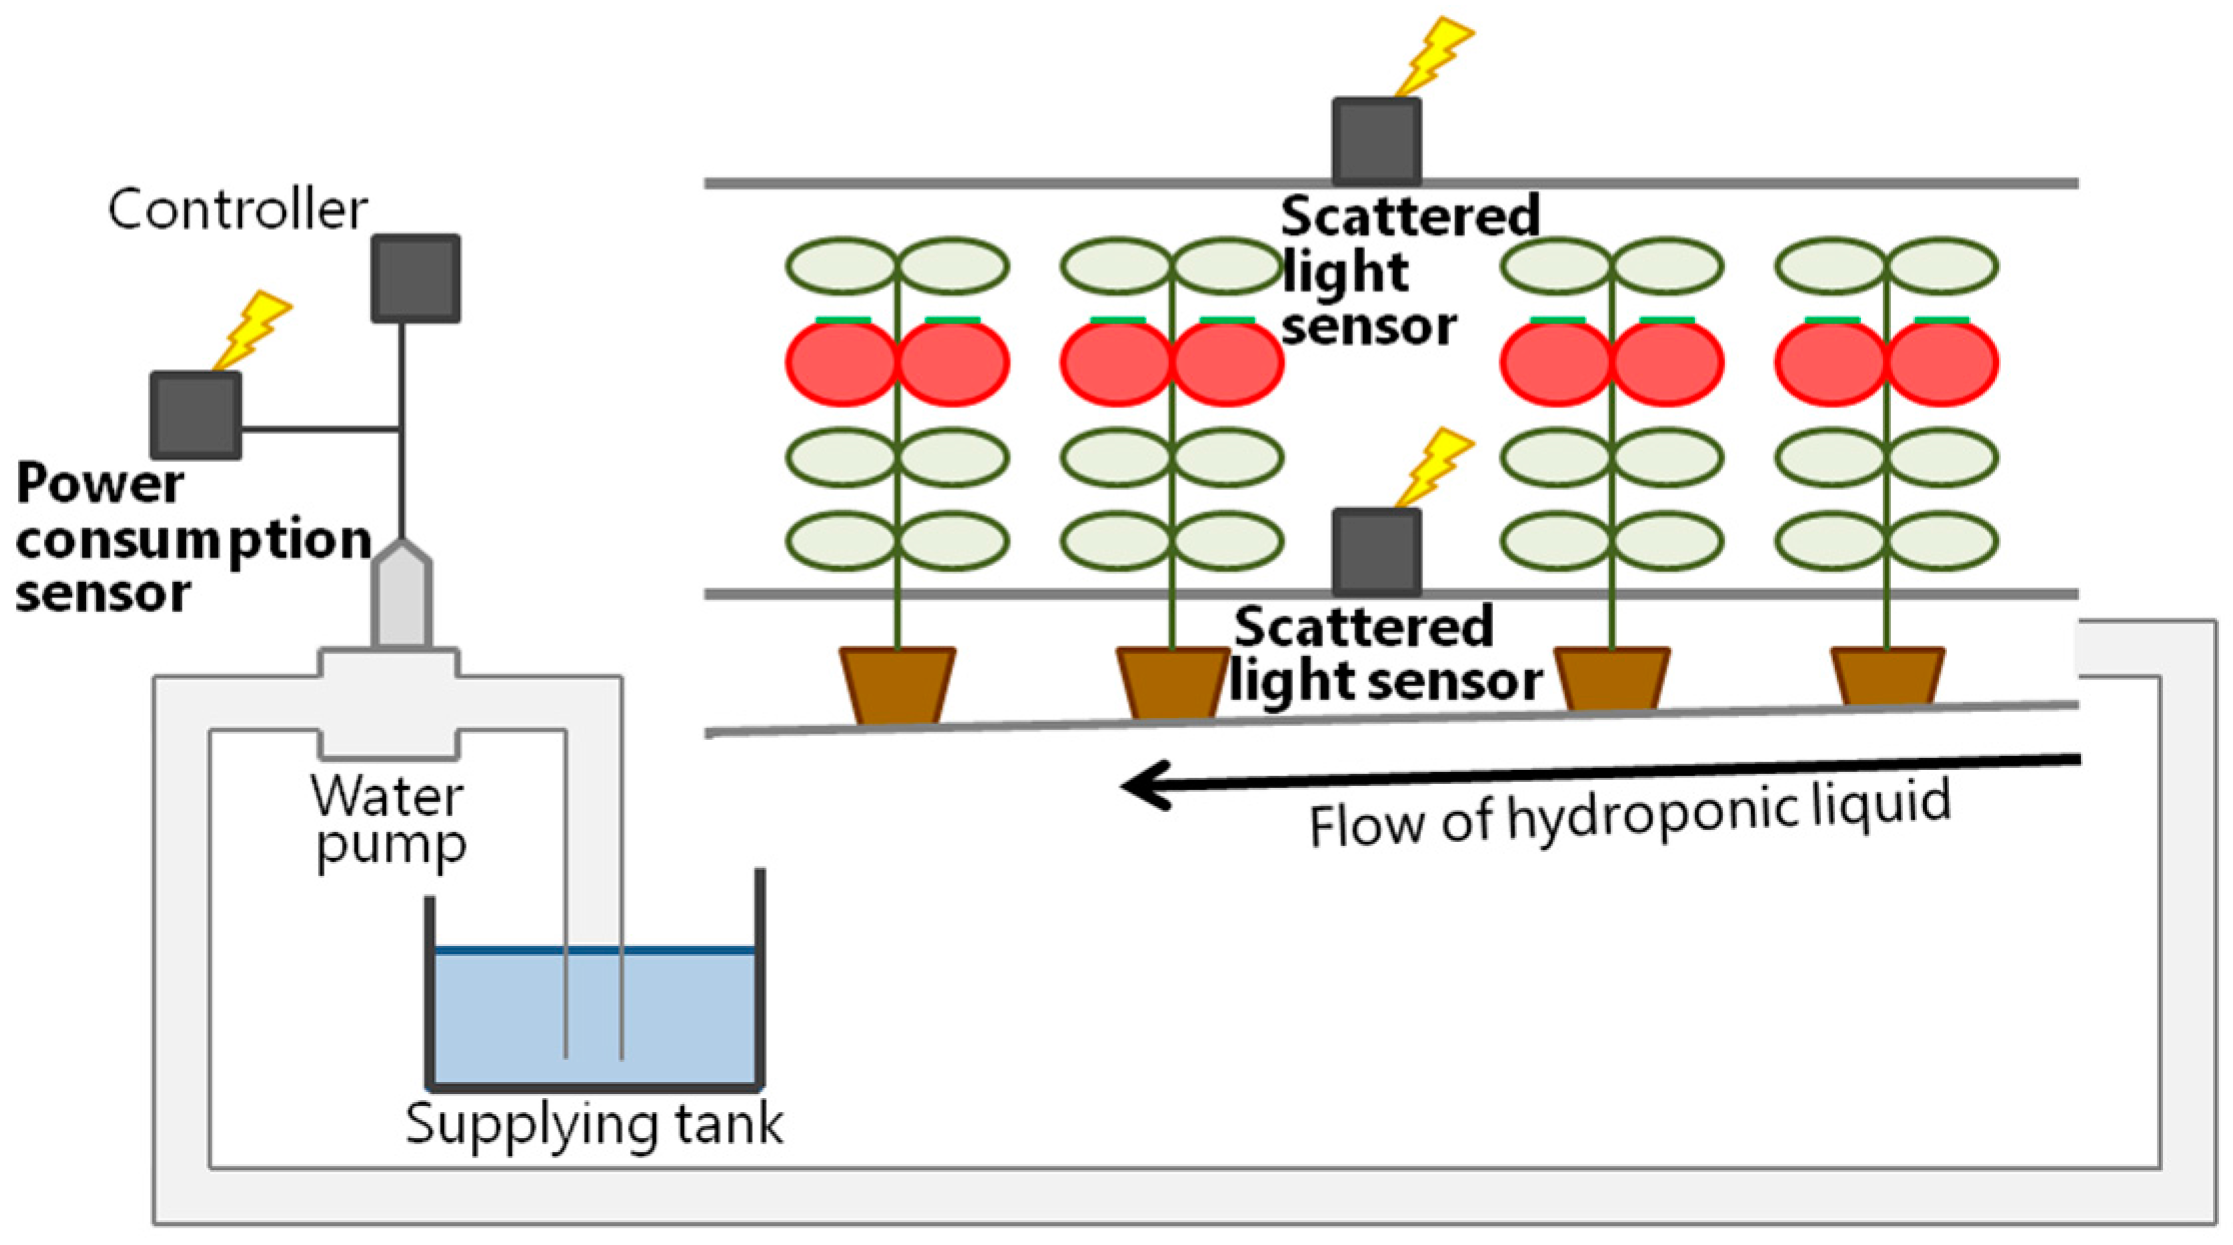
2.1. Overview of the Tomato Hydroponics Control System
2.2. System Requirement Analysis
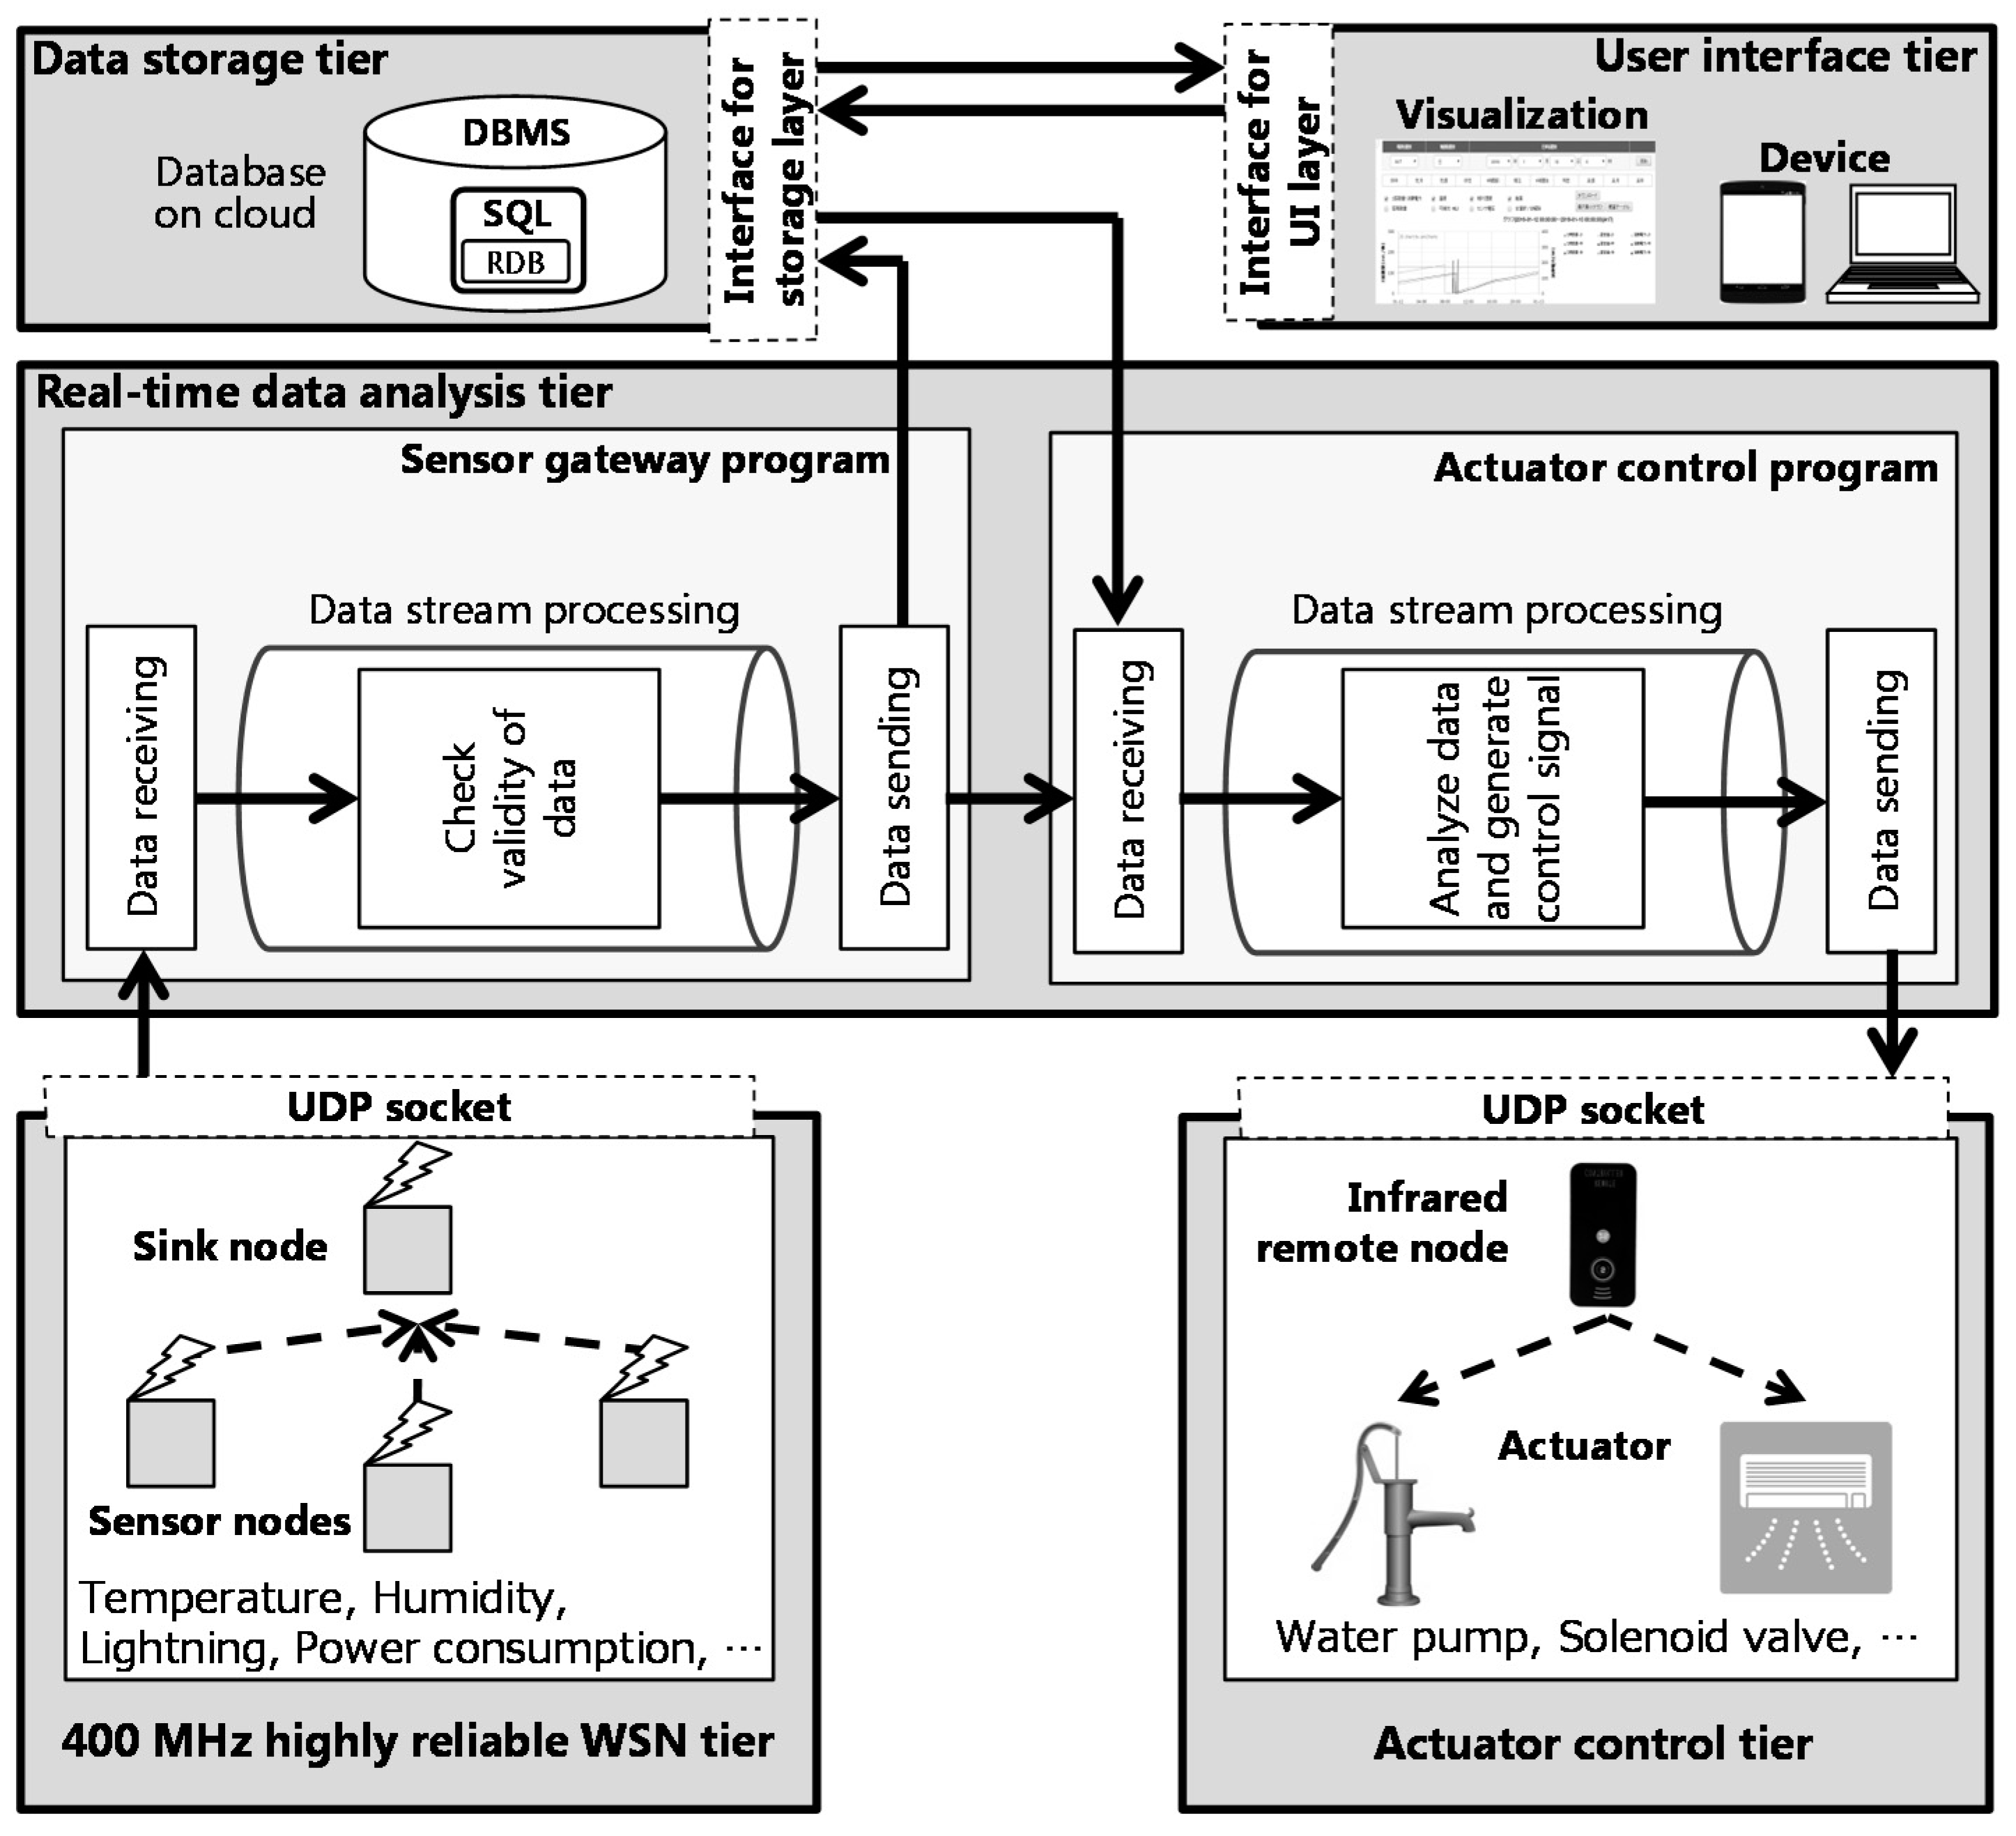
- By using a large number of sensors to collect environmental data in the greenhouse environment, the collected environmental data is stored in the cloud server, and it is possible to browse the data from any location through a visualization interface.
- The environmental control system in the field environment can be configured by system users via the control information setting interface from any location, and actuator control can be performed based on the control information set.
- The system requires that a system failure hardly ever occurs, and it has a self-healing function in the event of failure to prevent the crop being affected by the system stop.
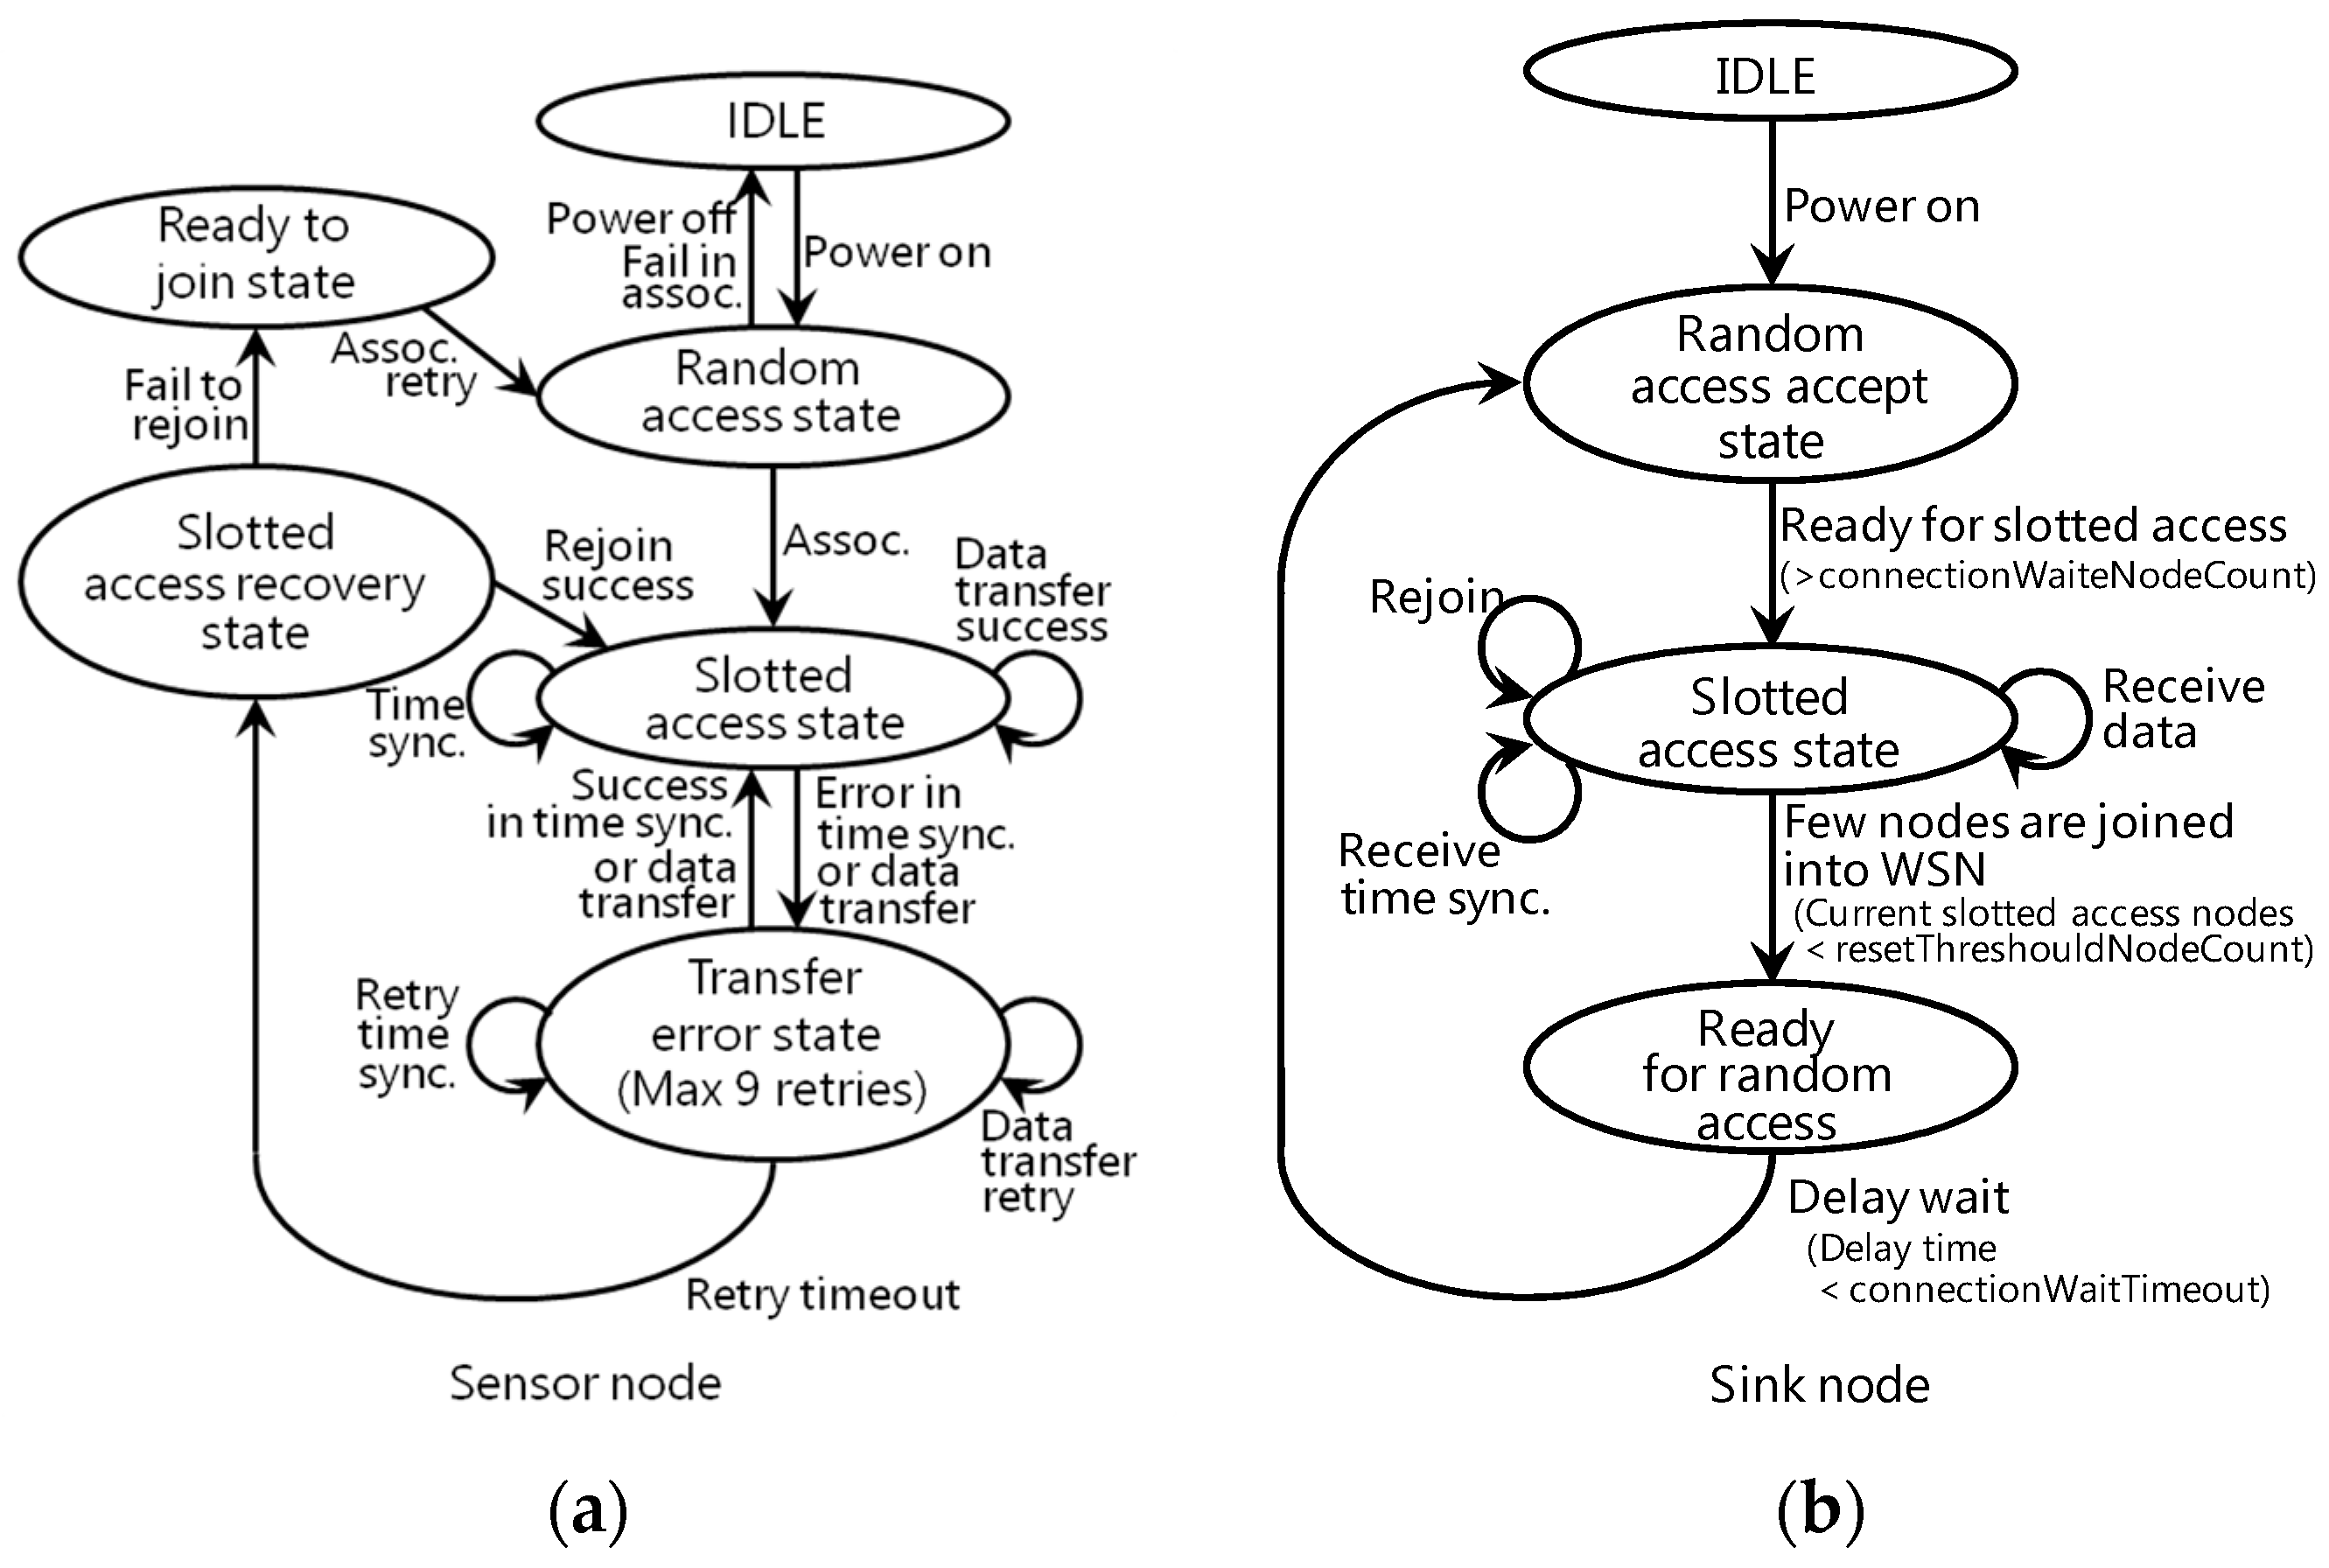
2.3. A 400 MHz Highly Reliable Wireless Sensor Network
2.4. Real-Time Data Analysis
3. System Evaluation
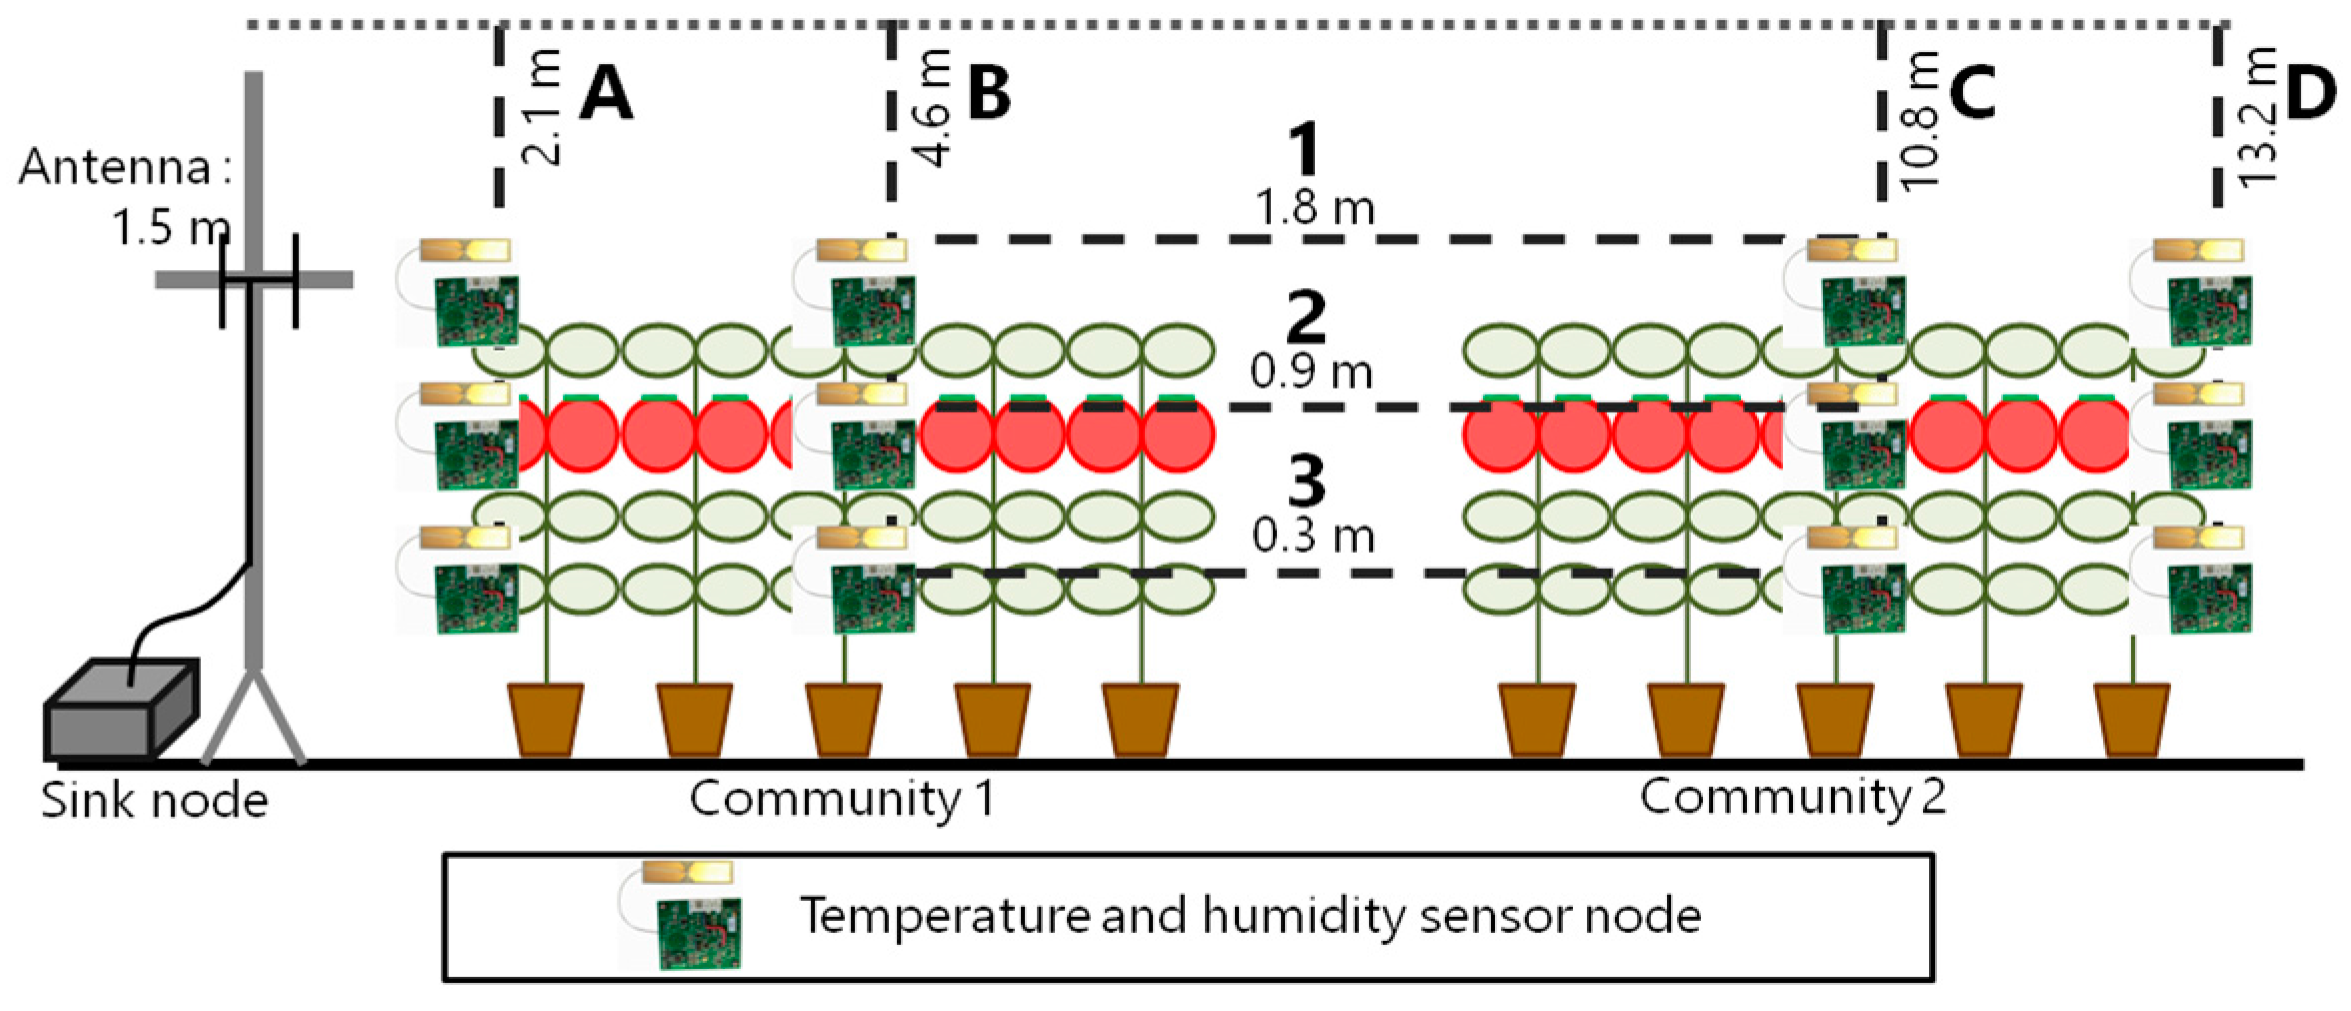
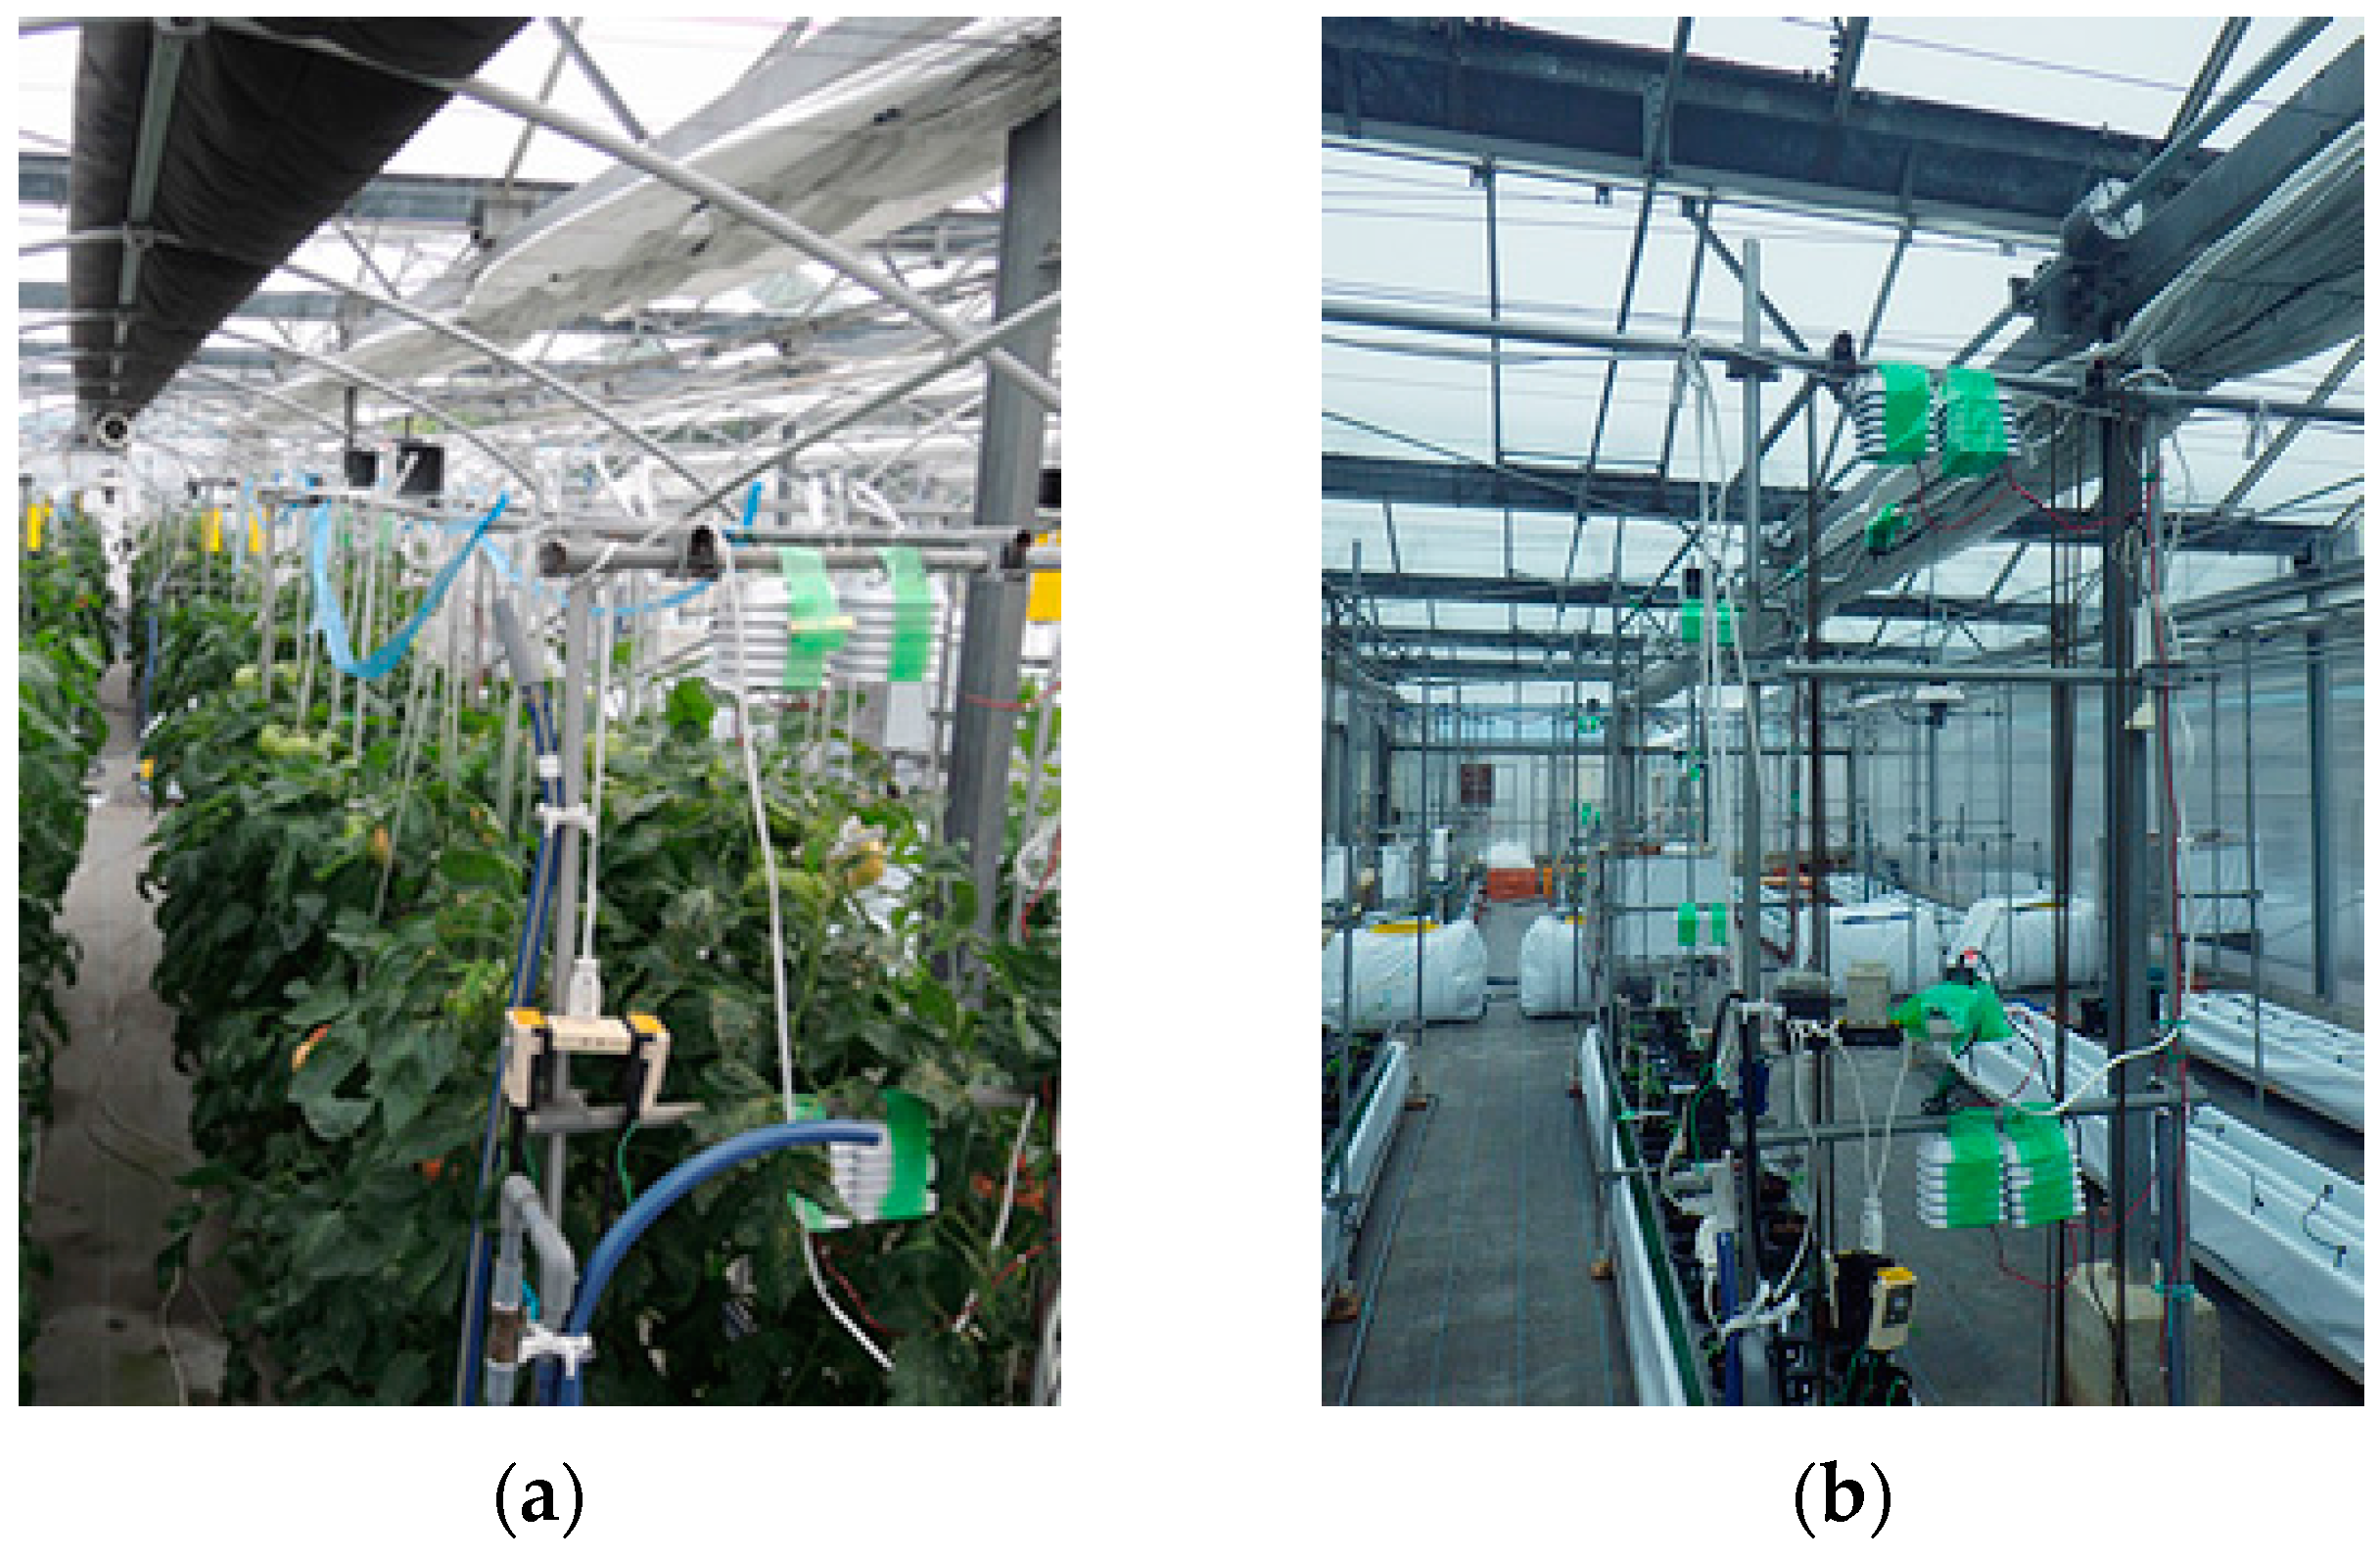
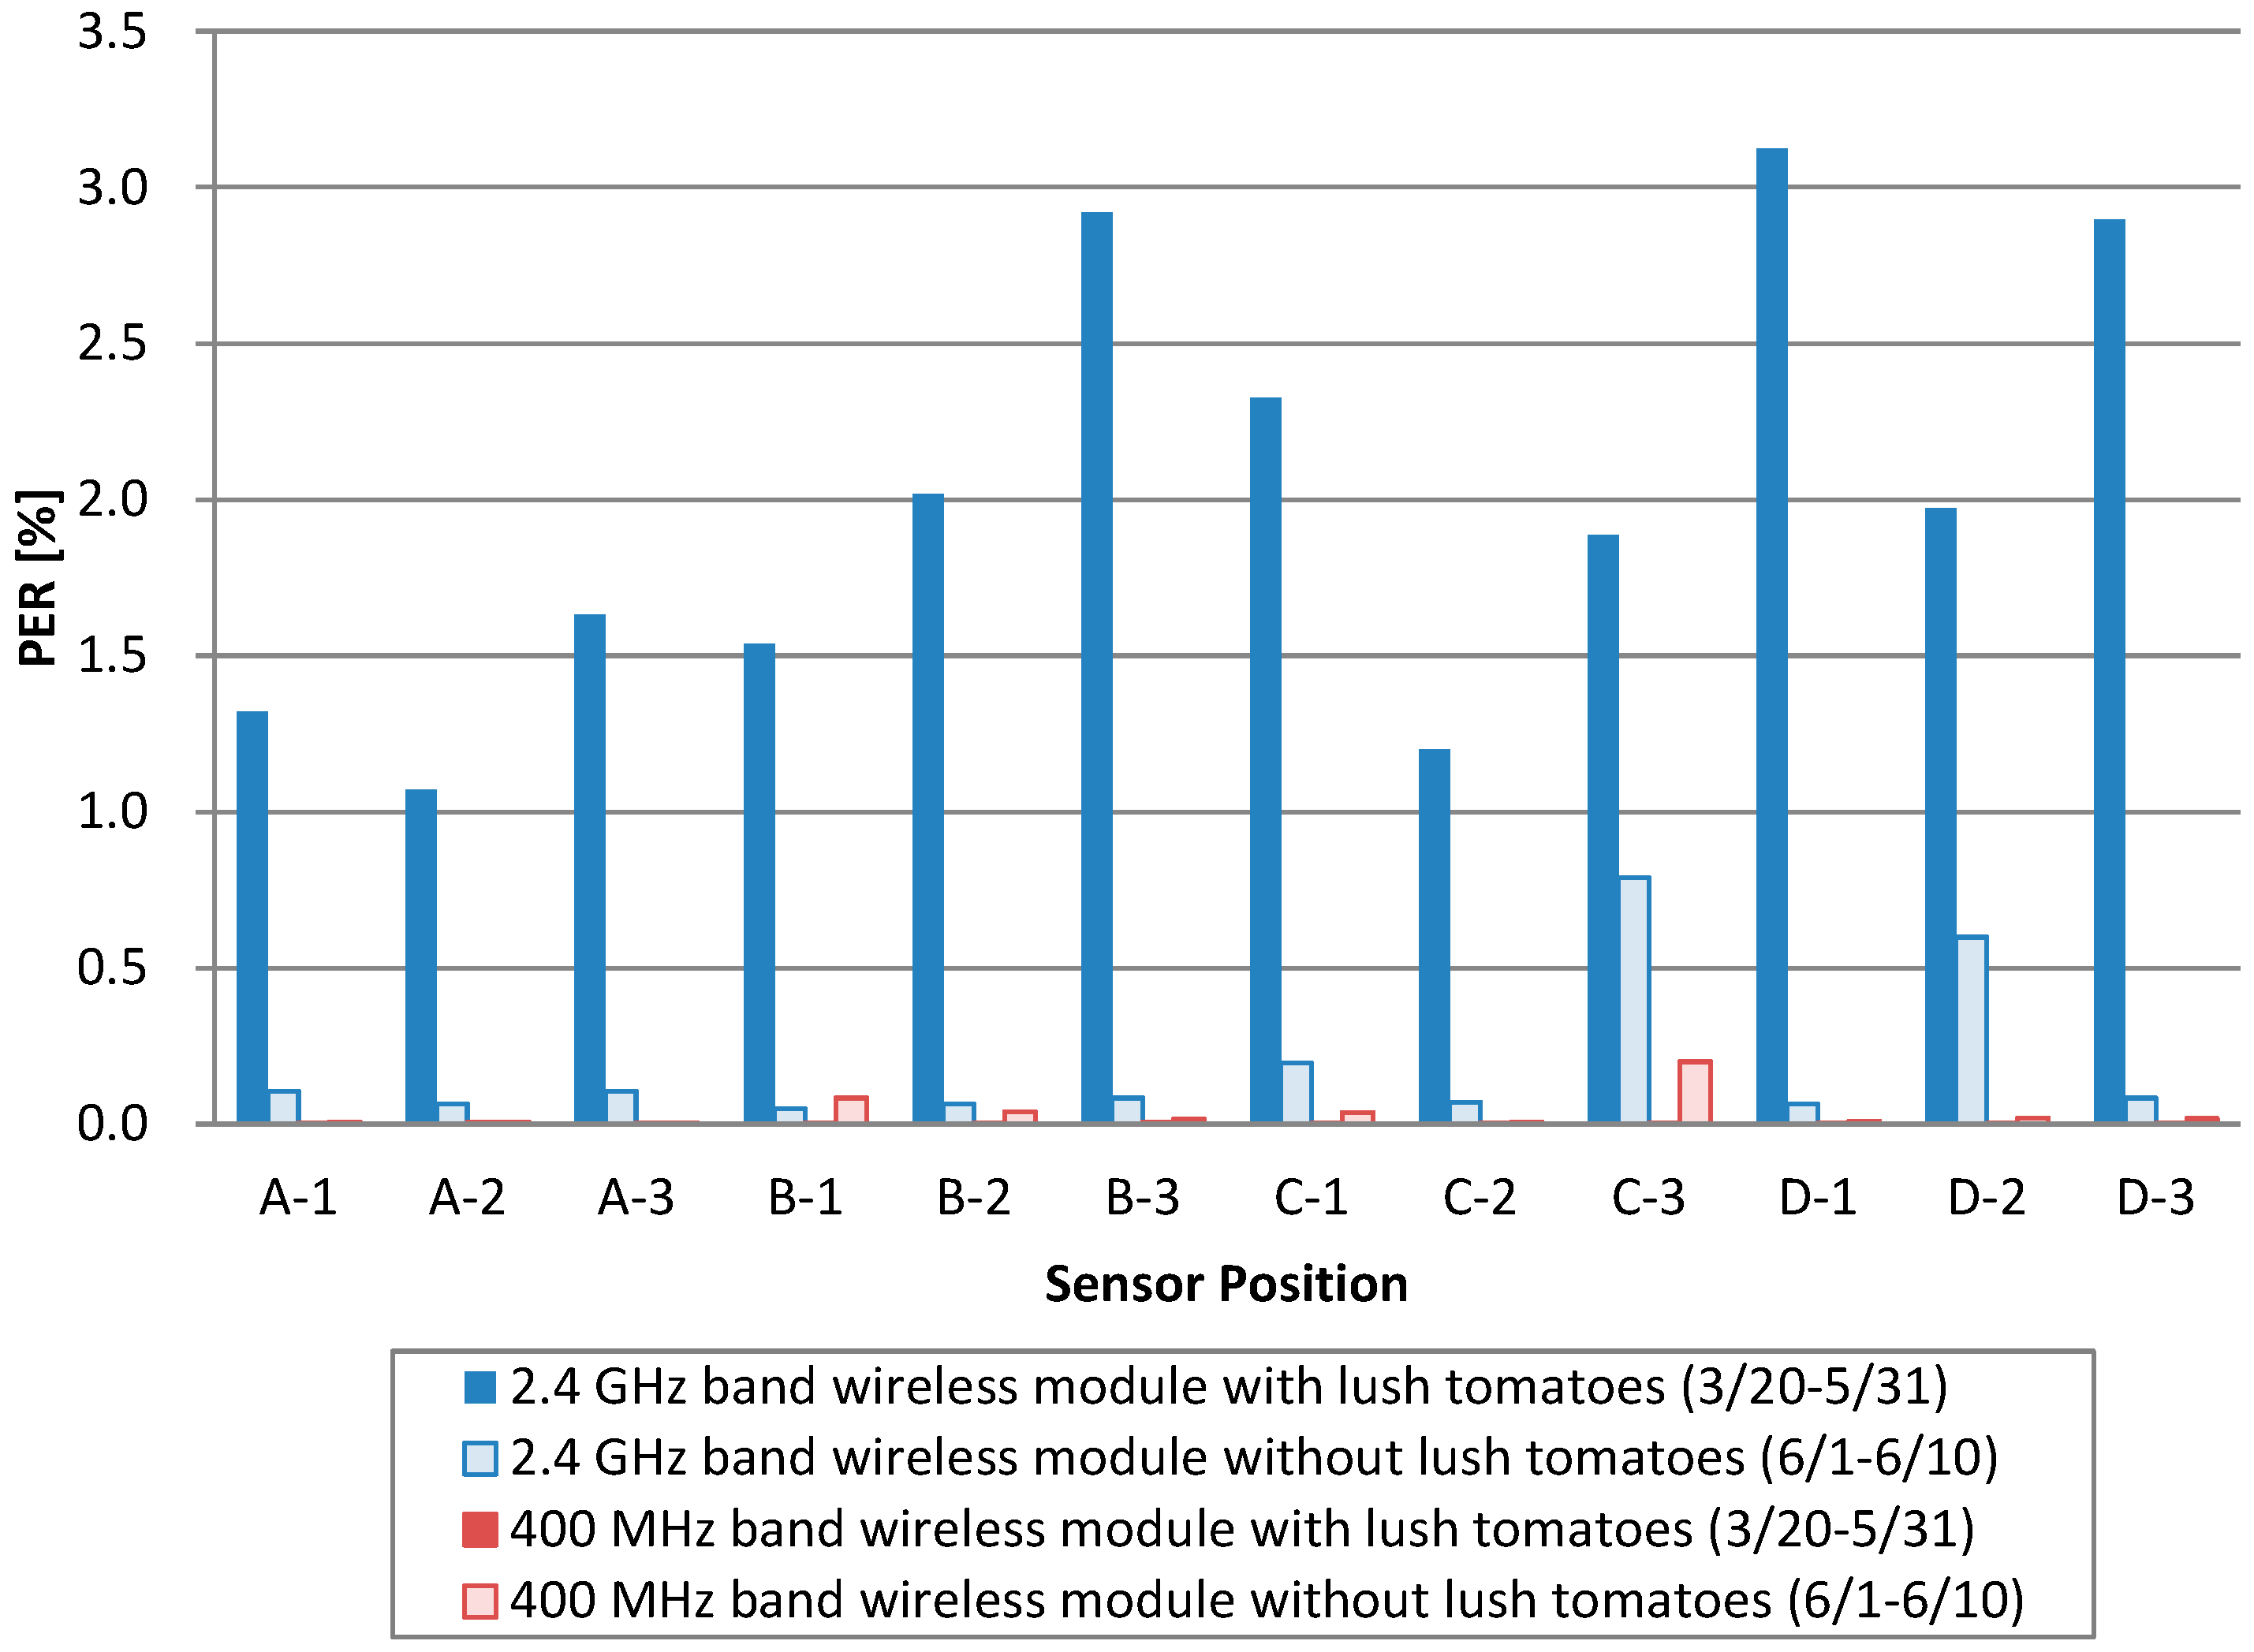
3.1. Basic Experiment
3.2. System Evaluation
4. Conclusions
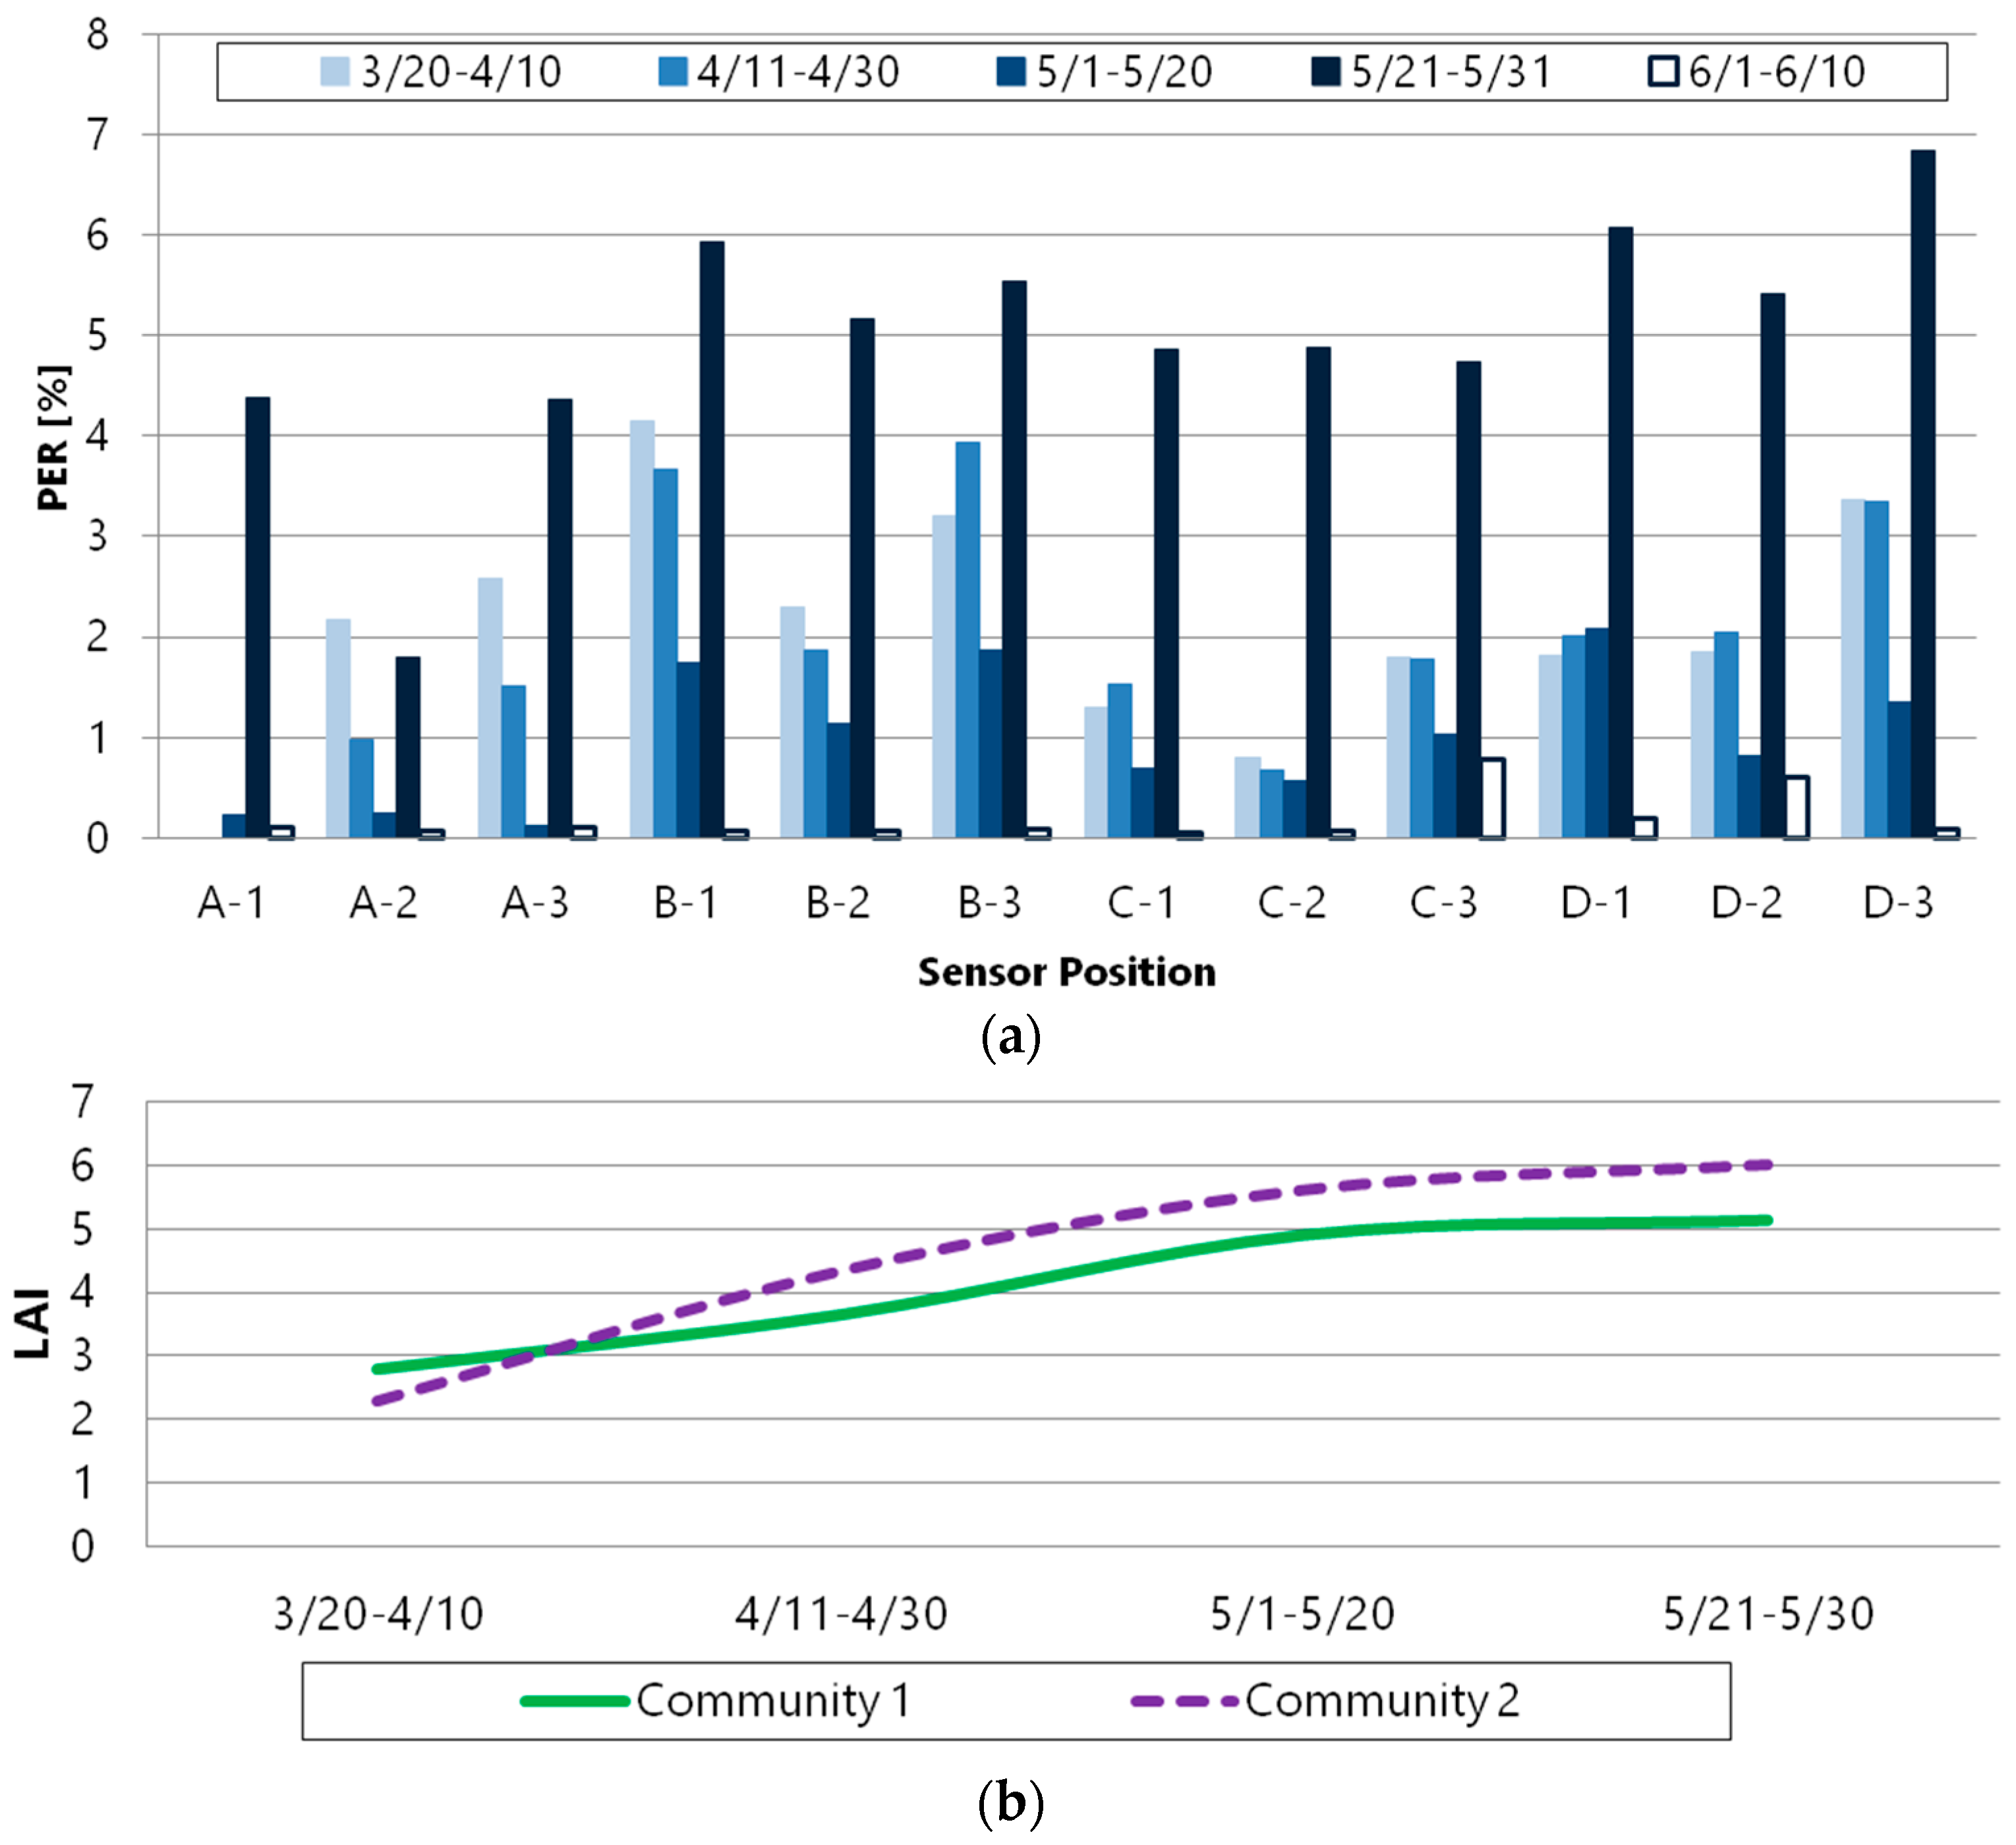
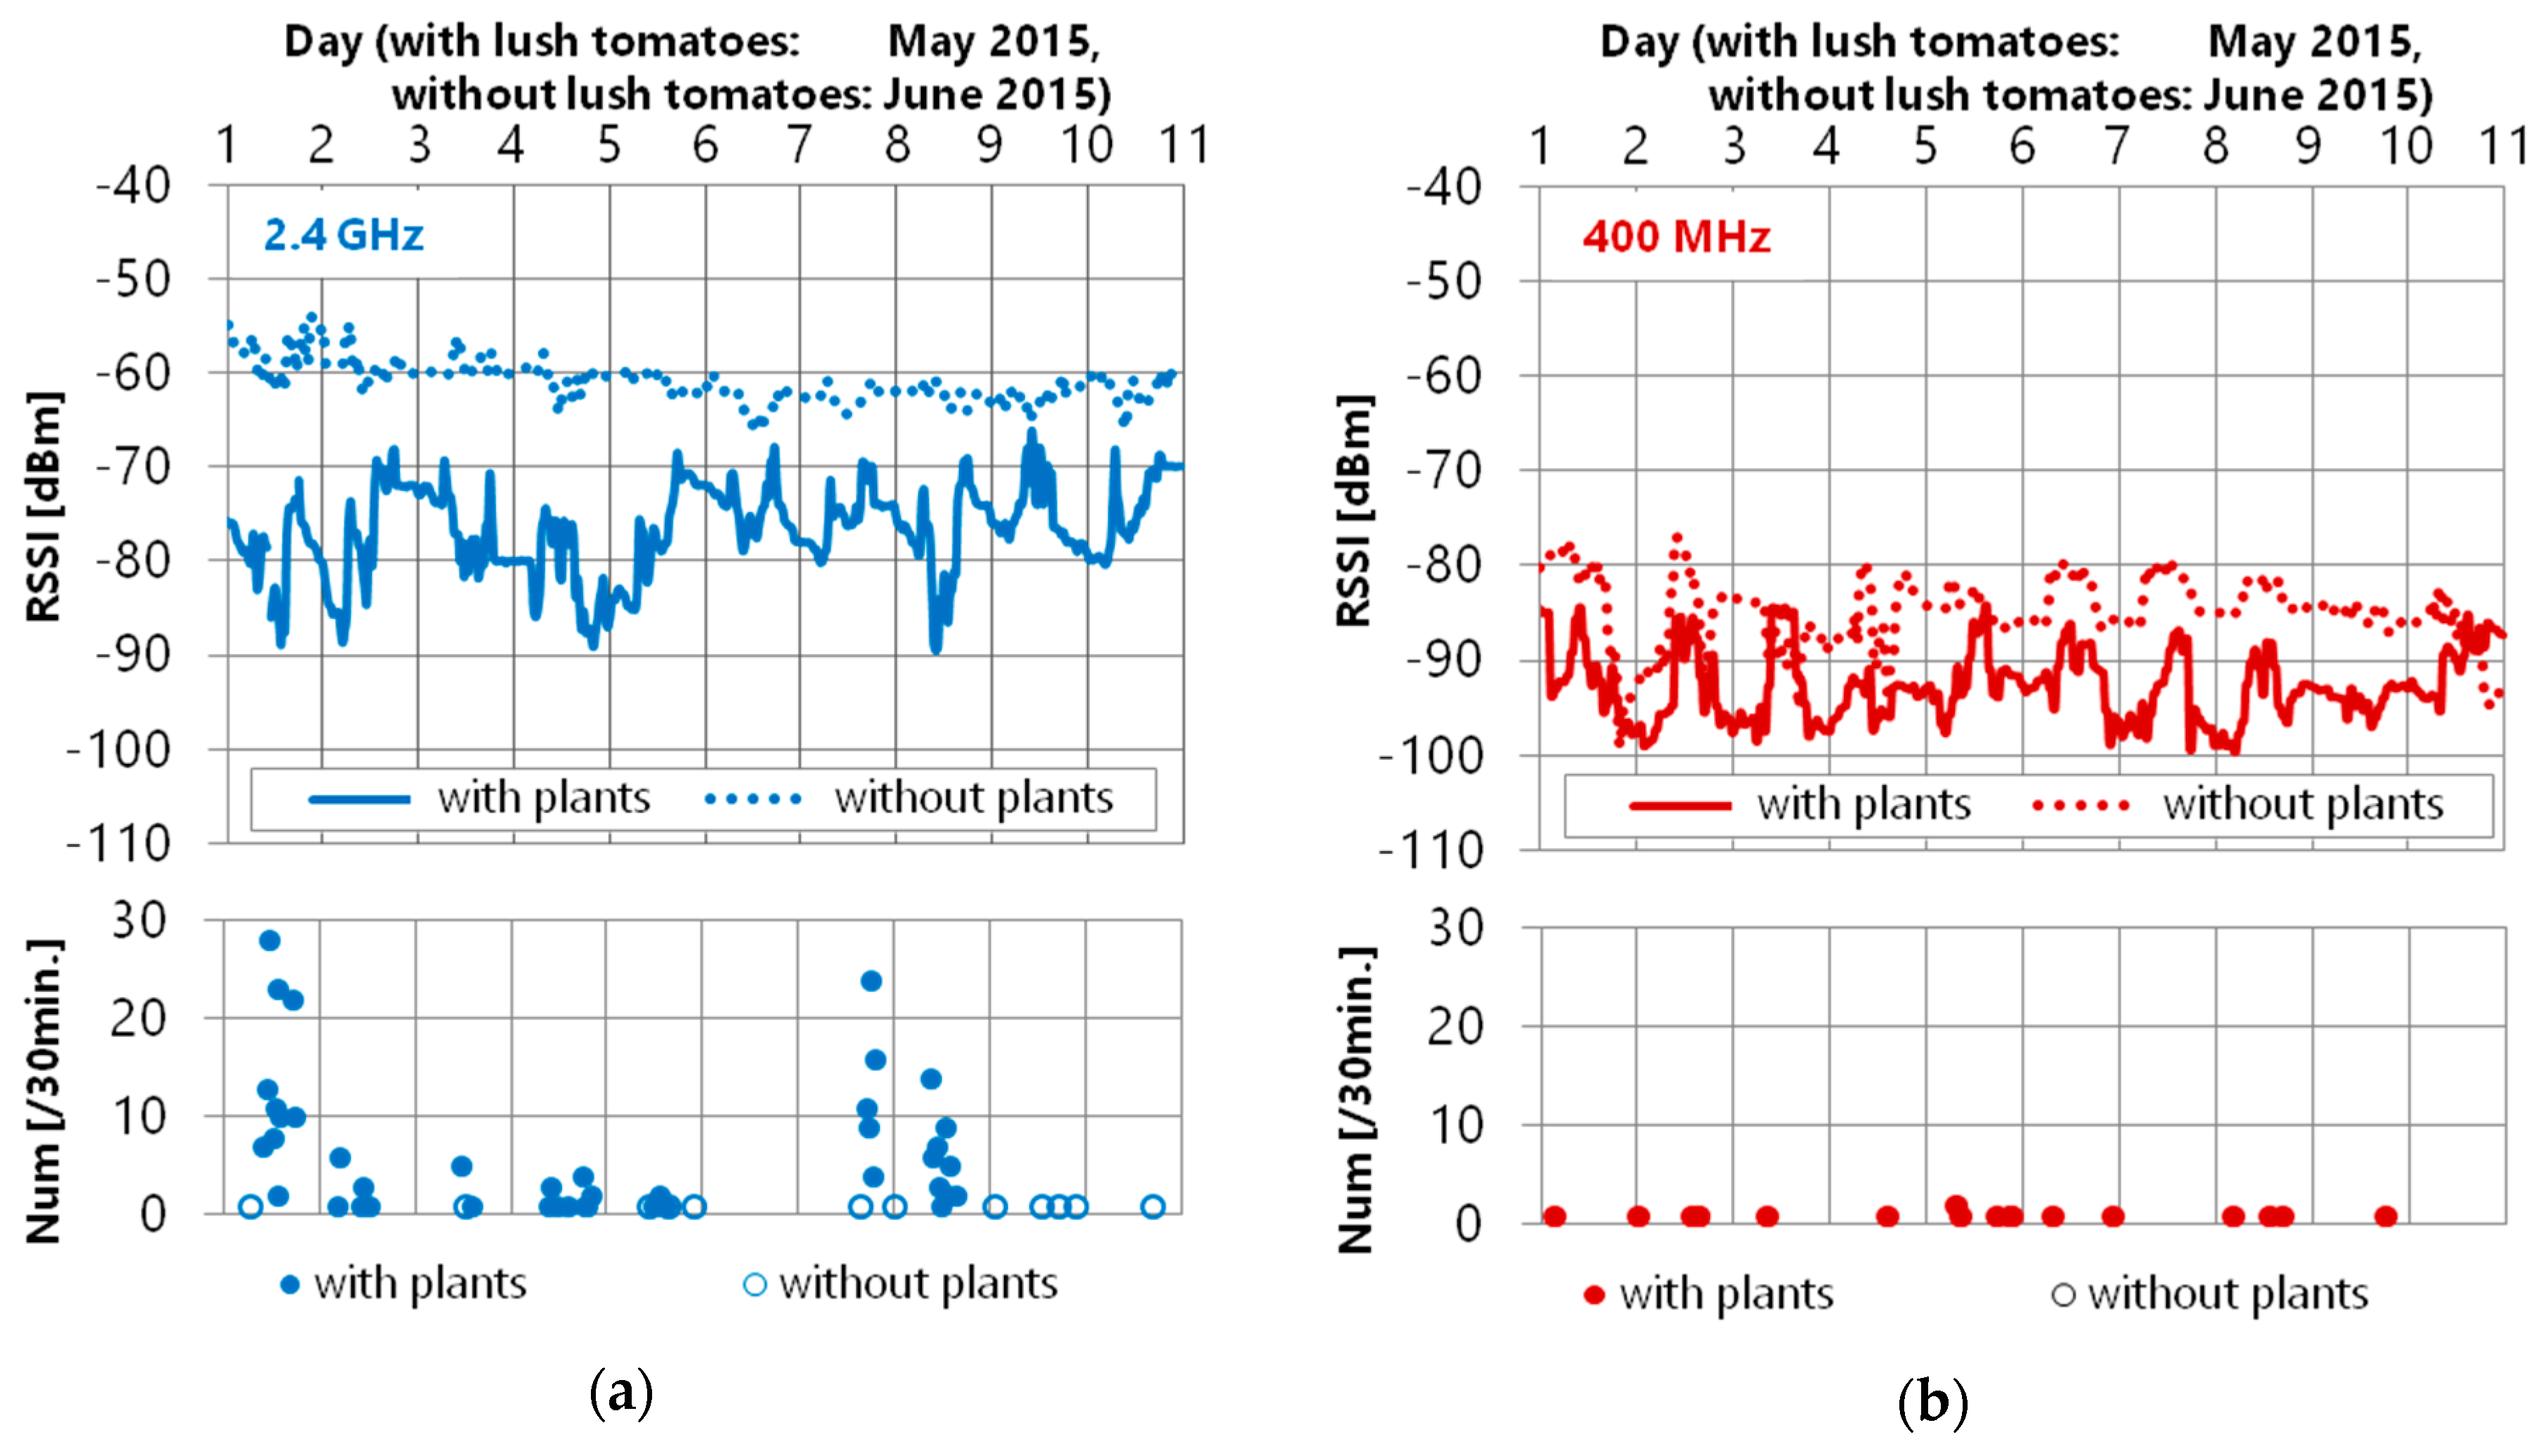
- The 400 MHz band is less affected by plants compared to the 2.4 GHz band.
- Although there are some packet retransmissions, the 400 MHz band and the IEEE 802.15.6 standard could reduce packet errors and data losses.
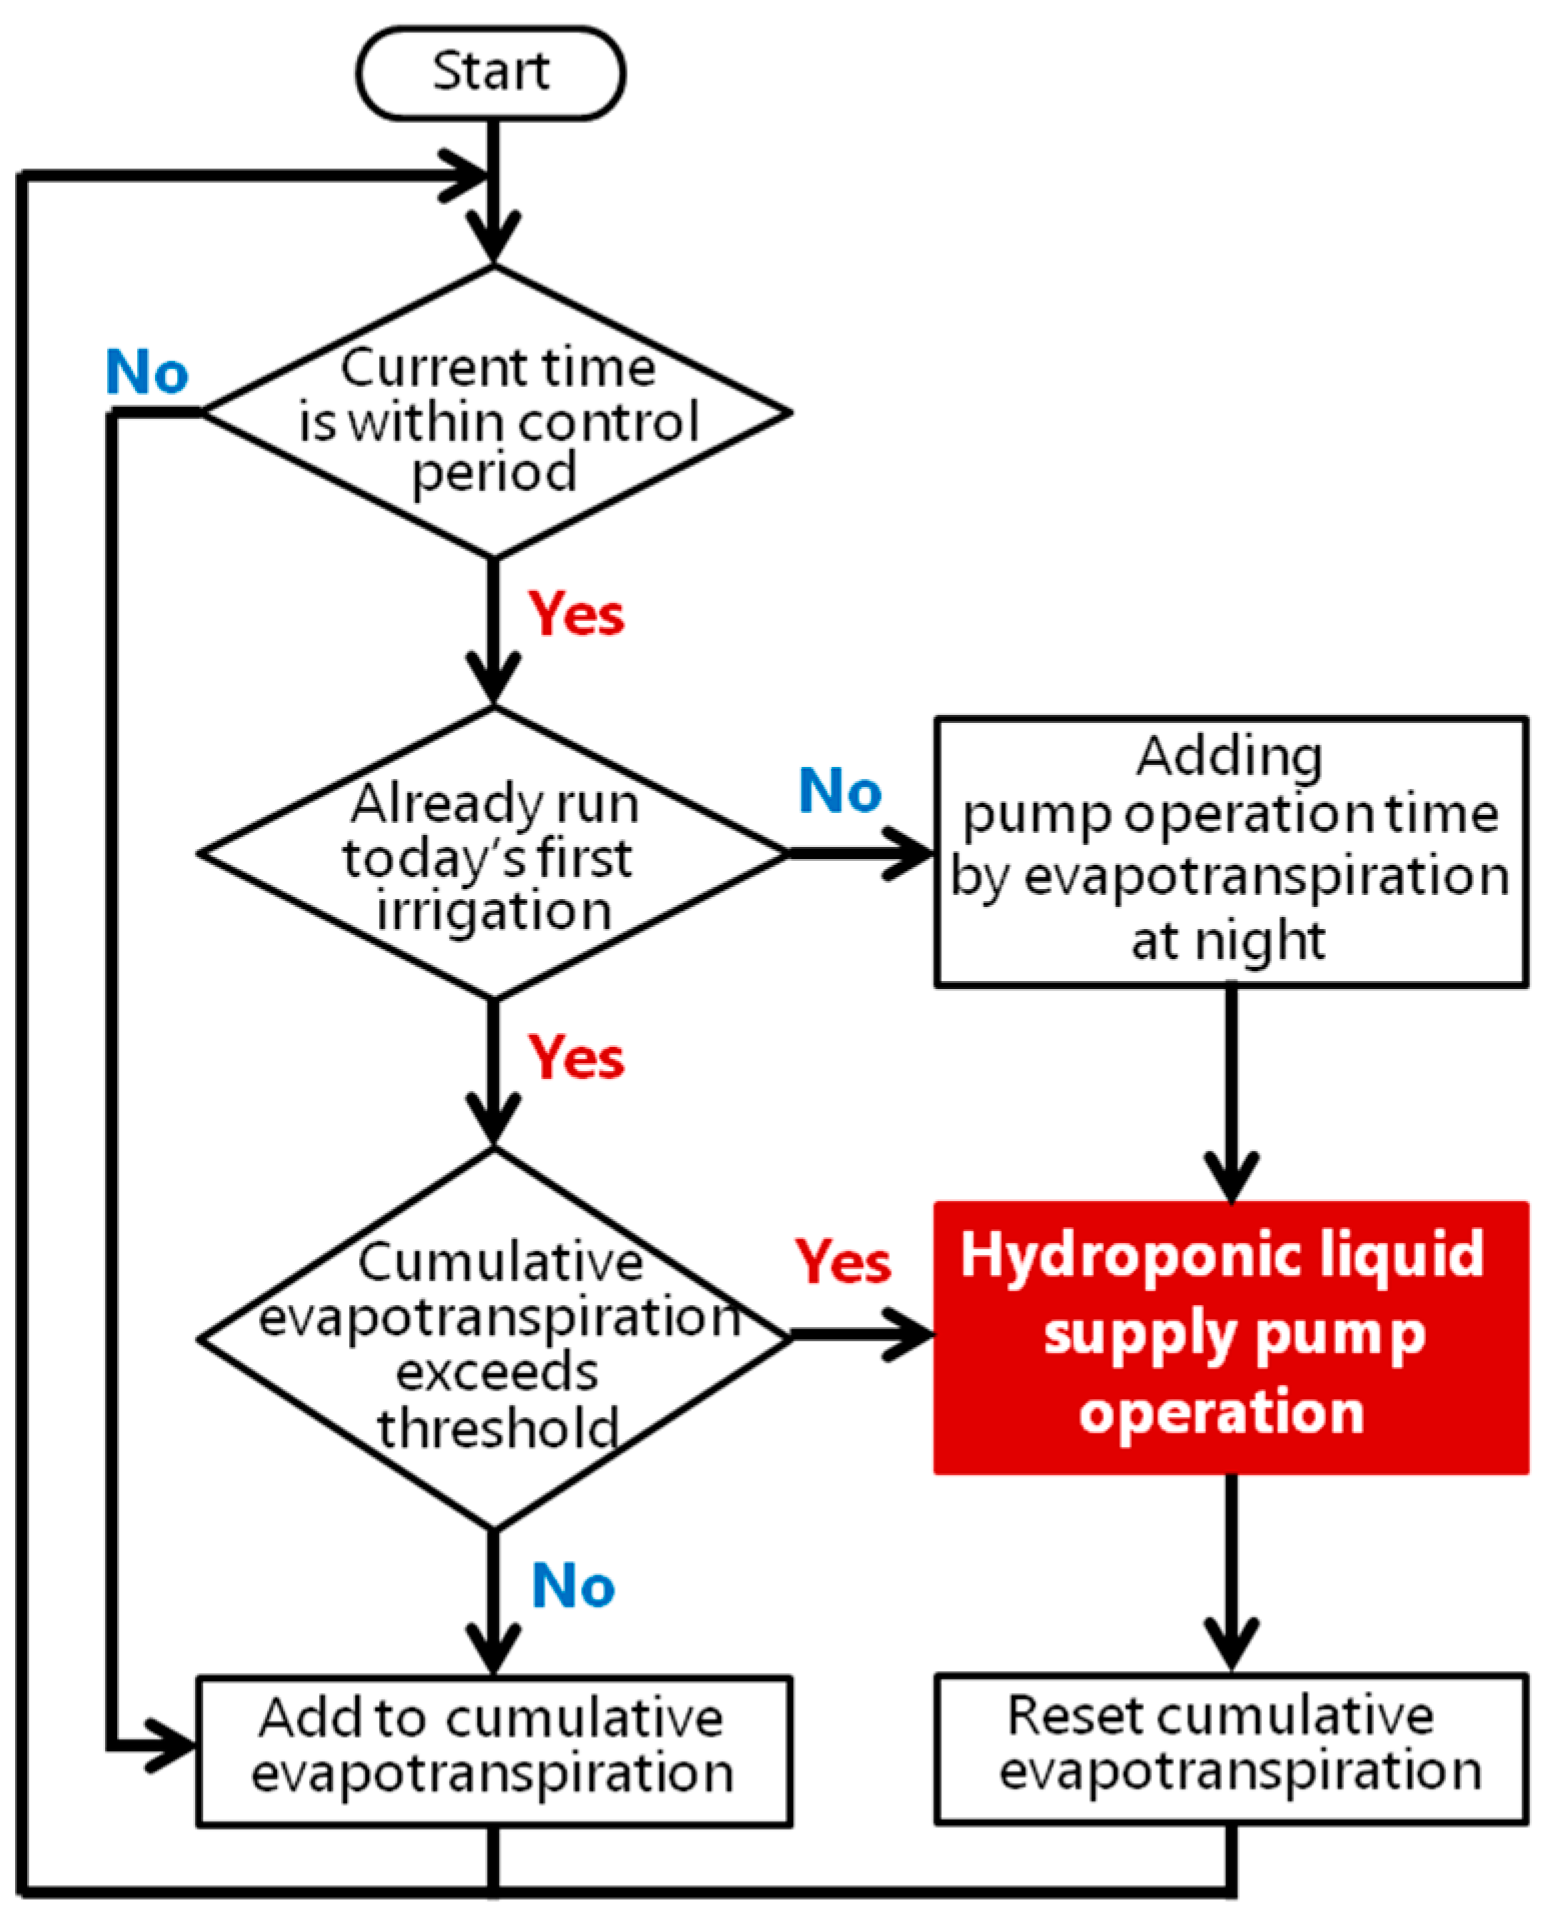
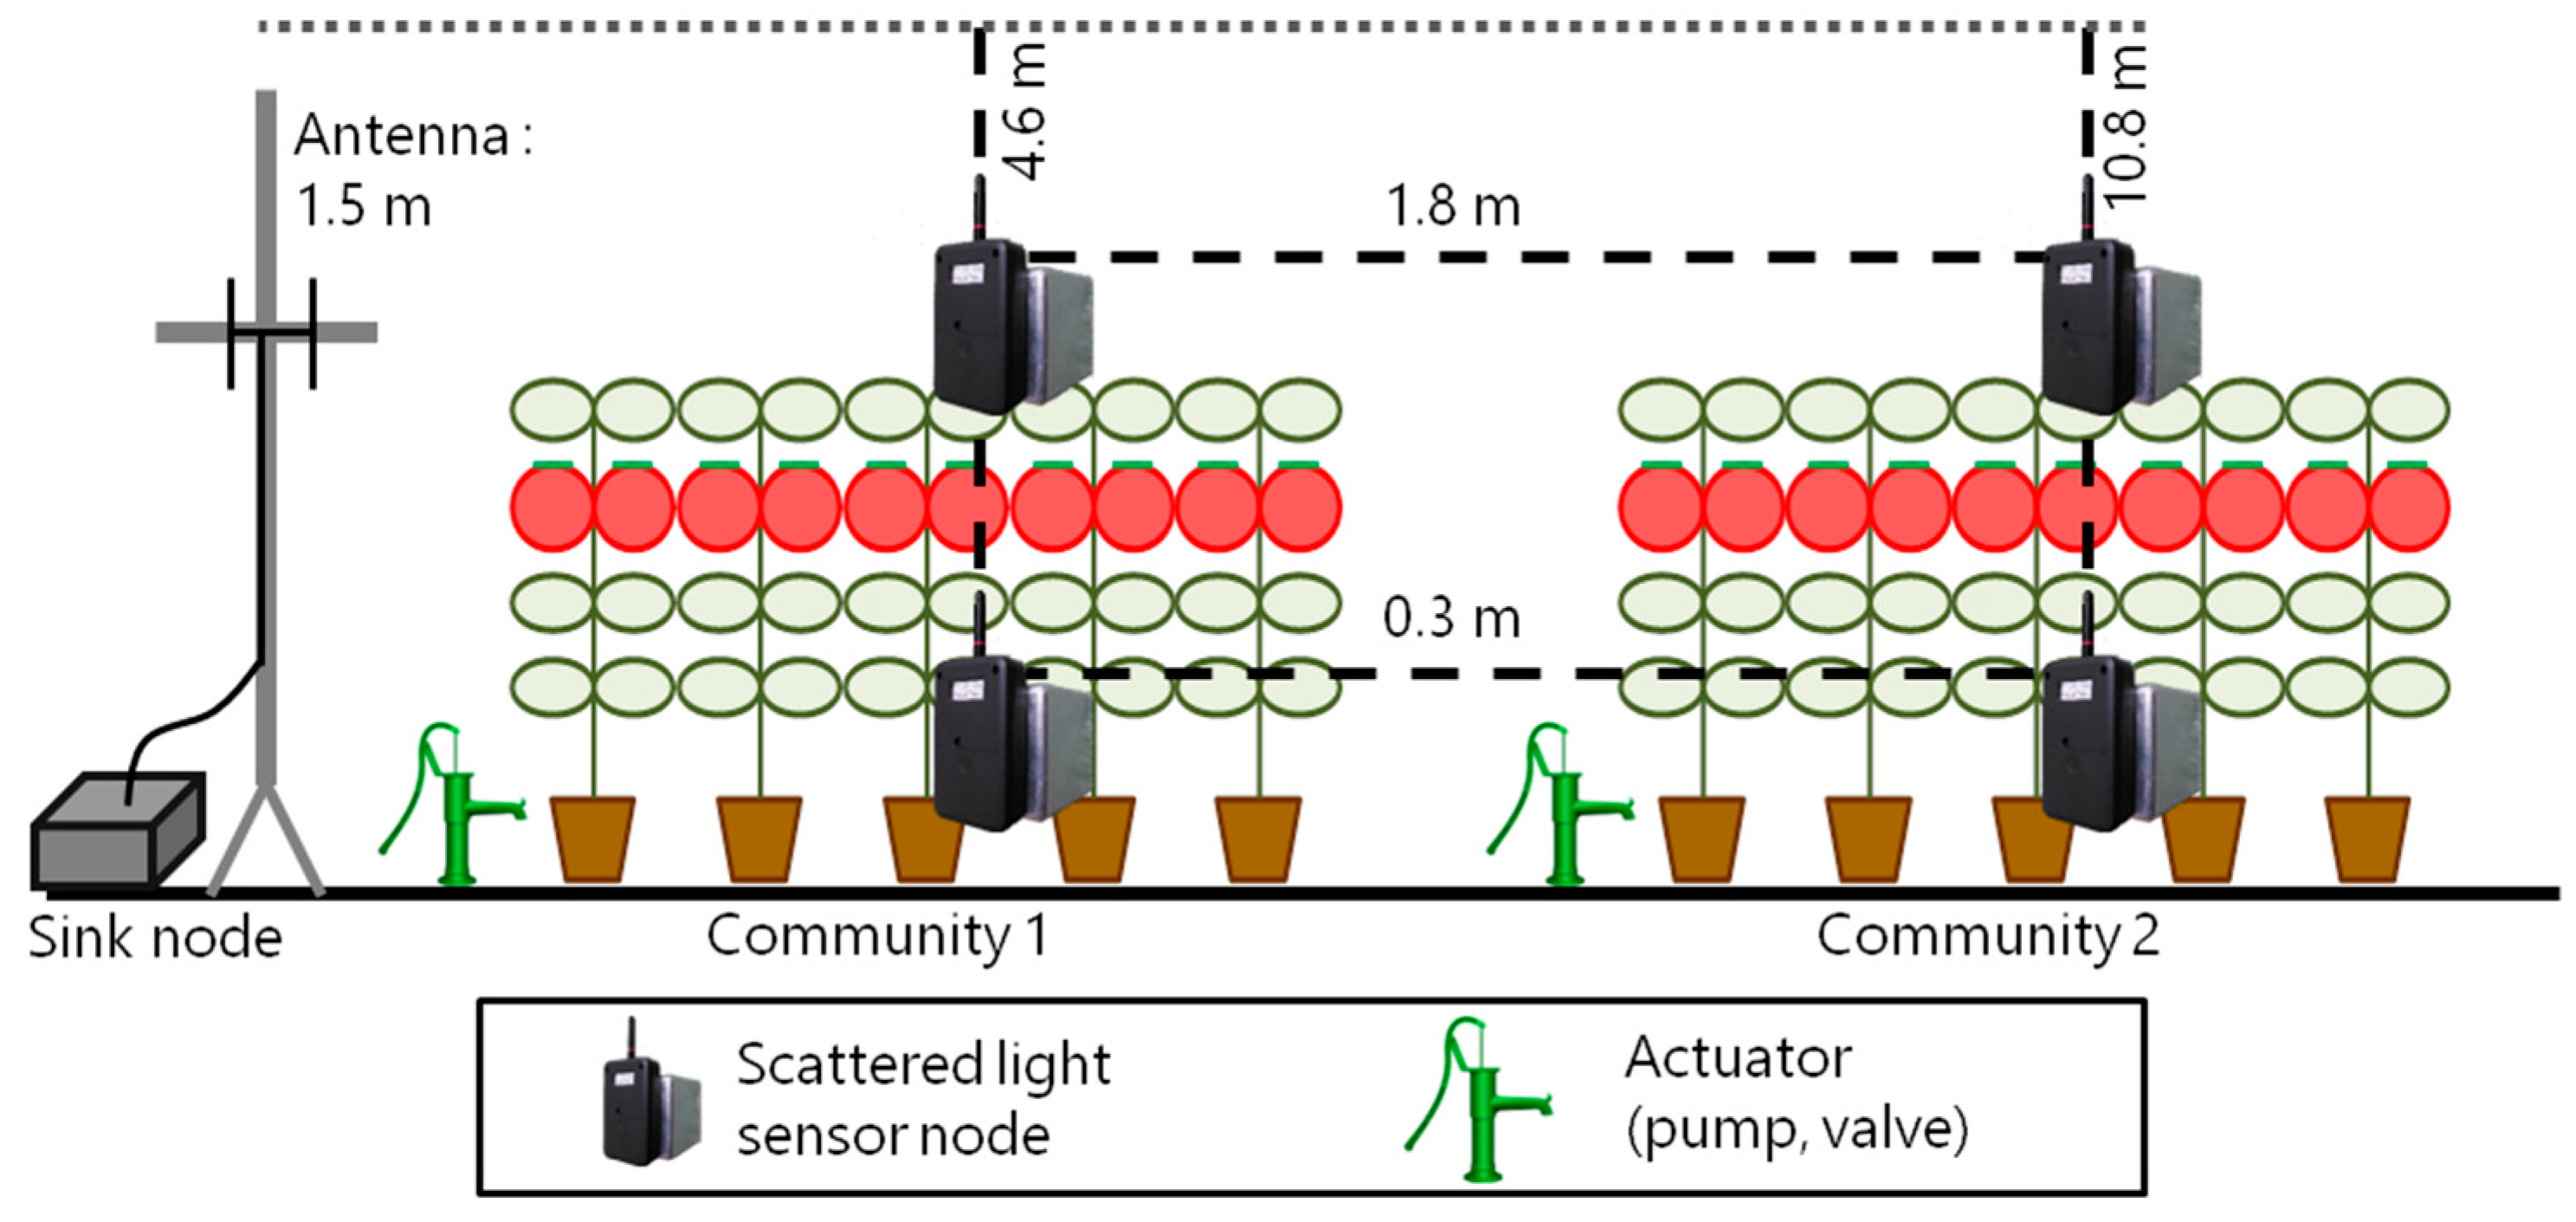
- The scattered light sensor node with 400 MHz band could control hydroponics on a minute scale.
Acknowledgments
Author Contributions
Conflicts of Interest
References
- Pande, A.B.; Sheikh, N.S.; Upare, K.; Raut, S.; Ali, S. Wireless Sensor Network Based Greenhouse Monitoring System. Int. J. Res. 2016, 3, 351–353. [Google Scholar]
- Emmi, L.; Gonzalez-de-Soto, M.; Pajares, G.; Gonzalez-de-Santos, P. Integrating sensory/actuation systems in agricultural vehicles. Sensors 2014, 14, 4014–4049. [Google Scholar] [CrossRef] [PubMed]
- Pajares, G.; Peruzzi, A.; Gonzalez-de-Santos, P. Sensors in agriculture and forestry. Sensors 2013, 13, 12132–12139. [Google Scholar] [CrossRef] [PubMed]
- Mirebella, O.; Brischetto, M. A hybrid wired/wireless networking infrastructure for greenhouse management. IEEE Trans. Instrum. Meas. 2011, 60, 398–407. [Google Scholar] [CrossRef]
- FUJITSU Intelligent Society Solution Akisai. Available online: http://jp.fujitsu.com/solutions/cloud/agri/ uecs/ (accessed on 30 January 2016).
- Yasuba, K.; Kurosaki, H.; Takaichi, M.; Suzuki, K. Development of an automatic data collection and communication system for greenhouse in Japan. In Proceedings of SICE Annual Conference (SICE) 2011, Tokyo, Japan, 13–18 September 2011; pp. 2806–2807.
- Jiang, S.; Wang, W.; Hu, Y.; Ye, Y. Design of Wireless Monitoring System for Environment Monitoring in Greenhouse Cultivation. In Proceedings of the 6th International Asia Conference on Industrial Engineering and Management Innovation, Tianjin, China, 25–26 July 2015; pp. 219–228.
- Jahnavi, V.S.; Ahamed, S.F. Smart Wireless Sensor Network for Automated Greenhouse. IETE J. Res. 2015, 61, 180–185. [Google Scholar] [CrossRef]
- Park, D.; Park, J.W. Wireless sensor network-based greenhouse environment monitoring and automatic control system for dew condensation prevention. Sensors 2011, 11, 3640–3651. [Google Scholar] [CrossRef] [PubMed]
- Erazo, M.; Rivas, D.; Pérez, M.; Galarza, O.; Bautista, V.; Huerta, M.; Rojo, J.L. Design and implementation of a wireless sensor network for rose greenhouses monitoring. In Proceedings of the 6th International Conference on Automation, Robotics and Applications (ICARA) 2015, Queenstown, New Zealand, 17–19 February 2015; pp. 256–261.
- Huang, J.; Kumar, R.; Kamal, A.E.; Weber, R.J. Development of a wireless soil sensor network. In Proceedings of ASABE Annual International Meeting, Rhode Island, RI, USA, 29 June–2 July 2008.
- Vellidis, G.; Tucker, M.; Perry, C.; Kvien, C.; Bednarz, C. A real-time wireless smart sensor array for scheduling irrigation. Comput. Electron. Agric. 2008, 61, 44–50. [Google Scholar] [CrossRef]
- Ibayashi, H.; Kaneda, Y.; Li, P.; Suzuki, Y.; Imahara, J.; Oishi, N.; Kuroda, M.; Mineno, H. Study on Highly Reliable Wireless Environmental Control System for Horticulture Environment. Inf. Process. Soc. Jpn Consum. Device Syst. 2015, 5, 10–20. [Google Scholar]
- Youssef, M.A.; Agrawala, A.; Udaya, S.A. WLAN location determination via clustering and probability distributions. In Proceedings of the First IEEE International Conference on Pervasive Computing and Communications (PerCom) 2003, Fort Worth, TX, USA, 23–26 March 2003; pp. 143–150.
- Doherty, L.; Teasdale, D.A. Towards 100% reliability in wireless monitoring networks. In Proceedings of the 3rd ACM International Workshop on Performance Evaluation of Wireless Ad Hoc, Sensor and Ubiquitous Networks, Torremolinos, Spain, 2–6 October 2006; pp. 132–135.
- Baviskar, J.; Mulla, A.; Baviskar, A.; Ashtekar, S.; Chintawar, A. Real time monitoring and control system for green house based on 802.15. 4 wireless sensor network. In Proceedings of the Fourth International Conference of Communication Systems and Network Technologies (CSNT) 2014, Bhopal, India, 7–9 April 2014; pp. 98–103.
- Watteyne, T.; Vilajosana, X.; Kerkez, B.; Chraim, F.; Weekly, K.; Wang, Q.; Glaser, S.; Pister, K. OpenWSN: a standards-based low-power wireless development environment. Trans. Emerg. Telecommun. Technol. 2012, 23, 480–493. [Google Scholar] [CrossRef]
- Kim, Y.D.; Kang, W.S.; Cho, K.; Kim, D. RMRP: A reliable MAC and routing protocol for congestion in IEEE 802.15. 4 based wireless sensor networks. IEICE Trans. Commun. 2013, 96, 2998–3006. [Google Scholar] [CrossRef]
- Song, W.; Zhou, L.; Yang, C.; Cao, X.; Zhang, L.; Liu, X. Tomato Fusarium wilt and its chemical control strategies in a hydroponic system. Crop Prot. 2004, 23, 243–247. [Google Scholar] [CrossRef]
- Thelen, J.; Goense, D.; Langgendoen, K. Radio wave propagation in potato fields. In Proceedings of 1st Workshop on Wireless Network Measurements, Trentino, Italy, 3 April 2005; pp. 331–338.
- Siddiqi, M.Y.; Malhotra, B.; Min, X.; Glass, A.D.M. Effects of ammonium and inorganic carbon enrichment on growth and yield of a hydroponic tomato crop. J. Plant Nutr. Soil Sci. 2002, 165, 191–197. [Google Scholar] [CrossRef]
- Oishi, N. Development of the scattered light multi-sensor unit to get greenhouse environment and plant ecology information. In Proceedings of Japanese Society of Agricultural, Biological, and Environmental Engineers and Scientists 2014, Tokyo, Japan, 8–11 September 2014.
- Okai, Z. Effects of the Near-Infrared-Ultraviolet Light is Applied to the Growth of the Plant; Fukui University: Fukui, Japan, 2004; pp. 57–62. [Google Scholar]
- Matsuno, T.; Kushioka, S.; Imahara, J.; Fukuda, M.; Mizuno, T.; Mineno, H. Development of Agri-Environmental Visualization and Control System using Spatial Interpolation. In Proceedings of Multimedia, Distributed, Cooperative, and Mobile Symposium (DICOMO) 2012, Ishikawa, Japan, 4–6 July 2012.
- ARIB STANDARD ARIB STD-T67. Available online: http://www.arib.or.jp/english/html/overview/doc/5-STD-T67v1_1-E.pdf (accessed on 30 January 2016).
- Kuroda, M.; Ibayashi, H.; Mineno, H. Affordable 400 MHz long-haul sensor network for greenhouse horticulture. In Proceedings of the International Conference on Information Networking (ICOIN) 2015, Siem Reap, Cambodia, 12–14 January 2015.


| Specification | 2.4 GHz Band Wireless Module | 400 MHz Band Wireless Module |
|---|---|---|
| Chip | CC2420 (Texas Instruments) | CC430F5137 (Texas Instruments) |
| Frequency (Bandwidth) | 2405–2480 MHz (5 MHz interval 16ch) | 429.25–429.75 MHz (12.5 kHz interval 40ch) |
| Protocol | Based on IEEE 802.15.4 standard | Based on IEEE 802.15.6 standard |
| Bit rate | 250 kbps | 7200 bps |
| Transmit power | 10 mW | 10 mW |
| Power supply | 3-volt DC | 3-volt DC |
| Sensor Placement | Receive/Send 1 | Data Losses | Packet Resends |
|---|---|---|---|
| Community 1 Upper | 86475 / 86475 | 0 | 0 |
| Community 1 Inner | 87426 / 87453 | 0 | 27 |
| Community 2 Upper | 84991 / 85110 | 0 | 119 |
| Community 2 Inner | 89687 / 89702 | 0 | 15 |
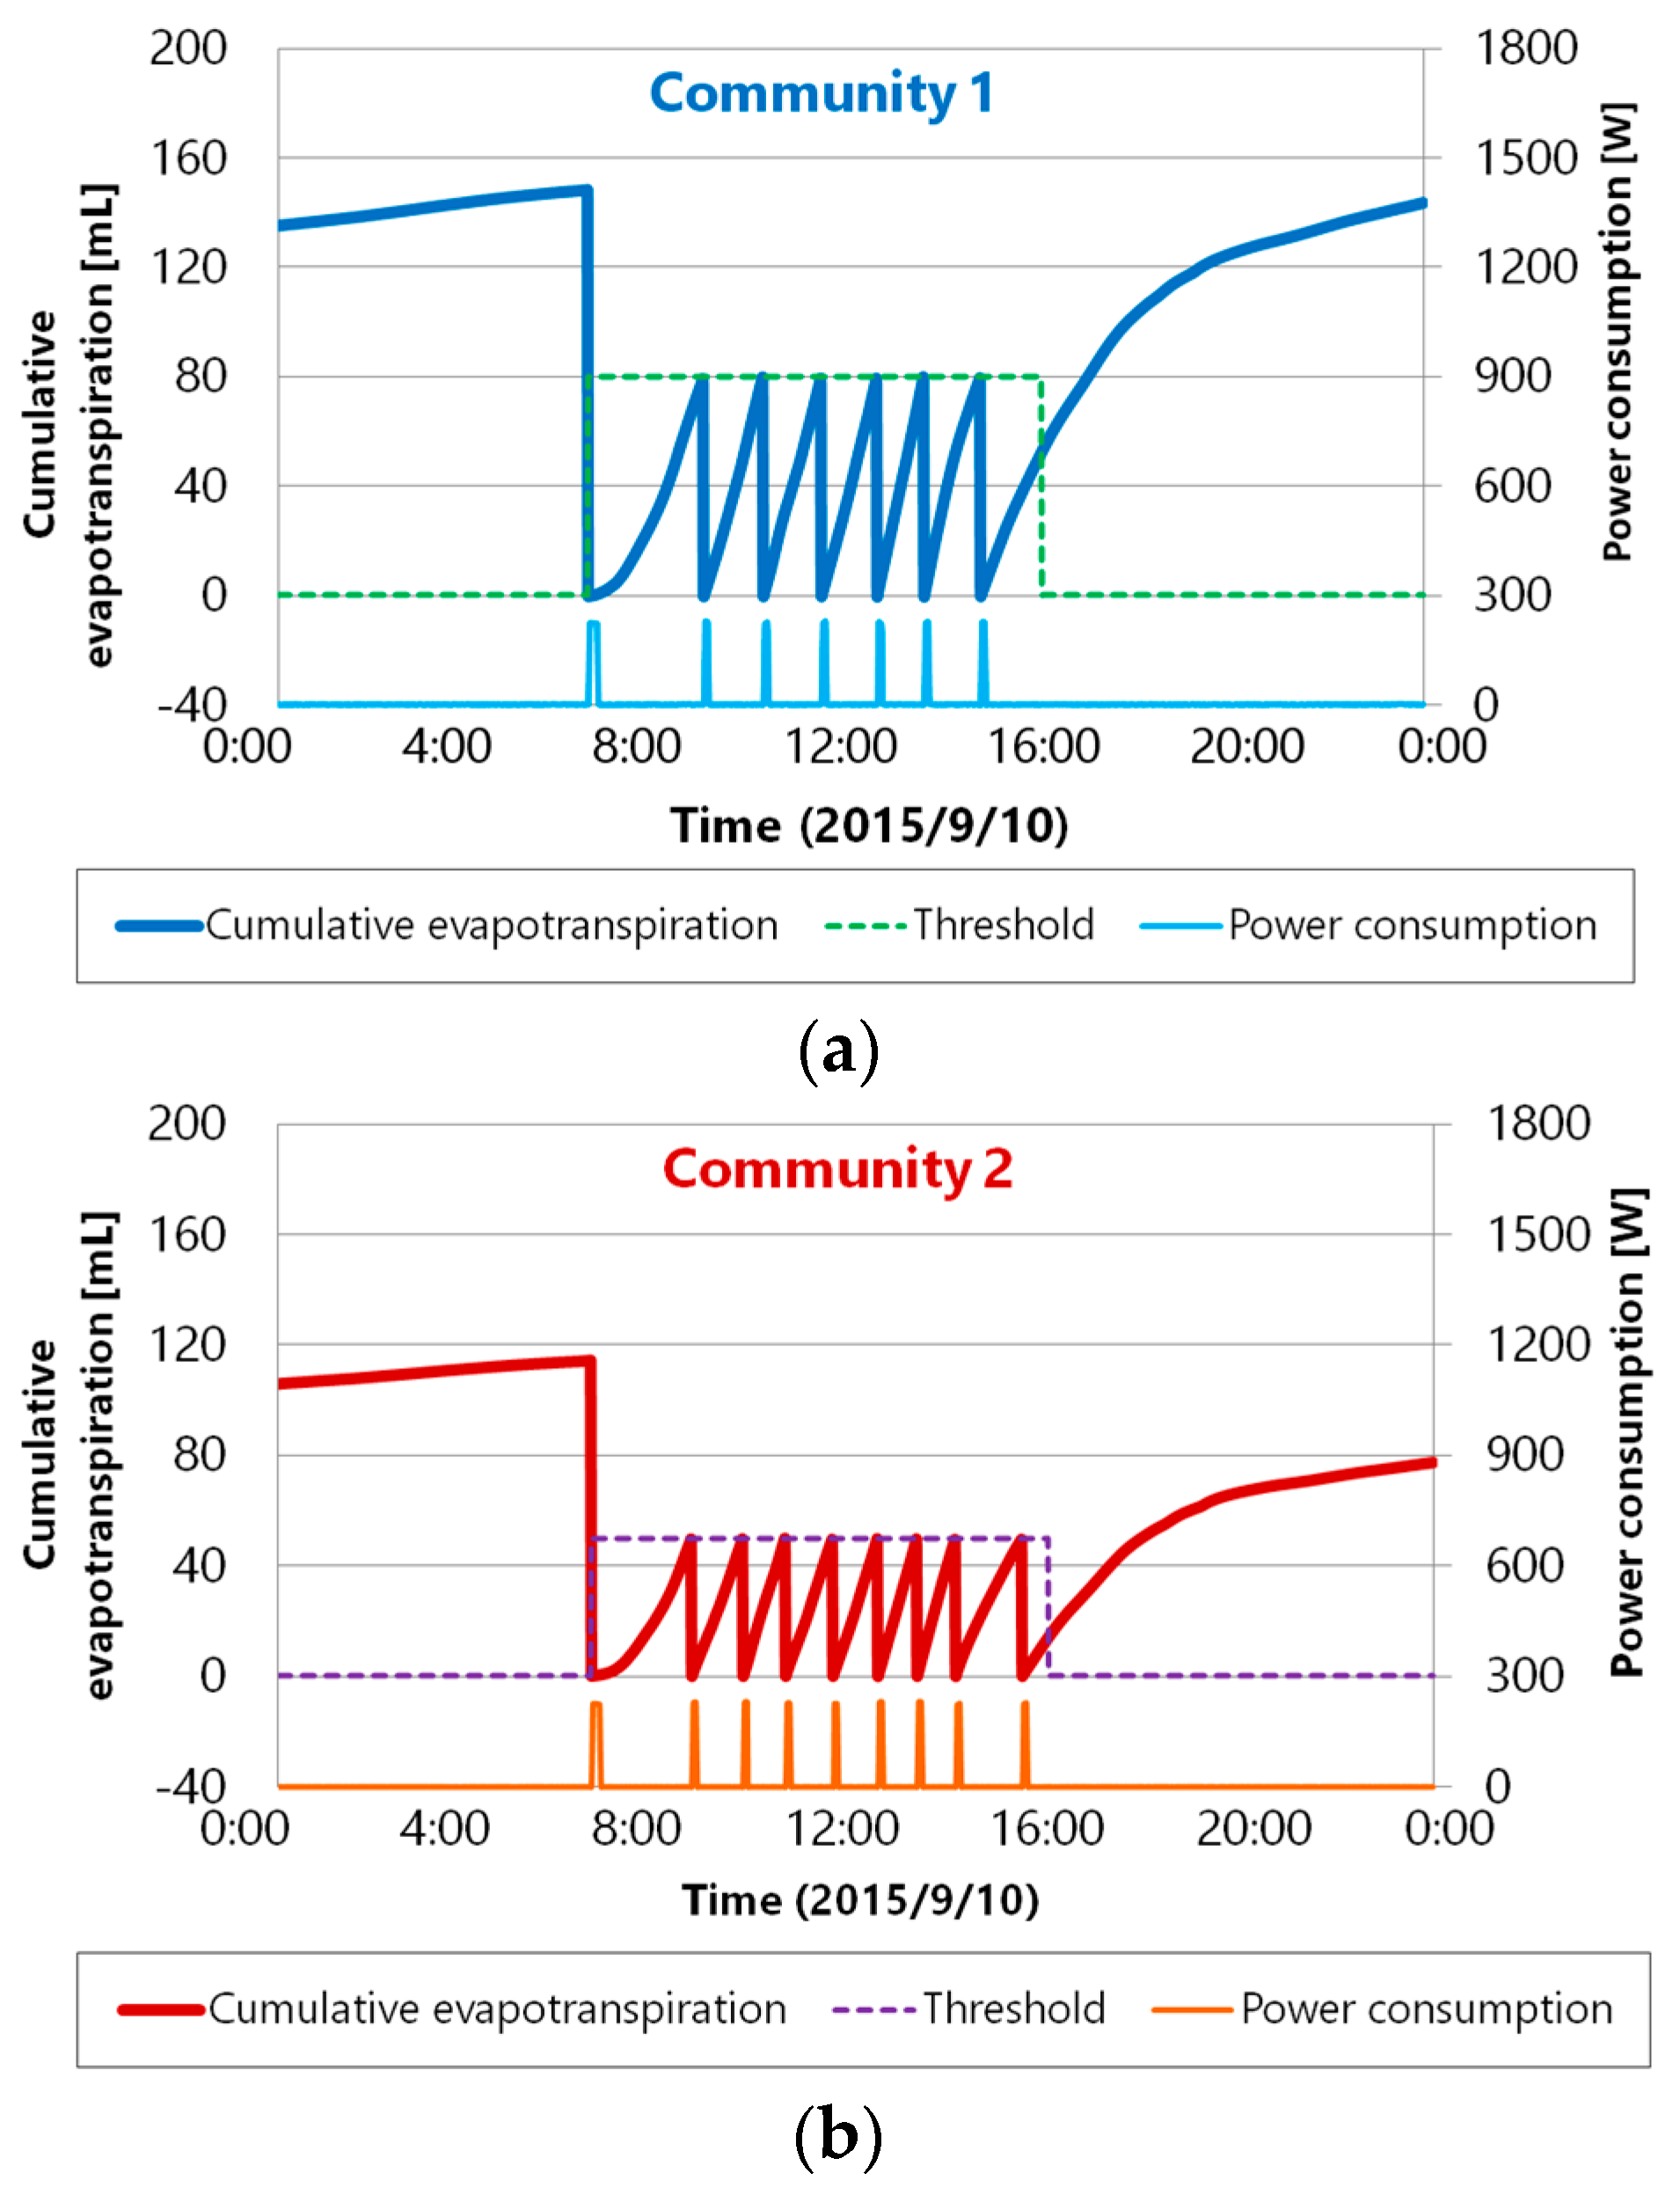
| Placement | Control Period | Threshold | Supply Time |
|---|---|---|---|
| Community 1 | 7 am–5 pm | 80 | 5 |
| Community 2 | 7 am–5 pm | 50 | 5 |
© 2016 by the authors; licensee MDPI, Basel, Switzerland. This article is an open access article distributed under the terms and conditions of the Creative Commons Attribution (CC-BY) license (http://creativecommons.org/licenses/by/4.0/).
Share and Cite
Ibayashi, H.; Kaneda, Y.; Imahara, J.; Oishi, N.; Kuroda, M.; Mineno, H. A Reliable Wireless Control System for Tomato Hydroponics. Sensors 2016, 16, 644. https://doi.org/10.3390/s16050644
Ibayashi H, Kaneda Y, Imahara J, Oishi N, Kuroda M, Mineno H. A Reliable Wireless Control System for Tomato Hydroponics. Sensors. 2016; 16(5):644. https://doi.org/10.3390/s16050644
Chicago/Turabian StyleIbayashi, Hirofumi, Yukimasa Kaneda, Jungo Imahara, Naoki Oishi, Masahiro Kuroda, and Hiroshi Mineno. 2016. "A Reliable Wireless Control System for Tomato Hydroponics" Sensors 16, no. 5: 644. https://doi.org/10.3390/s16050644