Article

Quantitative Index and Abnormal Alarm Strategy Using Sensor-Dependent Vibration Data for Blade Crack Identification in Centrifugal Booster Fans

1
State Key Laboratory for Manufacturing and Systems Engineering, Xi’an Jiaotong University, Xi’an 710049, China
2
Beijing Institute of Astronautical Systems Engineering, Beijing 100076, China
*
Author to whom correspondence should be addressed.
Sensors 2016, 16(5), 632; https://doi.org/10.3390/s16050632
Submission received: 8 March 2016 / Revised: 24 April 2016 / Accepted: 27 April 2016 / Published: 9 May 2016

Abstract

:
Centrifugal booster fans are important equipment used to recover blast furnace gas (BFG) for generating electricity, but blade crack faults (BCFs) in centrifugal booster fans can lead to unscheduled breakdowns and potentially serious accidents, so in this work quantitative fault identification and an abnormal alarm strategy based on acquired historical sensor-dependent vibration data is proposed for implementing condition-based maintenance for this type of equipment. Firstly, three group dependent sensors are installed to acquire running condition data. Then a discrete spectrum interpolation method and short time Fourier transform (STFT) are applied to preliminarily identify the running data in the sensor-dependent vibration data. As a result a quantitative identification and abnormal alarm strategy based on compound indexes including the largest Lyapunov exponent and relative energy ratio at the second harmonic frequency component is proposed. Then for validation the proposed blade crack quantitative identification and abnormality alarm strategy is applied to analyze acquired experimental data for centrifugal booster fans and it has successfully identified incipient blade crack faults. In addition, the related mathematical modelling work is also introduced to investigate the effects of mistuning and cracks on the vibration features of centrifugal impellers and to explore effective techniques for crack detection.

1. Introduction

Blast furnace gas (BFG) is a byproduct of iron-making. With the great expansion of the iron and steel industry, the production of BFG during iron-making has increased remarkably [1]. However, blast furnace gas is characterized in low calorific value, difficulty to burn and combustion instability as a power fuel [2], so how to deal effectively with blast furnace gas is a problem that puzzles iron and steel enterprises. In recent years, many enterprises have taken to use BFG to generate electricity in order to save energy and improve benefits. Centrifugal booster fans are important pieces of equipment which are used to pressurize BGF and make sure it can go into the furnace safely and combust stably. Faults occurring on the centrifugal booster fan may lead to accidents such as unstable combustion in the furnace, blow outs, downtime, and potentially huge economic losses.
Blade crack faults (BCFs) are among the typical faults in centrifugal booster fans. Different cracks arise after long running due to the resonance, decreased anti-fatigue capability because of manufacture problems, installation issues or the work conditions [3]. This may result in blades breaking off and the unit being damaged. For a rotor system, the stiffness of the shaft would display cyclical behavior once blade cracks occur [4], and the dynamic response signal will show obvious non-stationary characteristics. Fault diagnosis for blade crack faults is a difficult problem that has drawn the attention of top scholars and outstanding engineers worldwide [5,6,7,8]. Lots of related studies have been reported in important journals [9,10,11]. These researches place emphasis on the following aspects: first, the method based on finite element tries to model the cracked rotor and analyze the fracture mechanisms and the effect on the structural dynamic properties [12,13,14]. This method can provide a theoretical basis for the blade damage identification method based on vibration signals. Second, the method combining the finite element modeling with the signal processing makes use of the finite element method to analyze the dynamic responses of the cracked rotor [15]. Then a signal processing method such as the wavelet transform is applied to analyze the dynamic response and lock the position and size of the crack damage. However, the practical engineering of these methods, especially for blade crack fault detection under operation conditions, should be studied further. On-line and off-line condition monitoring systems have been widely used for important rotating machinery [16,17,18,19,20]. Vibration signals can be acquired effectively in various industrial fields [21,22,23,24]. The key issue is how to extract the characteristics of the blade crack faults using appropriate signal analysis methods [25].
In this paper, operation condition information is monitored and collected in a timely way based on a condition monitoring and fault diagnosis system for centrifugal booster fans. Firstly, aiming at the problem of energy leak in FFT, amplitude and phase can be accurately estimated by an discrete spectrum interpolation method [26,27]. The short time Fourier transform (STFT) can effectively pick out the non-stationary components in vibration signals [28]. The discrete spectrum interpolation method and STFT are integrated in the testing system. They are used to extract the features of the blade cracks of generator centrifugal booster fans in a certain iron and steel group’s power plants. Finally, for the purpose of quantitative identification and abnormality alarming for blade crack faults, a quantitative identification and abnormality alarm strategy based on compound indexes including the largest Lyapunov exponent (LLE) [29,30] and relative energy ratio at the second harmonic frequency component is proposed in this paper. The proposed method is applied to an accident caused by blade crack faults using historical data. The results demonstrate that this method could quantitatively identify blade cracks in booster fans successfully. In addition, related work on mathematical modelling is also introduced to investigate the effects of mistuning and cracks on the vibration features of centrifugal impellers and to explore effective techniques for crack detection.
The rest of the paper is organized as follows: in Section 2, the fault identification method for thermal generator sets is introduced. In Section 3, a case study via blade crack faults of centrifugal booster fans is presented. In Section 4, a quantitative identification and abnormality alarm strategy for blade crack faults is proposed. In Section 5, mathematical modelling for revealing vibration signal properties is introduced. In Section 6, some conclusions are provided.

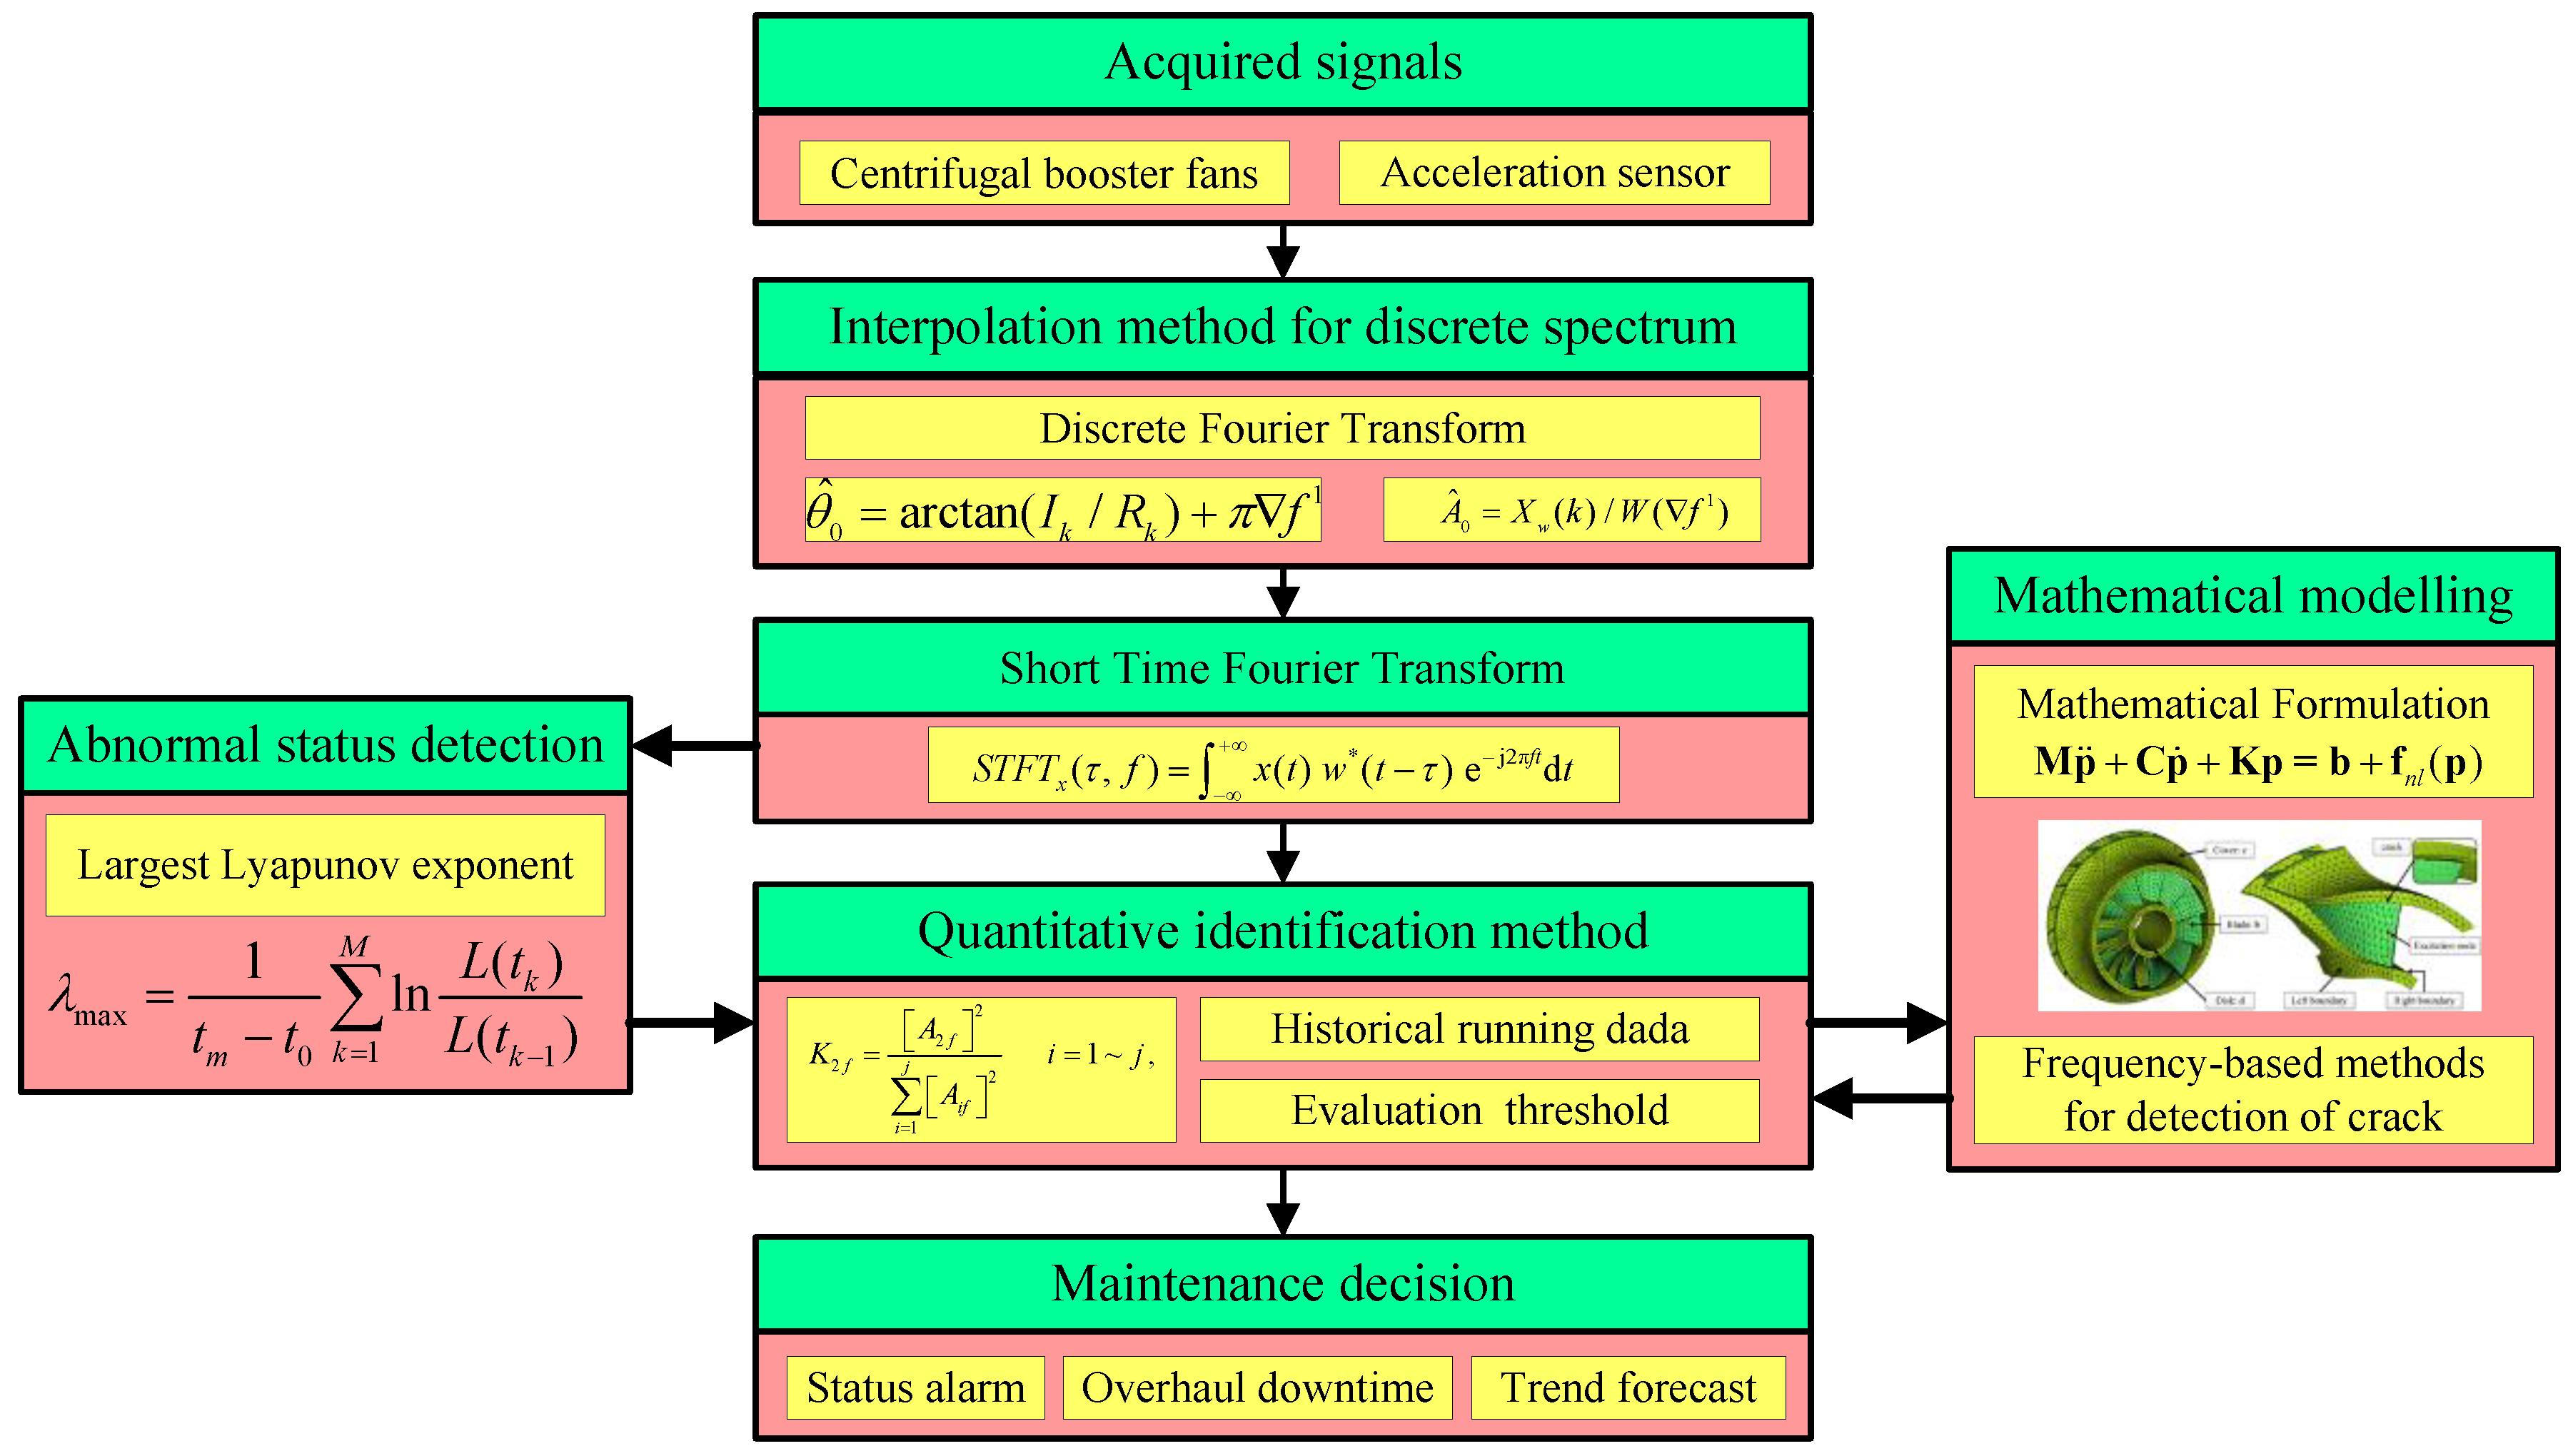
2. Fault Identification Method for Thermal Generator Sets

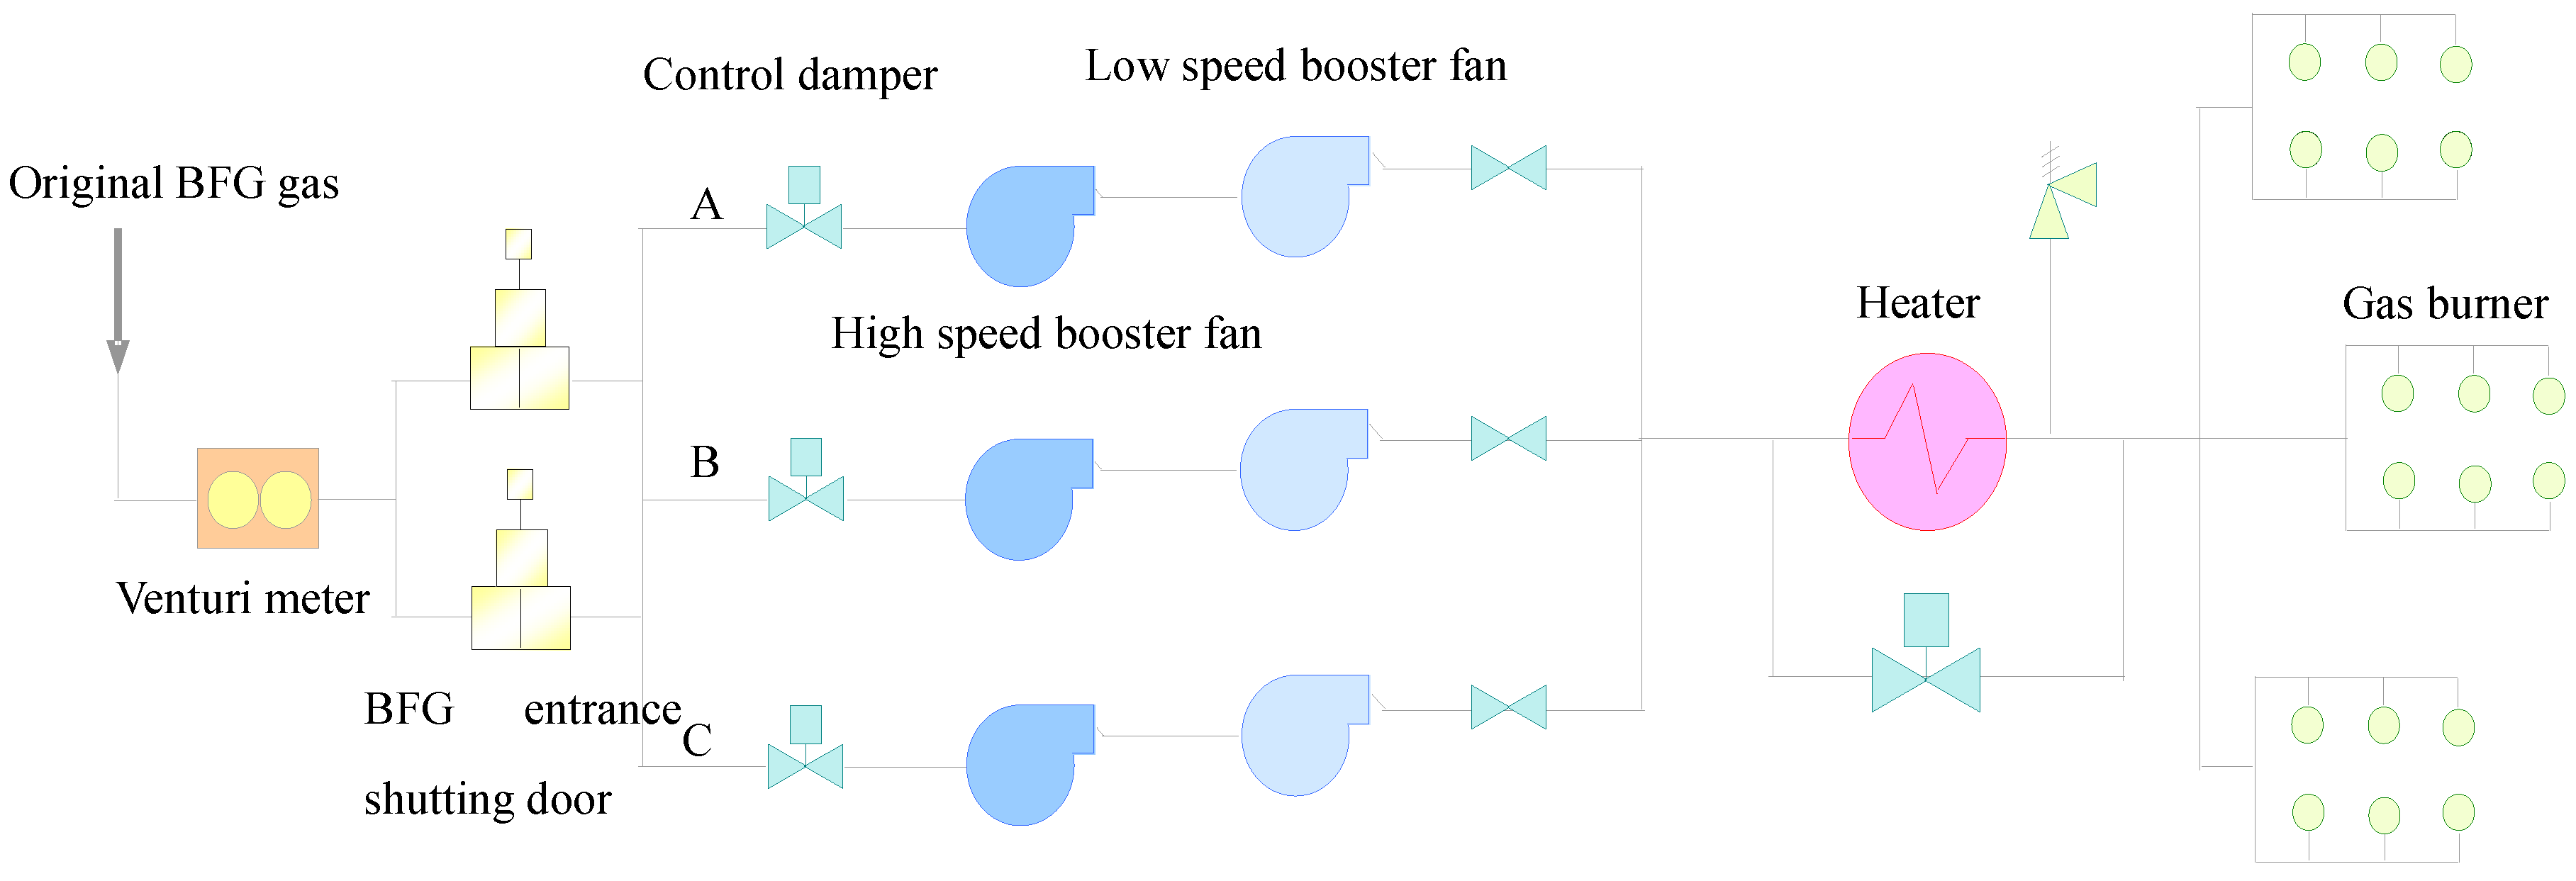
2.1. Centrifugal Booster Fans in Thermal Generator Sets

Blast furnace gas (BFG) is a byproduct of iron-making, whose production in iron-making increases from year to year due to the growth of the iron and steel industry. The blast furnace gas (BFG) is a recyclable energy gas and plays an important role in the energy consumption of iron and steel works. The power station in a steel-making plant would try to generate energy with the BFG. The Unit 4 studied in this work is the first 350 MW unit in the world which fully combusts the BFG. Its combustion ability can reach 1 million m3/h. The structure of the Unit 4 is displayed in Figure 1 [31]. Unit 4 is equipped with three dual-speed BFG booster fans. These fans are of importance and used to pressurize the BFG and make sure it can go into the furnace safely and combust stably. There is a tower-type once-through boiler in this unit, along with 18 compound gas burners that are well-distributed in three tiers. They are arranged separately on the front wall and back wall of the boiler.
The technological process of the BFG recovery unit is as follows:
The original BFG gas from the the Department of Energy and Environment Protection → Venturi meter → BFG entrance shutting door → BFG booster fan entrance control damper → three BFG booster fans → BFG booster fan exit isolation damper → Heater and its bypass → BFG gas burners.
The speed of the booster fans is divided into two levels: 744 r/min and 993 r/min, whose corresponding powers are 730 kW and 1650 kW, respectively.

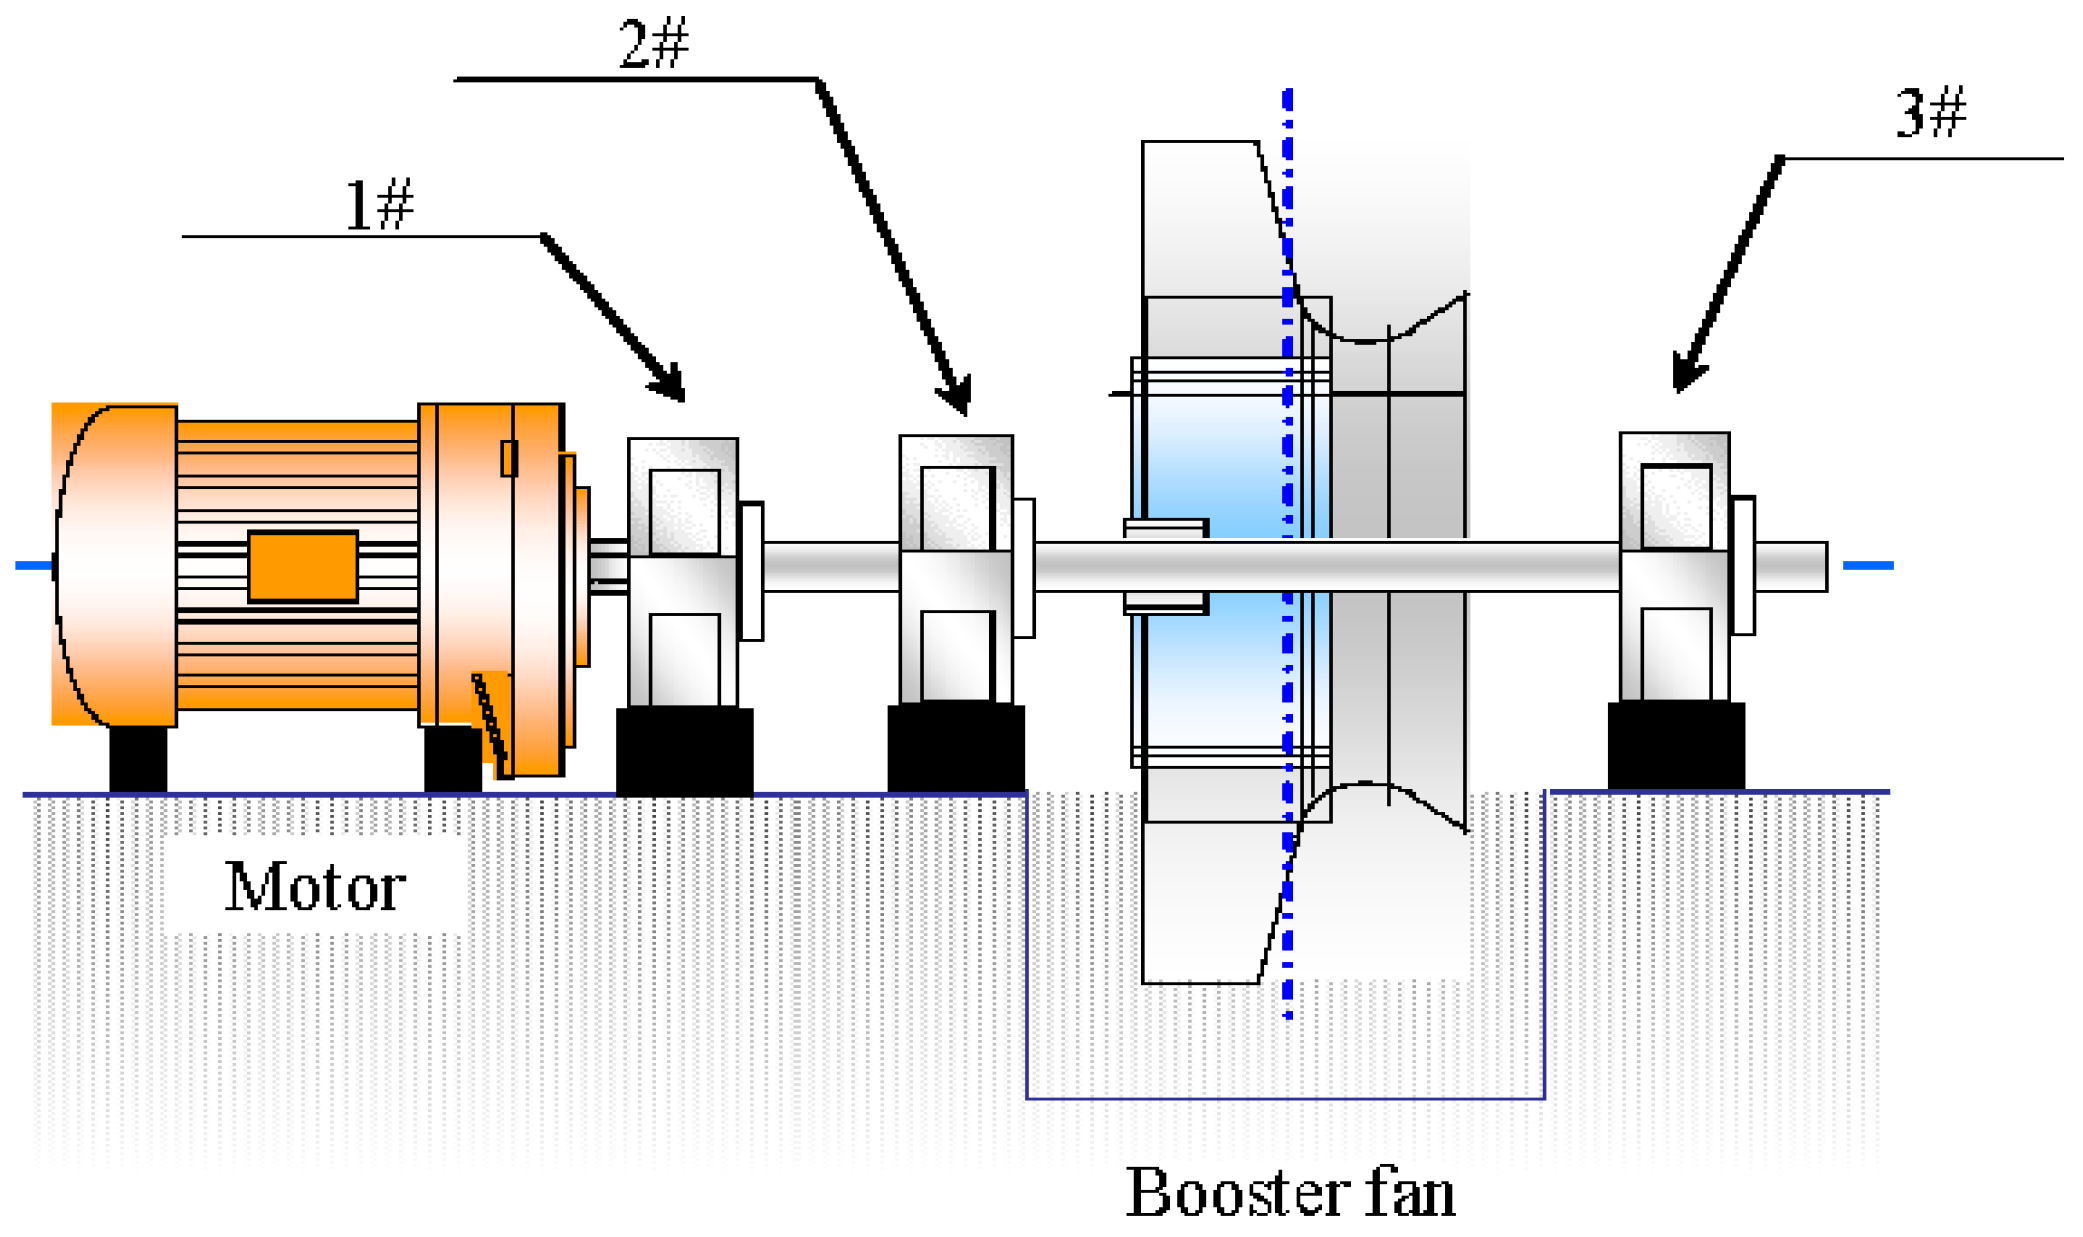
2.2. Condition Data Acquisition Testing Framework

For iron-making, lots of rotating machineries work in the complex process going from iron ore to steel products. The equipment is in long-term use under complex conditions. This may lead to various types of fault and cause huge economy losses. However, the key parts of rotating machinery are not stationary and therefore not easy to change, so it is crucial to carry out effective condition monitoring and fault diagnosis.
For this purpose, a testing system focusing on extracting abnormal condition information from vibration signals is designed. This system works on the data acquisition level and network database level of the testing and diagnosis system in the steel-making plant. Off-line vibration tests are conducted for iron and steel smelting mechanical equipment using portable data acquisition devices such as the CSI2320, Telesens8823, SONY-EX and so on. These devices can selectively implement hardware integration for acquired signals to save the data.
The feature information can be extracted from the vibrations by means of traditional spectrum analysis, characteristic spectrum analysis and special feature extraction modules in the testing system. The change trends of these features can be used to judge the working condition of the equipment and the appearance of incipient faults. The software interface of the testing system is implemented based on Labview 7.0. The testing system is programmed with a mixture of Labview and Visual Studio routines with consideration to execution efficiency. In addition, SQL Server is introduced as the extended interface to access the internal database. Moreover, simple tips about the main functions are available in a help module. The system also has other functions such as saving results, report generation, etc. The whole work flow diagram of the quantitative identification research framework is displayed in Figure 2.

2.3. Fault Feature Extraction Method

2.3.1. Discrete Spectrum Interpolation Method

The rotating frequency and its harmonic components can reflect the fault features concerning misalignment, rub-impact, and dynamic unbalance. These features are usually extracted from the frequency spectrum. However, the FFT and spectrum analysis would cause energy leakage owing to time domain truncation and the interference of noise [26,27]. This may lead to great errors in the frequency, amplitude and phase in the FFT and spectrum analysis. In order to improve the accuracy, a discrete spectrum interpolation method is adopted.
Let x(t) be a harmonic signal sequence with frequency f0, amplitude A0 and phase θ0. Suppose the amplitude and phase first calculated by a Discrete Fourier Transform (DFT) and then corrected by the interpolation method are:
A ^ 0 = X w ( k ) / W ( f 1 )
θ ^ 0 = arctan ( I k / R k ) + π f 1
where X w ( k ) means the kth line of the harmonic signal, i.e., the maximum value of the main lobe. W(∇f1) expresses the frequency spectrum for a rectangular window with the value W(∇f1) = sin(πf1)/ (πf1). Rk and Ik represent the real and imaginary parts of DFT, respectively. When rotating frequency is input, the system would correct the amplitude and phase of the rotating frequency and search for the accurate amplitude and phase of its harmonic components automatically.

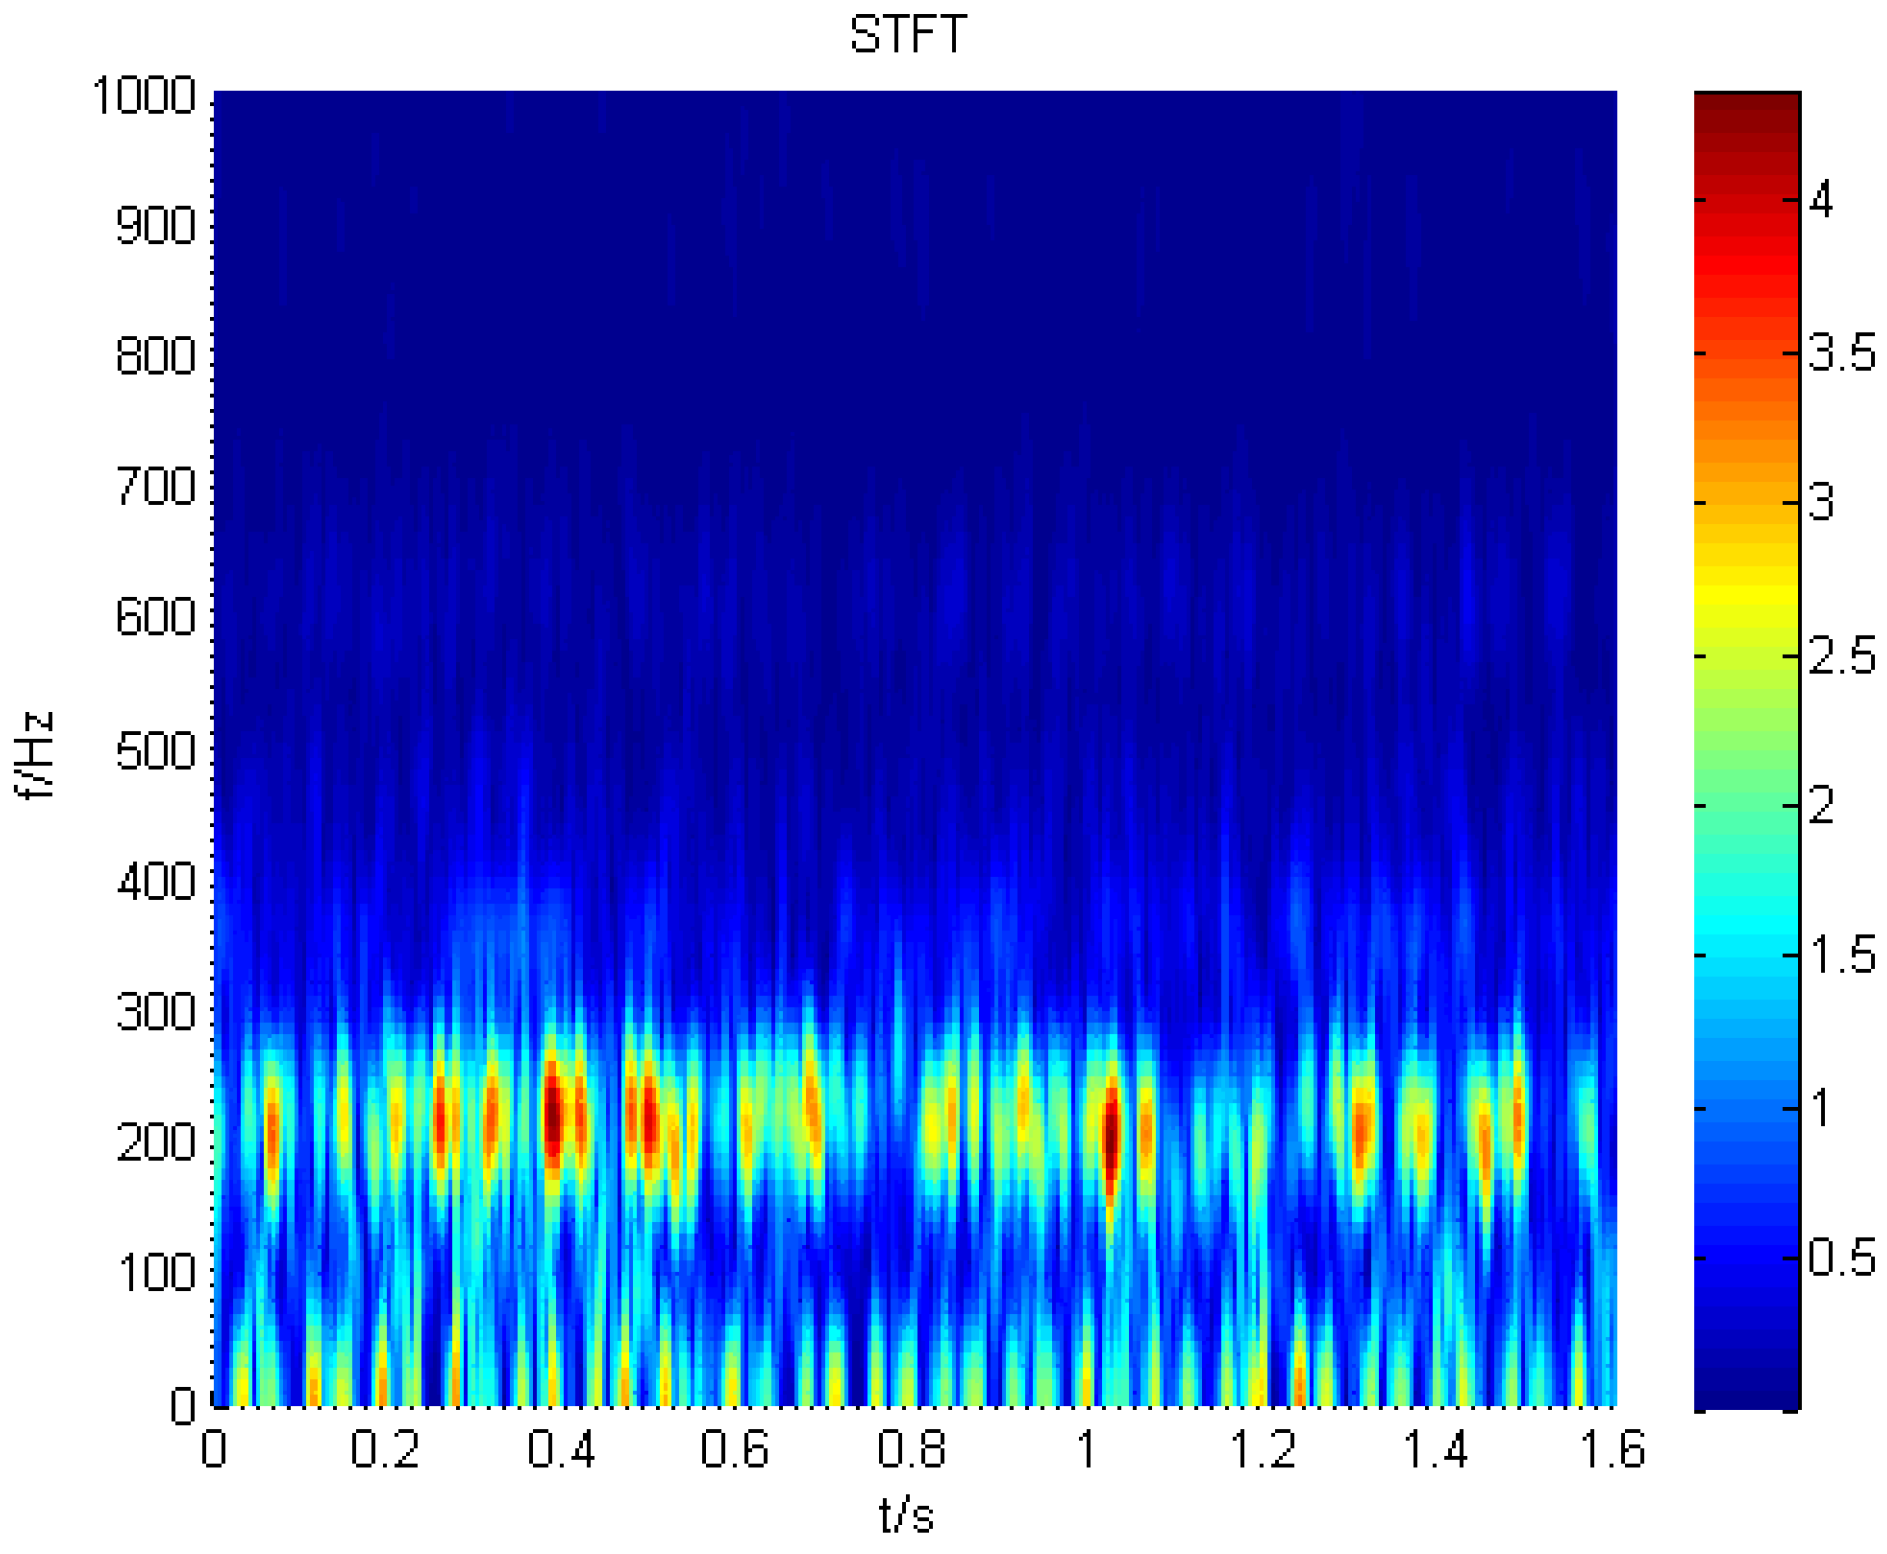
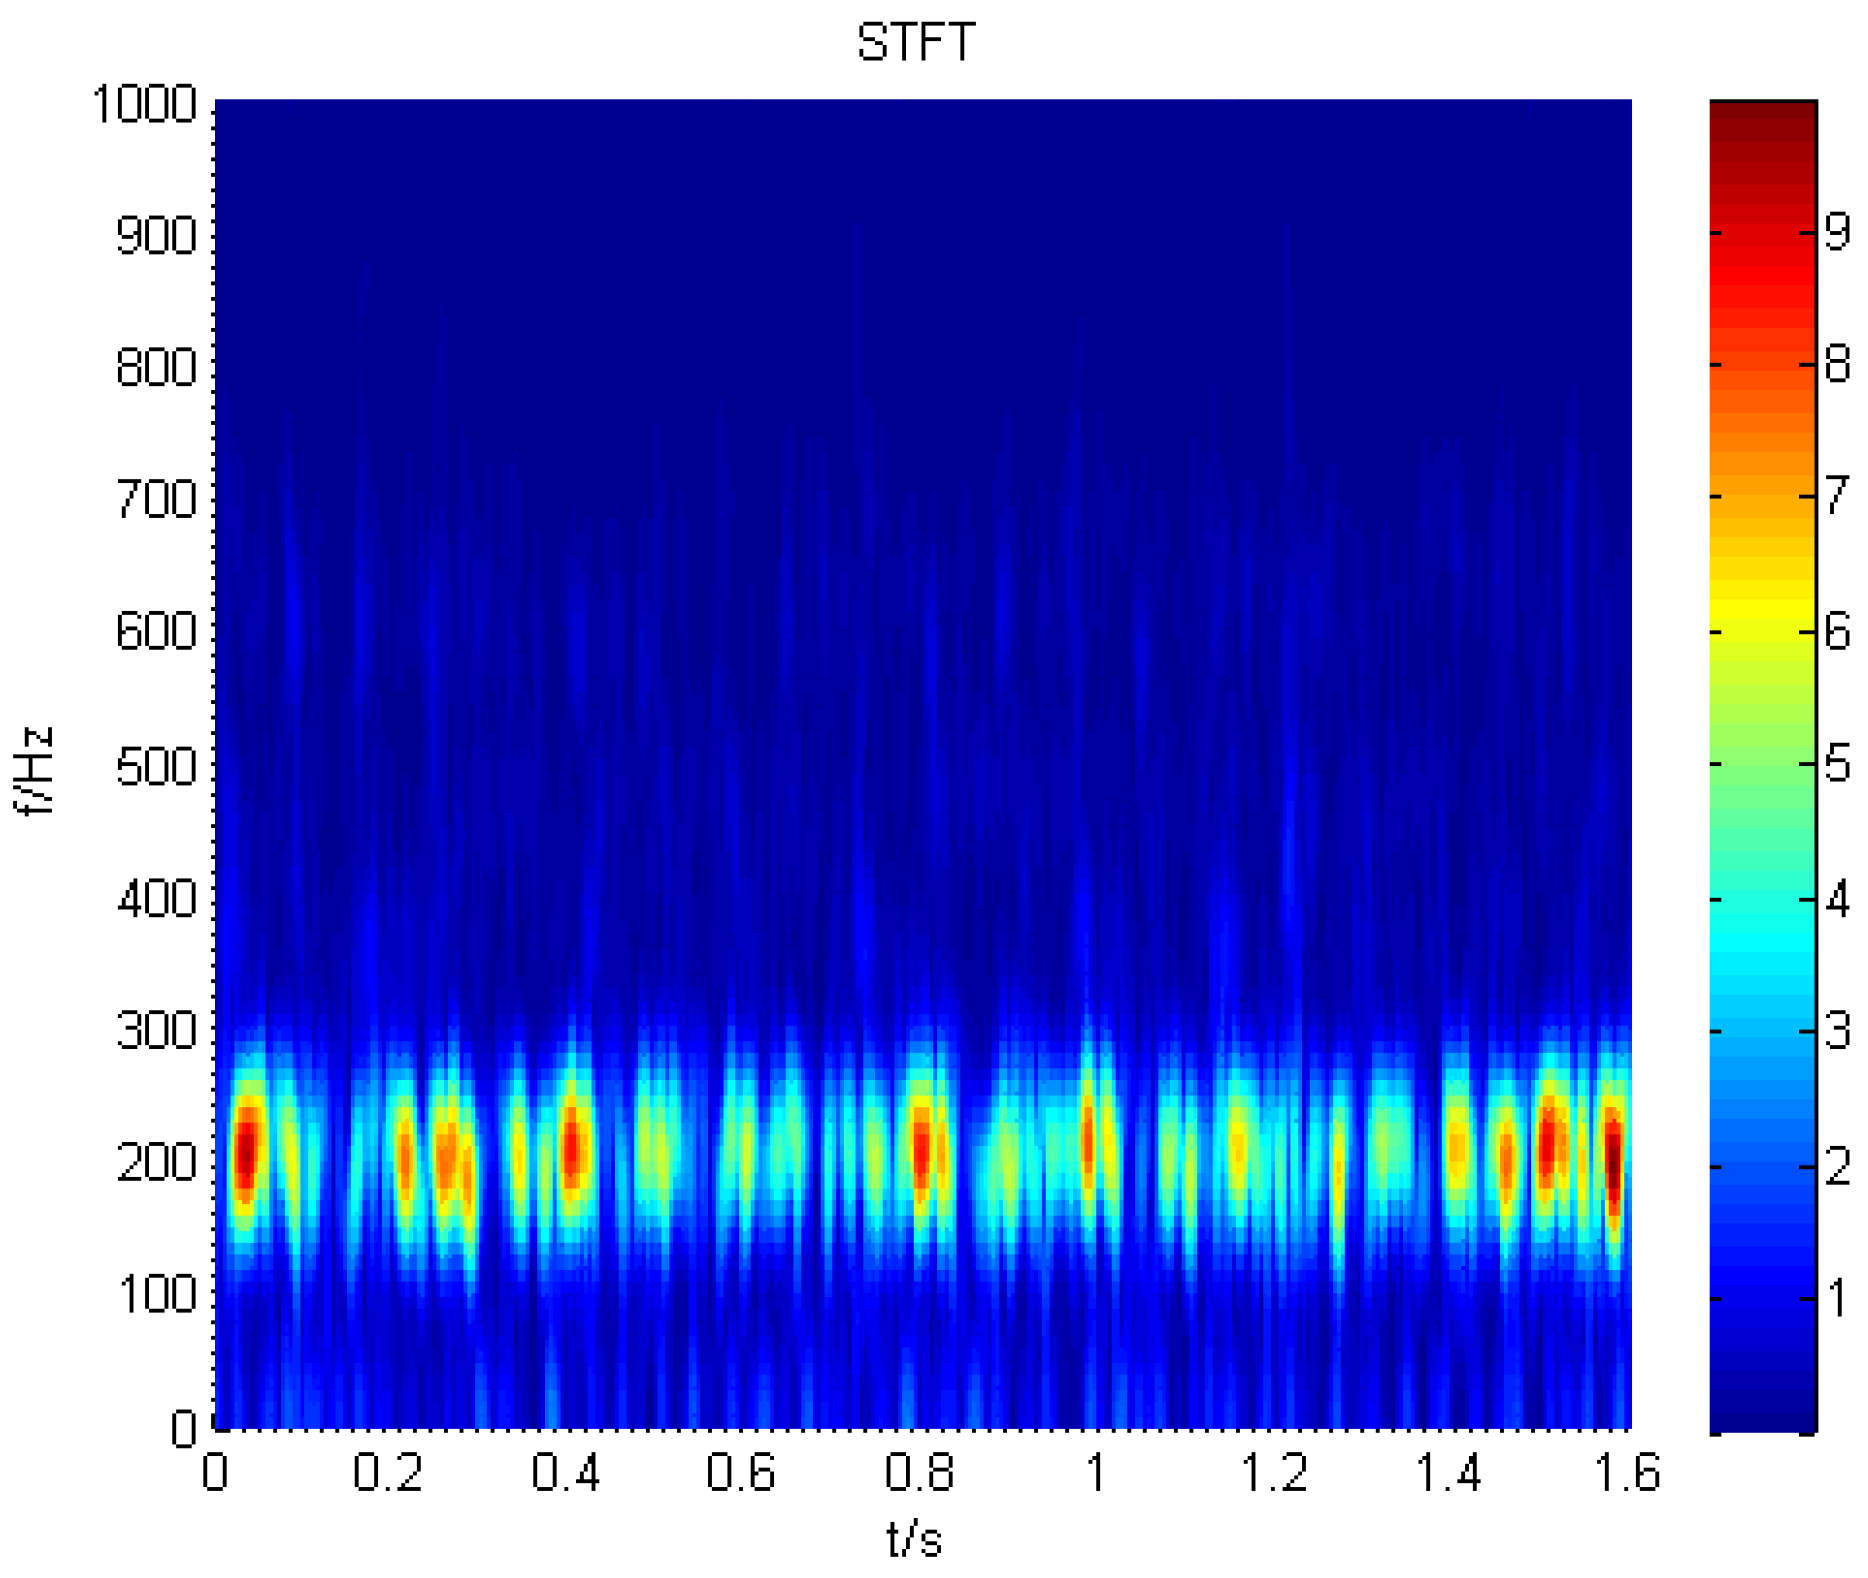
2.3.2. Short Time Fourier Transform

Blade crack fault diagnosis is a problem that troubles scholars and engineers at home and abroad. Online and offline condition monitoring systems are widely used in rotating machinery. The key problem is how to choose the method to process the signal from the industrial field and obtain the fault characteristics. The short-time Fourier transform (STFT) is one of the earliest and the most basic methods used for time-frequency analysis [28]. The STFT is one of the most widely used algorithms in signal processing and fault diagnosis based on a detailed Fourier transform centered at each time point. In STFT, the signal is compared with window functions that are concentrated in both the time and frequency domains. The STFT algorithm and the window function can be mathematically represented as follows:
S T F T x ( τ ,   f ) = + x ( t )   w * ( t τ )   e j 2 π f t d t = + x ( t ) [ w ( t τ ) e j    2 π f t ]   d t = x ( t ) ,     w ( t τ ) e j    2 π f t
where, w(t) is the window function which has a user defined time duration; and x(t) is the waveform signal in the time domain.

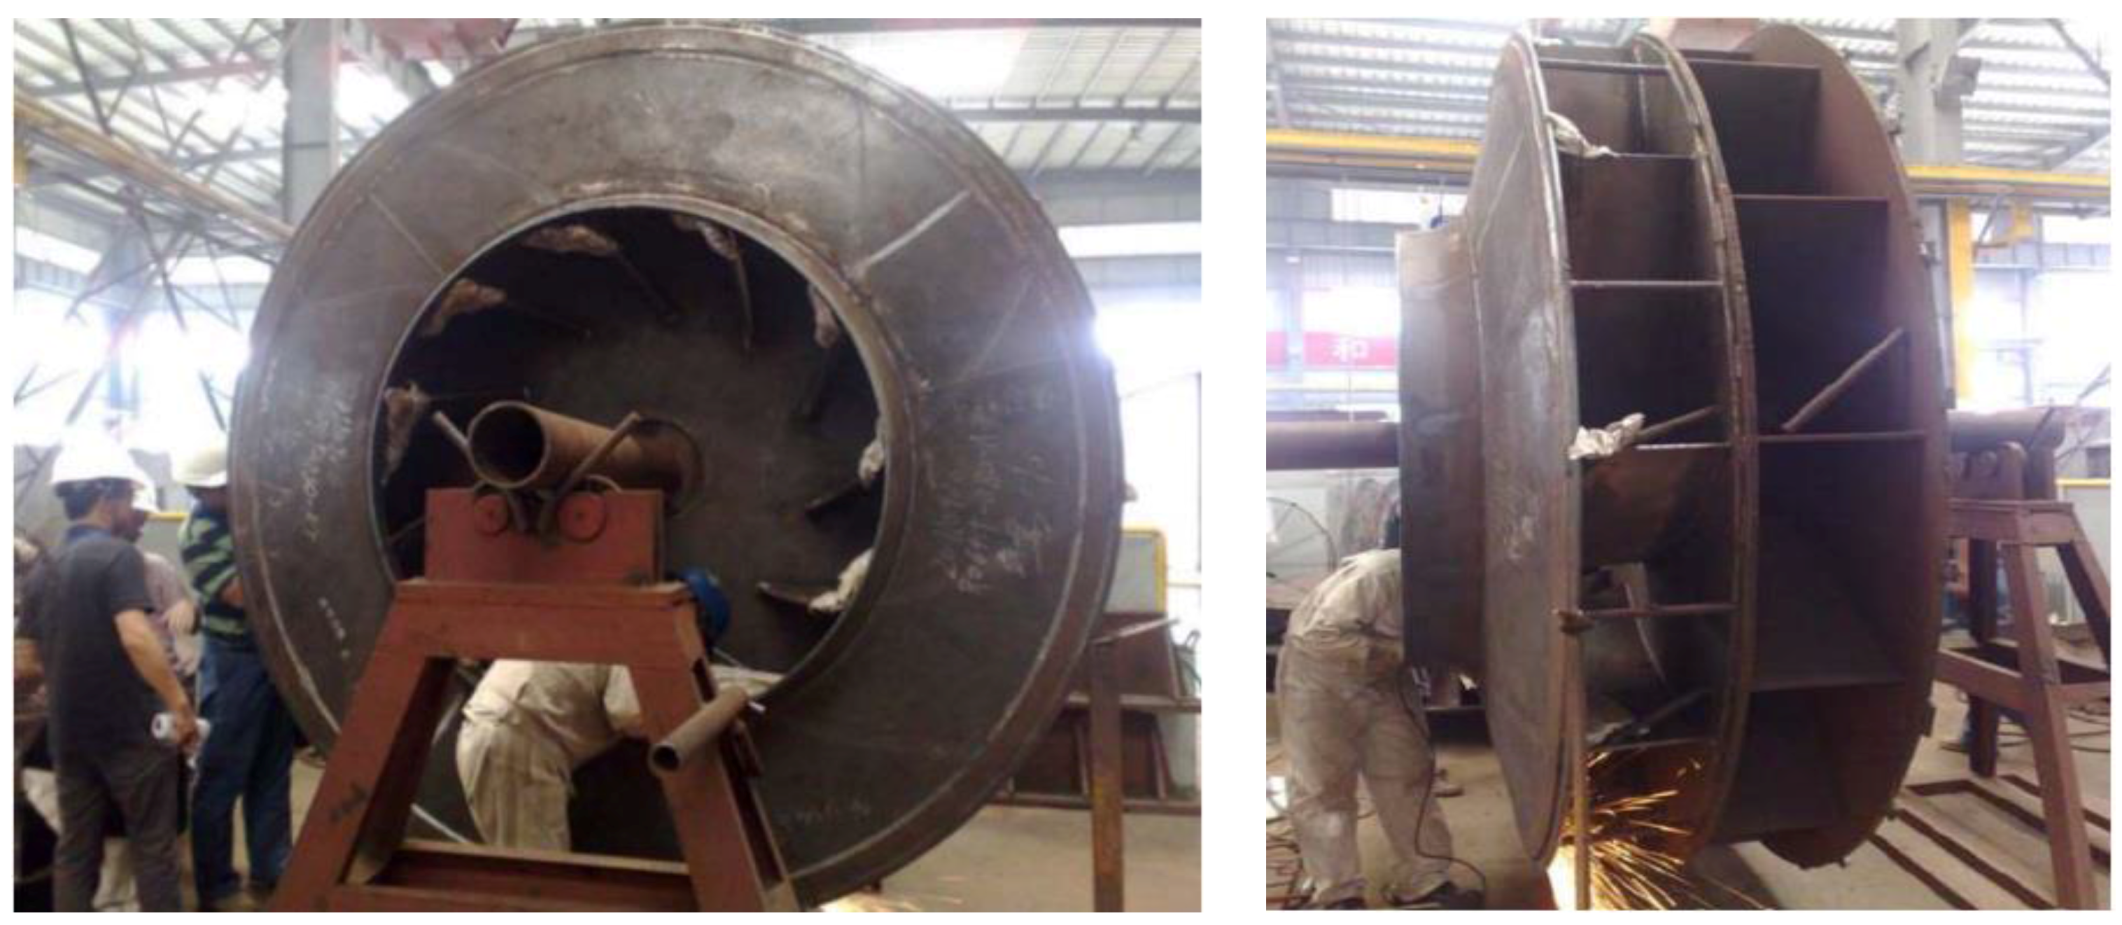
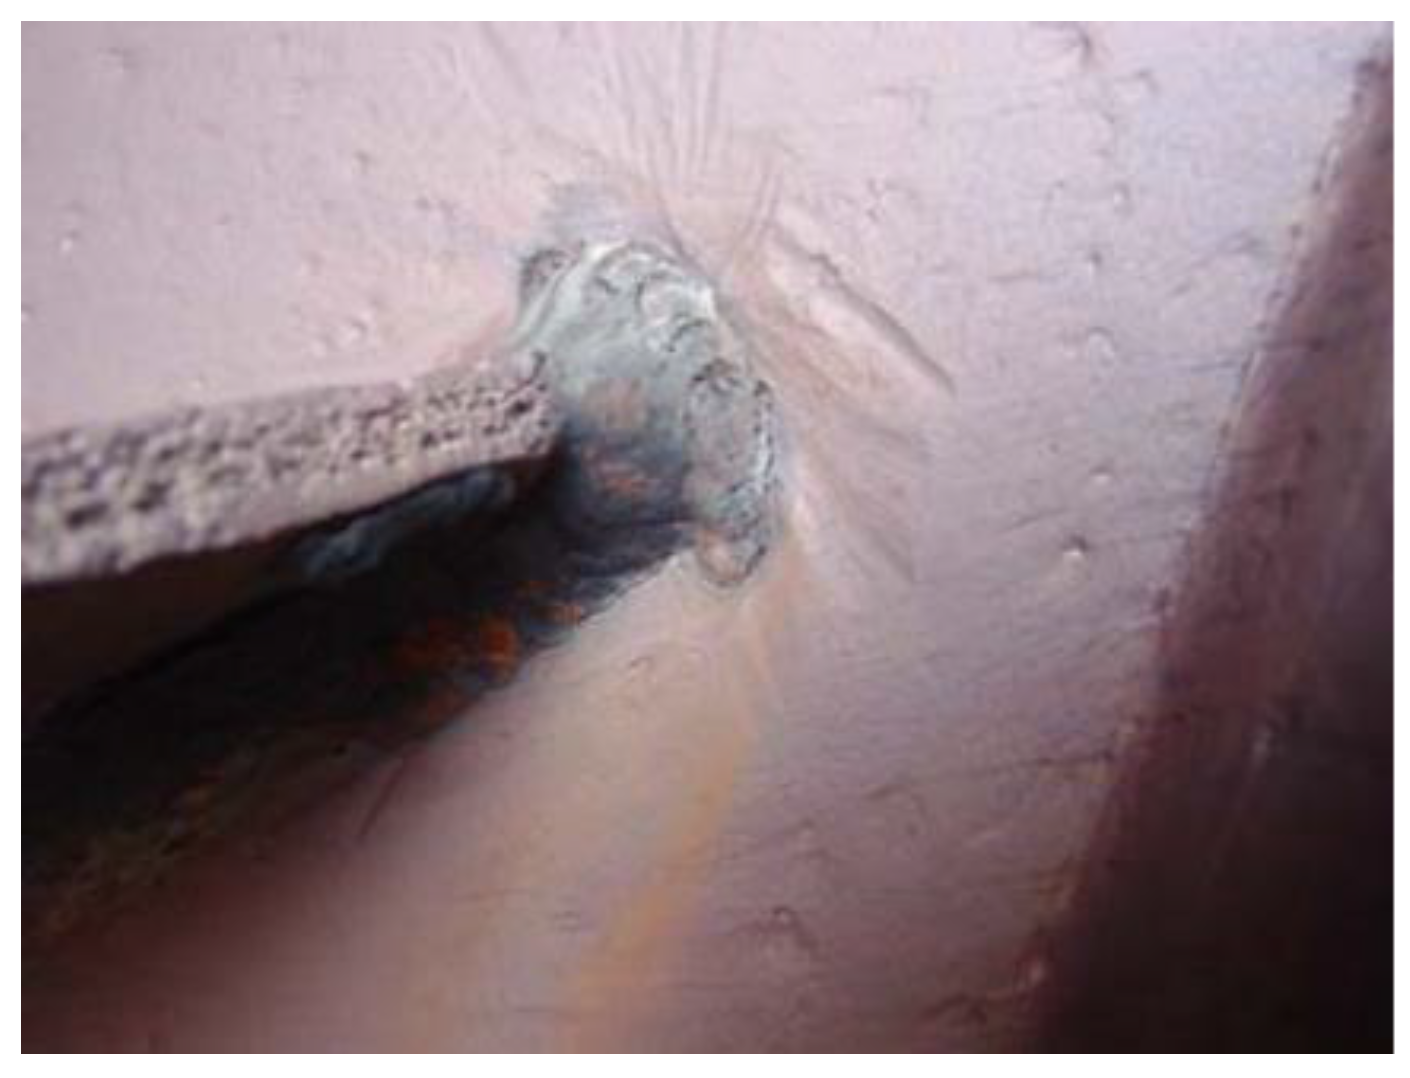
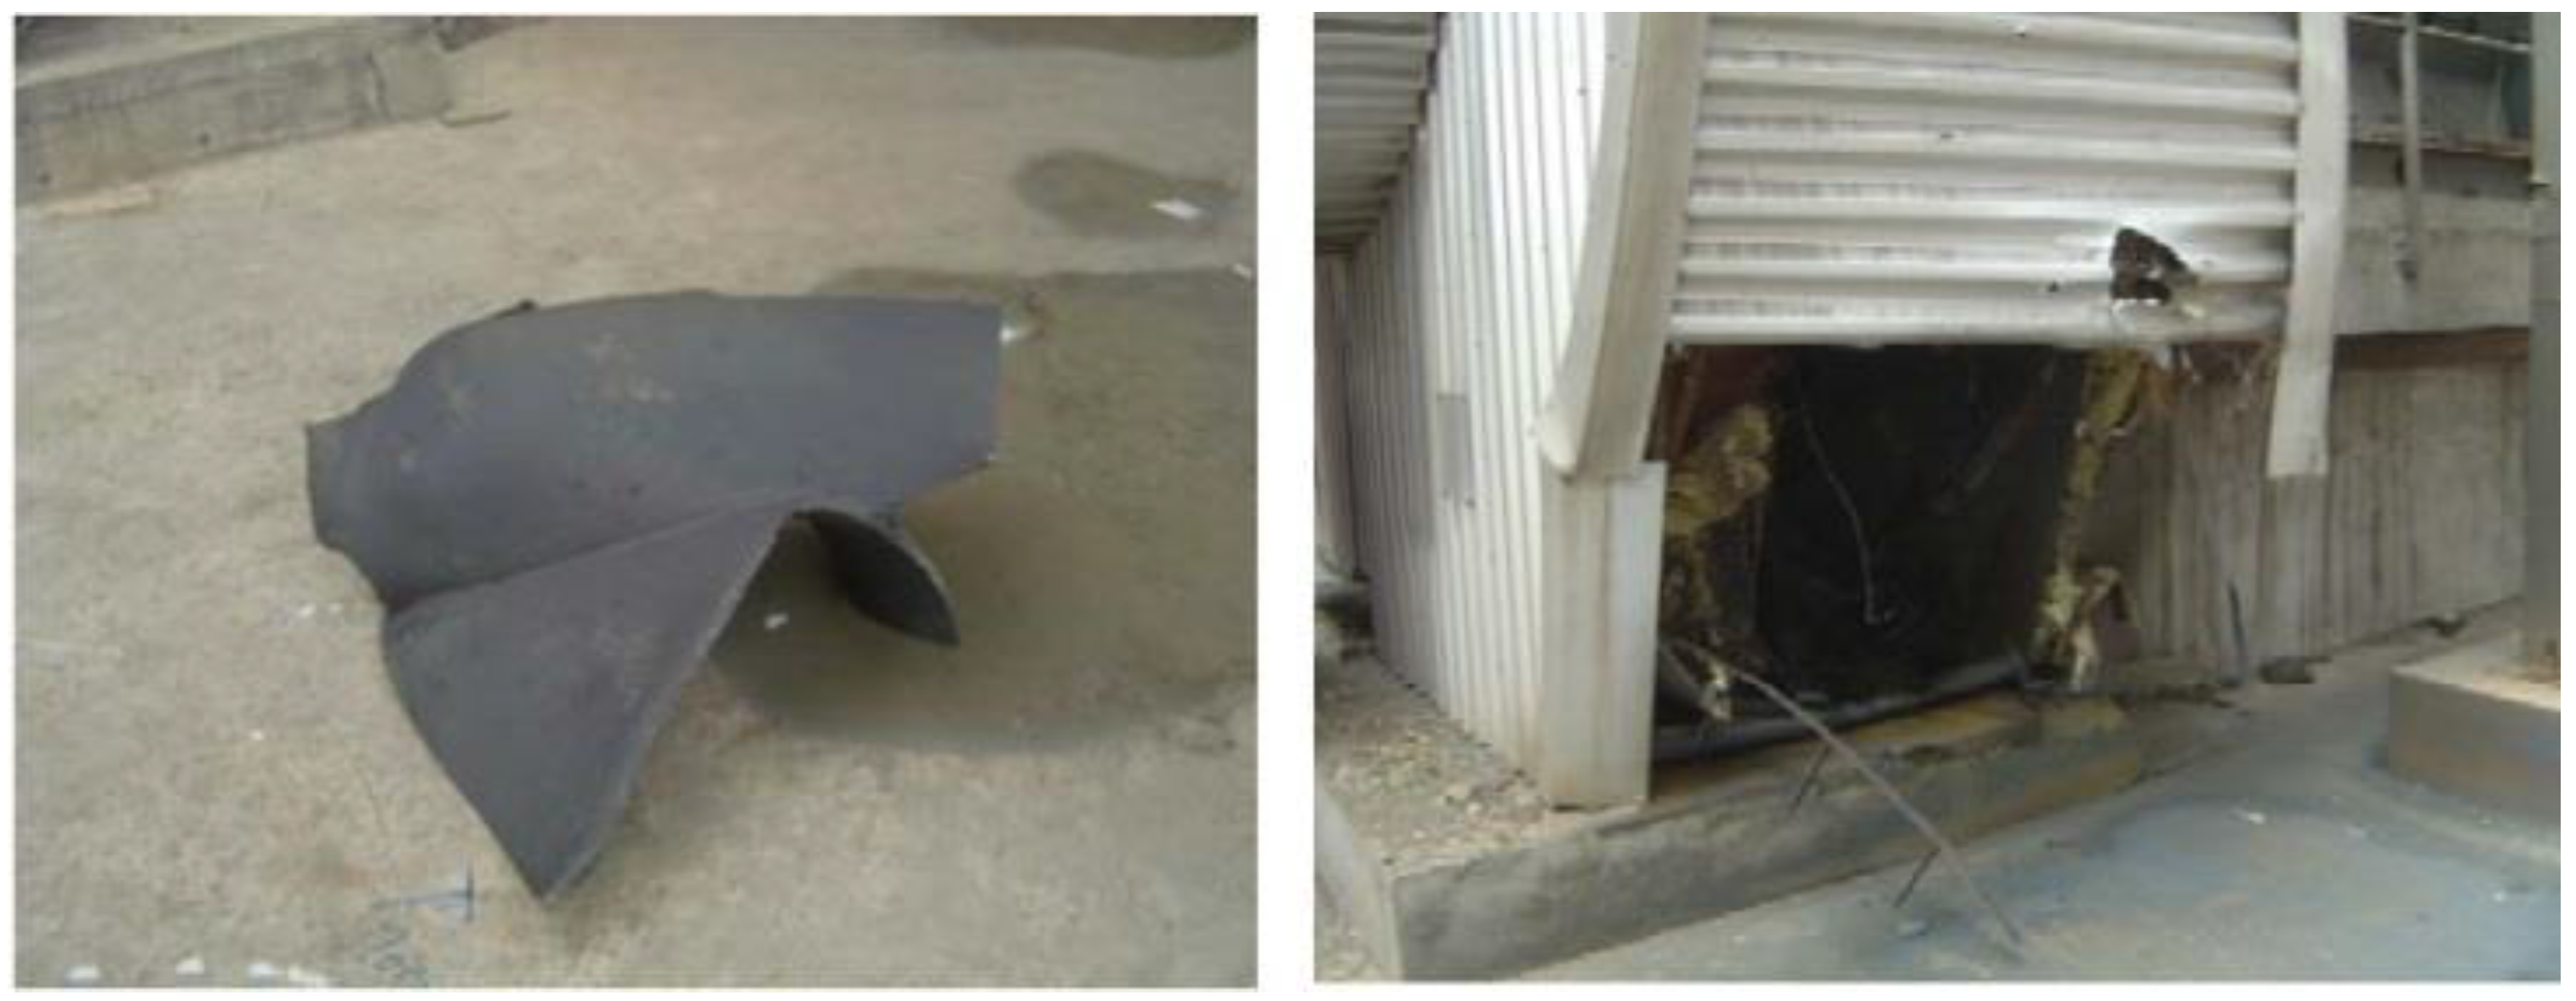
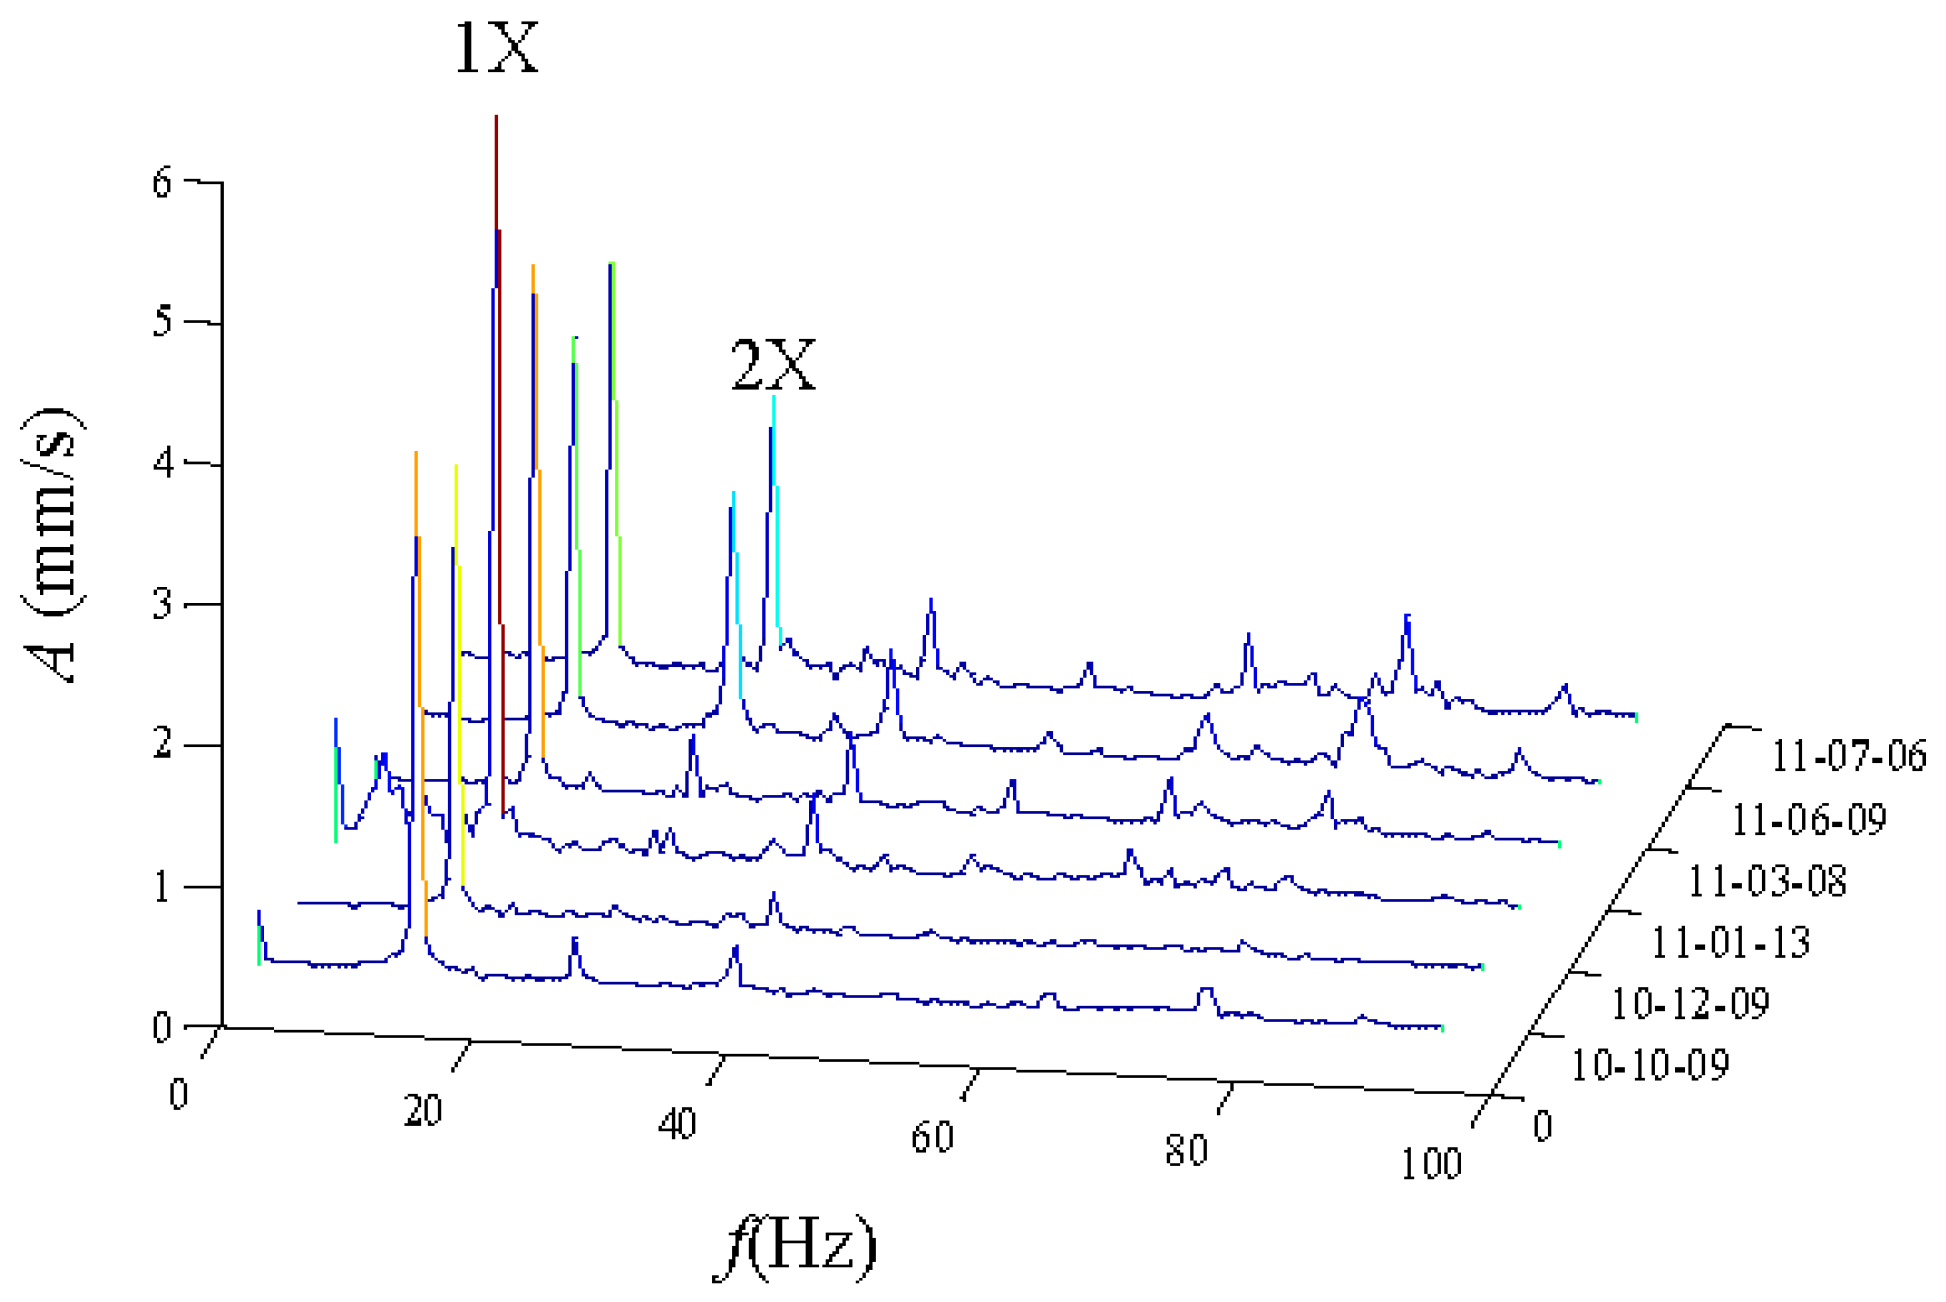
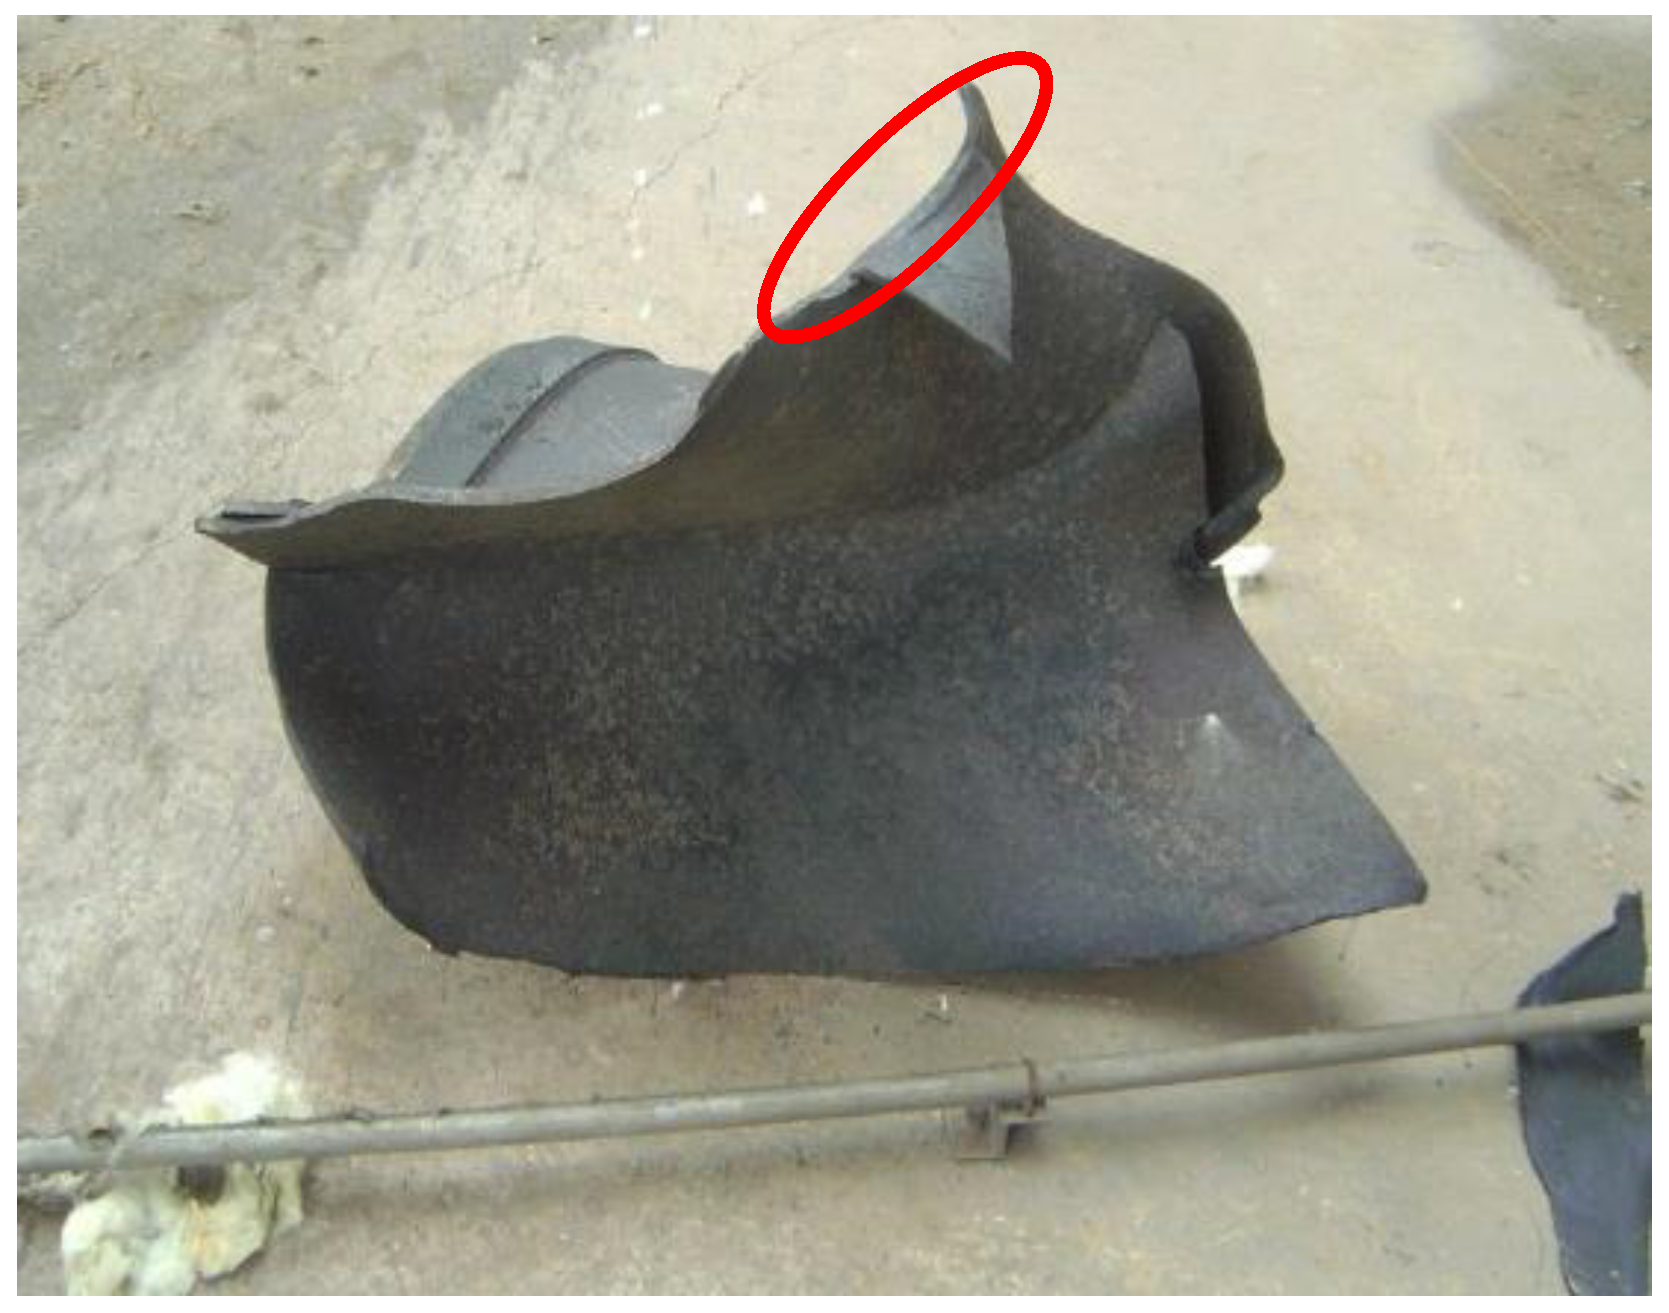
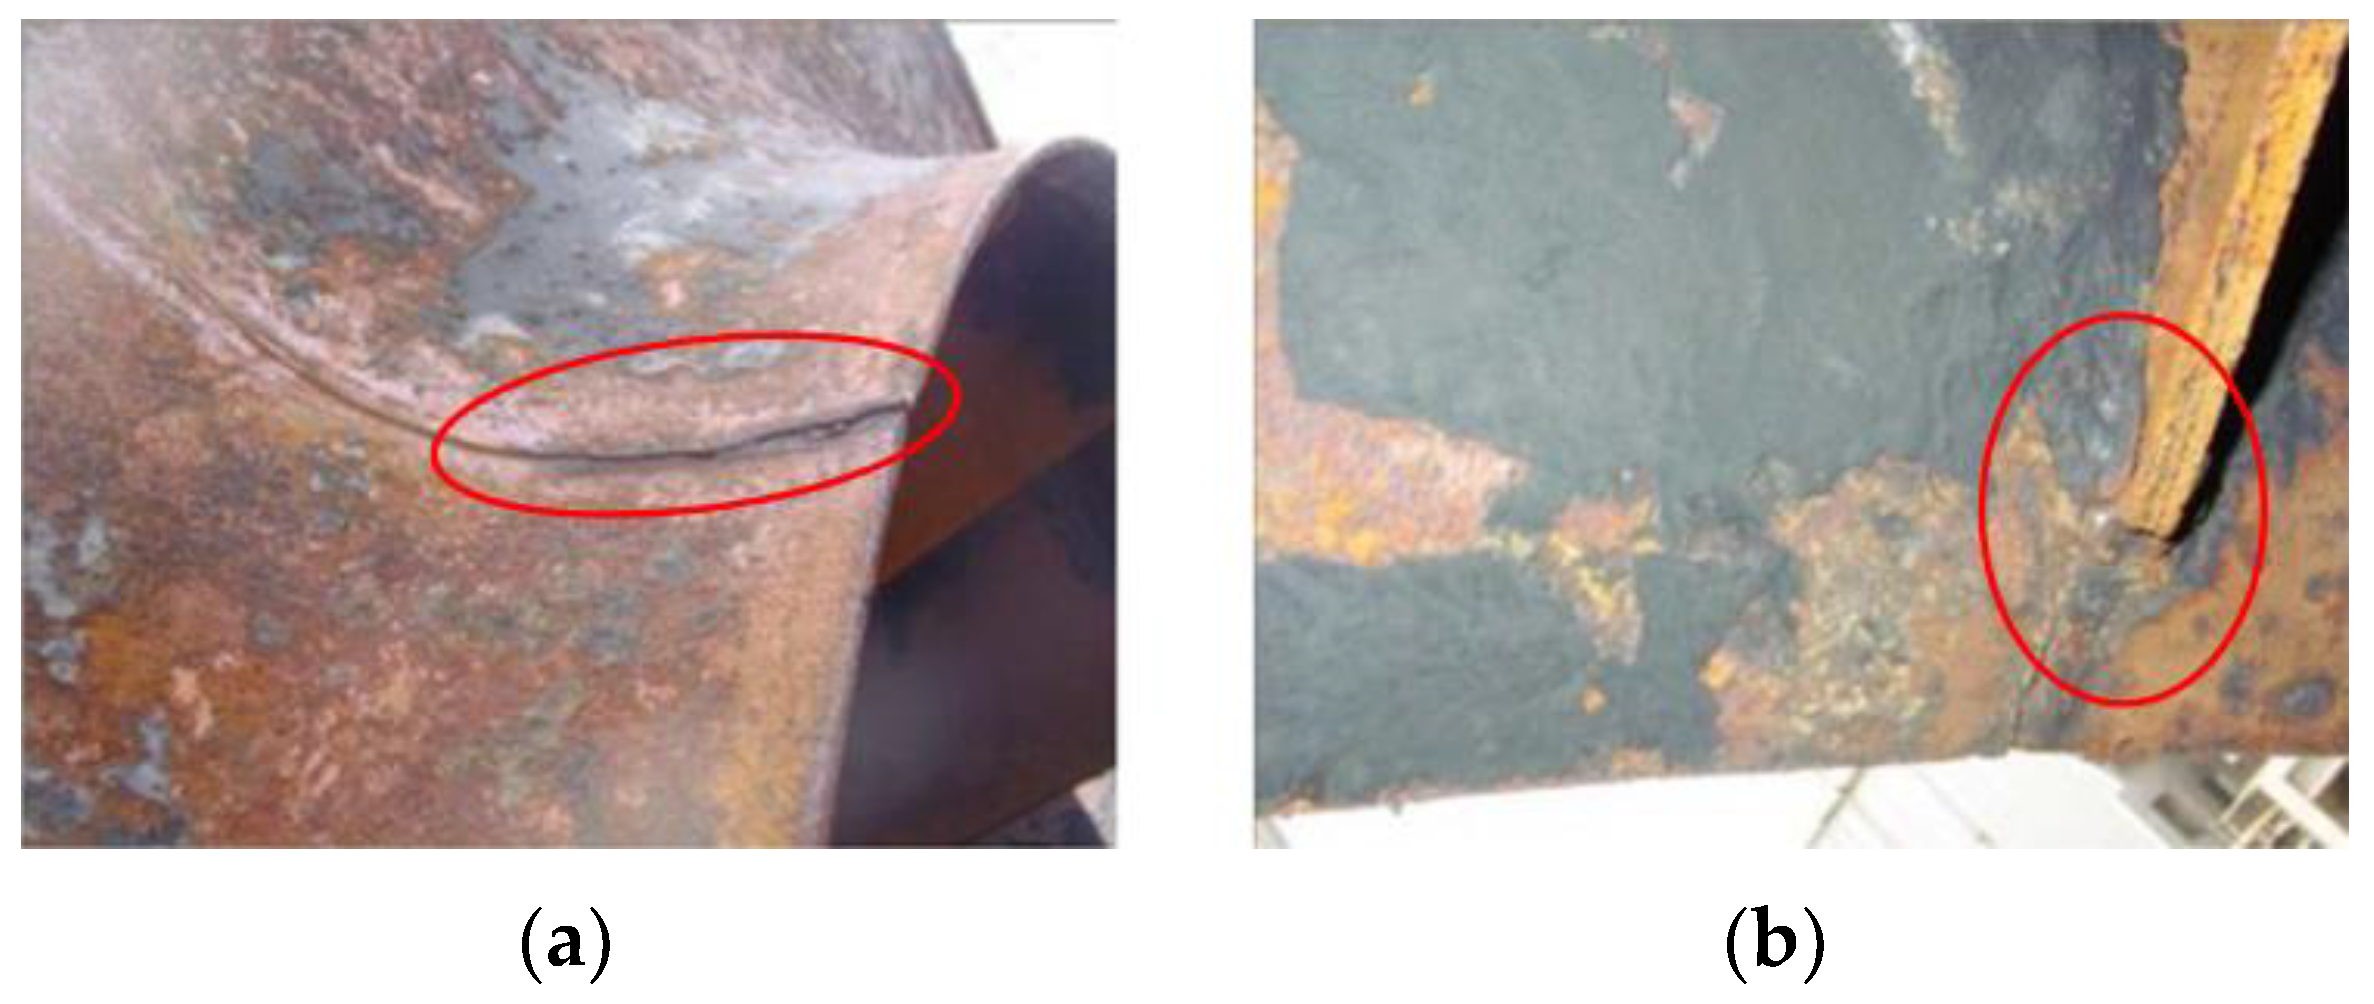
3. Case Study via Blade Crack Fault of a Centrifugal Booster Fan

Unit 4 in a power station composed of three imported fans. As shown in Figure 3 [24,31,32], the rotor blades in No. A fan are welded on the entrance control damper. The three fans performed well since they were first used in production, and had never been overhauled before. On 20 July 2011, the rotor broke apart during the process of switching from low speed to high speed. Pieces of the blades flew out of the volute. Figures from the scene are shown in Figure 4 [24,31,32]. The bearing box in the drive end and the coupling are crushed. Besides, the main shaft is seriously deformed. By analysis of the causes that produced the accident, we find that there were blade cracks in the booster fans.
In order to extract the vibration characteristics during crack growth and gain experience for condition monitoring on the same type of unit, the testing system as described before is used to analyze the historical data. From 4 August 2010 to 6 July 2011 (nearly a year before the accident), data acquisition of the two bearings, which support the rotor, was carried out by the industry technological service company at the sampling frequency of 2560 Hz with the length of 4096, ten times, including low speed (744 r/min) and high speed (993 r/min). Three groups of sensors are used, as shown in Figure 5.
Two sensors are mounted on the two bearings. The vibration data from the horizontal, vertical and radial directions are obtained in each sensor. In addition, a sensor is mounted on the motor. The data from the vertical direction is obtained there. The details about the running status data acquisition are shown in Table 1, where D means low speed, Dh means high speed and GE means the amplitude of the envelope in g. A means radial direction, H indicates horizontal direction and V is the vertical direction.
The vibration data from the drive end in the horizontal direction is chosen for analysis. We can see that there is no a distinctive trend that would allow identifying crack faults. The waterfall plot based on FFT of No. 2H sensor data from 0 to 100 Hz is displayed in Figure 6 [23,24]. We can clearly observe the rotating frequency and its harmonic components. As time goes by, the amplitude of the rotating frequency increases first and then drops. However, the amplitude of the second harmonic drops first and then increases. From the point of view of the dynamics, the cracks close and open twice in one cycle of the rotation. The amplitude of the vibration response signal changes twice due to the change of the rotor stiffness from large to small, so the characteristics of the amplitude increase in the second harmonic could be used to indicate a blade crack.
In order to obtain more accurate amplitude and phase data of the rotating frequency and the second harmonic component, a discrete spectrum interpolation method is used to analyze the signals of the No. 2 and No. 3 sensors in the horizontal direction. The result after correction is shown in Figure 7 [23,24]. As shown in Figure 7, the amplitude of the rotating frequency first increased and then decreased. The amplitude of the second harmonic component increases constantly. A breathing crack is considered to appear from January to March in 2011 according to the results. The rotor stiffness changes twice in every rotating cycle. This leads to the increase of the amplitude of the second harmonic component.
For the purpose of extracting the non-stationary characteristics of the cracked rotor, STFT is employed to process the signal of the normal and cracked rotor. The result is displayed in Figure 8. From the figure, we can find a component that is obviously equal to the rotation frequency of the fan, which is 12.5 Hz. When cracks appear, there is a discontinuous line at the frequency of the second harmonic, which fluctuates at the rotating frequency and its second harmonic, as shown in Figure 9.
The photo of the cracked rotor on the A fan is displayed in Figure 10. In this section, two methods are applied to analyze the blade crack fault. The vibration characteristics of the crack blade are extracted. This can help to improve the qualitative diagnosis performance for blade cracks, but the detection of crack damage based on the vibration signals is still less studied, and especially aquantitative identification method for scheduling reasonable maintenance plans is lacking.

4. Quantitative Identification and Abnormality Alarm Strategy for Blade Crack Faults

4.1. The Proposed Quantitative Identification Method

Both Sun and Chen have attempted to propose a quantitative identification index for blade crack identification and have obtained certain achievements [24,31], but a more comprehensive abnormality alarm strategy via a quantitative identification index should be proposed to indicate the unbalancedness and implement necessary condition-based maintenance, so a quantitative identification method based on compound indexes including a traditional index and new index is developed in this section.

4.1.1. Largest Lyapunov Exponent Algorithm

Lyapunov exponents, which measure the exponential rates of divergence or convergence of nearby trajectories in state space, are generally calculated to characterize chaotic processes. If the largest value in the spectrum of Lyapunov exponents is positive, it means that the system is chaotic. The largest value equal to zero indicates periodic or quasi-periodic dynamics. If all Lyapunov exponents are negative then the stable critical point is an attractor [29,30]. Among all the Lyapunov exponents, the Largest Lyapunov Exponent (LLE) has aroused considerable interest for its significant practical applications. The LLE has been applied to many fields for its notable capabilities. In this paper, the LLE is calculated as an indicator of the chaotic behavior of the load demand by using Wolf’s algorithm, which is given as [29,30]:
λ max = 1 t m t 0 k = 1 M ln L ( t k ) L ( t k 1 )
where L’(tk) and L’(tk–1) mean the Euclidean distances computed between the nearest neighboring points on the different trajectories of the attractor at the tk and tk–1 time steps, respectively [29]. m indicates the number of replacement steps or iteration number. Details on the calculation parameter selection are given in [29,30]. The negative value of LLE indicates normal condition and a positive value of LLE indicates non-linear conditions, then the value of LLE can be used to initially identify the mechanical system state. According to the principle of the LLE algorithm, the LLE value of condition data from the No. 2H sensor is computed and displayed in Figure 11. We can observe that the non-linear condition appears after 9 December 2010. In addition, we still need a quantitative identification index to confirm the degree of crack fault.

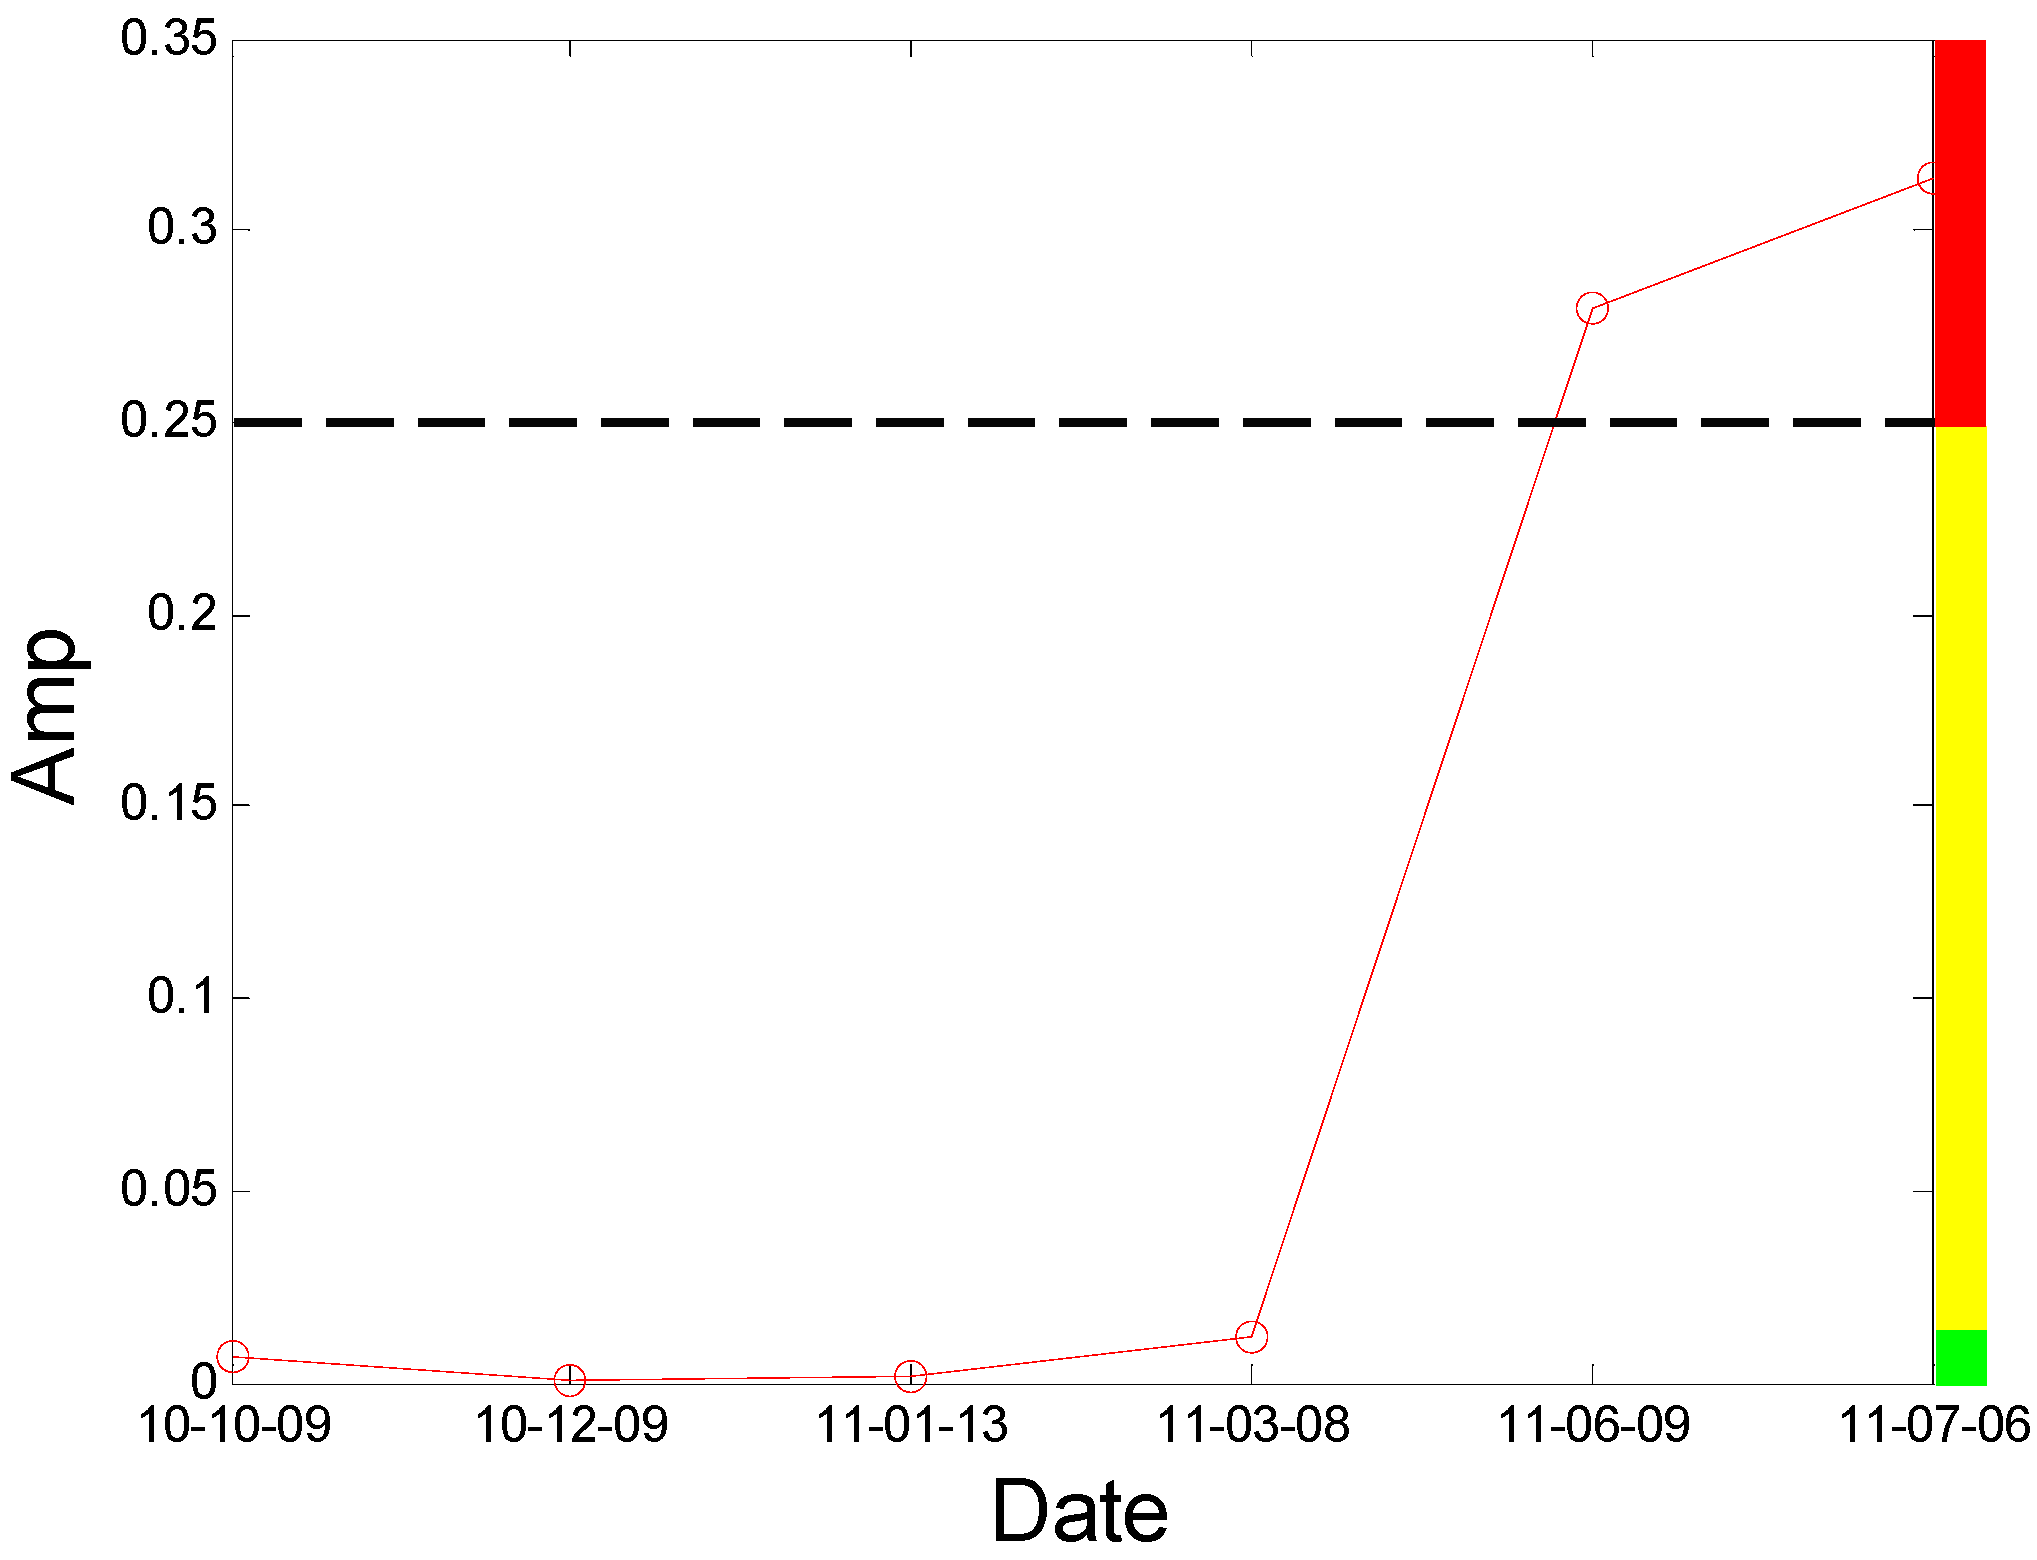
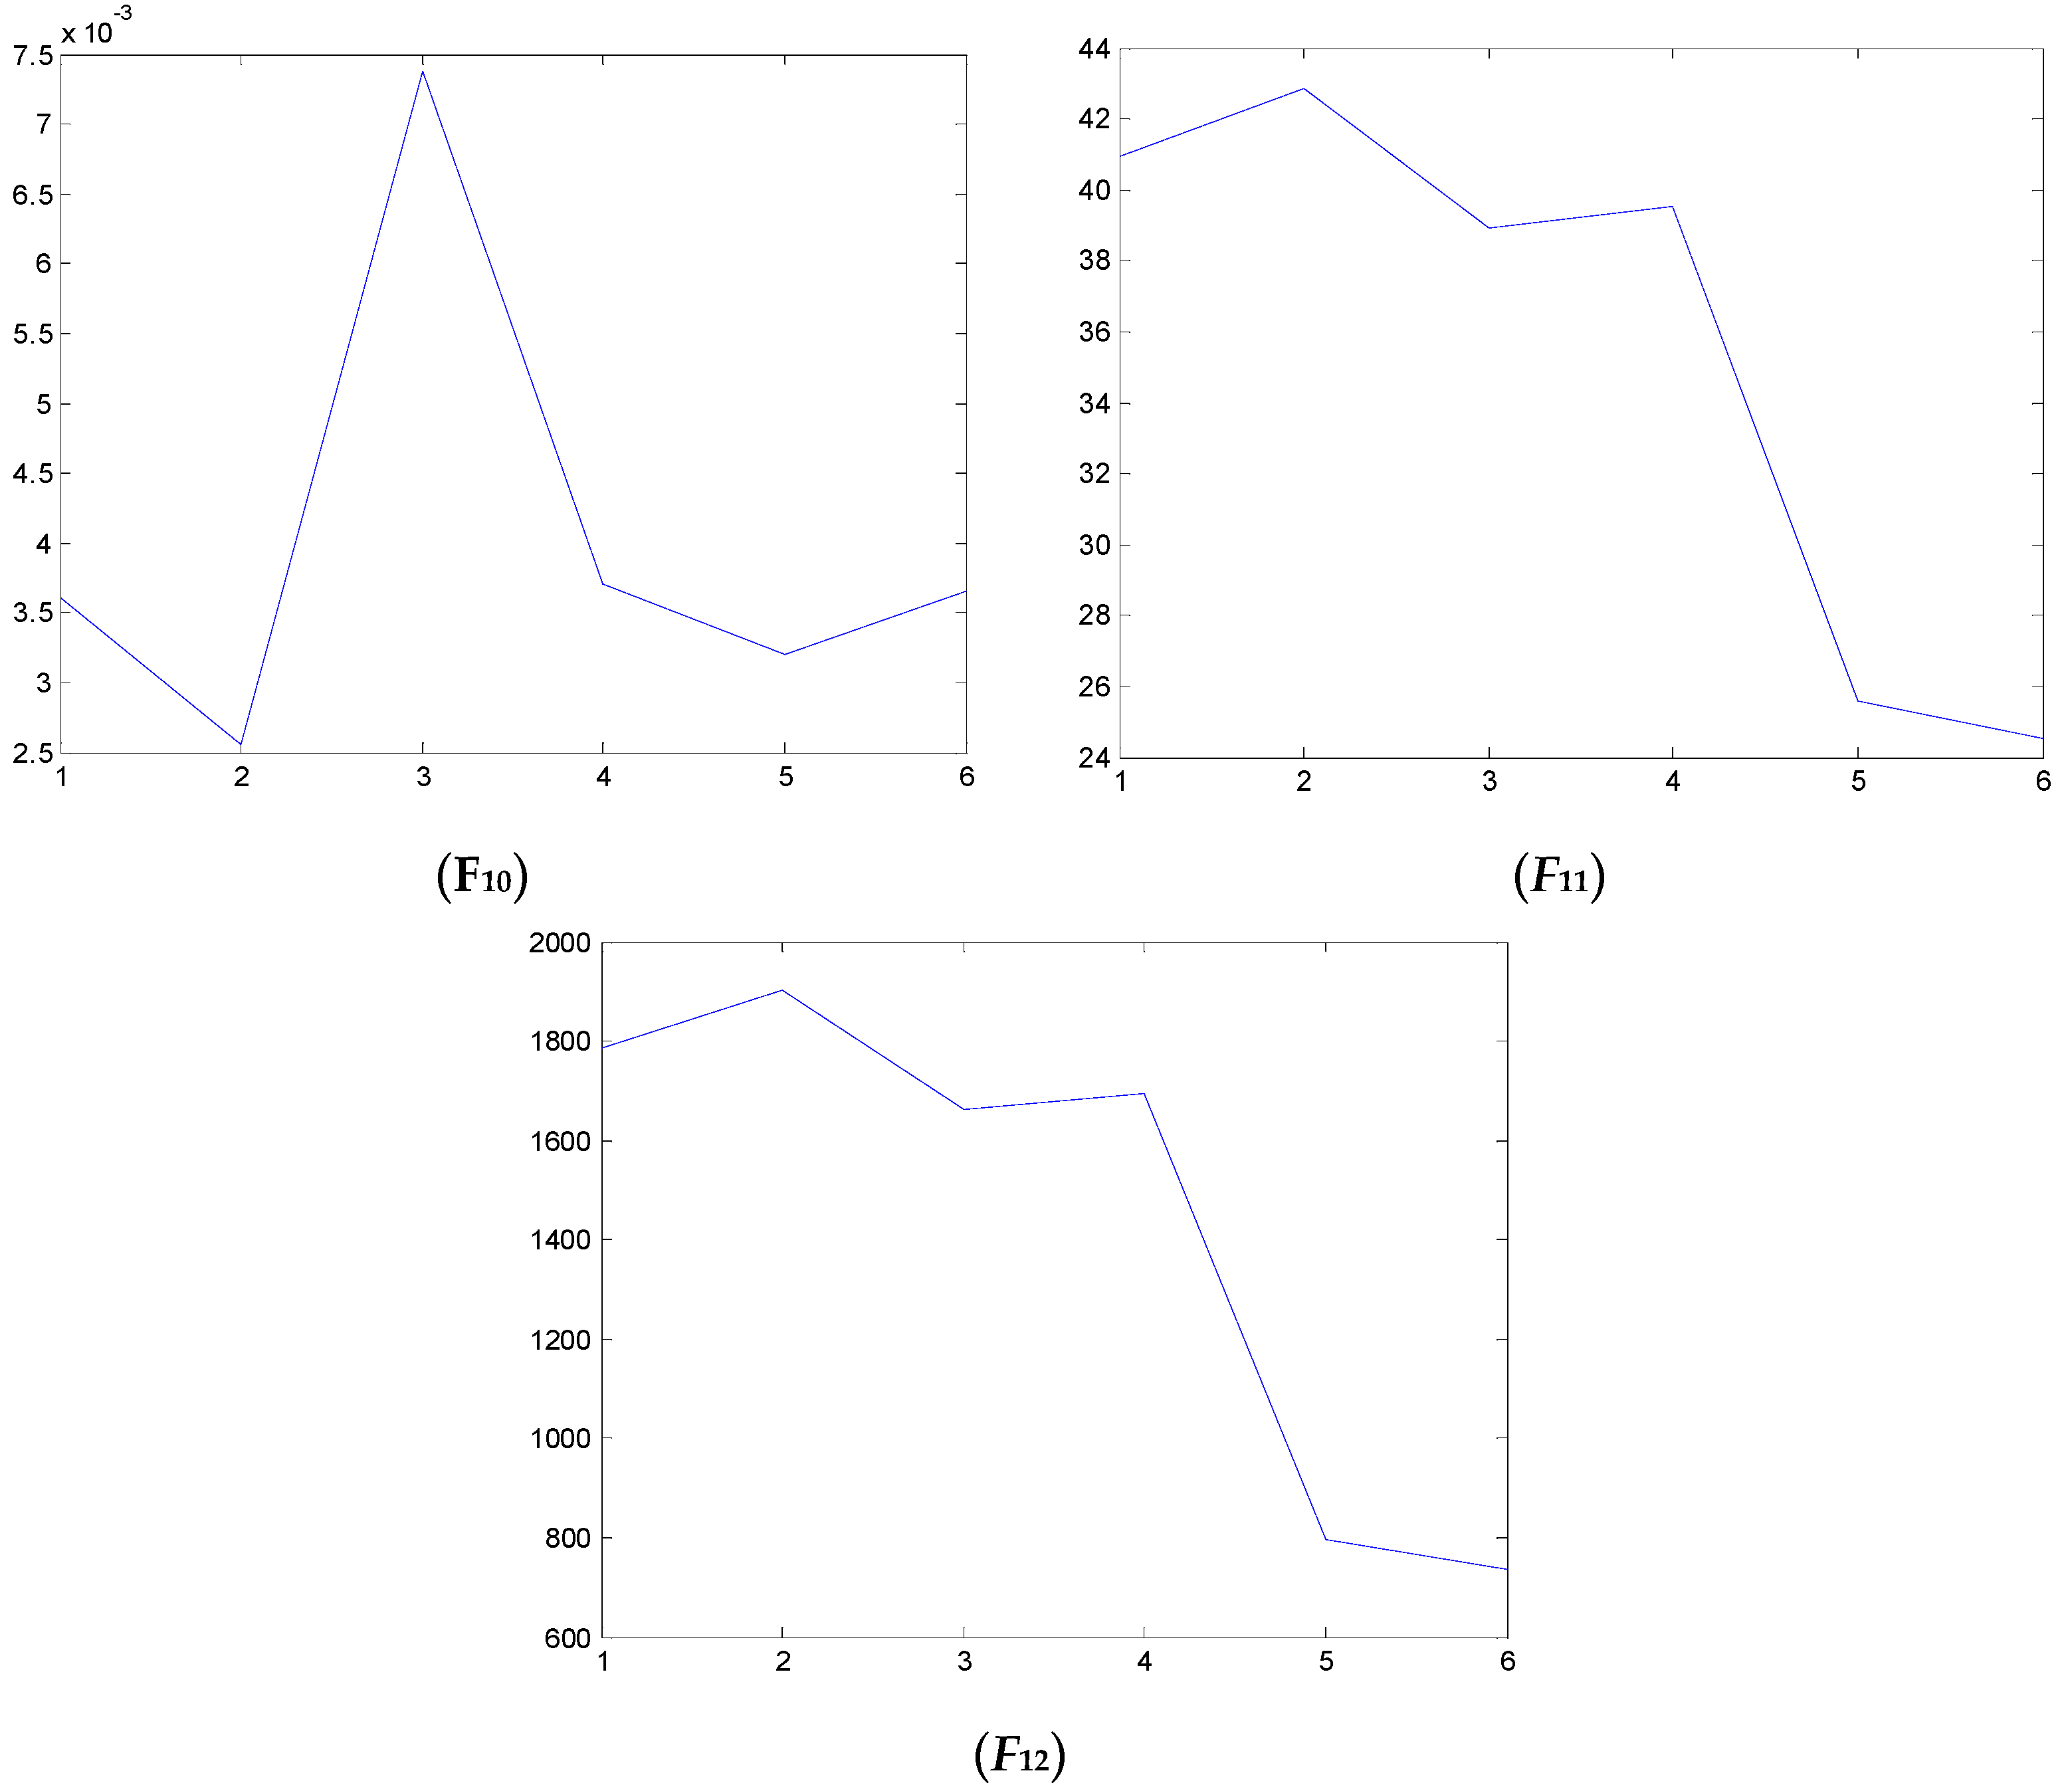
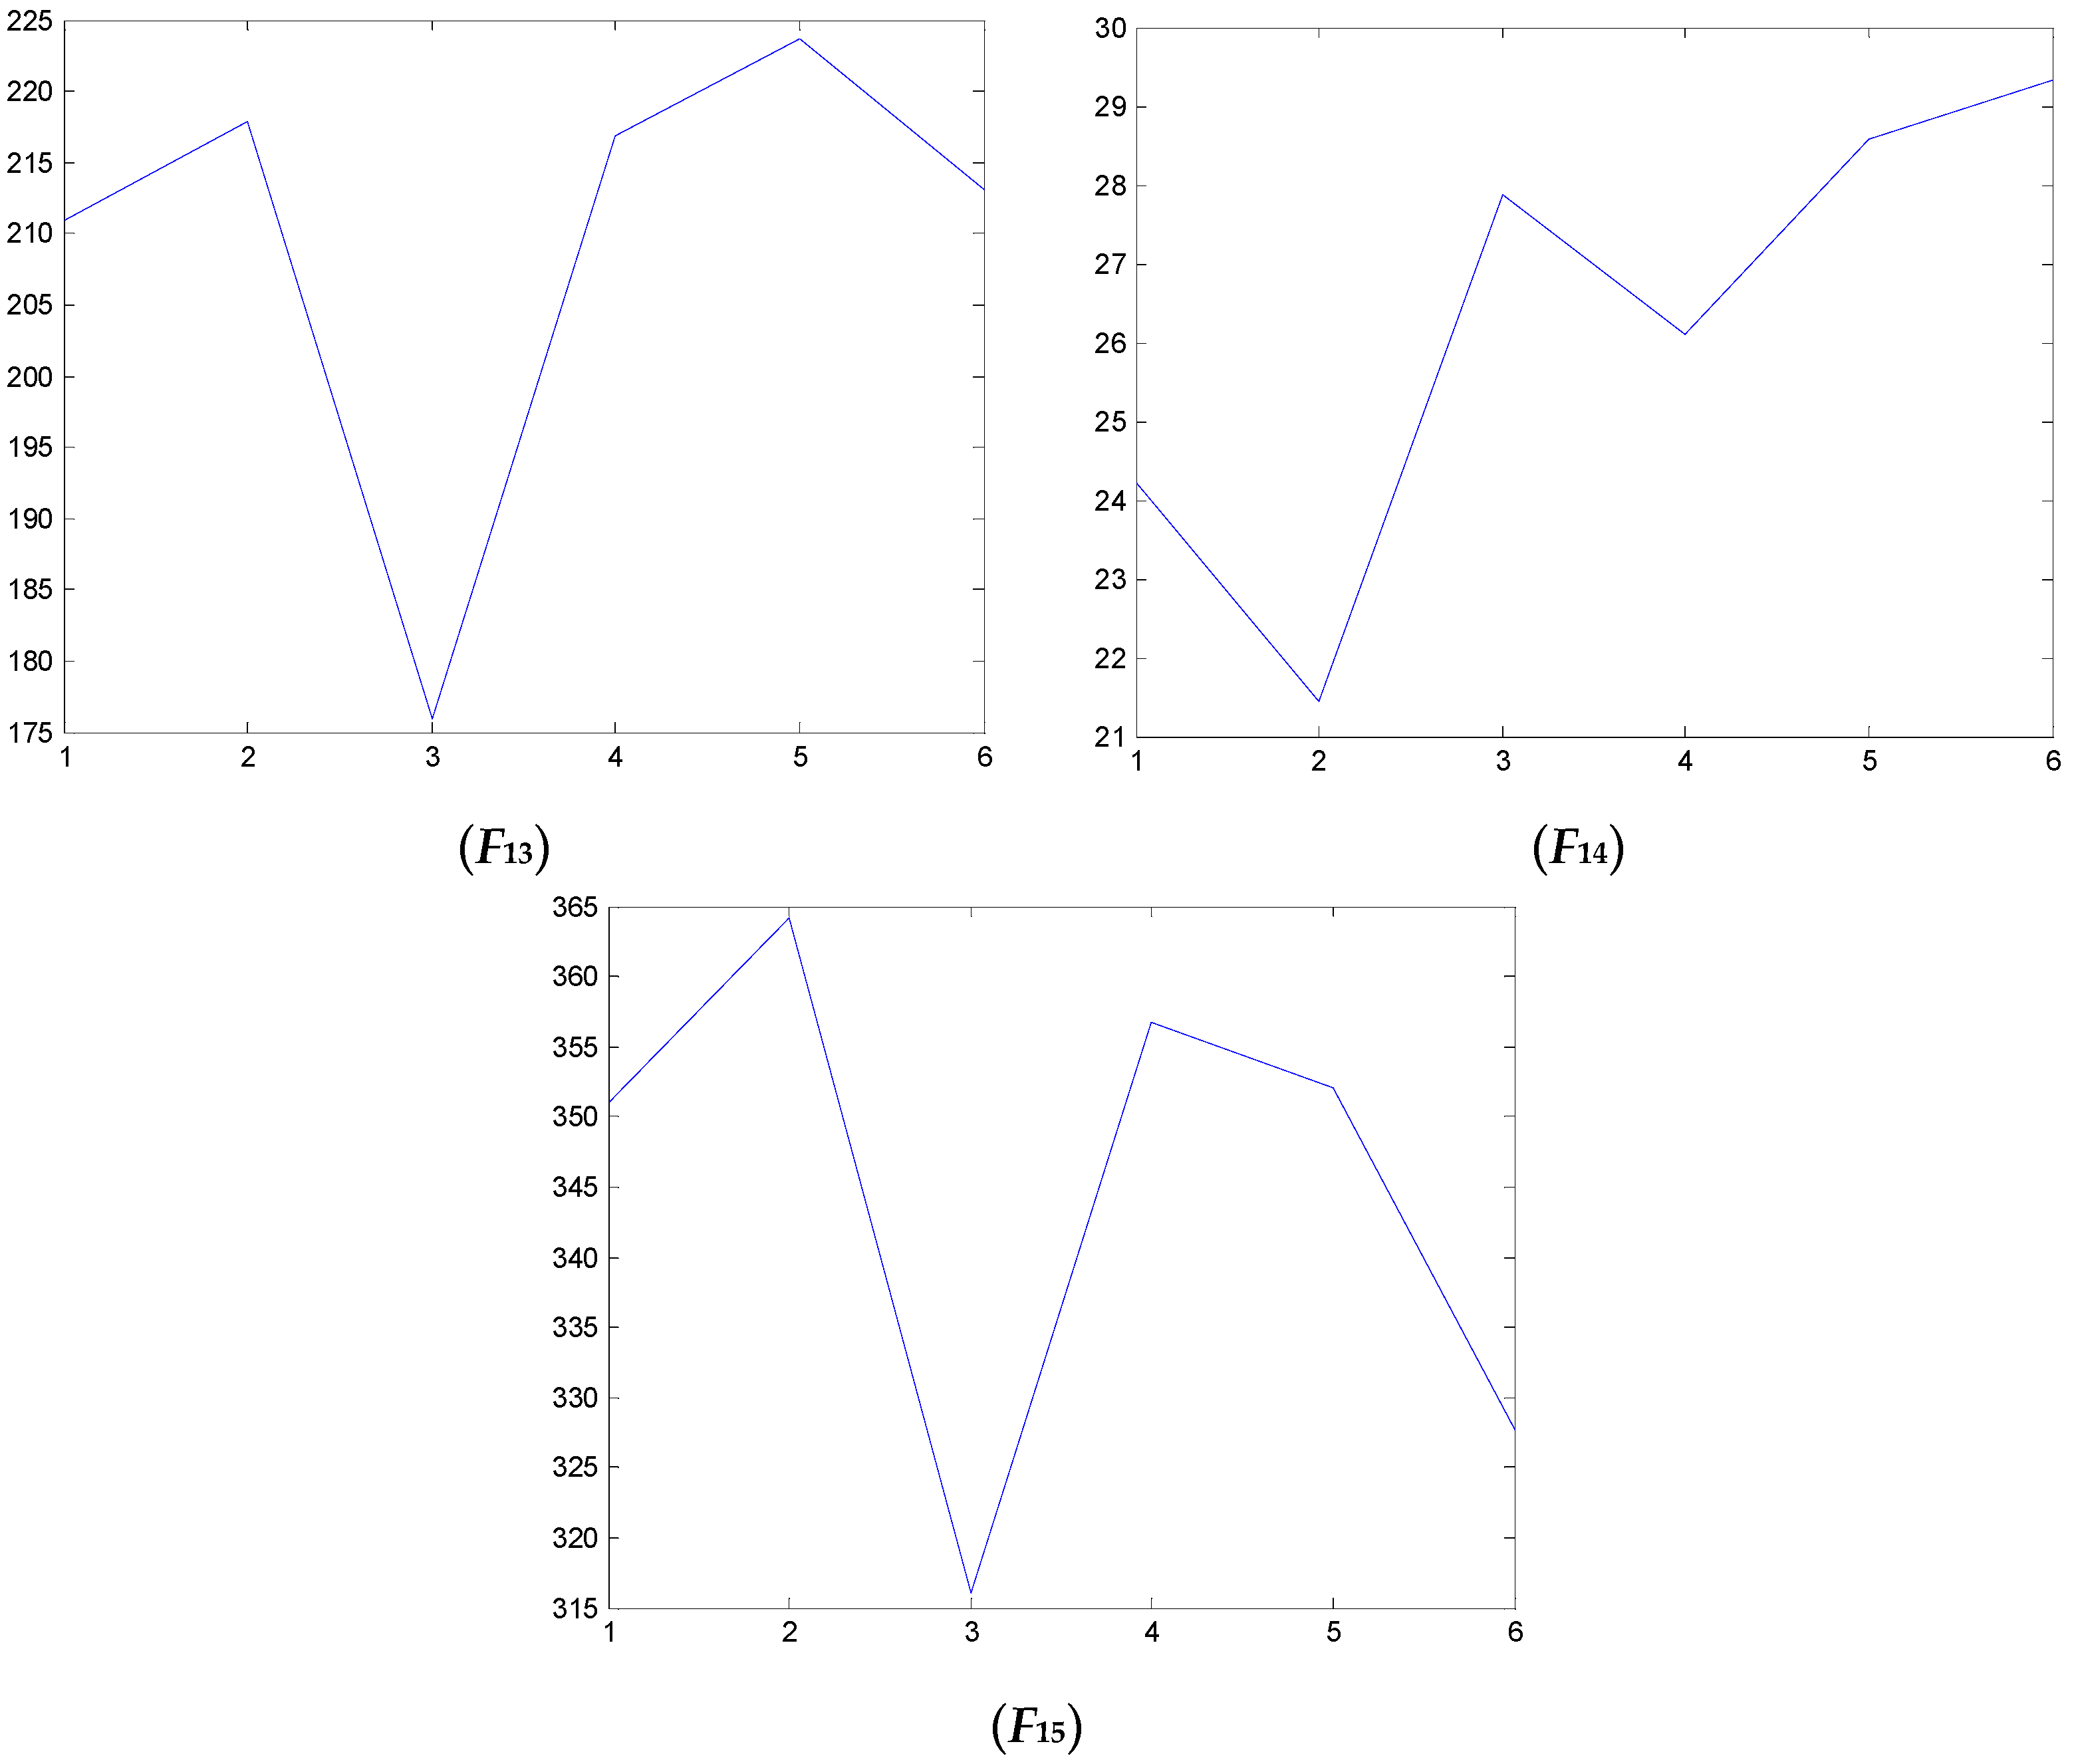
4.1.2. Relative Energy Ratio at Second Harmonic Frequency Component

According to the previous section, we know that when a breathing crack appears, the rotor stiffness changes twice from large to small in one rotation cycle [33,34]. The amplitude of the second harmonic increases obviously and the phase also changed significantly [35,36]. Hence, a quantitative identification method for blade crack fault and a new index are proposed to describe the degree of damage accurately when cracks grow. The new index is called relative energy ratio at second harmonic frequency component and expressed as K2f:
K 2 f = [ A 2 f ] 2 i = 1 j [ A i f ] 2 i = 1 ~ j
where Af means the amplitude of the rotating frequency and A2f means the amplitude of the second harmonic. Moreover, we can find that the energy of the first six order harmonic accounts for more than 98% of the total energy, so based on the amplitude of the frequency spectrum, the parameter j is selected as j = 6.
The value of K2f can be used to judge the degree of the damage, where a and b are thresholds that need to be decided:
(1)
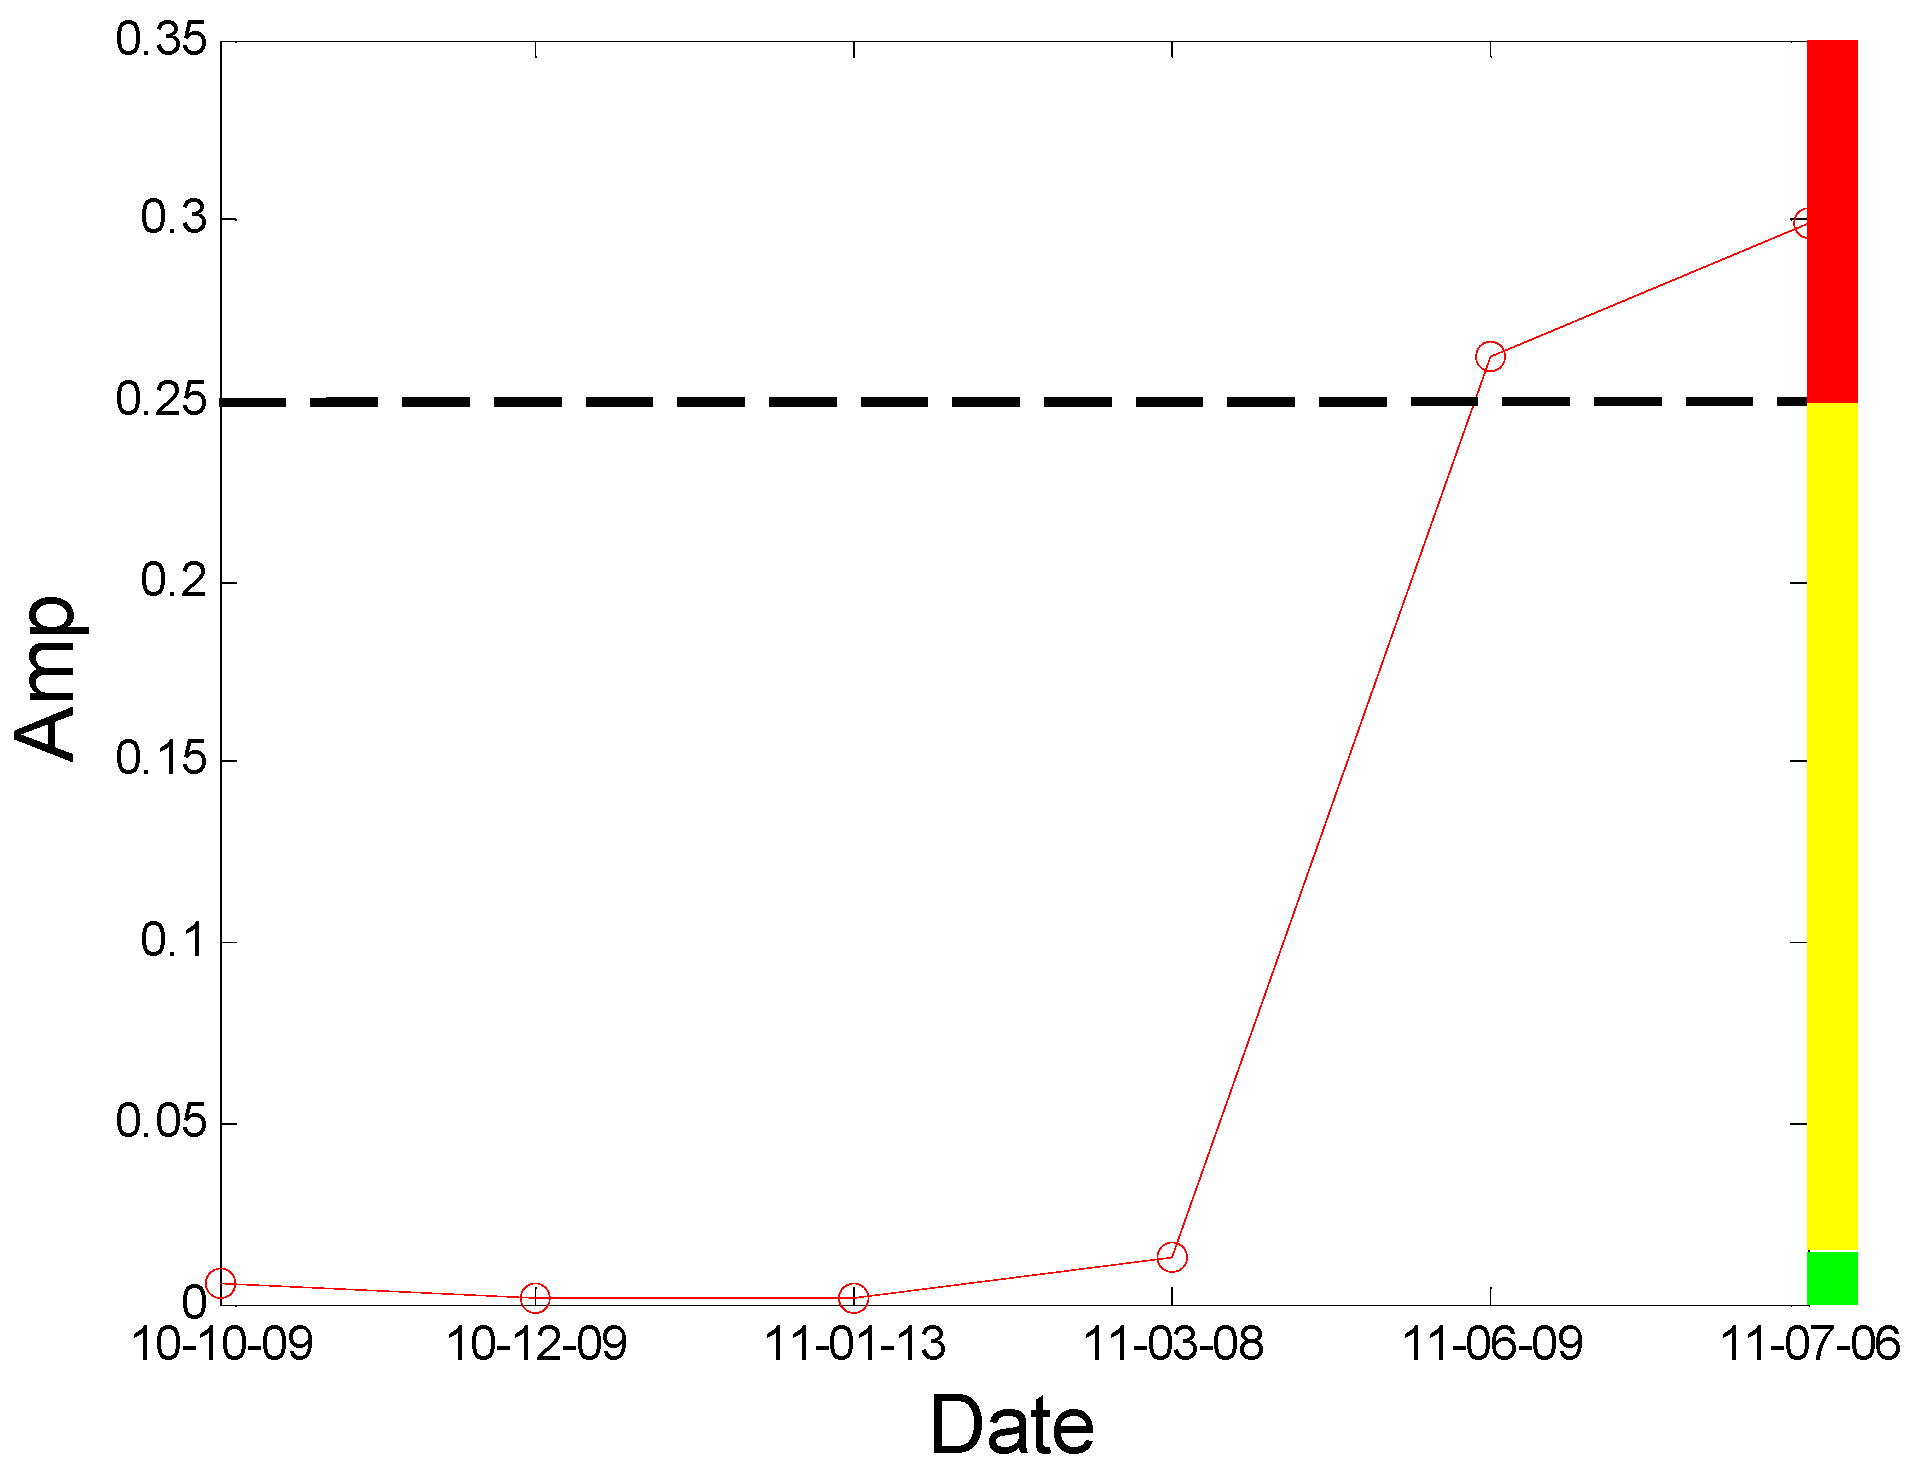
0 ≤ K2f < a : Normal condition, the rotor works well;
(2)
aK2fb: Incipient fault, a crack appears, but is small;
(3)
K2f > b: Serious fault, many cracks appear.
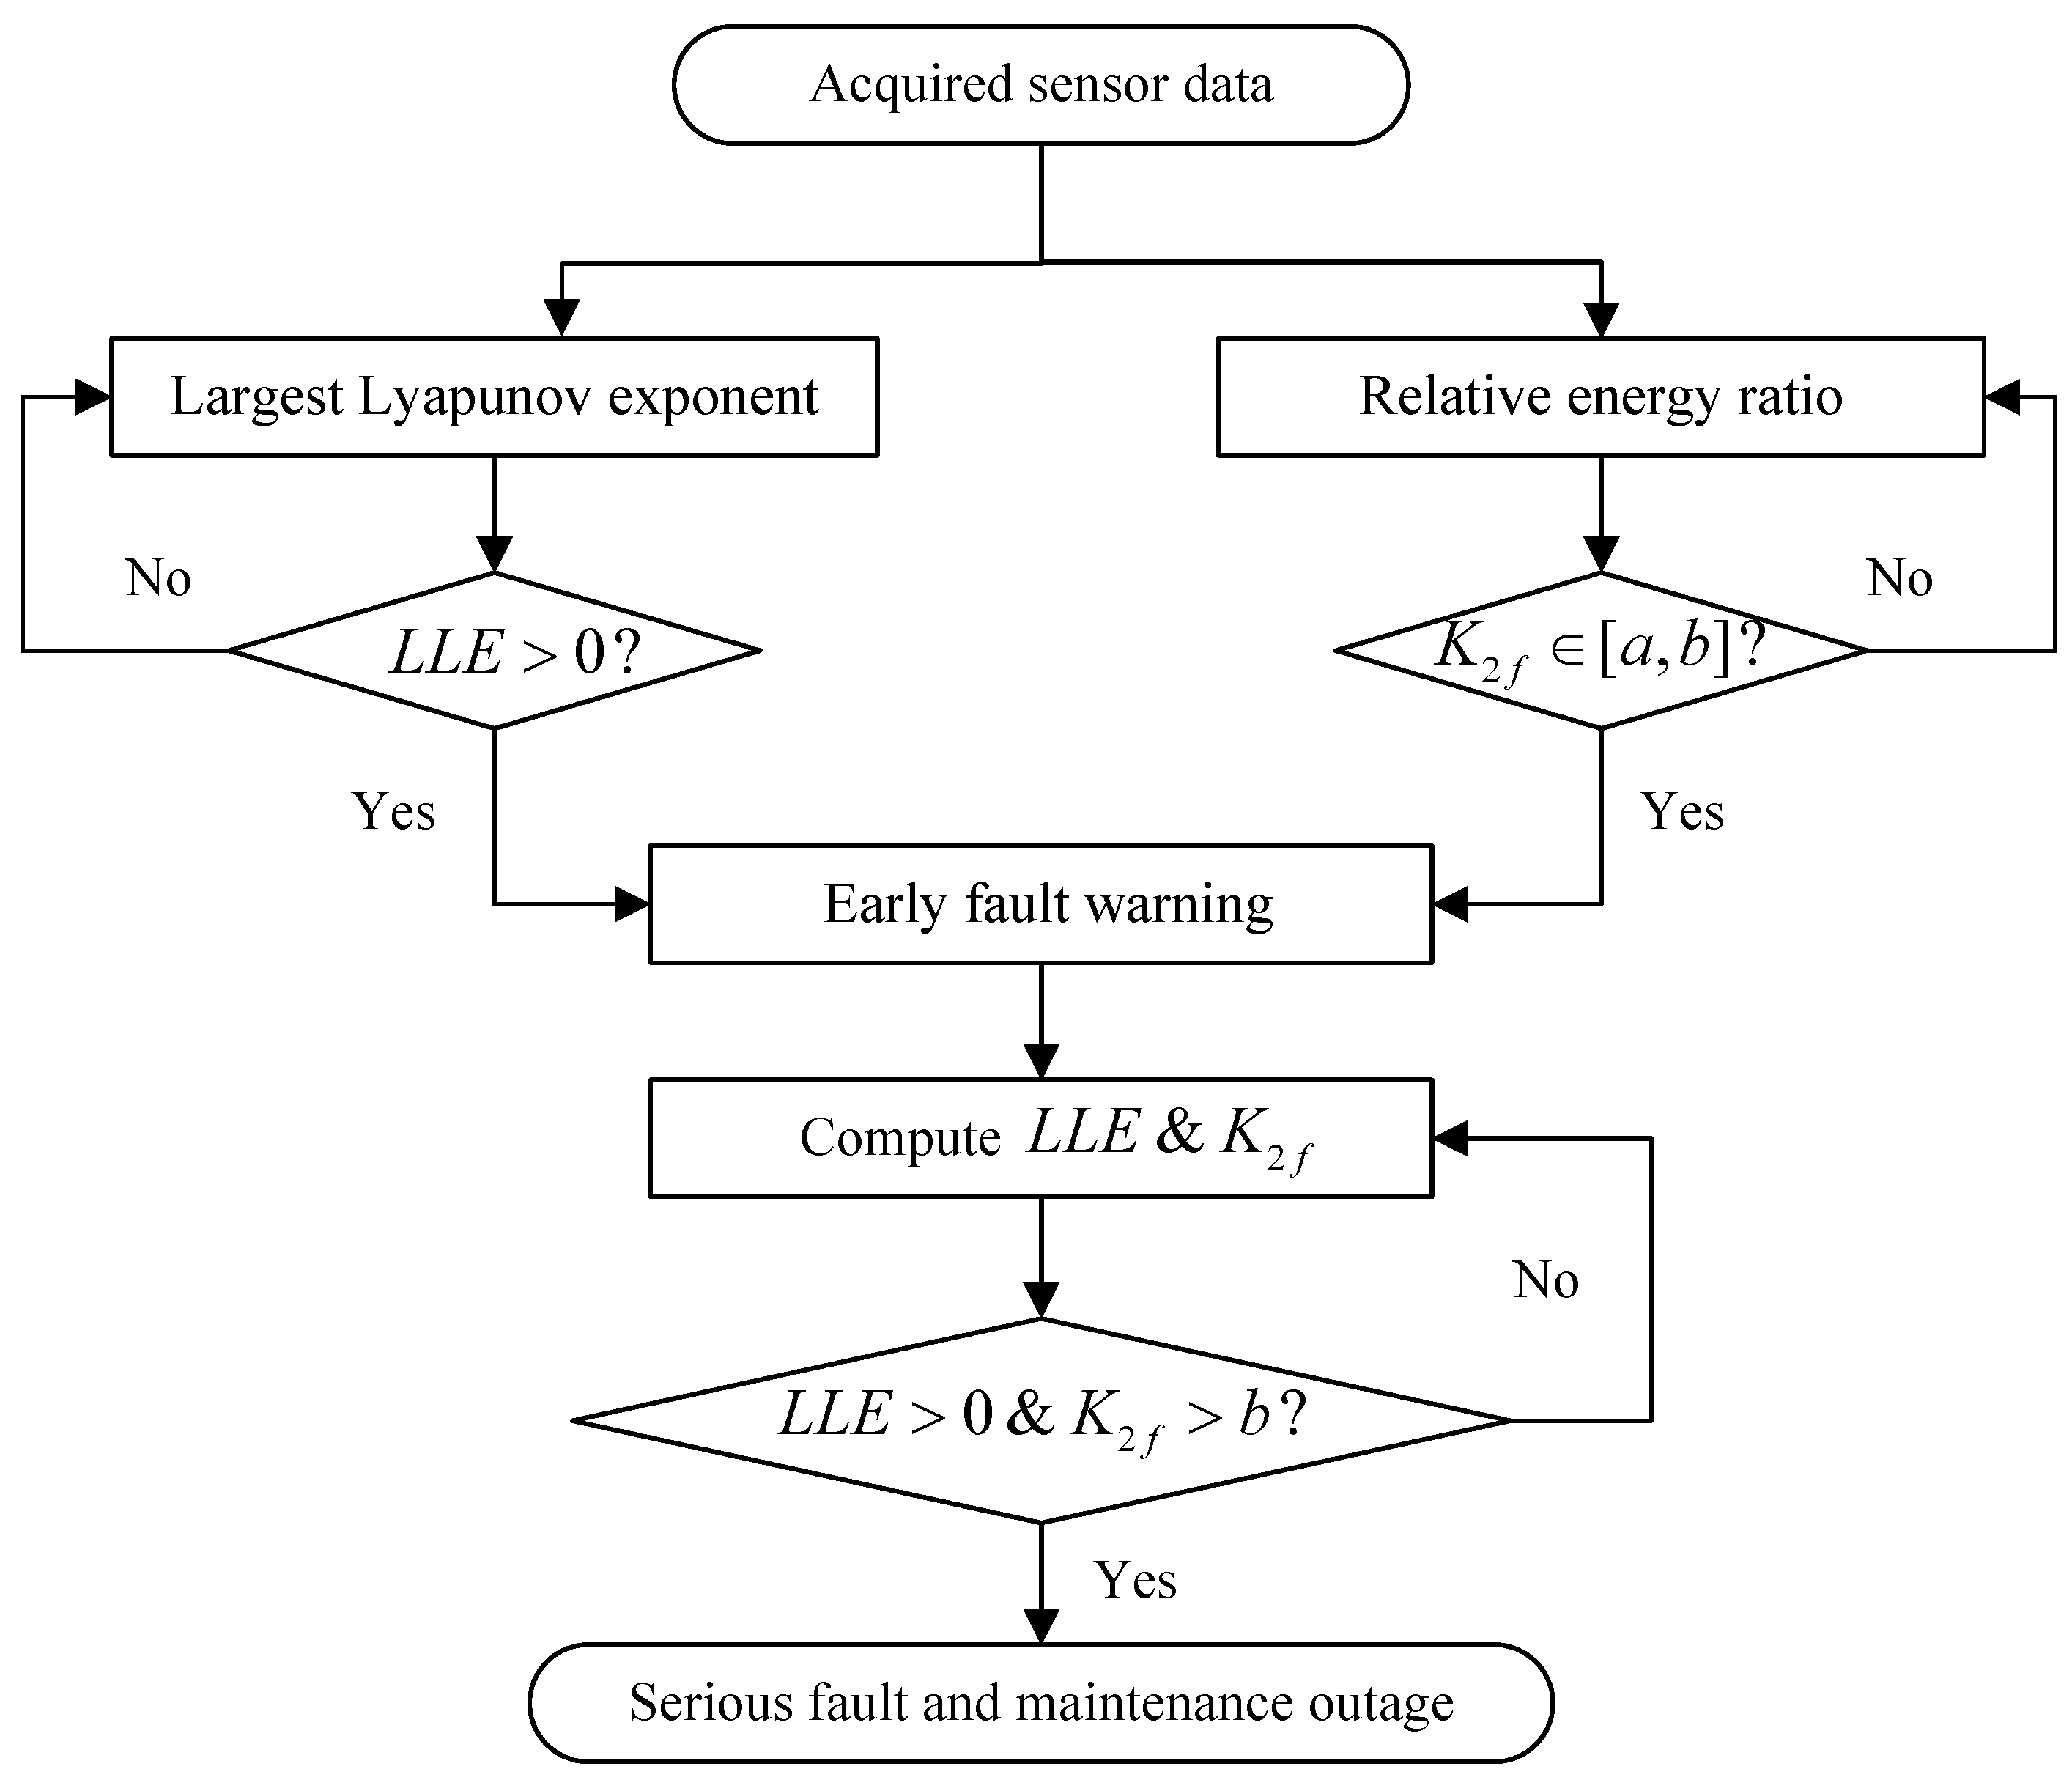
During the period of August 2010 to December 2010, the rotor worked normally and we can think the reliability of this fan remained at the normal level of 0.9 during this time. The values of K2f calculated from the bearing data in the horizontal direction are shown in Figure 12. According to the LLE value in Figure 11, a non-linear condition appeared after 9 December 2010. Moreover, according to the value of K2f in December 2010 to March 2011 as shown in the Figure 12, the threshold value of a is preliminarily determined as 0.02. On 20 July 2011, the rotor broke apart during the process of switching from low speed to high speed (from 744 r/min to 993 r/min) and we can think that the reliability of this fan has decreased to 0 at this time. Based on the lowest reliability requirement the steel-making plant requires for safe running and the value of K2f in bearing 2 from June 2011 to July 2011, the value of b is determined as 0.25 for safety’s sake and the reliability of this fan has decreased below 0.5 at this time by linear mapping relationship analysis, so the parameters are determined completely.
a = 0.02 b = 0.25
The new index K2f is introduced into the testing system and works well in the condition monitoring of the centrifugal booster fan. The results in Figure 12 could be employed to analyze the condition of No. A fan.
Based on the proposed quantitative identification method, the abnormality alarm strategy can be obtained, and then the condition-based maintenance actions can be arranged reasonably to ensure safe and reliable operation. To sum up, the proposed quantitative identification and abnormality alarm strategy procedure of using sensor-dependent vibration data for blade crack identification in centrifugal booster fans can be summarized by the flow chart displayed in Figure 13.
Meanwhile, the process of the proposed method and strategy for the mentioned engineering tasks in the power station can be summarized as follows:
(1)
Collect the sensor-dependent running condition vibration data;
(2)
Pre-process this vibration data using the discrete spectrum interpolation method and STFT;
(3)
Compute the LLE and the relative energy ratio K2f.
(4)
Confirm the degree of blade crack fault(s) of the centrifugal booster fan;
(5)
Conduct the corresponding maintenance management activities based on the fault degree.

4.2. Test and Validation

We have also examined the performance of statistical features reported in the literature as comparisons to validate the performance of the proposed method. Some of the feature parameters have been demonstrated to be ineffective in previous publications, but in different papers, different feature parameters are applied according to the experience accumulated by different researchers. In the different applications, different feature parameters give different diagnosis performance. Thus, many feature parameters are calculated in this study. In total, 21 feature values are obtained, shown in Table 2. These features are adopted to indicate the faulty condition from the acquired vibration signals. The results are displayed in Figure 14, Figure 15, Figure 16, Figure 17, Figure 18 and Figure 19. According to the analyzed figures, some results can be obtained. First, obvious trends cannot be found the majority of the mentioned 21 feature parameters, except for the feature values F4, F11 and F12, so they are of no use for blade crack identification in centrifugal booster fans. Next, the feature values of F4, F11 and F12 show relatively clear trends compared to the remaining feature values, but the proposed strategy using compound feature parameters can indicate the running condition of centrifugal booster fans by hierarchical descriptions. The contrastive results demonstrate the effectiveness of the proposed strategy for the engineering task at hand.
Moreover, the proposed blade crack quantitative identification method is applied to identifying the running condition of No. A fan using A fan No. 3H sensor data. According to the principle of the Largest Lyapunov Exponent algorithm, the LLE value of the condition data from the No. 3H sensor is computed and displayed in Figure 20. We can observe that the non-linear condition also appears after 9 December 2010. In addition, the index K2f is also used to identify the running condition of No. A fan using A fan No. 3H sensor data and the results are displayed in Figure 21. From the result, we also can obtain a clear trend to indicate the blade cracks in centrifugal booster fans and the value is above the abnormal warning stage after 8 March 2011. The result indicates that the proposed index and alarm strategy is feasible.
The proposed blade crack quantitative identification method is also applied to identifying the running condition of the remaining centrifugal booster fans. As mentioned previously, there are three fans in the unit 4. While No. A fan was being repaired, the quantitative identification index is also used to examine the No. B and No. C fans. These three fans have similar structures and functions, so the results based on the proposed method could be employed to analyze the condition of the No. B and No. C fan. After calculation and comparison, the values LLE > 0 and K2f = 0.024 show that the No. C fan is in an incipient fault state. It should be focused on and chosen for monitoring. In addition, the fault status of the No. B fan (K2f = 0.33) is much more serious. It needs to be repaired to avoid it breaking apart like No. A fan. During the checks, cracks were found in the No. B fan and No. C fan as expected. Figure 22 and Figure 23 [24] show the results. From the Figure 22a, we can see that the crack grows from the fan entrance and propagates along the radial direction of the damper. Figure 22b shows the welding position of the blade and the damper. Stress concentration in this position led to the growth and propagation of the crack. As shown in Figure 23, a crack appears at the welding position with a length of 3–4 cm in No. C fan. After detecting these cracks, the maintenance for No. B and No. C fans was carried out in March 2012 to prevent further accidents. These above results show the effectiveness and robustness of the proposed quantitative detection method for blade crack faults.

5. Mathematical Modelling for Revealing Vibration Signal Properties

An impeller consists of a cover component, a disk component and several blades. The finite element model of an impeller is depicted in Figure 24.
According to many experienced engineers, cracks initiate mostly at the weld toe on the cover sides of the blade, as shown in Figure 24. In this paper, the effects of a crack located at such a position on the vibration response of the impeller are of interest, and the cracks at other position can be modeled without much modification. For details of the mathematical modelling and mathematical formulation readers may refer to [34,37].
After component synthesis, the equation of motion of a complete impeller is represented by:
M p ¨ + C p ˙ + K p = b + f n l ( p )
where M, C and K are the mass, damping and stiffness matrices of the ROM; p is the vector of the DOFs retained; b denotes the external excitation acting on the impeller; and fnl(p) is the nonlinear forces caused by intermittent contact of the crack surfaces. More details of this modelling process can be found in [34].
One of the most important issues for crack detection and identification is to search for sensitive indicators. An effective indicator should possess several features, such as robustness, monotonicity and industrial testability. The resonant frequencies discussed in the previous sections are potential indicators for the quantitative detection of crack faults. Two other kinds of frequency based indicators are studied in [34].
In sum, the frequency-based indicators for crack identification of centrifugal impellers were studied and discussed. However, an effective and reliable tool with a sensitive indicator for crack identification of impellers in operation still faces a lot of challenges at present.

6. Conclusions

In this paper, a vibration analysis method for the purpose of detection and quantitative identification of blade crack faults based on the amplitude of the rotating frequency is proposed. Aiming at the problem of energy leakage in FFT, a discrete spectrum interpolation method is proposed to extract the amplitude and phase accurately first. Then a quantitative identification and abnormality alarm strategy based on compound indexes including the Largest Lyapunov Exponent and relative energy ratio of the second harmonic frequency component is proposed. The results show that the proposed method is feasible. In the future, more effective signal processing methods should be studied and used to extract the characteristics of blade crack faults. Moreover, dynamic modeling and analysis of cracked rotor blades is necessary and urgent in future work. More reasonable effective indexes could be constructed to indicate the crack initiation and propagation from the point of view of dynamic analysis. Furthermore, although the proposed method shows good performance, more reasonable parameter selection for the terms a and b in K2f should be studied based on plenty of running condition sensor-dependent vibration data in the future, and urgent demands, including quantitative diagnosis and fault location techniques, still remain to be established for scheduling reasonable maintenance plans.

Acknowledgments

This research was supported financially by the Project of National Natural Science Foundation of China for Innovation Research Group (Grant No. 51421004), National Natural Science Foundation of China (Grant No. 51405379, 51505036), China Postdoctoral Science Foundation (Grant No. 2014M562396, Grant No. 2015T81017), Fundamental Research Funds for the Central Universities of China (Grant No. XJJ2015106) and Shaanxi Industrial Science and Technology Project (Grant No. 2015GY121). The authors would like to sincerely thank all the anonymous reviewers for their valuable comments that greatly helped to improve the manuscript. Special thanks are expressed to Binqiang Chen, Zitong Zhou and Zipeng Li for helping with describing and analyzing the experimental data.

Author Contributions

H.S. and J.C. conceived and designed the experiments; H.S. performed the experiments; J.C., H.S. and S.W. analyzed the data; H.S. contributed materials; J.C. wrote the paper.

Conflicts of Interest

The authors declare no conflict of interest.

References

  1. Zhao, J.; Wang, W.; Liu, Y.; Pedrycz, W. A two-stage online prediction method for a blast furnace gas system and its application. IEEE Trans. Control Syst. Technol. 2011, 19, 507–520. [Google Scholar] [CrossRef]
  2. Steer, J.M.; Marsh, R.; Greenslade, M.; Robinson, A. Opportunities to improve the utilisation of granulated coals for blast furnace injection. Fuel 2015, 151, 40–49. [Google Scholar] [CrossRef]
  3. Wan, Z.G.; Cao, H.R.; Zi, Y.Y.; He, W.P.; He, Z.J. An improved time-varying mesh stiffness algorithm and dynamic modeling of gear-rotor system with tooth root crack. Eng. Fail. Anal. 2014, 42, 157–177. [Google Scholar] [CrossRef]
  4. Luo, Y.G.; Zhang, S.H.; Wu, B.; Hu, H.Y. Stability analysis of nonlinear stiffness rotor-bearing system with pedestal looseness fault. Appl. Mech. Mater. 2013, 483, 285–288. [Google Scholar] [CrossRef]
  5. Corbetta, M.; Sbarufatti, C.; Manes, A.; Giglio, M. Real-time prognosis of crack growth evolution using sequential Monte Carlo methods and statistical model parameters. IEEE Trans. Reliabil. 2015, 64, 736–753. [Google Scholar] [CrossRef]
  6. Sun, C.; Zhang, Z.S.; Guo, T. A novel manifold–manifold distance index applied to looseness state assessment of viscoelastic sandwich structures. Smart Mater. Struct. 2014, 23, 065019. [Google Scholar] [CrossRef]
  7. Liu, C.; Jiang, D.X.; Chu, F.L. Influence of alternating loads on nonlinear vibration characteristics of cracked blade in rotor system. J. Sound Vib. 2015, 353, 205–219. [Google Scholar] [CrossRef]
  8. Wang, Y.F.; Liang, M.; Xiang, J.W. Damage detection method for wind turbine blades based on dynamics analysis and mode shape difference curvature information. Mech. Syst. Signal Process. 2014, 48, 351–367. [Google Scholar] [CrossRef]
  9. Yang, B.; Sun, D.B. Testing, inspecting and monitoring technologies for wind turbine blades: A survey. Renew. Sustain. Energy Rev. 2013, 22, 515–526. [Google Scholar] [CrossRef]
  10. Kubiak, J.; Urquiza, G.; Rodriguez, J.A.; González, G.; Rosales, I.; Castillo, G.; Nebradt, J. Failure analysis of the 150 MW gas turbine blades. Eng. Fail. Anal. 2009, 16, 1794–1804. [Google Scholar] [CrossRef]
  11. Li, F.; Wang, J.X.; Chyu, M.K.; Tang, B.P. Weak fault diagnosis of rotating machinery based on feature reduction with Supervised Orthogonal Local Fisher Discriminant Analysis. Neurocomputing 2015, 168, 505–519. [Google Scholar] [CrossRef]
  12. Zhang, X.L.; Wang, B.J.; Chen, X.F. Operational safety assessment of turbo generators with wavelet rényi entropy from sensor-dependent vibration signals. Sensors 2015, 15, 8898–8918. [Google Scholar] [CrossRef] [PubMed]
  13. Witek, L. Crack propagation analysis of mechanically damaged compressor blades subjected to high cycle fatigue. Eng. Fail. Anal. 2011, 18, 1223–1232. [Google Scholar] [CrossRef]
  14. Infante, V.; Silva, J.M. Case studies of computational simulations of fatigue crack propagation using finite elements analysis tools. Eng. Fail. Anal. 2011, 18, 616–624. [Google Scholar] [CrossRef]
  15. Lin, L.; Chu, F.L. HHT-based AE characteristics of natural fatigue cracks in rotating shafts. Mech. Syst. Signal Process. 2012, 26, 181–189. [Google Scholar] [CrossRef]
  16. Fang, D.; Zivanovic, R. Condition Monitoring of an Induction Motor Stator Windings Via Global Optimization Based on the Hyperbolic Cross Points. IEEE Trans. Ind. Electron. 2015, 62, 1826–1834. [Google Scholar]
  17. Qiao, W.; Lu, D. A survey on wind turbine condition monitoring and fault diagnosis. IEEE Trans. Ind. Electron. 2015, 99, 6536–6545. [Google Scholar] [CrossRef]
  18. Liu, K.; Zhu, Z.Q. Position-offset-based parameter estimation using the adaline NN for condition monitoring of permanent-magnet synchronous machines. IEEE Trans. Ind. Electron. 2015, 62, 2372–2383. [Google Scholar] [CrossRef]
  19. Seungdeog, C.; Pazouki, E.; Baek, J.; Bahrami, H.R. Iterative condition monitoring and fault diagnosis scheme of electric motor for harsh industrial application. IEEE Trans. Ind. Electron. 2015, 62, 1760–1769. [Google Scholar]
  20. Chen, J.L.; Zhang, C.L.; Zhang, Y.Y.Z.X.Y.; He, S.L.; Yang, Z. Planetary gearbox condition monitoring of ship-based satellite communication antennas using ensemble multiwavelet analysis method. Mech. Syst. Signal Process. 2015, 54–55, 277–292. [Google Scholar] [CrossRef]
  21. Gao, Z.W.; Ding, S.X.; Cecati, C. Real-time fault diagnosis and fault-tolerant control. IEEE Trans. Ind. Electron. 2015, 62, 3752–3756. [Google Scholar] [CrossRef]
  22. Gao, Z.W.; Cecati, C.; Ding, S.X. A survey of fault diagnosis and fault-tolerant techniques—Part II: Fault diagnosis with knowledge-based and hybrid/active approaches. IEEE Trans. Ind. Electron. 2015, 62, 3768–3774. [Google Scholar] [CrossRef]
  23. Sun, H.L.; Zi, Y.Y.; He, Z.J.; Chen, B.Q.; Liu, H. Feature extraction and its application for nonstationary features of the blade crack in centrifugal booster fans. J. Vib. Shock 2012, 31. [Google Scholar]
  24. Sun, H.L. Theory and Applications of Adaptive Multiwavelets in Quantitative Fault Diagnosis for Key Mechanical Equipments. Ph.D. Dissertation, Xi’an Jiaotong University, Xi’an, China, 2013.
  25. Kim, Y.H.; Youn, Y.W.; Hwang, D.H.; Sun, J.H.; Kang, D.S. High-Resolution Parameter Estimation Method to Identify Broken Rotor Bar Faults in Induction Motors. IEEE Trans. Ind. Electron 2013, 60, 4103–4116. [Google Scholar] [CrossRef]
  26. Amar, M.; Gondal, I.; Wilson, C. Vibration spectrum imaging: A novel bearing fault classification Approach. IEEE Trans. Ind. Electron 2015, 62, 494–502. [Google Scholar] [CrossRef]
  27. Lin, H.B.; Ding, K. Energy based signal parameter estimation method and a comparative study of different frequency estimators. Mech. Syst. Signal Process. 2011, 25, 452–462. [Google Scholar]
  28. Sharma, G.K.; Kumar, A.; Rao, C.B.; Jayakumar, T.; Raj, B. Short time fourier transform analysis for understanding frequency dependent attenuation in austenitic stainless steel. NDT E Int. 2013, 53, 1–7. [Google Scholar] [CrossRef]
  29. Wang, J.Z.; Jia, R.L.; Zhao, W.G.; Wu, J.; Dong, Y. Application of the largest Lyapunov exponent and non-linear fractal extrapolation algorithm to short-term load forecasting. Chaos Solitons Fractals 2012, 45, 1277–1287. [Google Scholar] [CrossRef]
  30. Wolf, A.; Swift, J.B.; Swinney, H.L.; Vastano, J.A. Determining Lyapunov exponents from A time series. Phys. D Nonlinear Phenom. 1985, 16, 285–317. [Google Scholar] [CrossRef]
  31. Chen, B.Q. Overcomplete Frame Expansion Based on Wavelet Tight Frame and Its Applications to Machinery Fault Detection and Diagnosis. Ph.D. Dissertation, Xi’an Jiaotong University, Xi’an, China, 2013.
  32. Chen, B.Q.; Zhang, Z.S.; Zi, Y.Y.; He, Z.J.; Sun, C. Detecting of transient vibration signatures using an improved fast spatial-spectral ensemble kurtosis kurtogram and its applications to mechanical signature analysis of short duration data from rotating machinery. Mech. Syst. Signal Process. 2013, 40, 1–37. [Google Scholar] [CrossRef]
  33. Chen, J.L.; Zi, Y.Y.; He, Z.J.; Wang, X.D. Adaptive redundant multiwavelet denoising with improved neighboring coefficients for gearbox fault detection. Mech. Syst. Signal Process. 2013, 38, 549–568. [Google Scholar] [CrossRef]
  34. Wang, S.; Zi, Y.Y.; Li, B.; Zhang, C.L.; He, Z.J. Reduced-order modeling for mistuned centrifugal impellers with crack damages. J. Sound Vib. 2014, 333, 6979–6995. [Google Scholar] [CrossRef]
  35. Kuang, J.; Huang, B. The effect of blade crack on mode localization in rotating bladed disks. J. Sound Vib. 1999, 227, 85–103. [Google Scholar] [CrossRef]
  36. Fang, X.; Tang, J.; Jordan, E.; Murphy, K. Crack induced vibration localization in simplified bladed-disk structures. J. Sound Vib. 2006, 291, 395–418. [Google Scholar] [CrossRef]
  37. Wang, S.; Zi, Y.Y.; Wan, Z.G.; Li, B.; He, Z.J. Effects of multiple cracks on the forced response of centrifugal impellers. Mech. Syst. Signal Process. 2015, 60–61, 326–3438. [Google Scholar] [CrossRef]
Figure 1. The structure of the BFG booster fans in Unit 4.
Sensors 16 00632 g001
Figure 2. The work flow diagram of the research framework.
Sensors 16 00632 g002
Figure 3. Photos of the rotor blades of No. A fan.
Sensors 16 00632 g003
Figure 4. Site photos of the broken blade.
Sensors 16 00632 g004
Figure 5. A sketch of the three groups of sensors.
Sensors 16 00632 g005
Figure 6. The FFT waterfall from 0 to 100 Hz of the No. 2H sensor.
Sensors 16 00632 g006
Figure 7. The trends of the amplitude value by the interpolation method for the discrete spectrum of the No. 2H sensor.
Sensors 16 00632 g007
Figure 8. The STFT result acquired from a normal blade.
Sensors 16 00632 g008
Figure 9. The STFT result acquired from a cracked blade.
Sensors 16 00632 g009
Figure 10. The photo of the cracked blade in the A fan.
Sensors 16 00632 g010
Figure 11. The LLE value of the A fan No. 2H sensor.
Sensors 16 00632 g011
Figure 12. The results by the quantitative identification index on A fan No. 2H sensor.
Sensors 16 00632 g012
Figure 13. The flow chart of the proposed quantitative identification and abnormality alarm strategy.
Sensors 16 00632 g013
Figure 14. The analyzed results of A fan No. 2H sensor by F1, F2 and F3.
Sensors 16 00632 g014aSensors 16 00632 g014b
Figure 15. The analyzed results of A fan No. 2H sensor by F4, F5 and F6.
Sensors 16 00632 g015
Figure 16. The analyzed results of A fan No. 2H sensor by F7, F8 and F9.
Sensors 16 00632 g016
Figure 17. The analyzed results of A fan No. 2H sensor by F10, F11 and F12.
Sensors 16 00632 g017
Figure 18. The analyzed results of A fan No. 2H sensor by F13, F14 and F15.
Sensors 16 00632 g018
Figure 19. The analyzed results of A fan No. 2H sensor by F16F21.
Sensors 16 00632 g019
Figure 20. The LLE value of A fan No. 3H sensor.
Sensors 16 00632 g020
Figure 21. The result by the quantitative identification index of A fan No. 3H sensor.
Sensors 16 00632 g021
Figure 22. Photo of the crack on B fan.
Sensors 16 00632 g022
Figure 23. Photo of C fan after repair welding.
Sensors 16 00632 g023
Figure 24. Finite element model of an impeller and a sector model.
Sensors 16 00632 g024
Table 1. The acquired running sensor-dependent vibration data.
No.Date2#3#
AHVAHV
mm/smm/sGEmm/smm/sGE
110-08-04DDDDDD
210-10-09DDDDDD
310-12-09DDDDDD
411-01-13DDDDDD
511-03-08DDDDDD
611-04-07DhDhDhDhDhDh
711-04-12DhDhDhDhDhDh
811-05-11DDDDDD
911-06-09DDDDDD
1011-07-06DDDDDD
Table 2. The contrastive feature parameters.
CategoryParameter
Time-Domain index F 1 = x _ m = n = 1 N x ( n ) N x _ r = ( n = 1 N | x ( n ) | N ) 2
F 2 = x _ s t d = n = 1 N ( x ( n ) F 1 ) 2 N 1 x _ p e a k = max | x ( n ) | x _ p p = max ( x ( n ) ) min ( x ( n ) )
F 3 = x _ s k e w = n = 1 N ( x ( n ) x _ m ) 3 ( N 1 ) x _ s t d 3 x _ r m s = n = 1 N ( x ( n ) ) 2 N x _ a v = n = 1 N | x ( n ) | N
F 4 = x _ k u r = n = 1 N ( x ( n ) x _ m ) 4 ( N 1 ) x _ s t d 4 F 5 = x _ c r e s t = x _ p e a k x _ r m s F 6 = x _ y u = x _ p e a k x _ r
F 7 = x _ s h a p e = x _ r m s x _ a v F 8 = x _ i m p = x _ p e a k x _ a v
Frequency-Domain index F 9 = k = 1 K s ( k ) K F 10 = k = 1 K ( s ( k ) F 9 ) 2 K 1 F 11 = k = 1 K ( s ( k ) F 9 ) 3 K ( F 10 ) 3 F 12 = k = 1 K ( s ( k ) F 9 ) 4 K F 10 2 F 13 = k = 1 K f k s ( k ) k = 1 K s ( k )
F 14 = k = 1 K ( f k F 13 ) 2 s ( k ) K F 15 = k = 1 K f k 2 s ( k ) k = 1 K s ( k ) F 16 = k = 1 K f k 4 s ( k ) k = 1 K f k 2 s ( k ) F 17 = k = 1 K f k 2 s ( k ) k = 1 K s ( k ) k = 1 K f k 4 s ( k ) F 18 = F 14 F 13
F 19 = k = 1 K ( f k F 13 ) 3 s ( k ) K F 14 3 F 20 = k = 1 K ( f k F 1 3 ) 4 s ( k ) K F 14 4 F 21 = k = 1 K ( f k F 13 ) 1 / 2 s ( k ) K F 14
x(n) is the time domain signal, n = 1, 2, …, N; N is the sample point; s(k) is the spectrum of x(n), k = 1, 2, …, K; K is the number of spectrum lines; fK is the frequency of k-th spectrum line.

