Glucose Sensing by Time-Resolved Fluorescence of Sol-Gel Immobilized Glucose Oxidase

 ,
, 
Abstract
: A monolithic silica gel matrix with entrapped glucose oxidase (GOD) was constructed as a bioactive element in an optical biosensor for glucose determination. Intrinsic fluorescence of free and immobilised GOD was investigated in the visible range in presence of different glucose concentrations by time-resolved spectroscopy with time-correlated single-photon counting detector. A three-exponential model was used for analysing the fluorescence transients. Fractional intensities and mean lifetime were shown to be sensitive to the enzymatic reaction and were used for obtaining calibration curve for glucose concentration determination. The sensing system proposed achieved high resolution (up to 0.17 mM) glucose determination with a detection range from 0.4 mM to 5 mM.1. Introduction
In the last years the employment of glucose oxidase (GOD) in glucose optical sensing has been largely investigated for clinical and industrial applications [1–8]. Different immobilization procedures have been adopted [9–11] aiming to improve the linear range, sensibility, specificity, reproducibility and time stability of the optical sensors. Sol-gel matrices have been proven to be excellent carriers for enzymes since their catalytic activity is slightly affected by the gel structure. In addition sol-gel avoids the leakage of the bioactive macromolecule and allows the diffusion of substrate (and reaction products) towards (or away from) the catalytic site [12–14].
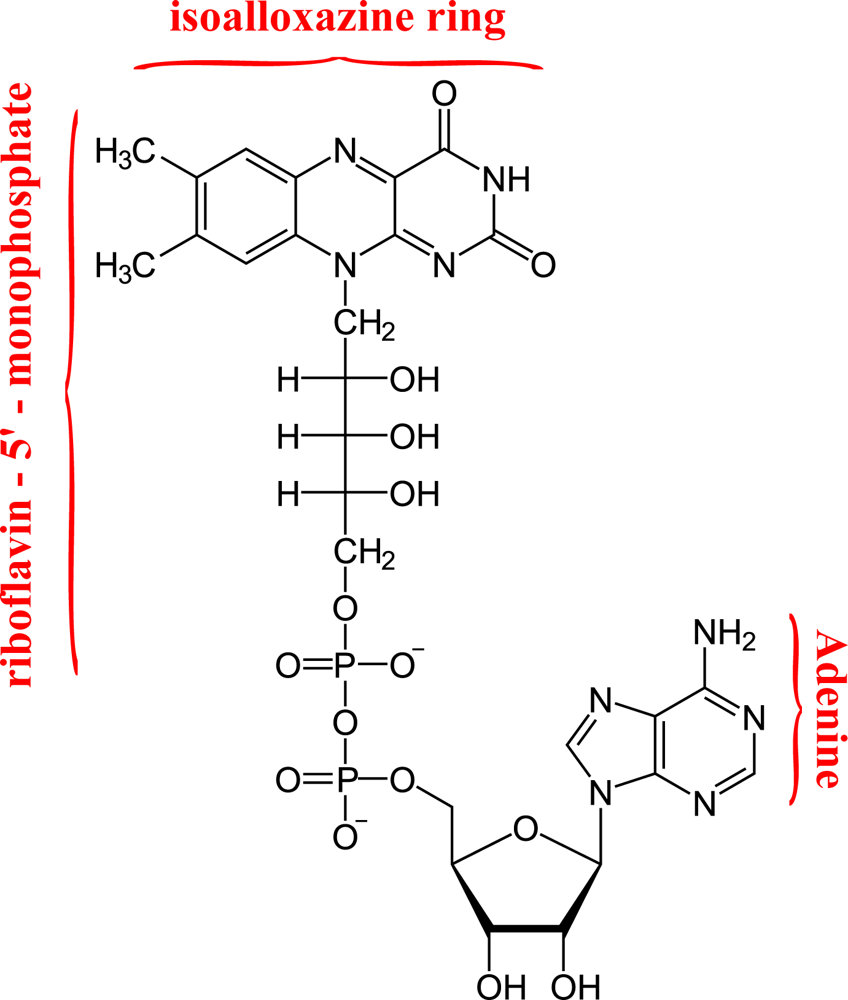
It is well known that GOD is a homo-dimer composed of two identical 80-kDa subunits and two non-covalently bound flavin adenine dinucleotides complexes (FAD). FAD is situated in the first domain which consists of two beta sheets and three alfa helices and occupies a narrow channel outlined by 31 residues with a covering lid formed by residues 75–98 [15]. The FAD structure is composed by flavoprotein and adenine dinucleotide (Figure 1). The isoalloxazine (ISO) ring is responsible for the light emission of FAD in the visible spectral range and is linked with adenine through hydrogen-bonding. It was proposed that FAD exists in two conformations: an extended, open conformation, and a closed one, in which the isoalloxazine and adenine rings interact through a stacked conformation. The open conformation gives rise to the fluorescent component of FAD with lifetime ∼2.8 ns, whereas a much faster fluorescence decay (∼4 ps) takes place as a consequence of the photoinduced electron transfer (ET) between adenine and flavin [16,17]. The conformational changes experienced by the molecule during the lifetime of the excited states accounts for an intermediate lifetime component of ∼0.3 ns.
In flavins, photoinduced ET from adenine to excited ISO competes with the reductive ET mechanism that involves tyrosine and tryptophan residues adjacent to ISO. Particularly, X-ray crystallographic structure of GOD showed that four aromatic residues, Tyr515, Trp426, Tyr68, and Trp111, are in close contact with the isoalloxazine moiety of FAD and these residues serve as electron donors in the photoinduced reductive ET [18,19]. With femtosecond resolution, the fluorescence quenching of GOD due to ET with aromatic residues has been investigated and two decay constants of 1.8 ps and 10 ps have been measured [20]. Thus, we can assume three ranges for fluorescence lifetimes in flavins: long (∼2.0–3.0 ns), intermediate (∼300 ps) and short (≤10 ps).
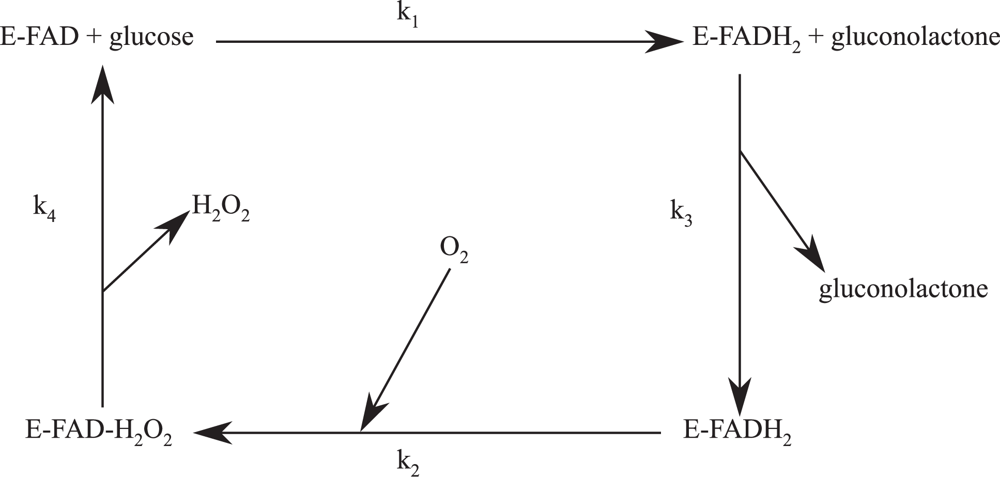
Dynamical changes of FAD fluorescence are exhibited when oxidative processes are induced in GOD by means of glucose interaction [21–23]. In fact, GOD catalyses the oxidation of glucose to gluconic acid through the reaction:
The chemical reduction of FAD to FADH2 should affect the reductive photoinduced ET interaction with the surrounding aromatic residues. The glucose and oxygen concentrations and the induced change of the pH environment could contribute to alter the usual equilibrium between the normal and closed conformations of FAD, thus causing a change in the fluorescence intensity [24]. In Reference [25] some of us have investigated on the possibility of using that change in GOD immobilised in a silica gel matrix for glucose based biosensor. To this regard, physicochemical and biochemical characterizations of the catalytic matrix have been performed and the intrinsic fluorescence of immobilised GOD has been investigated by steady-state fluorescence measurements. The silica gel matrix has been proved to be a suitable support for optical biosensing owing to its superior optical properties such as high transmittance, reproducibility of GOD fluorescence and absorption spectra after immobilization. Moreover, calibration curves as a function of glucose concentration have been obtained by steady-state measurements with sensitivity and linear calibration range comparable to the other immobilization systems.
However, it has been shown [26] that the use of decay times, as opposed to intensities, is preferred in view of their independence on probe concentrations as well as the intensity fluctuations of the fluorescence signal. Moreover, lifetimes can be measured also in highly scattering media [27,28]. Infact, successful measurements through several layers of chicken skin have been performed, giving a promising issue for glucose sensing in real samples like tissue and blood [29].
In this paper we investigate the dynamic behaviour of interactions between free GOD and glucose and the modifications occurring when GOD is immobilized in the silica gel matrix used in Reference [25]. We use time-resolved fluorescence for accurate measurements of fractional intensities and lifetimes as sensitive parameters to the enzymatic reaction of GOD with glucose and we show that it is possible to achieve improvements of the performances of the sensing system.
The outline of the paper is the following. In Section 2 we describe the materials and methods adopted to realize sol-gel matrices that immobilize GOD. Experimental setup used for steady-state and time-resolved measurements are also reported together with the multi-exponential model adopted to analyse decay curves. Steady state and time-resolved fluorescence measurements for free GOD without and with glucose are discussed in Section 3.1, and experimental results for immobilised GOD are analysed in Section 3.2. Moreover, steady-state and temporal profiles for free and immobilised cases are compared. In Section 3.3 the fractional intensities of lifetime components are retrieved by means of a fitting procedure and their behaviour are analysed for obtaining calibration curves as a function of glucose concentration. To conclude, the analytical performance of the proposed sensing system is compared with that of various GOD based optical biosensors in terms of the immobilization support, detection method, stability, linear range and detection limits.
2. Materials and Methods
2.1. Materials
All chemicals were purchased from Sigma (Sigma Italia, Milan, Italy), with the exception of tetramethoxysilane (TMOS) and glucose oxidase (GOD), which were purchased from Fluka (Fluka Italia, Milan, Italy). In this study glucose oxidase (GOD, EC 1.1.3.4) from Aspergillus niger (154 U mg1) was used.
2.2. Methods
2.2.1. Preparation of the Catalytic Sol-Gel Matrices
Silica gel matrices were prepared, as described in a previous paper [9], by rapid mixing 800 μL of solution A with 800 μL of solution B in a polymethylmethacrylate cell. Solution A was obtained by slowly mixing (for 1 h at 4 °C) TMOS (1,550 μL) with H2O (450 μL) plus 40 mM HCl (30 μL). Solution B contained 0.1 M phosphate buffer at pH 6.5. The A and B solution mixture (1,600 μL) was poured into a polymethylmethacrylate cell that was sealed with paraffin film and placed horizontally until the gel was formed. To avoid cracking in the formed gel, the cell was filled with 0.1 M phosphate buffer at pH 6.5 and stored overnight in a refrigerator at 4 °C. The day after, the silica gel layer was removed from the cell and was ready for use. The catalytic gel was obtained with solution B containing an additional 20 mg/mL of GOD in 0.1 M phosphate buffer at pH 6.5.
Generally, the retention of GOD activity after entrapment in silica gel is very low since the entrapment of GOD changes the properties of the enzyme, especially its stability [30]. The change in the properties of the enzyme inside the gel is due to the change in its conformation leading sometimes to a denaturation of protein, restriction of molecule motion and lower accessibility of the entrapped enzyme by the substrate [14]. The changes of protein conformation and dynamic motion inside the gel are caused by interactions of the molecule with silica surface inside the pores and different micro-environment. As a result, the activity of the entrapped enzyme is typically lower and the stability can either be decreased or increased depending on the composition of the gel [14]. The properties of GOD immobilised in the proposed silica gel have been extensively investigated in Reference [25]. It results an apparent value of Michaelis–Menten constant larger than that obtained for free GOD as a result of its lower activity. Moreover, the investigations have evidenced a high catalytic stability of the gel since only a decrease of about 2% for the absorbance spectrum has been observed after 60 days. In the following all the measurements have been performed at room temperature.
2.2.2. Steady-State Fluorescence Measurements
The emission fluorescence spectra have been collected by means of a spectrofluorimeter (model LS 55, Perkin-Elmer), by using as light source a Xenon discharge lamp with an emission spectrum ranging from 200 to 800 nm. Sample excitation was performed at 450 nm, while the emission spectrum was recorded in the range 480–580 nm. The spectra have been acquired with entrance and exit slit fixed at 5 nm and with a scan speed of 100 nm s−1.
2.2.3. Time-Resolved Fluorescence Measurements
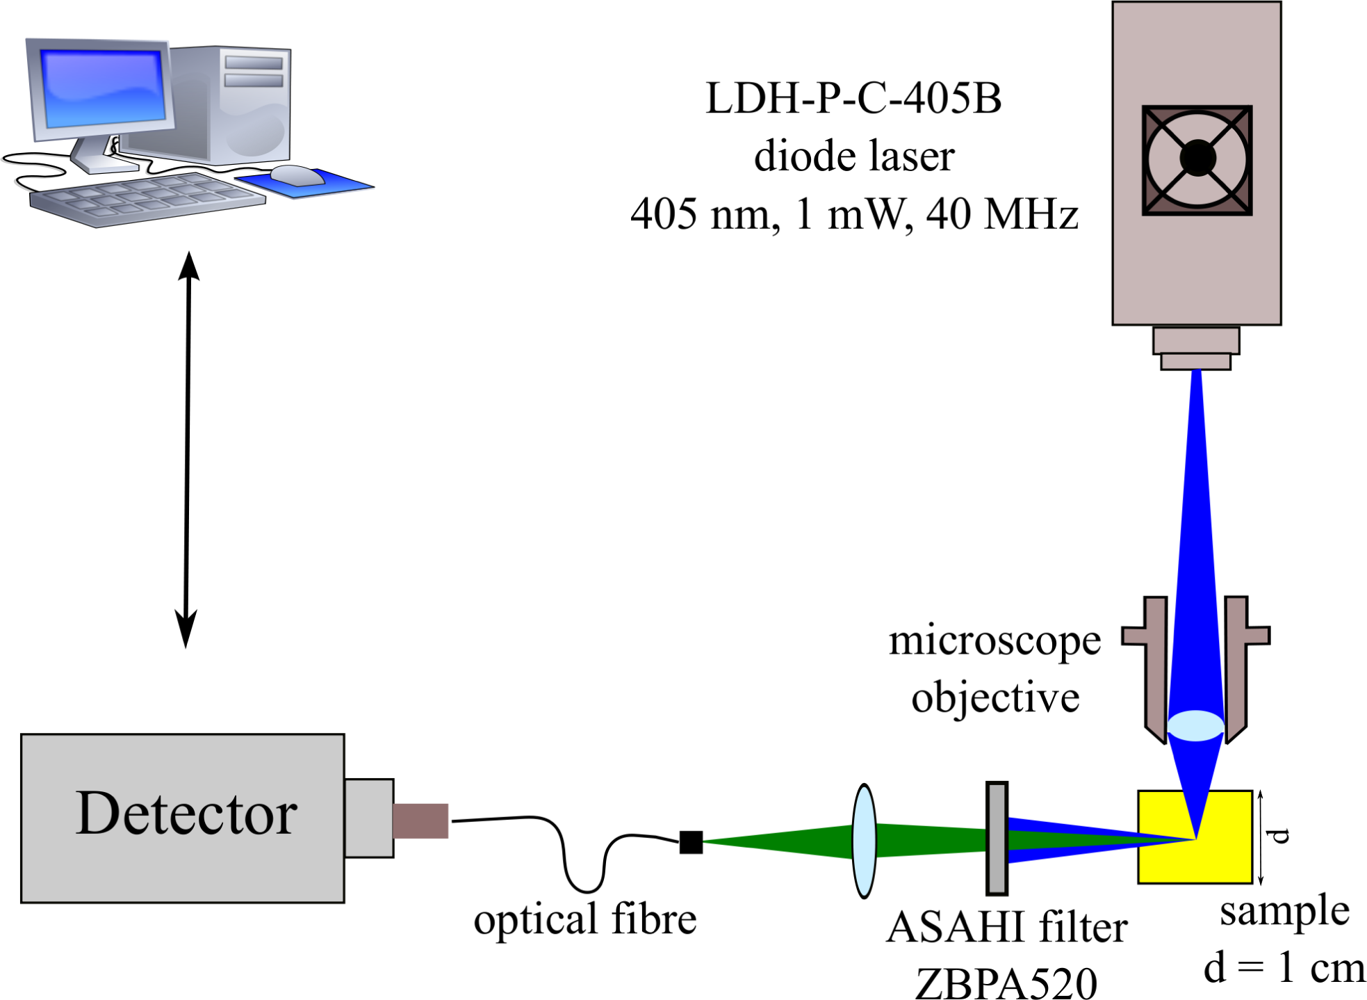
Time-resolved fluorescence experiments were carried out using the experimental setup shown in Figure 3.
Excitation for the solution was provided by a picosecond diode laser (Picoquant, LDH-P-C-405B) emitting pulses at repetition rate of 40 MHz and a wavelength of 405 nm, close to the absorption maximum of the first electronic transition of the bound flavin. The laser beam was focused into a 10 mm sample cell by a simple microscope objective lens. The fluorescence light was detected at 90° to the incident light beam to minimize the amount of transmitted or reflected beam light reaching the detector. An Asahi ZBPA520 bandpass filter blocks the residual laser beam and allows only radiation with a wavelength of 520 ± 10 nm to reach the detector, that is a wavelength range close to the maximum of fluorescence emission spectrum of GOD. The detection apparatus was composed of a fast multichannel plate photomultiplier tube (MCP-PMT) (R4110U-05-F008aA, Hamamatsu, Tokyo, Japan) and a time-correlated single-photon counting (TCSPC) electronics (SPC300, Becker and Hickl GmbH, Berlin, Germany). The instrument response function (IRF) determined by TCSPS was about 120 ps FWHM.
Analysis of fluorescence transients was performed through a fitting procedure with a three-exponential model, in agreement with the description of redox reaction proposed in References [16,20]. Effects of the system response have been taken into account by convolving the analytical model with IRF, according to the following expression:
3. Results and Discussion
3.1. Free GOD
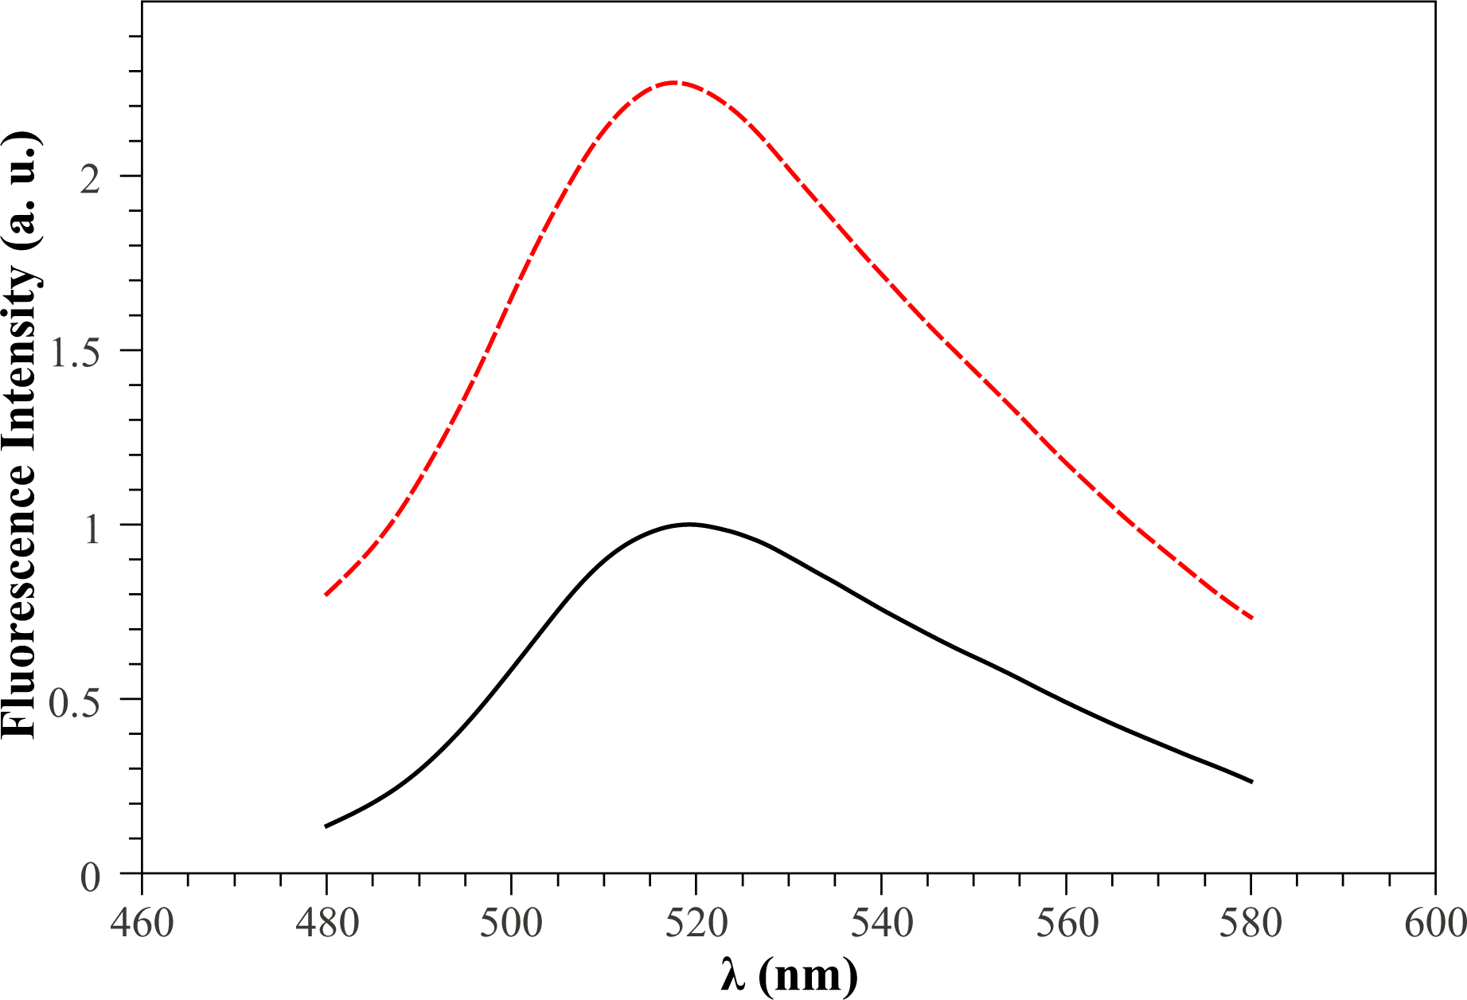
As a preliminary step we examined the steady-state fluorescence properties of free GOD and the changes induced by glucose addition. According to the results reported in Reference [31], the maximum of the fluorescence emission of free GOD was at 520 nm when the excitation is at 450 nm. Generally, the effect of glucose addition is to increase the peak value and the area of the fluorescence intensity emission spectrum, since reduced and oxidized flavins (FADH2 and FAD) exhibit different fluorescent properties [24]. Figure 4 shows, as an example, the fluorescence emission spectra of soluble GOD in absence (black solid curve) and in the presence of 1 mM glucose concentration (red dotted curve). It can be clearly seen that the inclusion of glucose results in a fluorescence peak value that almost doubles with a corresponding increase of the integral area under the spectrum.
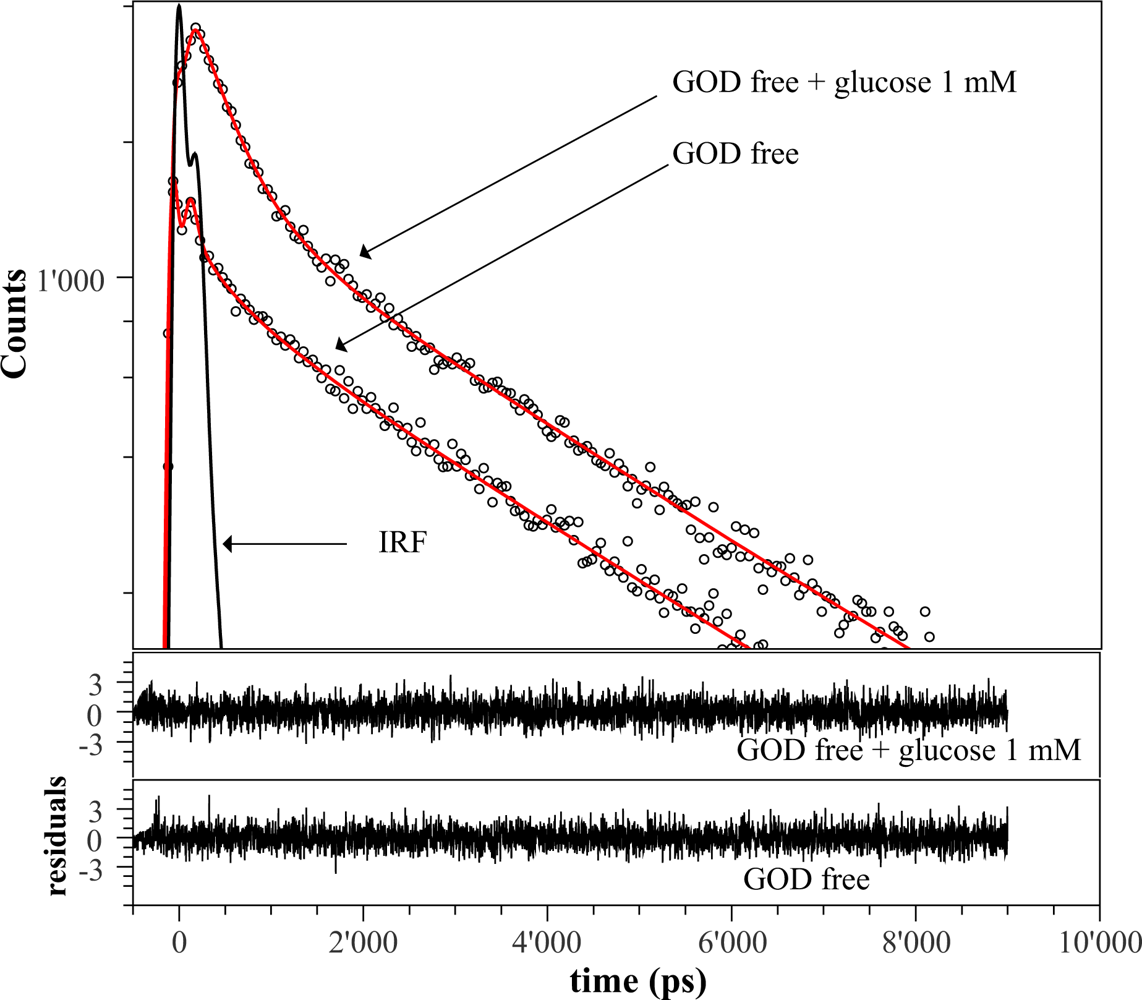
A better understanding of the fluorescence intensity enhancement is given by time-resolved measurements. To this regard, we have plotted in Figure 5 the decays curves (black points) for GOD in absence and in presence of 1 mM glucose concentration. The random distribution of residuals around zero confirms that the observed data can be satisfactorily fitted with the three-exponential model (1) (red solid curves). The estimated parameters are shown in Table 1 and their values are in quite good agreement with results reported in References [16,20] for free GOD.
The sum of fluorescence intensities, , is comparable with intensities of steady-state measurements and increases to about 87% upon glucose addition. In particular, the values of fractional intensities fi reported in Table 1 are clear evidence of a fluorescence quenching of the fast and long component τ1 and τ3. The intensities f1 and f3 change from 0.054 to 0.015 and from 0.88 to 0.76, respectively. Conversely, the intermediate fluorescence component f2 increases from 0.06 to 0.22 accounting for the overall enhancement of the fluorescence intensity as glucose is added into the aqueous solution.
3.2. Immobilized GOD
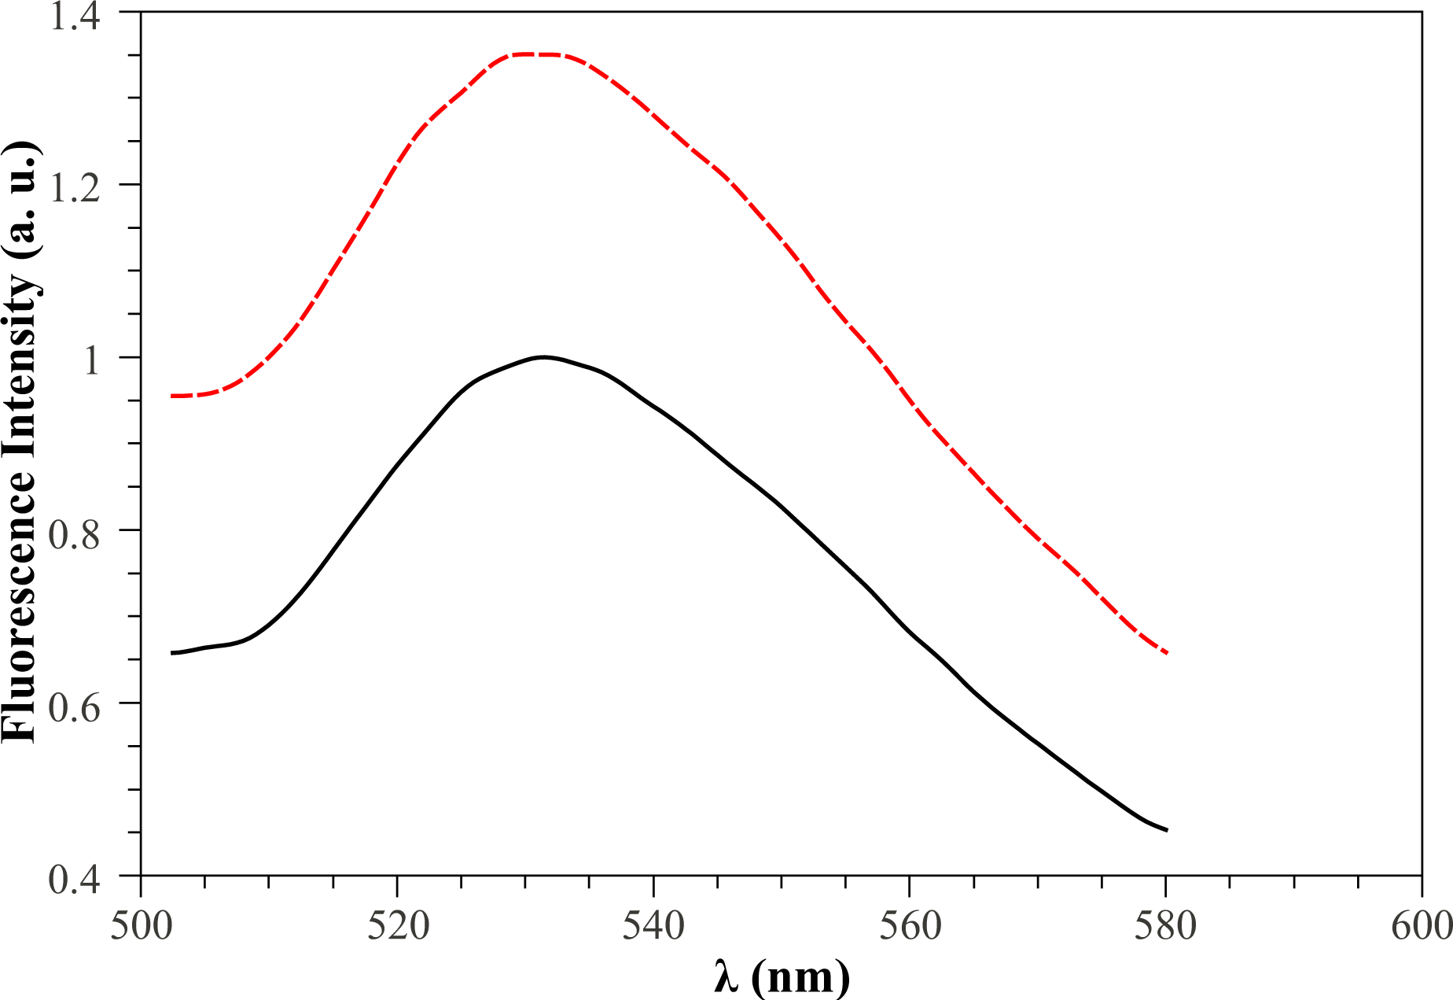
The black curve of Figure 6 represents the fluorescence spectrum of GOD immobilized in a sol gel layer. Also in this case, the presence of glucose in solution has the effect of enhancing the fluorescence intensity as it is evidenced by the red curve shown in Figure 6 where a 2 mM glucose concentration has been considered. Both peaks and integral area under the spectrum increase by about 36%.
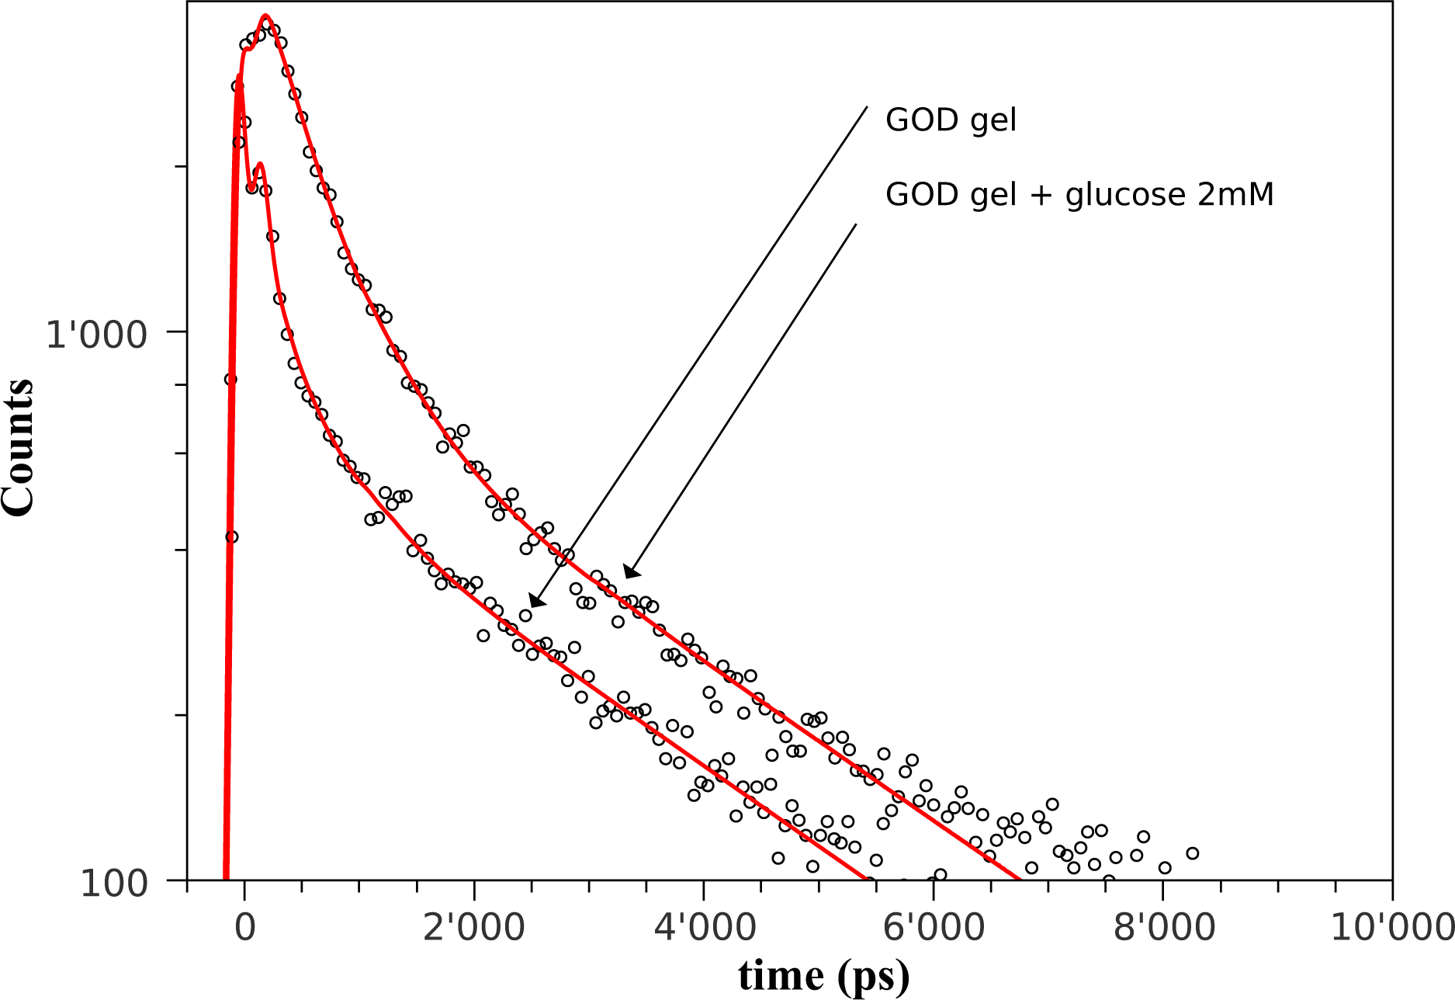
In Figure 7 the theoretical model of Equation (1) (red curves) has been fitted with the fluorescence decay curves (black points) measured in the same experimental conditions of Figure 6.
The results of fitting are reported Table 1 showing that the immobilization matrix affects the relative contribution fi of the three fluorescent components. In particular, the first two components, τ1 and τ2, increase their fractional intensity to the detriment of the long fluorescence lifetime component τ3. It is worth noticing that the inclusion of glucose leads to the same qualitative effects observed in free GOD, i.e., (i) an increase of the total fluorescence intensity, and (ii) a quenching of the fast and slow fluorescence components to the benefit of the intermediate one.
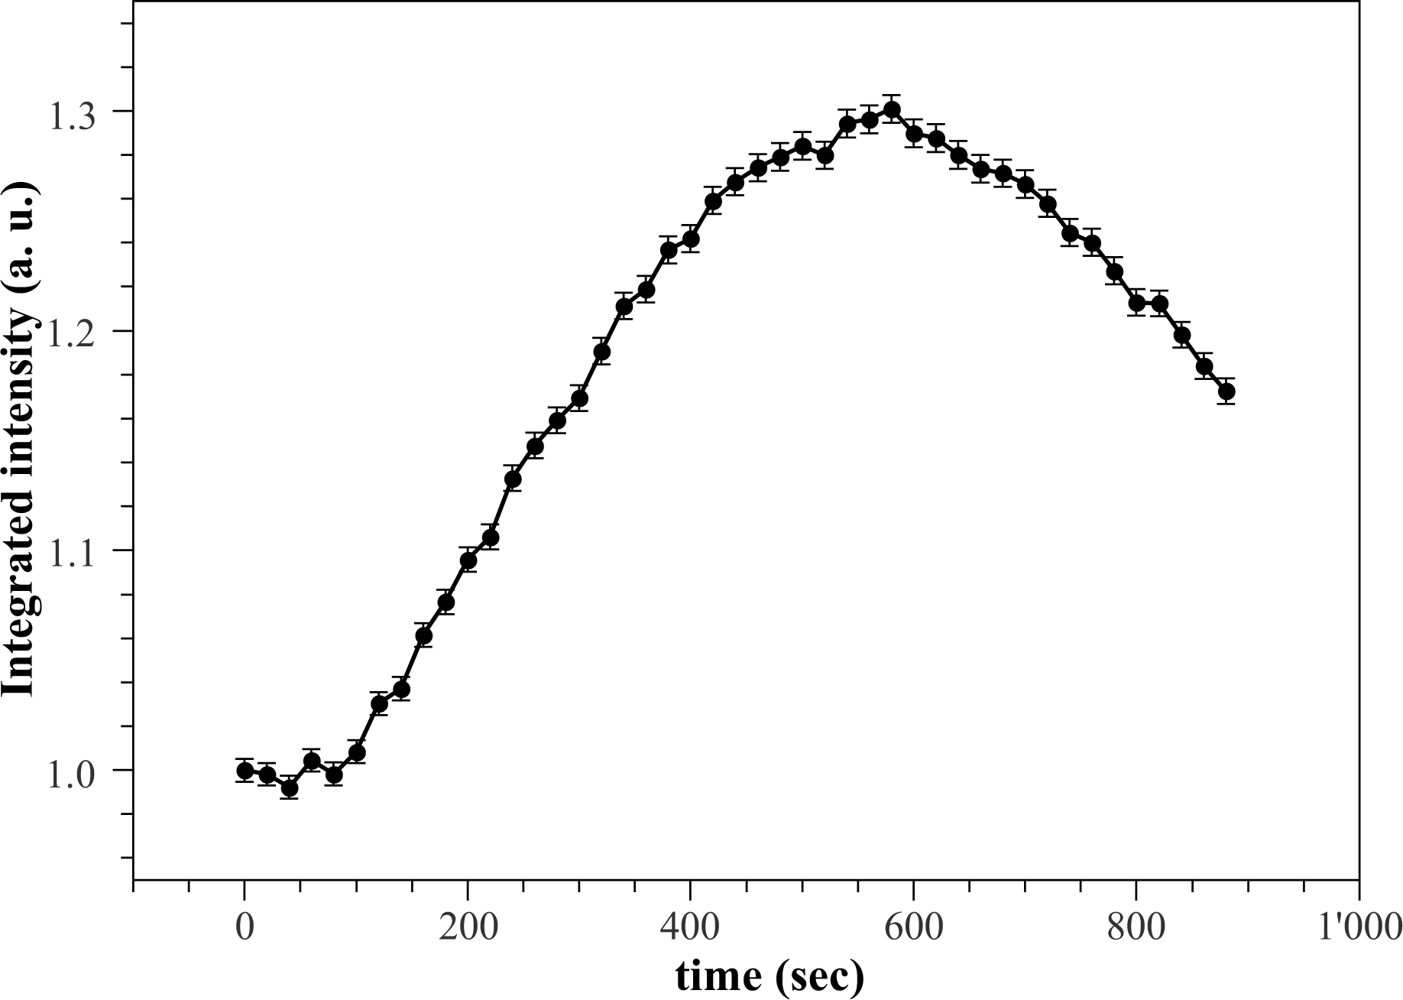
Actually, the fluorescence enhancement lasts until the reaction cycle of Figure 2 takes place. To this regard, changes in fluorescence decay caused by the enzymatic reaction upon the addition of 2 mM glucose concentration, were monitored every 20 s with acquisition time of 20 s. The integral area of decay curves have been normalized to the value observed before the enzymatic reaction starts. Figure 8 shows the normalized data as a function of reaction time. The total fluorescence intensity initially remains constants and after some time it increases gradually to a maximum value of about 30% greater than that obtained in free GOD condition. Then, the fluorescence intensity tends to decrease gradually. Similar behaviour has been observed at any glucose concentration and has been extensively discussed in Reference [21]. This behaviour has been ascribed to the kinetics of the process, in particular to the reoxidation of FADH2. The reoxidation process proceeds at a constant rate greater than that at which the solution takes up O2 from the surrounding atmosphere (mass transfer). Initially, the reaction involves a net uptake of O2, since the mass transfer rate is very low and catalyse produces only one-half of the oxygen consumed. As the reaction proceeds, the glucose concentration and the O2 uptake decrease. The mass transfer rate becomes significant and eventually equals the oxygen uptake rate, so a steady state is reached, after which the mass transfer rate exceeds the uptake rate, and the concentration of dissolved O2 increases gradually. While the oxidation kinetics of FADH2 exceeds its production rate, the predominant species will be FAD and the fluorescence intensity remains constant at the beginning. As the concentration of dissolved O2 decreases, so it does the rate of FAD regeneration. Below a given level, FADH2 becomes the predominant species and the fluorescence intensity increases. The opposite process takes place when the concentration of O2 starts to rise again by mass transfer.
The range of the maximum fluorescence intensity is flat enough to allows us to measure decay curves at constant intensity; thus, in silica gel we always refer to lifetime measurements carried out at the maximum intensity.
3.3. Calibration Curves through Decay Curves Parameters
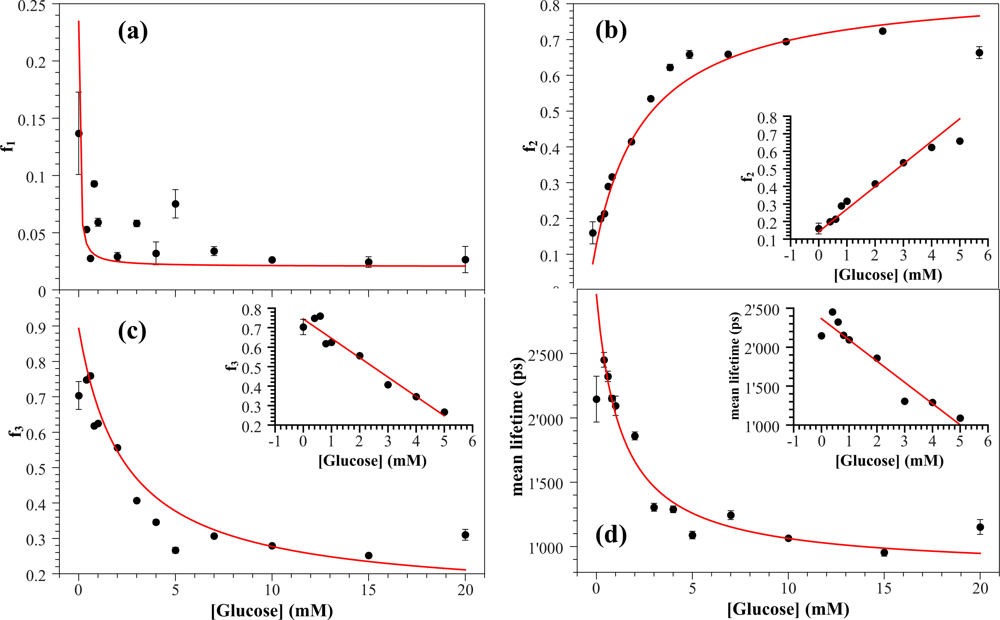
In Figure 9, fractional fluorescence intensities fi of each lifetime component and the mean lifetime τ̄, retrieved from fitting with decay curves, have been reported as a function of glucose concentration.
In each panel, data exhibit a Michaelis–Menten type behaviour well described by the following expression:
The sign (−) in Equation (4) has been used for fitting f1, f3 and τ̄ (panels a, c, and d in Figure 9), whereas the sign (+) has been used for f2 (panel b in Figure 9). The decrease of the mean lifetime τ̄ with the glucose concentration (panel d) can be ascribed to the dynamical fluorescence quenching of the neutral form of FAD caused by the excited-state isomerisation from fluorescent form to non-fluorescent form [32–34].
Fitting of Equation (4) with the data reported in Figure 9 (red curves) allows us to estimate the values for Ky and ysat, i.e., the optokinetic parameters [31], reported in Table 2. It can be observed that the values of Michaelis–Menten constants Ky estimated from decay curves are in agreement with the ones reported in the References [23,25,31]. Particularly, the estimates retrieved from the intermediate and long fluorescence components, f2 and f3, are very close to the values for free GOD measured by normalised reaction rates [25].
The inset in panels b–d of Figure 9 shows the range over which we have a linear relationship between the parameter y of the decay curves and the glucose concentration C:
The analytical performance of various GOD based optical biosensors is summarised in Table 3 in terms of the immobilization support, detection method, stability, linear range and detection limits. Compared to systems making use of exogenous fluorophore and exhibiting similar linear ranges [35,36], the sensing system proposed here is characterized by higher stability and slightly lower value of LOD. On the opposite our system is expected to have a lower cost in design and synthesis since it is based on the intrinsic fluorescence of GOD.
4. Conclusions
We have presented and described a glucose sensing system that makes use of a monolithic silica gel matrix for entrapping glucose oxidase. The dynamical changes of FAD fluorescence occurring during the enzymatic reaction of GOD with glucose have been investigated by time-resolved spectroscopy. The decay curves are well described by three-exponential model (τ1, τ2 and τ3 being the fast, intermediate and long fluorescent lifetime, respectively) whose fractional intensities are strongly dependent on the glucose concentration. We have found that the overall enhancement of the fluorescence intensity observed after the glucose addition is due to the increase of the intermediate fluorescence component τ2 that results from the change of the equilibrium between open and closed conformations caused by the chemical reduction of FAD to FADH2. This hypothesis is confirmed by the fluorescence quenching of the fast and long components τ1 and τ3. Fluorescence quenching also indicates that the chemical reduction of FAD affects the photoinduced electron transfer with the surrounding aromatic residues.
Since the fractional intensities and mean lifetime are parameters strongly sensitive to the enzymatic reaction of GOD with glucose, they have been used to obtain calibration curves in view of possible application to biosensing. We have shown that the time resolved fluorescence can lead to LOD as low as 0.17 mM and provides a linear response from 0.4 mM to 5 mM. Compared to GOD based optical biosensor which makes use of exogenous fluorophore and have similar linear ranges, the proposed sensing system provides higher stability and slightly lower value of LOD. Moreover, it also has a lower cost in design and synthesis since it relies on the intrinsic fluorescence of GOD.
References
- Wolfbeis, OS. Fluorescence Methods And Applications: Spectroscopy, Imaging, and Probes: Spectroscopy, Imaging, and Probes; Wiley-Blackwell: Regensburg, Germany, 2008. [Google Scholar]
- Kraayenhof, R; Visser, A; Gerritsen, H; Wolfbeis, O. Fluorescence Spectroscopy, Imaging and Probes; Springer-Verlag: Heidelberg, Germany, 2002. [Google Scholar]
- McShane, MJ. Potential for Glucose Monitoring with Nanoengineered Fluorescent Biosensors. Diabet. Tech. Therap 2002, 4, 533–538. [Google Scholar]
- Srivastava, R; Brown, JQ; Zhu, H; McShane, MJ. Stable Encapsulation of Active Enzyme by Application of Multilayer Nanofilm Coatings to Alginate Microspheres. Macromol. Biosci 2005, 5, 717–727. [Google Scholar]
- Brown, JQ; Srivastava, R; Zhu, H; McShane, MJ. Enzymatic Fluorescent Microsphere Glucose Sensors: Evaluation of Response Under Dynamic Conditions. Diabet. Technol. Therap 2006, 8, 288–295. [Google Scholar]
- Chinnayelka, S; McShane, MJ. Glucose-Sensitive Nanoassemblies Comprising Affinity-Binding Complexes Trapped in Fuzzy Microshells. J. Fluorescence 2004, 15, 585–595. [Google Scholar]
- Brown, JQ; McShane, MJ. Modeling of Spherical Fluorescent Glucose Microsensor Systems: Design of Enzymatic Smart Tattoos. Biosens. Bioelect 2006, 21, 1760–1769. [Google Scholar]
- Koo, YEL; Cao, Y; Kopelman, R; Koo, SM; Brasuel, M; Philbert, MA. Real-Time Measurements of Dissolved Oxygen Inside Live Cells by Organically Modified Silicate Fluorescent Nanosensors. Anal Chem 2004, 76, 2498–2505. [Google Scholar] [CrossRef]
- Kuswandi, B; Andres, R; Narayanaswamy, R. Optical Fibre Biosensors Based on Immobilised Enzymes. Analyst 2001, 126, 1469–1491. [Google Scholar]
- Foo, Y. Enzyme Kinetics: A Modern Approach by Alejandro G MarangoniJohn Wiley & Sons, Inc, New York, NY, USA, Hardcover, 244 pp; $89.95;. ISBN 0-471-15985-9Clin Chem2003, 49, 838. [CrossRef]
- Cao, L; Schmid, Rolf, D. Carrier-Bound Immobilized Enzymes; Wiley-VCH Verlag GmbH & Co. KGaA: Weinheim, Germany, 2005. [Google Scholar]
- Pierre, AC. The Sol-Gel Encapsulation of Enzymes. Biocatal. Biotransform 2004, 22, 145–170. [Google Scholar]
- Mac Craith, B; Mc Donagh, C; McEvoy, A; Butler, T; O’Keeffe, G; Murphy, V. Optical Chemical Sensors Based on Sol-Gel Materials: Recent Advances and Critical Issues. J. Sol-Gel Sci. Technol 1997, 8, 1053–1061. [Google Scholar]
- Jin, W; Brennan, JD. Properties and Applications of Proteins Encapsulated within Sol-Gel Derived Materials. Anal. Chim. Acta 2002, 461, 1–36. [Google Scholar]
- Hecht, HJ; Kalisz, HM; Hendle, J; Schmid, RD; Schomburg, D. Crystal Structure of Glucose Oxidase from Aspergillus Niger Refined at 23Å Reslution. J. Mol. Biol 1993, 229, 153–172. [Google Scholar]
- Stanley, R; MacFarlane, A. Ultrafast Excited State Dynamics of Oxidized Flavins: Direct Observations of Quenching by Purines. J. Phys. Chem. A 2000, 104, 6899–6906. [Google Scholar]
- van den Berg, P; Feenstra, K; Mark, A; Berendsen, H; Visser, A. Dynamic Conformations of Flavin Adenine Dinucleotide: Simulated Molecular Dynamics of the Flavin Cofactor Related to the Time-Resolved Fluorescence Characteristics. J. Phys. Chem. B 2002, 106, 8858–8869. [Google Scholar]
- Gerd, W; Susanne, W; Jörg, H; Dietmar, S; M, KH; Hans-Jürgen, H. A Resolution Structures of the Penicillium Amagasakiense and Aspergillus Niger Glucose Oxidases as a Basis for Modelling Substrate Complexes. Acta Crystallograph. Sect. D 1999, 55, 969–977. [Google Scholar]
- Fujiwara, A; Mizutani, Y. Photoinduced Electron Transfer in Glucose Oxidase: A Picosecond Time-Resolved Ultraviolet Resonance Raman Study. J. Raman Spectroscopy 2008, 39, 1600–1605. [Google Scholar]
- Zhong, D; Zewail, AH. Femtosecond Dynamics of Flavoproteins: Charge Separation and Recombination in Riboflavine (Vitamin B2)-Binding Protein and in Glucose Oxidase Enzyme. Proc. Nat. Acad. Sci. USA 2001, 98, 11867–11872. [Google Scholar]
- Sierra, JF; Galbàn, J; Castillo, JR. Determination of Glucose in Blood Based on the Intrinsic Fluorescence of Glucose Oxidase. Anal Chem 1997, 69, 1471–1476. [Google Scholar] [CrossRef]
- Haouz, A; Twist, C; Zentz, C; de Kersabiec, A; Pin, S; Alpert, B. Forster Energy Transfer from Tryptophan to Flavin in Glucose Oxidase Enzyme. Chem. Phys. Lett 1998, 294, 197–203. [Google Scholar]
- De Luca, P; Lepore, M; Portaccio, M; Esposito, R; Rossi, S; Bencivenga, U; Mita, D. Glucose Determination by Means of Steady-State and Time-Course UV Fluorescence in Free or Immobilized Glucose Oxidase. Sensors 2007, 7, 2612–2625. [Google Scholar]
- Trettnak, W; Wolfbeis, OS. Fully Reversible Fibre-Optic Glucose Biosensor Based on the Intrinsic Fluorescence of Glucose Oxidase. Anal. Chim. Acta 1989, 221, 195–203. [Google Scholar]
- Portaccio, M; Lepore, M; Della Ventura, B; Stoilova, O; Manolova, N; Rashkov, I; Mita, D. Fiber-Optic Glucose Biosensor Based on Glucose Oxidase Immobilised in a Silica Gel Matrix. J. Sol-Gel Sci. Technol 2009, 50, 437–448. [Google Scholar]
- Tolosa, L; Malak, H; Raob, G; Lakowicz, J. Optical Assay for Glucose Based on the Luminescence Decay Time of the Long Wavelength Dye Cy5 (TM). Sens. Actuat. B Chem 1997, 45, 93–99. [Google Scholar]
- Szmacinski, H; Lakowicz, J. Fluorescence Lifetime-Based Sensing and Imaging. Sens. Actuat. B Chem 1995, 29, 16–24. [Google Scholar]
- Hutchinson, C; Lakowicz, J; Sevickmuraca, E. Fluorescence Lifetime-Based Sensing in Tissues—A Computational Study. Biophys. J 1995, 68, 1574–1582. [Google Scholar]
- Bambot, S; Rao, G; Romauld, M; Carter, G; Sipior, J; Terpetchnig, E; Lakowicz, J. Sensing Oxygen through Skin Using a Red Diode-Laser and Fluorescence Lifetimes. Biosens. Bioelect 1995, 10, 643–652. [Google Scholar]
- Wolfbeis, OS; Oehme, I; Papkovskaya, N; Klimant, I. Sol-Gel Based Glucose Biosensors Employing Optical Oxygen Transducers, and a Method for Compensating for Variable Oxygen Background. Biosens. Bioelect 2000, 15, 69–76. [Google Scholar]
- Lepore, A; Portaccio, M; De Tommasi, E; De Luca, P; Bencivenga, U; Maiuri, P; Mita, D. Glucose Concentration Determination by Means of Fluorescence Emission Spectra of Soluble and Insoluble Glucose Oxidase: Some Useful Indications for Optical Fibre-Based Sensors. J. Mol. Catal. B Enzy 2004, 31, 151–158. [Google Scholar]
- Drossler, P; Holzer, W; Penzkofer, A; Hegemann, P. Fluoresence Quenching of Riboflavin in Aqueous Solution by Methionin and Cystein. Chem. Phys 2003, 286, 409–420. [Google Scholar]
- Lakowicz, JR. Principles of Fluorescence Spectroscopy, 2nd ed; Kluwer Academic/Plenum: New York, NY, USA, 1999; and the bibliographical references and index therein. [Google Scholar]
- Valeur, B. Molecular Fluorescence: Principles and Applications; Wiley-VCH: Weinheim, Germany, 2002; and the bibliographical references and index therein. [Google Scholar]
- Wang, X; Chen, H; Zhou, T; Lin, Z; Zeng, J; Xie, Z; Chen, X; Wong, K; Chen, G; Wang, X. Optical Colorimetric Sensor Strip for Direct Readout Glucose Measurement. Biosens. Bioelect 2009, 24, 3702–3705. [Google Scholar]
- Odaci, D; Gacal, B; Gacal, B; Timur, S; Yagci, Y. Fluorescence Sensing of Glucose Using Glucose Oxidase Modified by PVA-Pyrene Prepared via “Click” Chemistry. Biomacromolecules 2009, 10, 2928–2934. [Google Scholar]
- Ozturk, G; Timur, S; Alp, S. Optical Determination of Glucose with Glucose Oxidase Immobilized in PVC together with Fluorescent Oxazol-5-One Derivatives. Anal. Lett 2008, 41, 608–618. [Google Scholar]
- Wang, X; Zhou, T; Chen, X; Wong, K; Wang, X. An Optical Biosensor for the Rapid Determination of Glucose in Human Serum. Sens. Actuat. B Chem 2008, 129, 866–873. [Google Scholar]
- Chang, G; Tatsu, Y; Goto, T; Imaishi, H; Morigaki, K. Glucose Concentration Determination Based on Silica Sol-Gel Encapsulated Glucose Oxidase Optical Biosensor Arrays. Talanta 2010, 83, 61–65. [Google Scholar]


| GOD free | GOD free + 1 mM glucose | GOD immobilized | GOD immobilized + 2 mM glucose | |
|---|---|---|---|---|
| α1 | 0.031 ± 0.004 | 0.02 ± 0.01 | 0.08 ± 0.01 | 0.037 ± 0.006 |
| α2 | 0.035 ± 0.004 | 0.230 ± 0.003 | 0.094 ± 0.01 | 0.476 ± 0.006 |
| α3 | 0.490 ± 0.003 | 0.790 ± 0.003 | 0.4 ± 0.01 | 0.643 ± 0.005 |
| ∑ αi | 0.556 | 1.04 | 0.574 | 1.156 |
| τ1 (ps) | 3 ± 1 | 2 ± 1 | 8 ± 3 | 4 ± 2 |
| τ2 (ps) | 550 ± 60 | 401 ± 8 | 380 ± 70 | 450 ± 7 |
| τ3 (ps) | 3, 120 ± 40 | 3, 061 ± 28 | 2, 960 ± 190 | 3, 010 ± 50 |
| τ̄ (ps) | 2,784 | 2,413 | 2,126 | 1,860 |
| f1 | 0.054 | 0.015 | 0.14 | 0.029 |
| f2 | 0.06 | 0.22 | 0.16 | 0.41 |
| f3 | 0.88 | 0.76 | 0.70 | 0.56 |
| f1 | f2 | f3 | τ̄ | |
|---|---|---|---|---|
| K(mM) | 0.042 ± 0.008 | 2.54 ± 0.06 | 2.40 ± 0.06 | 1.3 ± 0.1 |
| ysat | 0.21 ± 0.03 | 0.781 ± 0.002 | 0.764 ± 0.001 | 2140 ± 70 ps |
| Sy | 0.133 ± 0.001 mM−1 | 0.128 ± 0.001 mM−1 | 280 ± 7 ps mM−1 | |
| Linearity (mM) | 0.4–5 | 0.4–5 | 0.4–5 |
| Immobilization support | Transducer | Stability | Linearity (mM) | LoD (mM) | References |
|---|---|---|---|---|---|
| PVC solid film | CPO fluorescence | 30 days | 0.017–0.2 | 0.001 | [37] |
| Sensing film | fluorescence | 30 days | 0–0.5 | 0.0036 | [38] |
| Three-layer film | Qds and PtF20 TPP fluorescence | ? | 0–3 | 0.2 | [35] |
| PVA-Py matrix | pyrene groups fluorescence | 30 days | 0.25–3 | 0.19 | [36] |
| Silica based gels | oxygen sensing film fluorescence | 60 days | 0.1–5 | 0.06 | [39] |
| GOD in silica gel matrix | f2 fluorescence component of FAD | 60 days | 0.4–5 | 0.17 | this paper |
| Silica gel matrix | f3 fluorescence component of FAD | 60 days | 0.4–5 | 0.17 | this paper |
| Silica gel matrix | mean lifetime fluorescence of FAD | 60 days | 0.4–5 | 0.5 | this paper |
| Cuprophane membrane | FAD fluorescence | ? | 2.5–10 | ? | [24] |
| Silica gel matrix | FAD and Tryptophan fluorescence | 60 days | 5–20 | 0.8 | [25] |
© 2011 by the authors; licensee MDPI, Basel, Switzerland. This article is an open access article distributed under the terms and conditions of the Creative Commons Attribution license (http://creativecommons.org/licenses/by/3.0/).
Share and Cite
Esposito, R.; Della Ventura, B.; De Nicola, S.; Altucci, C.; Velotta, R.; Mita, D.G.; Lepore, M. Glucose Sensing by Time-Resolved Fluorescence of Sol-Gel Immobilized Glucose Oxidase. Sensors 2011, 11, 3483-3497. https://doi.org/10.3390/s110403483
Esposito R, Della Ventura B, De Nicola S, Altucci C, Velotta R, Mita DG, Lepore M. Glucose Sensing by Time-Resolved Fluorescence of Sol-Gel Immobilized Glucose Oxidase. Sensors. 2011; 11(4):3483-3497. https://doi.org/10.3390/s110403483
Chicago/Turabian StyleEsposito, Rosario, Bartolomeo Della Ventura, Sergio De Nicola, Carlo Altucci, Raffaele Velotta, Damiano Gustavo Mita, and Maria Lepore. 2011. "Glucose Sensing by Time-Resolved Fluorescence of Sol-Gel Immobilized Glucose Oxidase" Sensors 11, no. 4: 3483-3497. https://doi.org/10.3390/s110403483