Infrared Spectroscopy on Smoke Produced by Cauterization of Animal Tissue

Abstract
:1. Introduction
2. Experimental Section
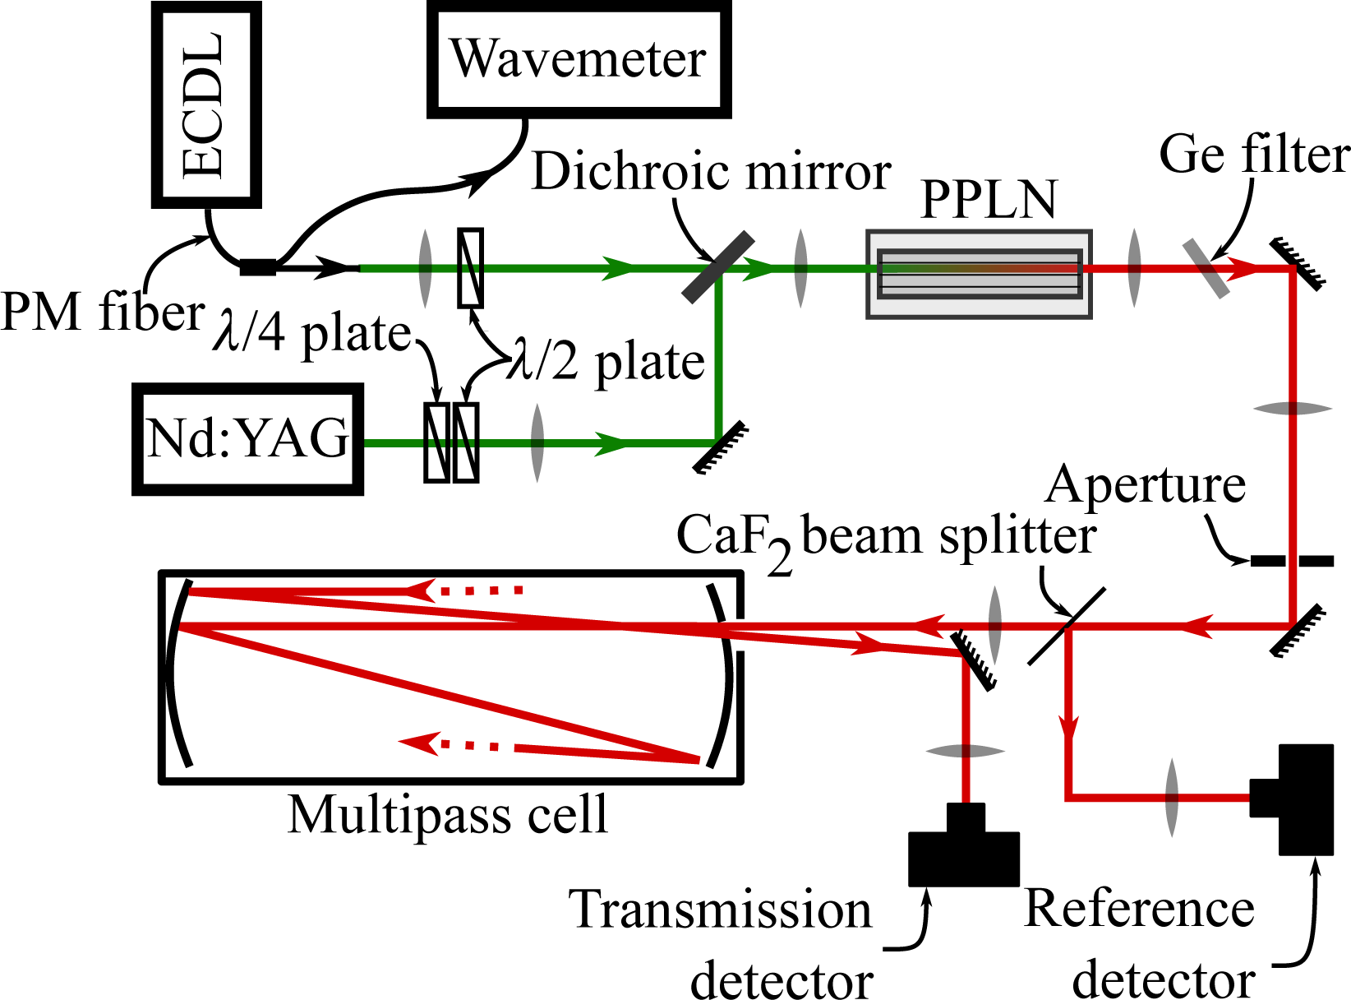
2.1. Laser Spectrometer and FTIR Spectrometer
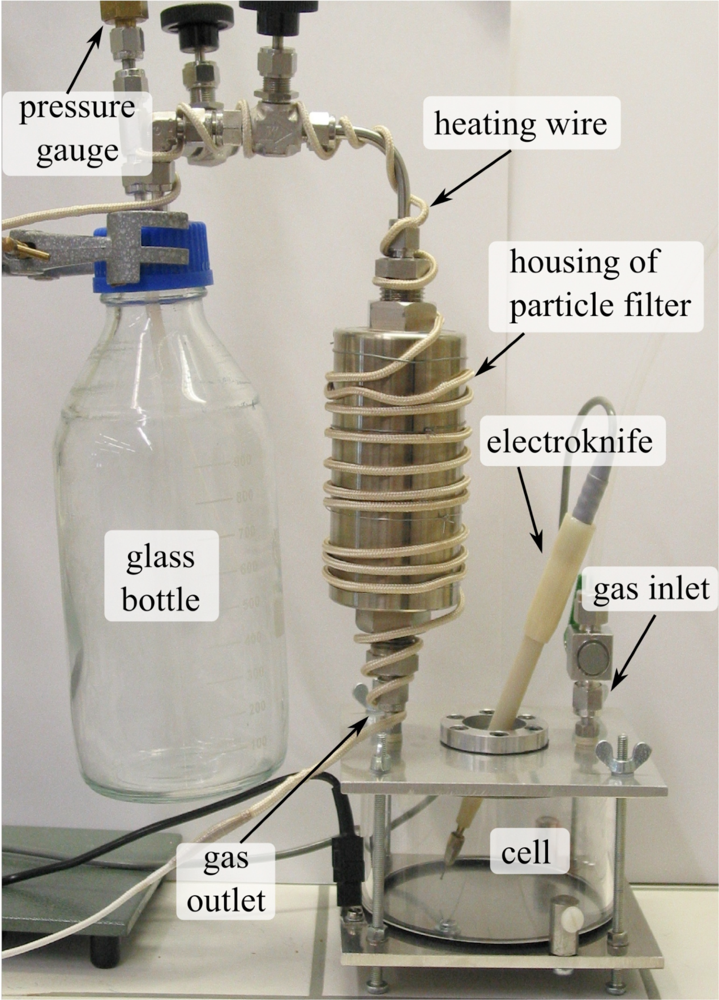
2.2. Preparation of the Smoke Samples
3. Results and Discussion
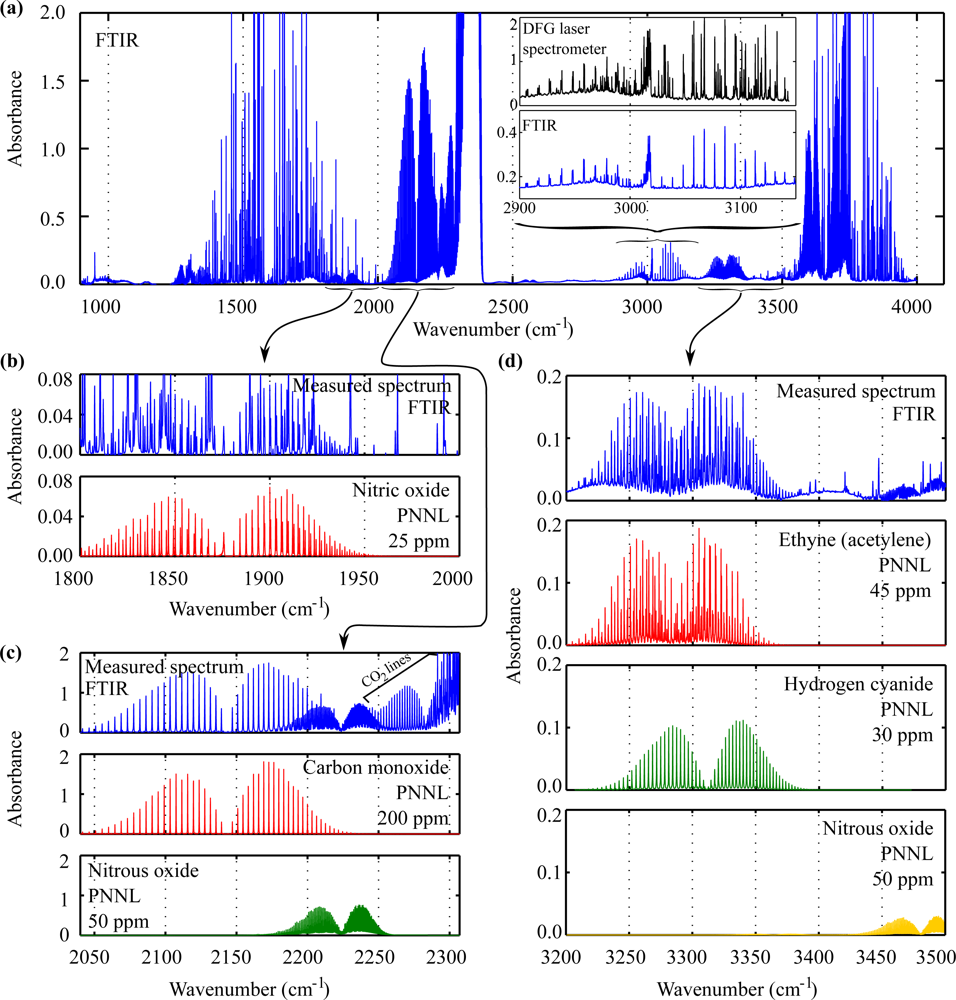
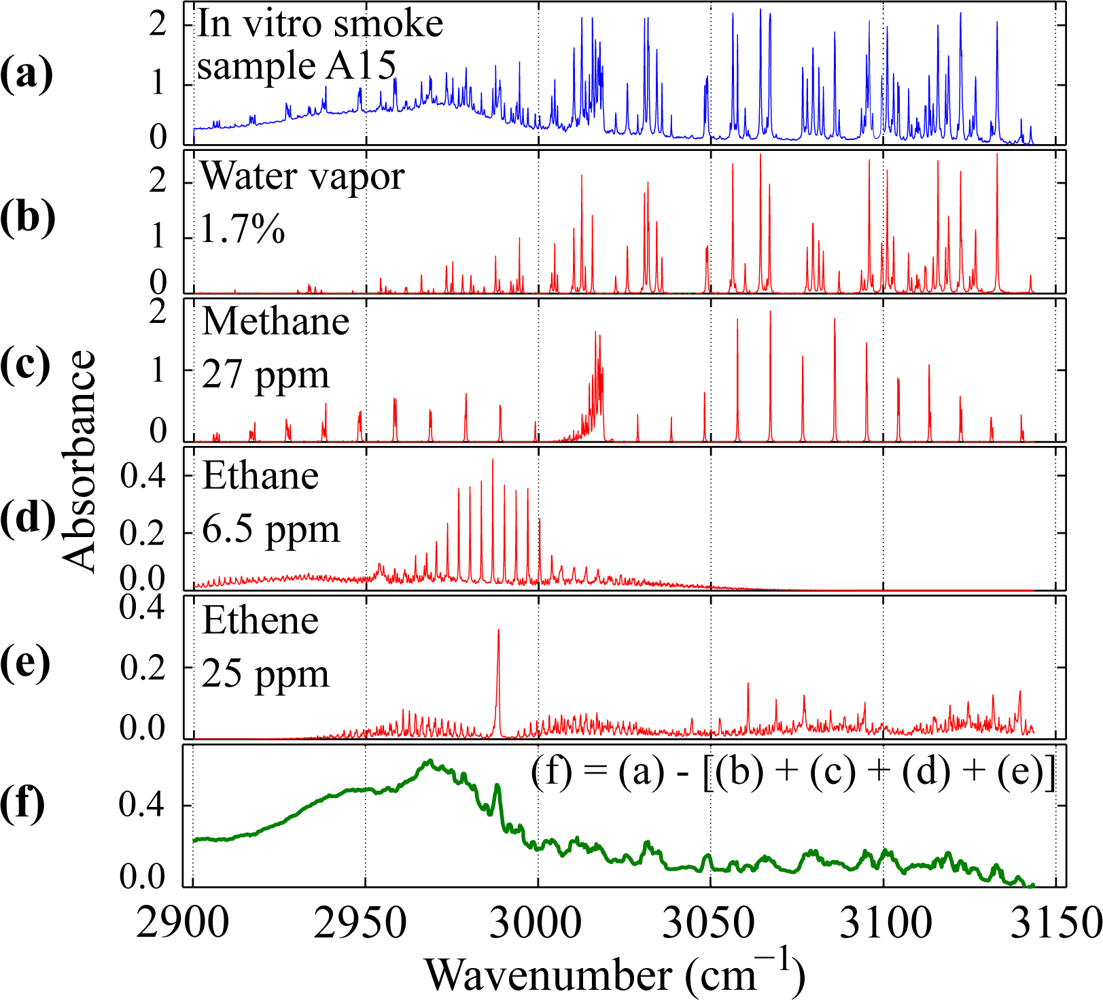
3.1. Quantitative Analysis
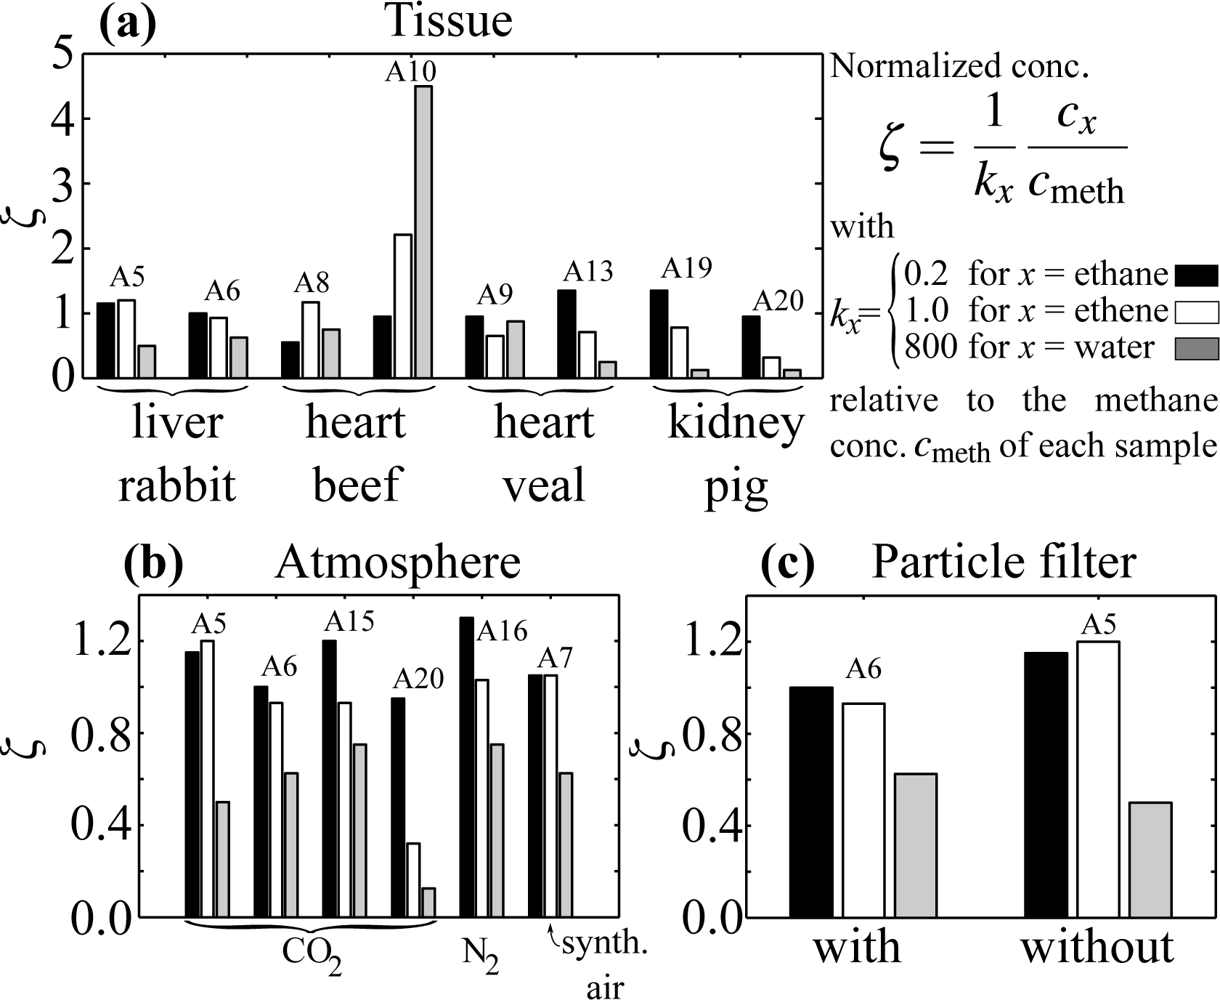
3.2. Correlation Smoke-Tissue and Smoke-Atmosphere
3.3. Detection Thresholds for Undetected Species
4. Conclusions
Acknowledgments
References and Notes
- Freitag, L.; Chapman, G.A.; Sielczak, M.; Ahmed, A.; Russin, D. Laser smoke effect on the bronchial system. Lasers Surg. Med 1987, 7, 283–288. [Google Scholar]
- Gloster, H.M; Roenigk, R.K. Risk of acquiring human papillomavirus from the plume produced by the carbon dioxide laser in the treatment of warts. J. Am. Acad. Dermatol 1995, 32, 436–441. [Google Scholar]
- Alp, E.; Bijl, D.; Bleichrodt, R.P.; Hansson, B.; Voss, A. Surgical smoke and infection control. J. Hosp. Infect 2006, 62, 1–5. [Google Scholar]
- Champault, G.; Taffinder, N.; Ziol, M.; Riskalla, H.; Catheline, J.M.C. Cells are present in the smoke created during laparoscopic surgery. Br. J. Surg 1997, 84, 993–995. [Google Scholar]
- Baggish, M.; Poiesz, B.; Joret, D.; Williamson, P.; Rebai, A. Presence of human immunodeficiency virus DNA in laser smoke. Lasers Surg. Med 1991, 11, 197–203. [Google Scholar]
- Hallmo, P.; Naess, O. Laryngeal papillomatosis with papilloma virus DNA contracted by a laser surgeon. Em. Arch. Otorhinolaryngol 1992, 248, 425–427. [Google Scholar]
- Weld, K.J.; Dryer, S.; Ames, C.D.; Cho, K.; Hogan, C.; Lee, M.; Biswas, P.; Landman, J. Analysis of surgical smoke produced by various energy-based instruments and effect on laparoscopic visibility. J. Endourol 2007, 21, 347–251. [Google Scholar]
- Nezhat, C.; Winer, W.K.; Nezhat, F.; Nezhat, C.; Forrest, D.; Reeves, W.G. Smoke from laser surgery-is there a health-hazard. Lasers Surg. Med 1987, 7, 376–382. [Google Scholar]
- Waesche, W.; Albrecht, H. Investigation of the distribution of aerosoles and VOC in plume produced during laser treatment under OR conditions. Proc. SPIE 1996, 2624, 270–275. [Google Scholar]
- Spleiss, M.; Weber, L.; Meier, T.; Treffler, B. Identification and quantification of selected chemicals in laser pyrolysis products of mammalian tissues. Proc. SPIE 1995, 2323, 409–422. [Google Scholar]
- Francke, W.; Fleck, O.; Mihalache, D.L.; Woellmer, W. Identification of volatile compounds released from biological tissue during CO2 laser treatment. Proc. SPIE 1995, 2323, 423–431. [Google Scholar]
- Krones, C.J.; Conze, J.; Hoelzl, F.; Stumpf, M.; Klinge, U.; Moeller, M.; Dott, W.; Schumpelick, V.; Hollender, J. Chemical composition of surgical smoke produced by electrocautery; harmonic scalpel and argon beaming-a short study. Eur. Sur 2007, 39, 118–121. [Google Scholar]
- Al Sahaf, O.S.; Vega-Carrascal, I.; Cunningham, F.O.; McGrath, J.P.; Bloomfield, F.J. Chemical composition of smoke produced by high-frequency electrosurgery. Irish J. Med. Sci 2007, 176, 229–232. [Google Scholar]
- Rey, J.M.; Schramm., D.; Hahnloser, D.; Marinov, D.; Sigrist, M.W. Spectroscopic investigation of volatile compounds produced during thermal and radiofrequency bipolar cautery on porcine liver. Meas. Sci. Technol 2008, 19, 075602. [Google Scholar]
- Barrett, W.L.; Garber, S.M. Surgical smoke-a review of the literature-Is this just a lot of hot air? Surg. Endosc 2003, 17, 979–987. [Google Scholar]
- Gianella, M.; Sigrist, M.W. Improved algorithm for quantitative analyses of infrared spectra of multicomponent gas mixtures with unknown compositions. Appl. Spectrosc 2009, 63, 338–343. [Google Scholar]
- Bartlome, R.; Rey, J.M.; Sigrist, M.W. Vapor phase infrared laser spectroscopy: From gas sensing to forensic urinalysis. Anal. Chem 2008, 80, 5334–5341. [Google Scholar]
- Bartlome, R.; Sigrist, M.W. Laser-based human breath analysis: D/H isotope ratio increase following heavy water intake. Opt. Lett 2009, 34, 866–868. [Google Scholar]
- Bartlome, R.; Baer, M.; Sigrist, M.W. High-temperature multipass cell for infrared spectroscopy of heated gases and vapors. Rev. Sci. Instrum 2007, 78, 013110. [Google Scholar]
- Menes, T.; Spivak, H. Laparoscopy-Searching for the proper insufflation gas. Surg. Endosc 2000, 14, 1050–1056. [Google Scholar]
- Sharpe, S.W.; Johnson, T.J.; Sams, R.L.; Chu, P.M.; Rhoderick, G.C.; Johnson, P.A. Gas-phase databases for quantitative infrared spectroscopy. Appl. Spectrosc 2004, 58, 1452–1461. [Google Scholar]
- Rothman, L.S.; Jacquemart, D.; Barbe, A; Benner, D.C.; Birk, M; Brown, L.R.; Carleer, M.R.; Chackerian, C.; Chance, K.; Coudert, L.H.; Dana, V.; Devi, V.M.; Flaud, J.M.; Gamache, R.R.; Goldman, A.; Hartmann, J.M.; Jucks, K.W.; Maki, A.G.; Mandin, J.Y.; Massie, S.T.; Orphal, J.; Perrin, A.; Rinsland, C.P.; Smith, M.A.H; Tennyson, J.; Tolchenov, R.N.; Toth, R.A.; Vander Auwera, J.; Varanasi, P.; Wagner, G. The HITRAN 2004 molecular spectroscopic database. J. Quant. Spectrosc. Radiat. Transfer 2005, 96, 139–204. [Google Scholar]
- Hensman, C.; Baty, D.; Willis, R.G.; Cuschieri, A. Chemical composition of smoke produced by high-frequency electrosurgery in a closed gaseous environment-An in vitro study. Surg. Endosc 1998, 12, 1017–1019. [Google Scholar]
- Suva. Grenzwerte am Arbeitsplatz; SUVA: Luzern, Switzerland, 2009. [Google Scholar]


| Concentrations
| ||||||||||||
|---|---|---|---|---|---|---|---|---|---|---|---|---|
| ID | Tissue | Atm. | Δm mg | Filt.a | p mbar | T °C | CH4 ppm | C2H6 ppm | C2H4 ppm | H2O % | Alg. | FTb |
| A05 | liver, rabbit | CO2 | no | 957 | 25 | 15 | 3.5 | 18 | 0.66 | 1 | ||
| A06 | liver, rabbit | CO2 | yes | 956 | 25 | 14 | 2.8 | 13 | 0.69 | 1 | ||
| A07 | liver, rabbit | s.a. | 316.7 | yes | 960 | 25 | 19 | 4.0 | 20 | 0.99 | 1 | |
| A08 | heart, beef | CO2 | yes | 960 | 25 | 6.4 | 0.7 | 7.5 | 0.37 | 1 | ||
| A09 | heart, veal | CO2 | 394.7 | yes | 960 | 25 | 11 | 2.1 | 7.1 | 0.74 | 1 | |
| A10 | heart, beef | CO2 | 769.4 | yes | 967 | 100 | 4.2 | 0.8 | 9.3 | 1.5 | 1 | |
| A11 | heart, pig | CO2 | yes | 900 | 100 | 13 | 3.0 | 19 | 1.3 | 1 | ||
| A12 | loin, beef | CO2 | 292.6 | no | 200 | 100 | 12 | 5.5 | ∼15 | 0.35 | 2 | |
| A13 | heart, veal | CO2 | 269.1 | yes | 300 | 120 | 14 | 3.8 | ≤10 | 0.24 | 2 | |
| A14 | liver, beef | CO2 | 556.1 | yes | 300 | 120 | 17 | 6.3 | ≤10 | 1.2 | 2 | |
| A15 | liver, beef | CO2 | 352.8 | yes | 930 | 25 | 27 | 6.5 | 25 | 1.7 | 1 | |
| A16 | liver, pig | N2 | 669.0 | yes | 930 | 25 | 36 | 9.5 | 37 | 2.3 | 1 | |
| A17 | pig | CO2 | yes | 930 | 25 | 29 | 6.1 | 17 | 1.1 | 1 | * | |
| A19 | kidney, pig | CO2 | 686.3 | yes | 930 | 25 | 41 | 11 | 32 | 0.27 | 1 | * |
| A20 | kidney, pig | CO2 | yes | 930 | 25 | 34 | 6.5 | 11 | 0.49 | 1 | ||
| Average | 20 | 4.8 | 17 | 0.87 | ||||||||
| Min.-Max. | 4.2–41 | 0.7–11 | 7.1–37 | 0.15–2.3 | ||||||||
| Substance | cmin ppm | REL ppm | Substance | cmin ppm | REL ppm |
|---|---|---|---|---|---|
| Not detected | |||||
| Toluene | 100 | 50 | Benzene | 20 | 0.5 |
| p-Xylene | 140 | 100 | o-Xylene | 25 | 100 |
| Styrene | 70 | 20 | Ethyl benzene | 40 | 100 |
| Benzaldehyde | 50 | N/A | Benzonitrile | 25 | N/A |
| Detected | |||||
| Carbon monoxide | — (2.5) | 30 | Hydrogen cyanide | — (5.4) | 1.9 |
| Ethyne | — (4.7) | 1000 | Nitric oxide | — (7.5) | 25 |
| Nitrous oxide | 2300 (1.2) | 100 | Water | 120 | |
| Methane | 0.3 | 10000 | Ethane | 0.3 | 10000 |
| Ethene | 2 | 10000 |
© 2010 by the authors; licensee Molecular Diversity Preservation International, Basel, Switzerland. This article is an open-access article distributed under the terms and conditions of the Creative Commons Attribution license ( http://creativecommons.org/licenses/by/3.0/).
Share and Cite
Gianella, M.; Sigrist, M.W. Infrared Spectroscopy on Smoke Produced by Cauterization of Animal Tissue. Sensors 2010, 10, 2694-2708. https://doi.org/10.3390/s100402694
Gianella M, Sigrist MW. Infrared Spectroscopy on Smoke Produced by Cauterization of Animal Tissue. Sensors. 2010; 10(4):2694-2708. https://doi.org/10.3390/s100402694
Chicago/Turabian StyleGianella, Michele, and Markus W. Sigrist. 2010. "Infrared Spectroscopy on Smoke Produced by Cauterization of Animal Tissue" Sensors 10, no. 4: 2694-2708. https://doi.org/10.3390/s100402694