Article

Patterns of Sponge Biodiversity in the Pilbara, Northwestern Australia

1
Western Australian Museum, Locked Bag 49, Welshpool, WA 6986, Australia
2
Western Australian Marine Science Institution, Entrance 2 Brockway Road, Floreat, WA 6014, Australia
3
Australian Institute of Marine Science (AIMS), University of Western Australia, Oceans Institute, Perth, WA 6009, Australia
4
Queensland Museum, PO Box 3330, South Brisbane, CQU 4101, Australia
5
British Antarctic Survey, High Cross, Madingley Road, Cambridge CB3 0ET, UK
6
Eskitis Institute for Drug Discovery, Griffith University, Nathan, CQU 4111, Australia
*
Author to whom correspondence should be addressed.
Diversity 2016, 8(4), 21; https://doi.org/10.3390/d8040021
Submission received: 16 August 2016 / Revised: 17 October 2016 / Accepted: 17 October 2016 / Published: 25 October 2016
(This article belongs to the Special Issue Coral Reef Biodiversity and Conservation)

Abstract

:
This study assessed the biodiversity of sponges within the Integrated Marine and Coastal Regionalisation for Australia (IMCRA) bioregions of the Pilbara using datasets amalgamated from the Western Australian Museum and the Atlas of Living Australia. The Pilbara accounts for a total of 1164 Linnean and morphospecies. A high level of “apparent endemism” was recorded with 78% of species found in only one of six bioregions, with less than 10% confirmed as widely distributed. The Ningaloo, Pilbara Nearshore and Pilbara Offshore bioregions are biodiversity hotspots (>250 species) and are recognised as having the highest conservation value, followed by North West Shelf containing 232 species. Species compositions differed between bioregions, with those that are less spatially separated sharing more species. Notably, the North West Province bioregion (110 species) exhibited the most distinct species composition, highlighting it as a unique habitat within the Pilbara. While sponge biodiversity is apparently high, incomplete sampling effort for the region was identified, with only two sampling events recorded for the Central West Transition bioregion. Furthermore, only 15% of records in the dataset are presently described (Linnean) species, highlighting the continuing need for taxonomic expertise for the conservation and management of marine biodiversity resources.

1. Introduction

Many marine filter feeding communities are dominated by sponges, which can form extensive garden-like environments characterised by high biomass and diversity [1,2,3,4]. In such environments sponges can significantly influence water quality and substrate conditions, and provide nutrition and vital habitat for many other organisms [5,6,7]. Sponges are efficient filter feeders and play a critical role in linking the pelagic environment to the benthos through nutrient cycling, and are increasingly recognized as key contributors to ecosystem services [8,9,10,11,12,13]. Despite their evolutionary and ecological importance, sponges are not as well studied as corals and other benthic taxa that form structural habitats, and their importance within the global ecosystem is far less widely appreciated [3,14,15,16].
Sponge populations and communities generally lack effective management, to the extent that they have been defined as a ‘neglected group’ [17,18]. Two recent publications have examined sponge biodiversity patterns in northern Australia with a management perspective [4,19]. Worldwide, only a handful of monitoring projects have included sponges in their surveys and programs [20,21,22]. Due to the difficulty identifying sponges, many monitoring programs broadly categorize them as ‘sponges’ or ‘filter feeders’ which does not allow for meaningful ecological or physiological interpretation at species or genus level. Presently surveys of the distribution and abundances of sponge species have only been conducted in the Atlanto-Caribbean region, where they form significant components of the benthic community and their taxonomic identities are far better established than in most of the Indo-Pacific marine benthic faunas [5,23,24,25]. Australian waters have previously been noted to have high sponge biodiversity [3]. Numerous regional biodiversity hotspots and a high level of apparent endemism in tropical regions have been identified [26,27]. In addition, dense sponge grounds have also been reported from southern temperate regions [28,29,30]). To ensure effective management and conservation for sponges, a comprehensive understanding of their diversities, distributions and biological roles are critical, in particular for regions of high biodiversity and endemism [26,30]. This knowledge is even more pertinent in the face of rapid global climate change and altered habitat and water quality from increasing coastal development and offshore industries [15].
Efforts to improve knowledge of sponge species distributions are often hampered by significant numbers of undescribed species. As of 2016, 8755 sponge species are considered valid globally with an estimate of at least 12,000 species likely to be described by the end of this century [16,31]. Restricting large scale marine benthic studies to described, Linnean taxa can significantly underestimate the true biodiversity of a region, and the use of OTUs (operational taxonomic units, or morphospecies concept) and MOTUs (molecular operational taxonomic units) continues to uncover additional undescribed and cryptic species [32]. Field surveys increasingly make use of OTUs, however full taxonomic evaluation of them is still time consuming and unlikely to progress as efficiently as needed to support the growing demand for environmental assessment of this ecologically important group. Although OTUs cannot provide information on specific biological or genetic traits, or the biogeography of single species, their use still has advantages. OTU data can significantly enhance our understanding of biodiversity, distributions and ecology. Matching OTUs within and between collections creates large datasets which can provide useful insights into how common or important given sponges are, whether they are likely to be endemic, and sometimes provide data on their distribution through time [33,34]. Such data are also important in assessing where biodiversity hotspots occur and where areas are undersampled [3]. This study stresses the value of utilising large OTU databases of marine taxa by presenting data on sponge species and OTUs from the Pilbara region, a vast, but inadequately studied arid-tropical region of northwestern Australia [35,36].
The Pilbara region is on the western half of the North West Australian Shelf, lies in the eastern Indian Ocean, and is part of the Indo-West Pacific Realm, the latter recognised as the most species rich marine area on earth [37]. In its own right, the North West Australian Shelf represents a hotspot of biodiversity, in particular for molluscs and echinoderms [37]. The region is important for aquaculture and fisheries, and is of great strategic and economic significance due to extensive offshore oil and gas resources [38,39,40]. Australia’s largest export ports are situated here, some of which have recently been expanded, and new, large scale industrial activities are being developed [40]. The environmental impact assessment process for coastal infrastructure development and the growing recognition of the significance of the filter feeder communities of the region raised awareness on how little is known about them [37].
This highlighted the need for a synthesis of sponge data from research already undertaken in the Pilbara, which to date was only available through various collections and databases. An earlier northern Australian synthesis of sponge richness from museum collections was reported [34], however, the dataset presented here is far more comprehensive than the more restricted dataset used in [34], in both geographic and taxonomic composition of sponges.
The aim of this study was to provide an overall synthesis of sponge faunal biodiversity and distributions for the Pilbara region by extracting and amalgamating data from specimen databases and collections from the Western Australian Museum (WAM) and the Atlas of Living Australia [41]. Differences in biodiversity and community composition were assessed for IMCRA (Integrated Marine and Coastal Regionalisation for Australia) mesoscale and provincial bioregions identified within the Pilbara. These bioregions are based largely on fish distributions, seabed habitat, oceanographic and to a lesser extent sponge data [34]. The IMCRA framework provided this study with a geographic and environmental context for assessing sponge distributions, as well as relationships between sponge diversities and collection effort. Finally, endemism and global distributions of Pilbara sponge species were evaluated.

2. Materials and Methods
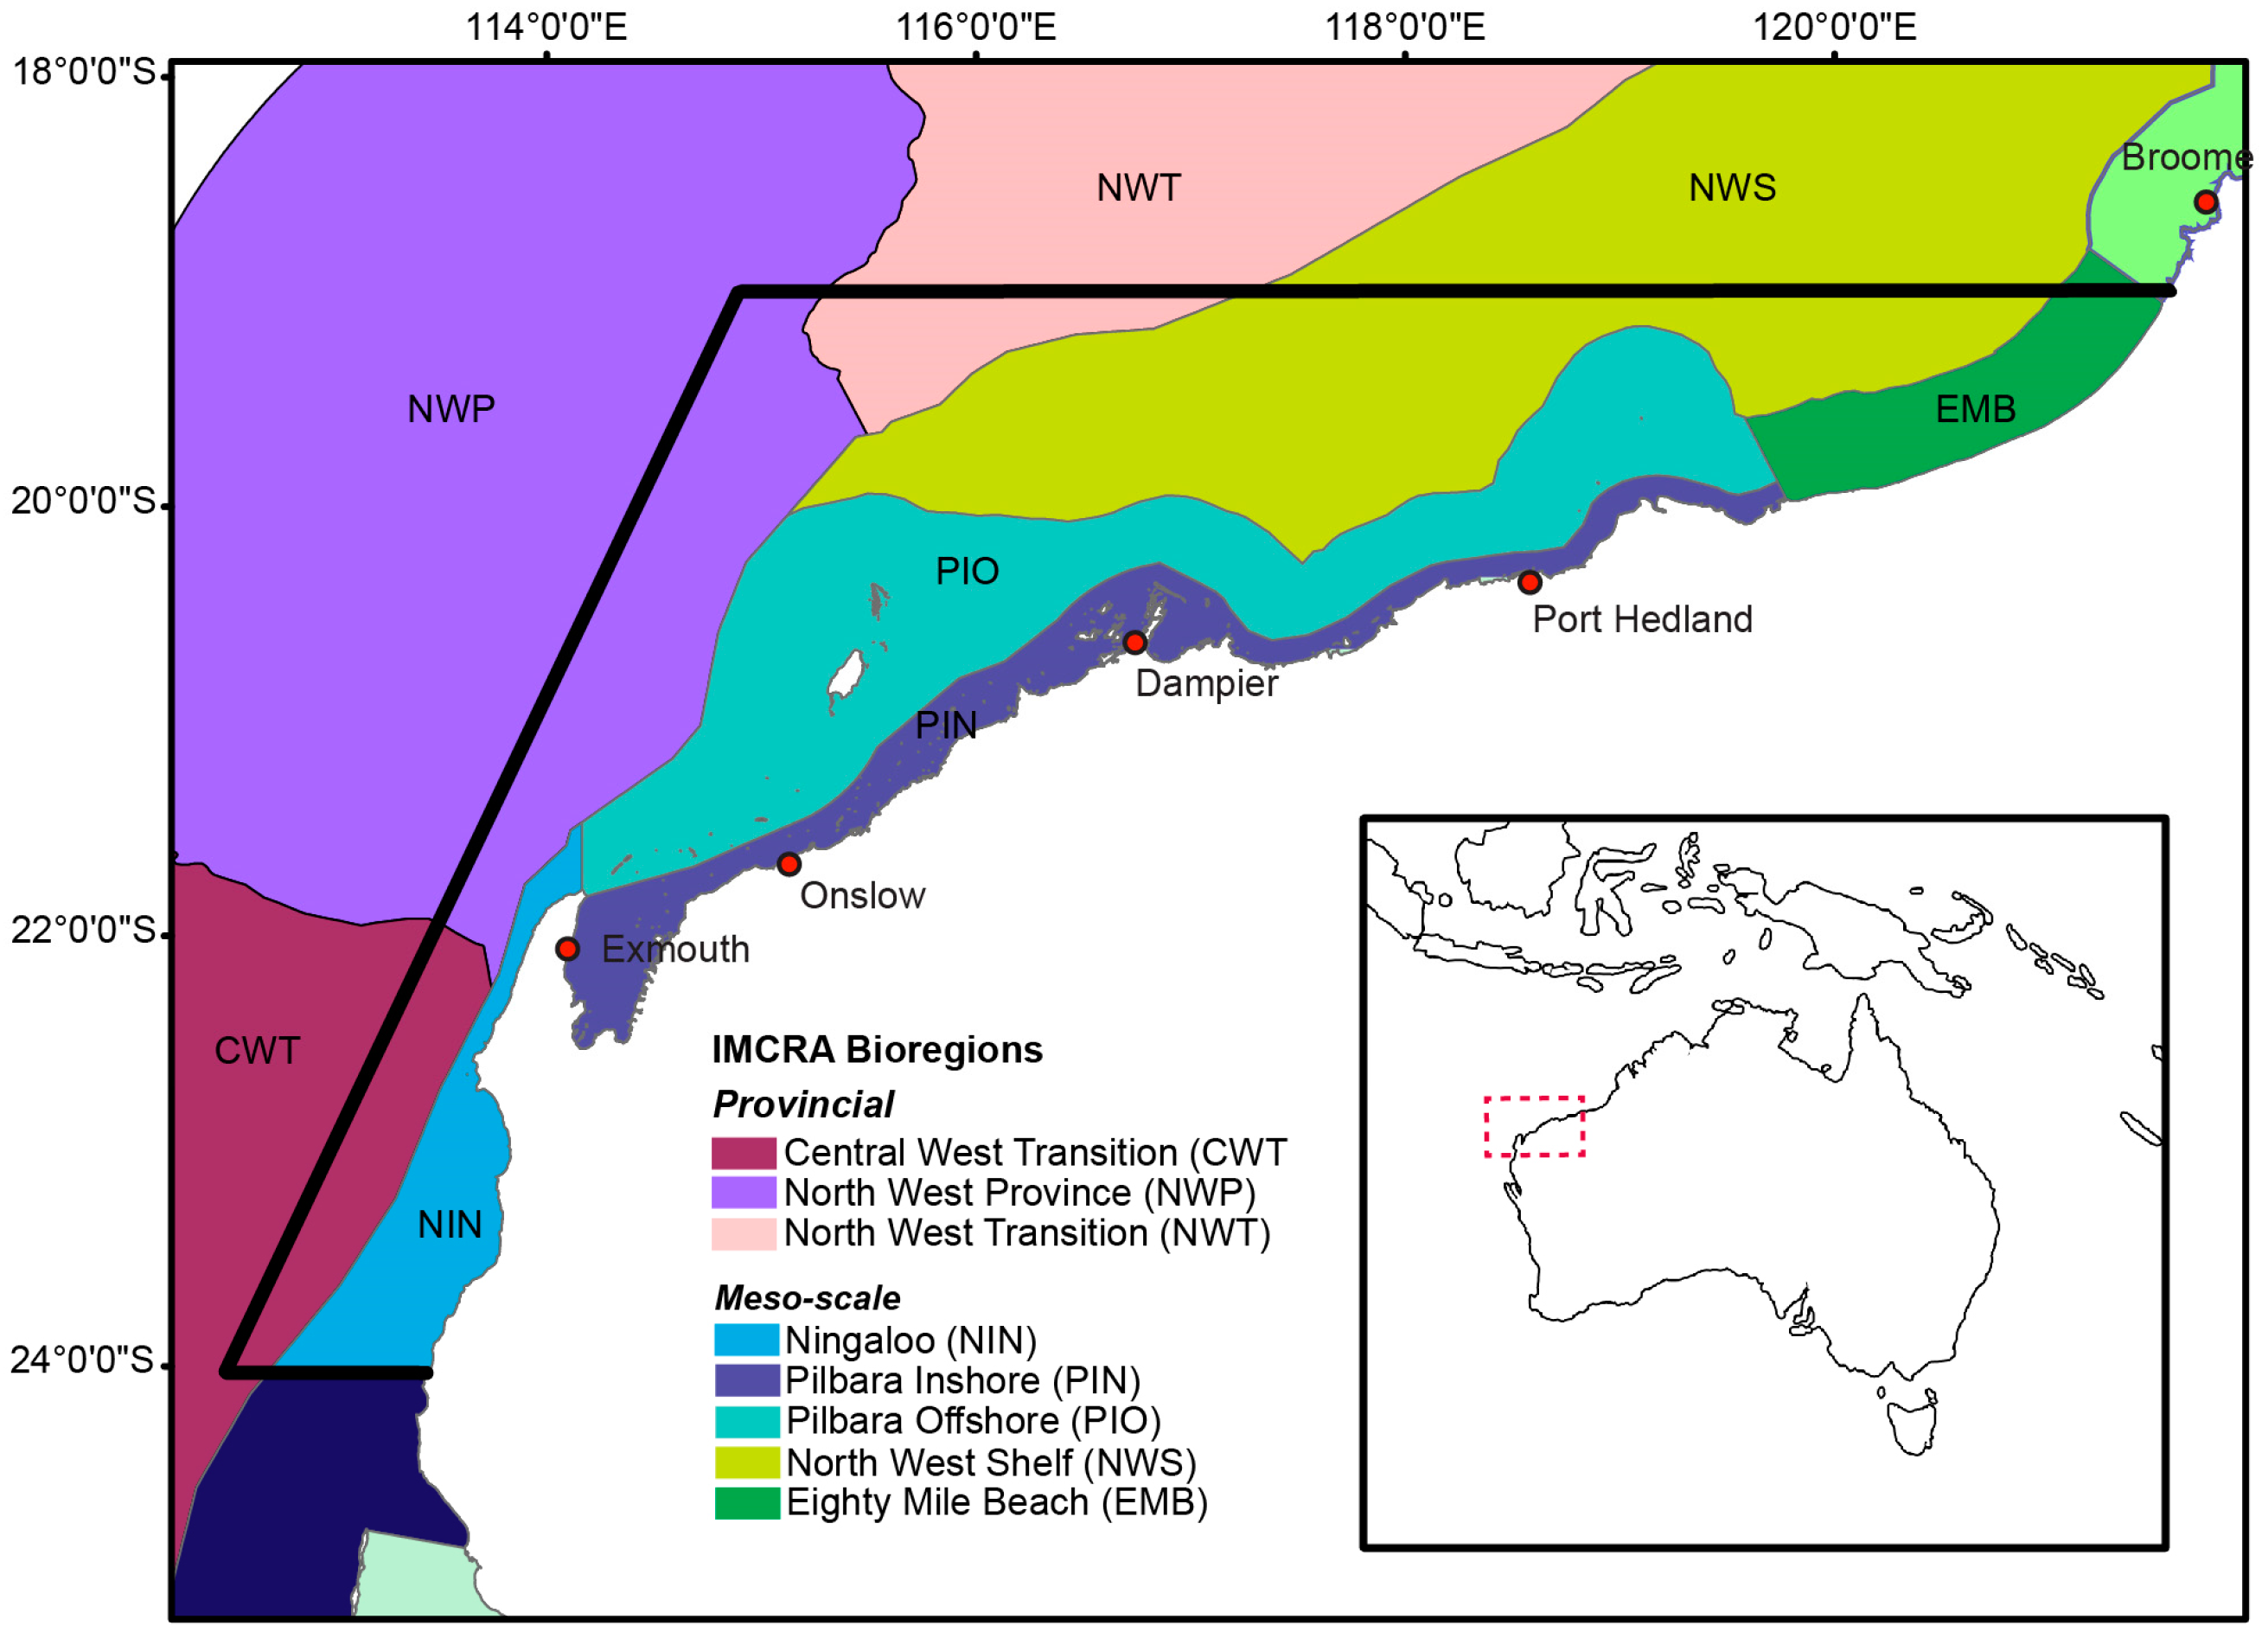
2.1. Study Area

The Pilbara is an arid tropical northwestern Australian region that reaches from the World Heritage Area of Ningaloo Reef in the south to Broome in the north (Figure 1). The terrestrial landscape is known for its red, metal enriched soil on arid fluvial plains with low topography that are the predominant source of the mostly fine coastal marine sediments [35,36,42]. Tidal ranges vary from around 2 m near Exmouth to 9 m at Broome [43]. Rainfall increases in the same direction, with average values of 300 mm per year near Onslow and roughly doubling to 600 mm north of Eighty Mile Beach [35]. Benthic communities are exposed to predominantly high turbidity, high summer temperatures that can be coupled with hypersalinity, and tropical cyclones with co-occurring freshwater inundation and sediment erosion or deposition, especially in shallow depths to around 20 m [35,44,45]. Additionally, expanding industries necessitate intensive shipping traffic and coastal construction that can alter sediment and current conditions.
The study area encompassed the Pilbara region with coastal and seaward boundaries demarcated by the following coordinates; 24°1′52.24″S: 113°26′22.51″E (southern coastal boundary), 24°1′52.24″S: 112°30′0.00″E (southern seaward boundary), 19°0′0.00″S: 114°54′0.00″E (northern seaward boundary) and 19°0′0.00"S: 121°34′12.00"E (northern coastal boundary) (Figure 1). The northern boundary (19° S) is coincident with the southern boundary of a study area used for a previous sponge biodiversity assessment of the Kimberley region [46,47], and the southern boundary (24° S) is the cut-off for the Ningaloo bioregion. The western boundary is a straight line parallel to the Ningaloo coastline and the eastern boundary is the Pilbara coastline.
The Integrated Marine and Coastal Regionalisation for Australia (IMCRA) is a system of bioregions determined from an ecosystem based classification of marine and coastal environments, with the boundaries calculated from fish distributions, seabed habitat, oceanographic and some sponge data ([48,49], Table 1). The IMCRA was established as part of Australia’s National Representative System of Marine Protected Areas (NRSMPA), which aims at establishing and managing marine protected areas for maintaining ecological processes and systems, and to ensure long term ecological viability of Australia’s biodiversity. These IMCRA bioregions were used to determine distribution patterns of sponge species and OTUs in this study. Five IMCRA mesoscale bioregions were within the study area: Ningaloo, Pilbara Nearshore, Pilbara Offshore, Eighty Mile Beach, and part of the North West Shelf (note that the term North West Shelf represents the IMCRA bioregion and North West Australian Shelf represents the greater region encompassing all bioregions). Portions of three IMCRA provincial bioregions: North West Transition, North West Province and Central Western Transition were also included (Figure 1, Table 1). Provincial bioregions reflect biogeographic patterns of distribution of demersal fish and are largely outer continental shelf and slope, while the mesoscale regions are inner shelf and coastal (Table 1). In a global context, the study area represents the North West Australian Shelf province and contains two ecoregions, Ningaloo, and Exmouth to Broome, based on the global bioregionalisation of coastal and shelf areas proposed by [50].

2.2. Collation of Sponge Occurrence Data

Data of sponge occurrences were collated from databases of the Western Australian Museum (WAM) and Atlas of Living Australia (ALA) [41]. Pilbara sponge data on ALA had been captured in a northern Australian sponge report [34], but the current WAM data provide a far more comprehensive dataset, in both geographic and taxonomic composition of sponges. Quality control procedures were undertaken to remove obvious duplicate records and those with insufficient or ambiguous species data. Due to differing naming conventions of OTUs by institutions contributing to the two databases and the lack of resources for physical comparison of all OTU specimens, a maximum error of ± 13.5% total species counts was determined for the dataset, to account for potentially unique (differently named OTUs are unique) or overlapping OTUs (differently named OTUs are the same) (157 potential instances identified out of 1164 total OTUs). The amalgamation of these two databases produced a complete occurrence dataset (presence/absence) of all currently described sponge species and OTUs from the region (see Table S1). The dataset follows the new taxonomic classification proposed by [51] and implemented by [31]. The latter source was used to confirm present validities and taxon authorities for known species names.
The dataset consists of records identified as 1) described (Linnean) species, 2) records with “cf.” in front of species names which indicates the specimens have some characters of a described species but also differences, which require comparisons with type material, and 3) records as “operational taxonomy units” (OTUs) which are considered to be unique species although further assessments are required to establish their taxonomic status. For OTUs only identified to a higher taxonomy (e.g., family or order level), unique identifiers were assigned to allow inclusion of these records in statistical analyses (Table S1). In this study, the term ‘species’ includes Linnean species, cf. species, and OTUs unless otherwise stated.
For quantitative and spatial analyses the dataset was mapped onto all eight IMCRA bioregions in the project area using Google maps (Google Earth accessed March 2014). The final dataset was then used to assess patterns of biodiversity, species richness and taxonomic composition of sponges in each of the six assessed bioregions.

2.3. Collection Effort

Data on collection effort were compiled from records of all expeditions and collecting trips associated with the WAM and ALA databases. In addition, all other historic expeditions and records that had reported sponge presences not captured in these databases were electronically summarised and collated (commonly from the 1970s and 1980s; Table S2). Collection effort was summarised in three ways for each bioregion: (1) number of collection days; (2) number of collection stations and (3) area of benthos surveyed based on collecting methods (intertidal walks, SCUBA/snorkel, trawls, epibenthic sled). Regression analyses compared the number of collection stations and sampling days, with number of stations where sponges were found, thus investigating the effects of collection effort on sponge presence for each bioregion.
As collection methods (intertidal walks, SCUBA/snorkel, trawl, epibenthic sled) differed between expeditions and collecting trips, effort data were standardised to area of benthos sampled (m2) by considering the width and length of sea bottom covered by the sampling method. For example, diving along a transect of 10 × 1 m will generate 10 m2 of benthos sampled, while a single trawl of 20 m width over a distance of 1000 m will generate 20,000 m2 of benthos sampled. Assessment of effort based on area of benthos was conducted specifically on the WAM data as it included detailed information on collection methods and equipment. Regression analyses of the number of sponge species collected (species richness) versus area of benthos sampled were conducted to elucidate species richness patterns for the bioregions. Regression analyses were conducted in Statistica 10 (StatSoft Inc., Tulsa, OK, USA).

2.4. Community Composition

Differences in community composition between bioregions were assessed at species and genus levels. While species level analyses resulted in more accurate representation of differences in community structure between bioregions, investigation at genus level enabled interpretation of distribution patterns at a higher taxonomic level, in some cases allowing examination of biological characteristics of the sponges where a trait was common throughout a given genus (e.g., endopsammic life style, [52]).
To test the null hypothesis that there was no significant difference in community structure between bioregions, a Cochran’s Q test specifically designed for dichotomous variables was undertaken on the species data [53]. Frequencies of overlapping species between bioregion pairs were summarised and similarities of communities were assessed using the Jaccard similarity index [54]. Permutations of the Jaccard similarity matrix were subsequently employed for clustering in PRIMER 7 [54], and multidimensional scaling (MDS), as well as biodiversity statistical analyses at species and genus levels, to test hypotheses concerning taxonomic affinities between bioregions. Similarity profile (SIMPROF) analyses were concurrently conducted with cluster analyses to provide statistical support for genuine clustering of groups (bioregions), which in this study were not structured a priori. Pairwise similarity percentage (SIMPER) analyses were performed to identify genera that contributed to dissimilarity between statistically distinct cluster pairs. SIMPER decomposes the Jaccard dissimilarities between pairs of clusters into percentage contributions from each genus, allowing for weighting of genus level influences on the differences between clusters [54].
Distributions of speciose genera can indicate if certain bioregions are more favourable than others in maintaining higher diversities. To evaluate the distribution of genera in the study area, the frequency of species within the ten most speciose genera from each bioregion were summarised, and the percentage contribution of species within genera against total species richness within each bioregion were calculated.

2.5. Taxonomic Distinctness Analysis
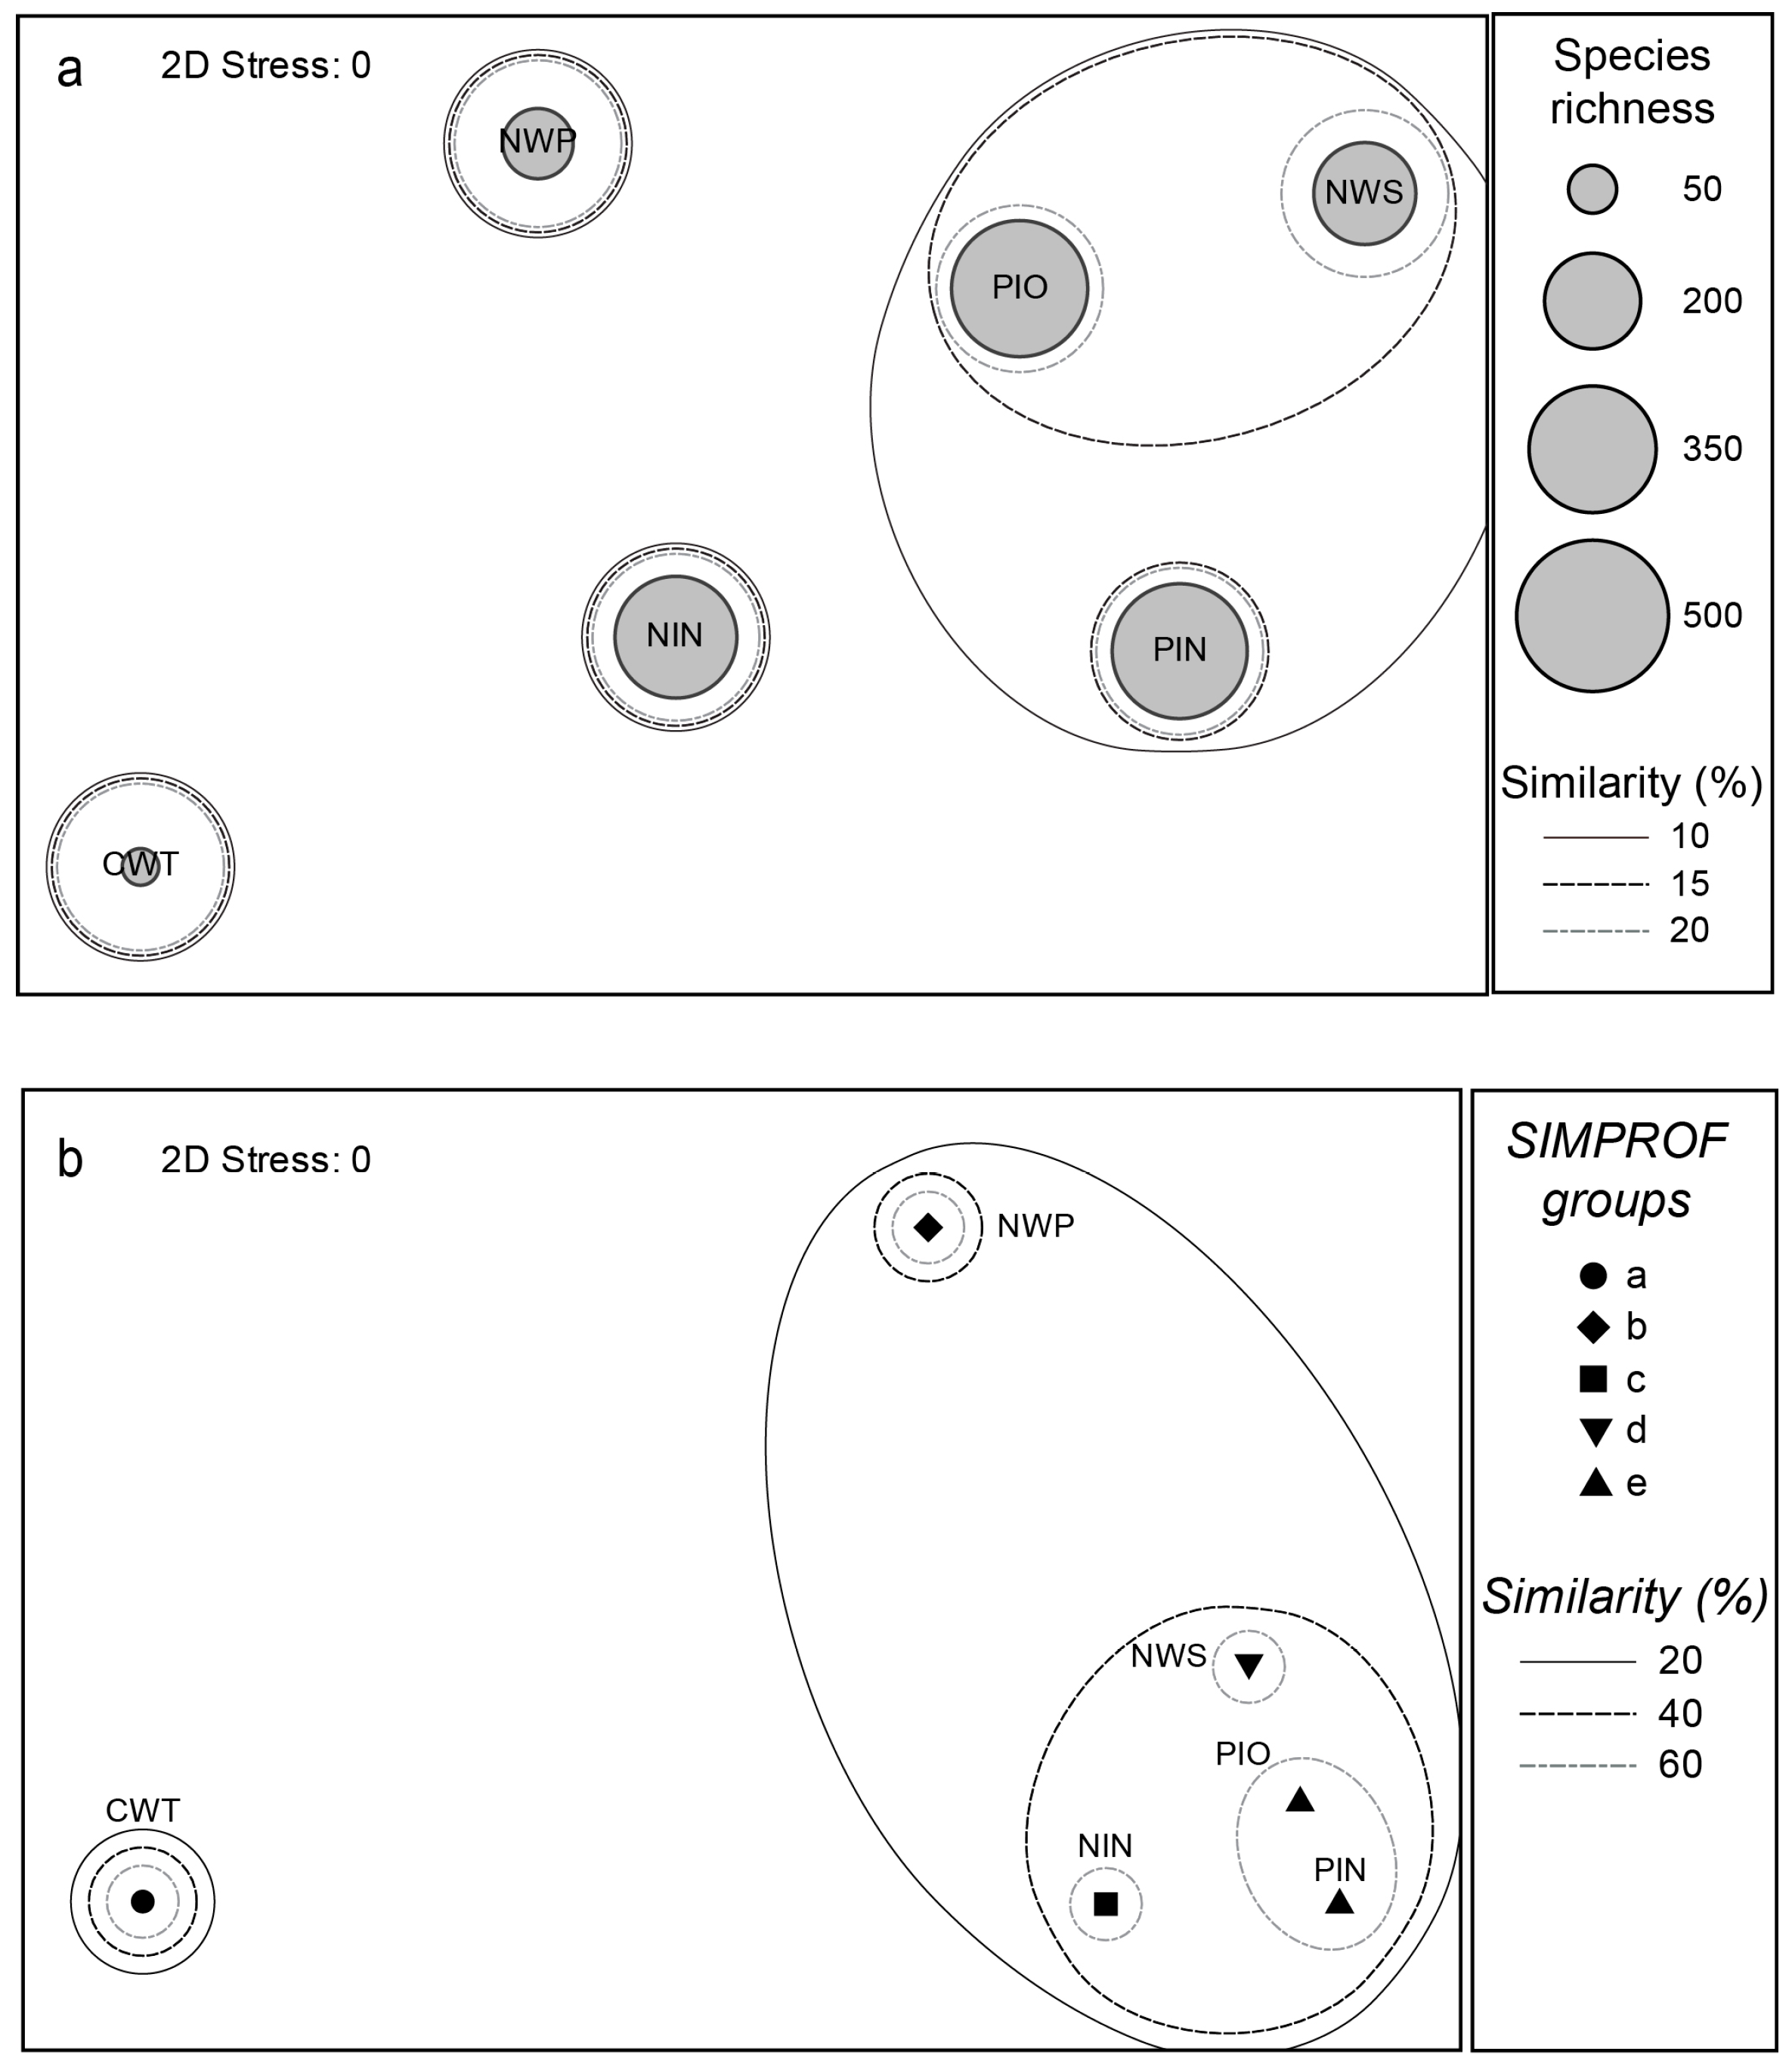
The average measure of relatedness between any two species in a community sample is known as taxonomic distinctness [55], which can be represented by two indices: average taxonomic distinctness (AvTD or delta +) and variation in taxonomic distinctness (VarTD or lambda +; [54]). By computing a path length or relative taxonomic distance, these indices integrate taxonomic or phylogenetic information between any two species. Average taxonomic distinctness is the average path length, in a Linnean or phylogenetic classification, between any two randomly chosen species. This index is less effective when an uneven distribution or over-representation of certain species is present within the higher taxa for the study area, and is more effective for comparisons between datasets which contain a restricted number of higher taxa for a given number of species. Therefore, variation in taxonomic distinctness measures the evenness of the distribution of taxa across the hierarchical taxonomic tree. These indices are independent of sampling effort and size, and are effective for comparing biodiversity at several spatial scales [54,56,57,58]. When used together, these indices provide a reliable summary of patterns of taxonomic relatedness across an assemblage of taxa. Taxonomic distinctness analyses were conducted at species, genus and family levels in PRIMER 7 to test the null hypothesis that the theoretically incomplete species list for a particular bioregion possesses the same structure of taxonomic distinctness as all species from all bioregions in the study area (Table S1). Average and variation indices of taxonomic distinctness used together are considered to be a statistically robust summary of taxonomic relatedness forming patterns across an assemblage, which is an appropriate approach to look into historical data and species lists [55].

3. Results

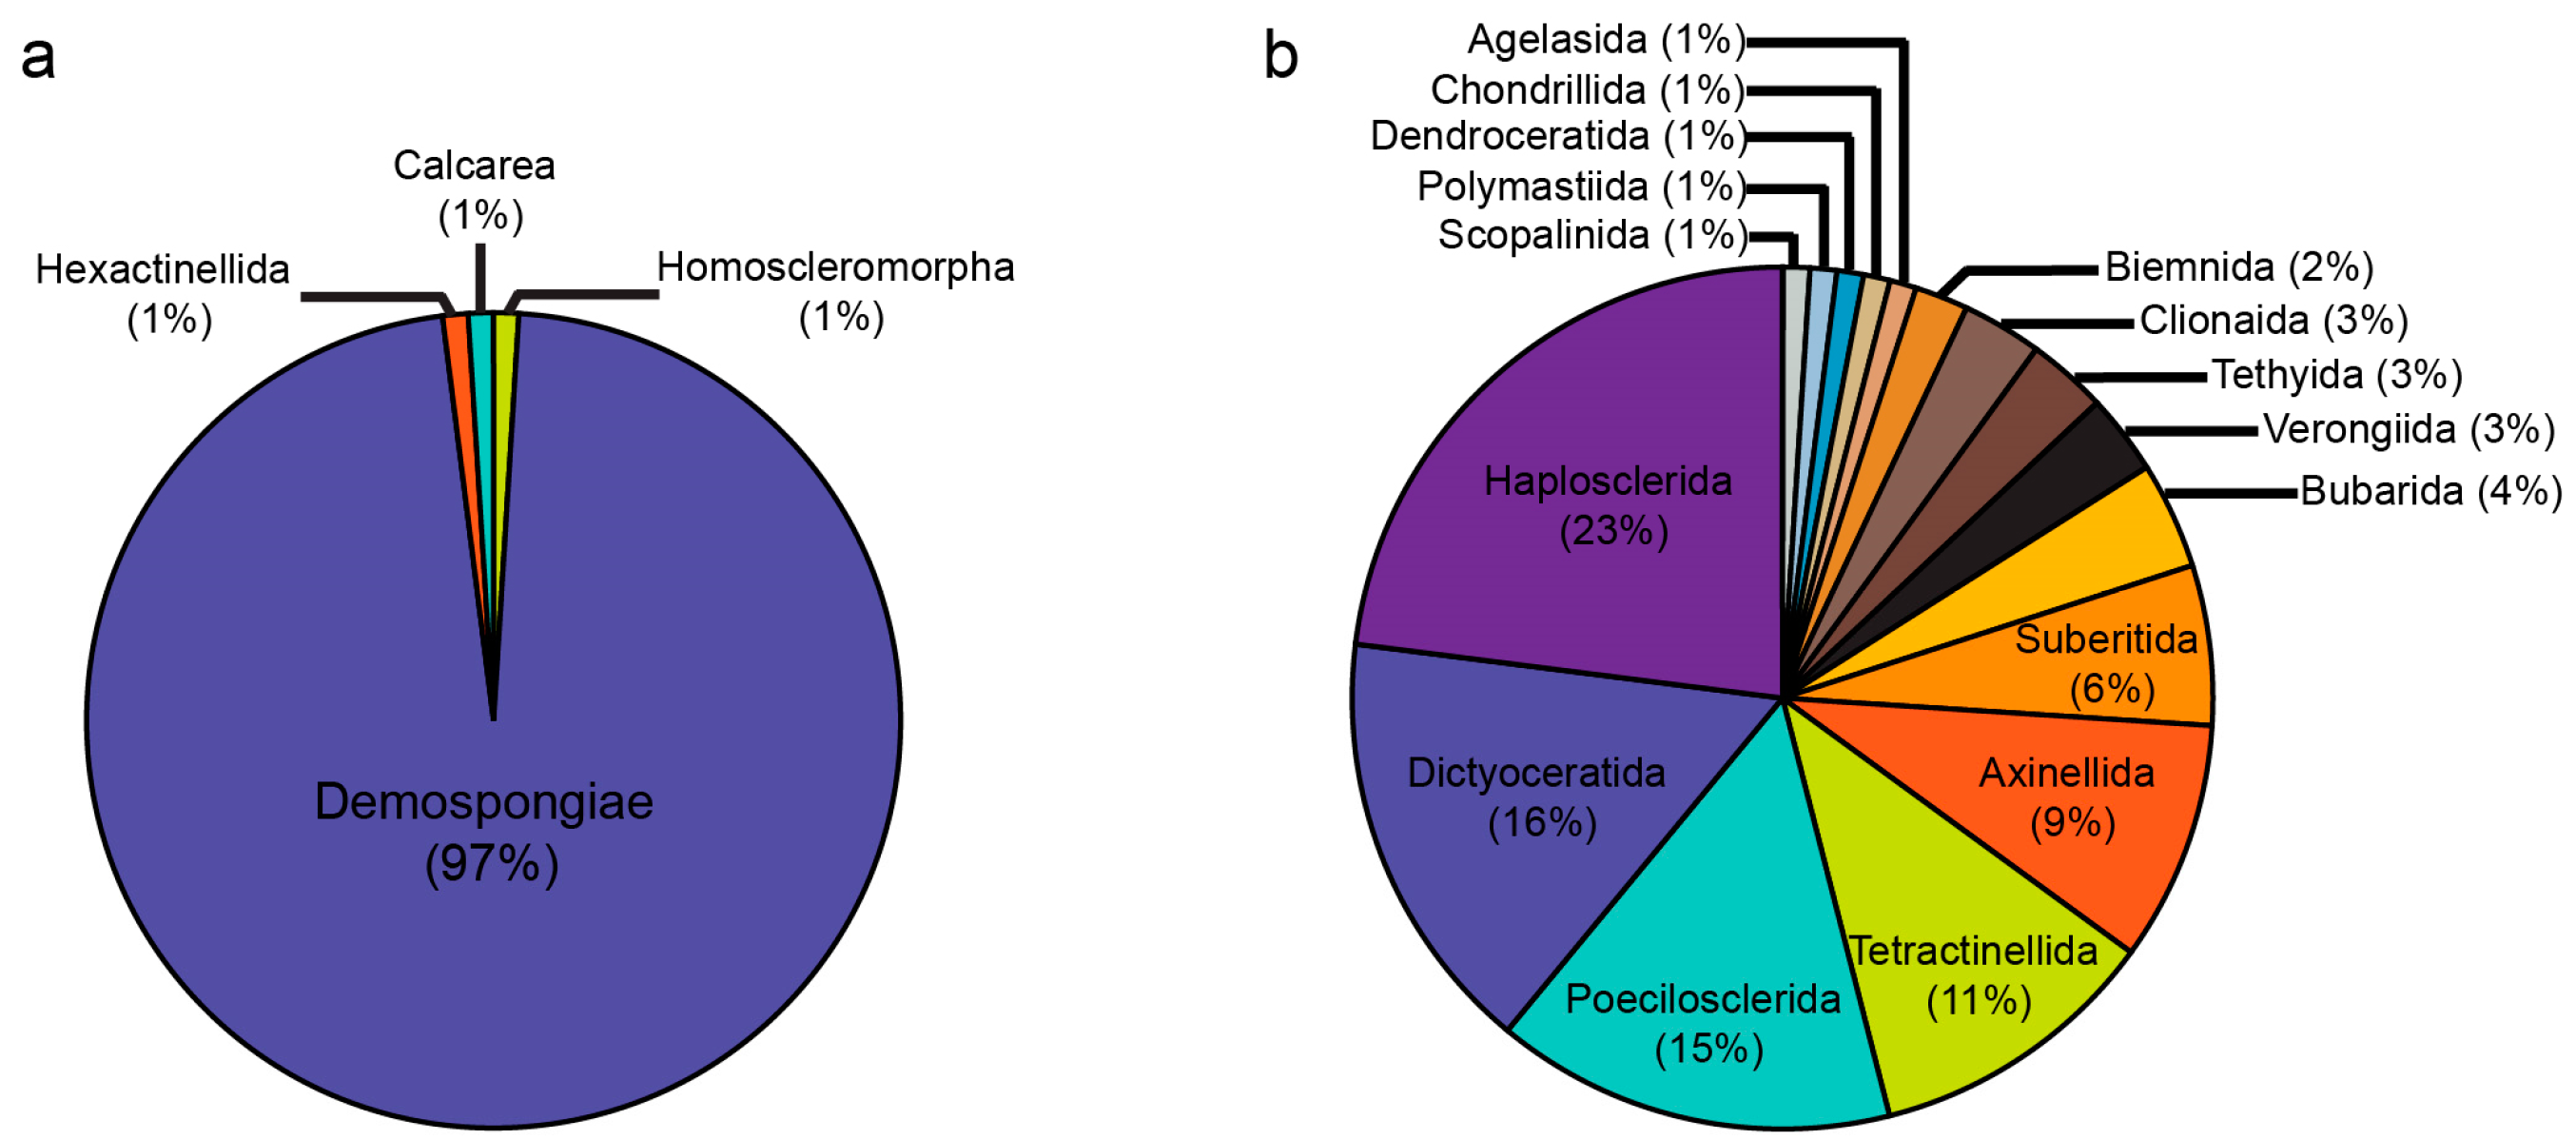
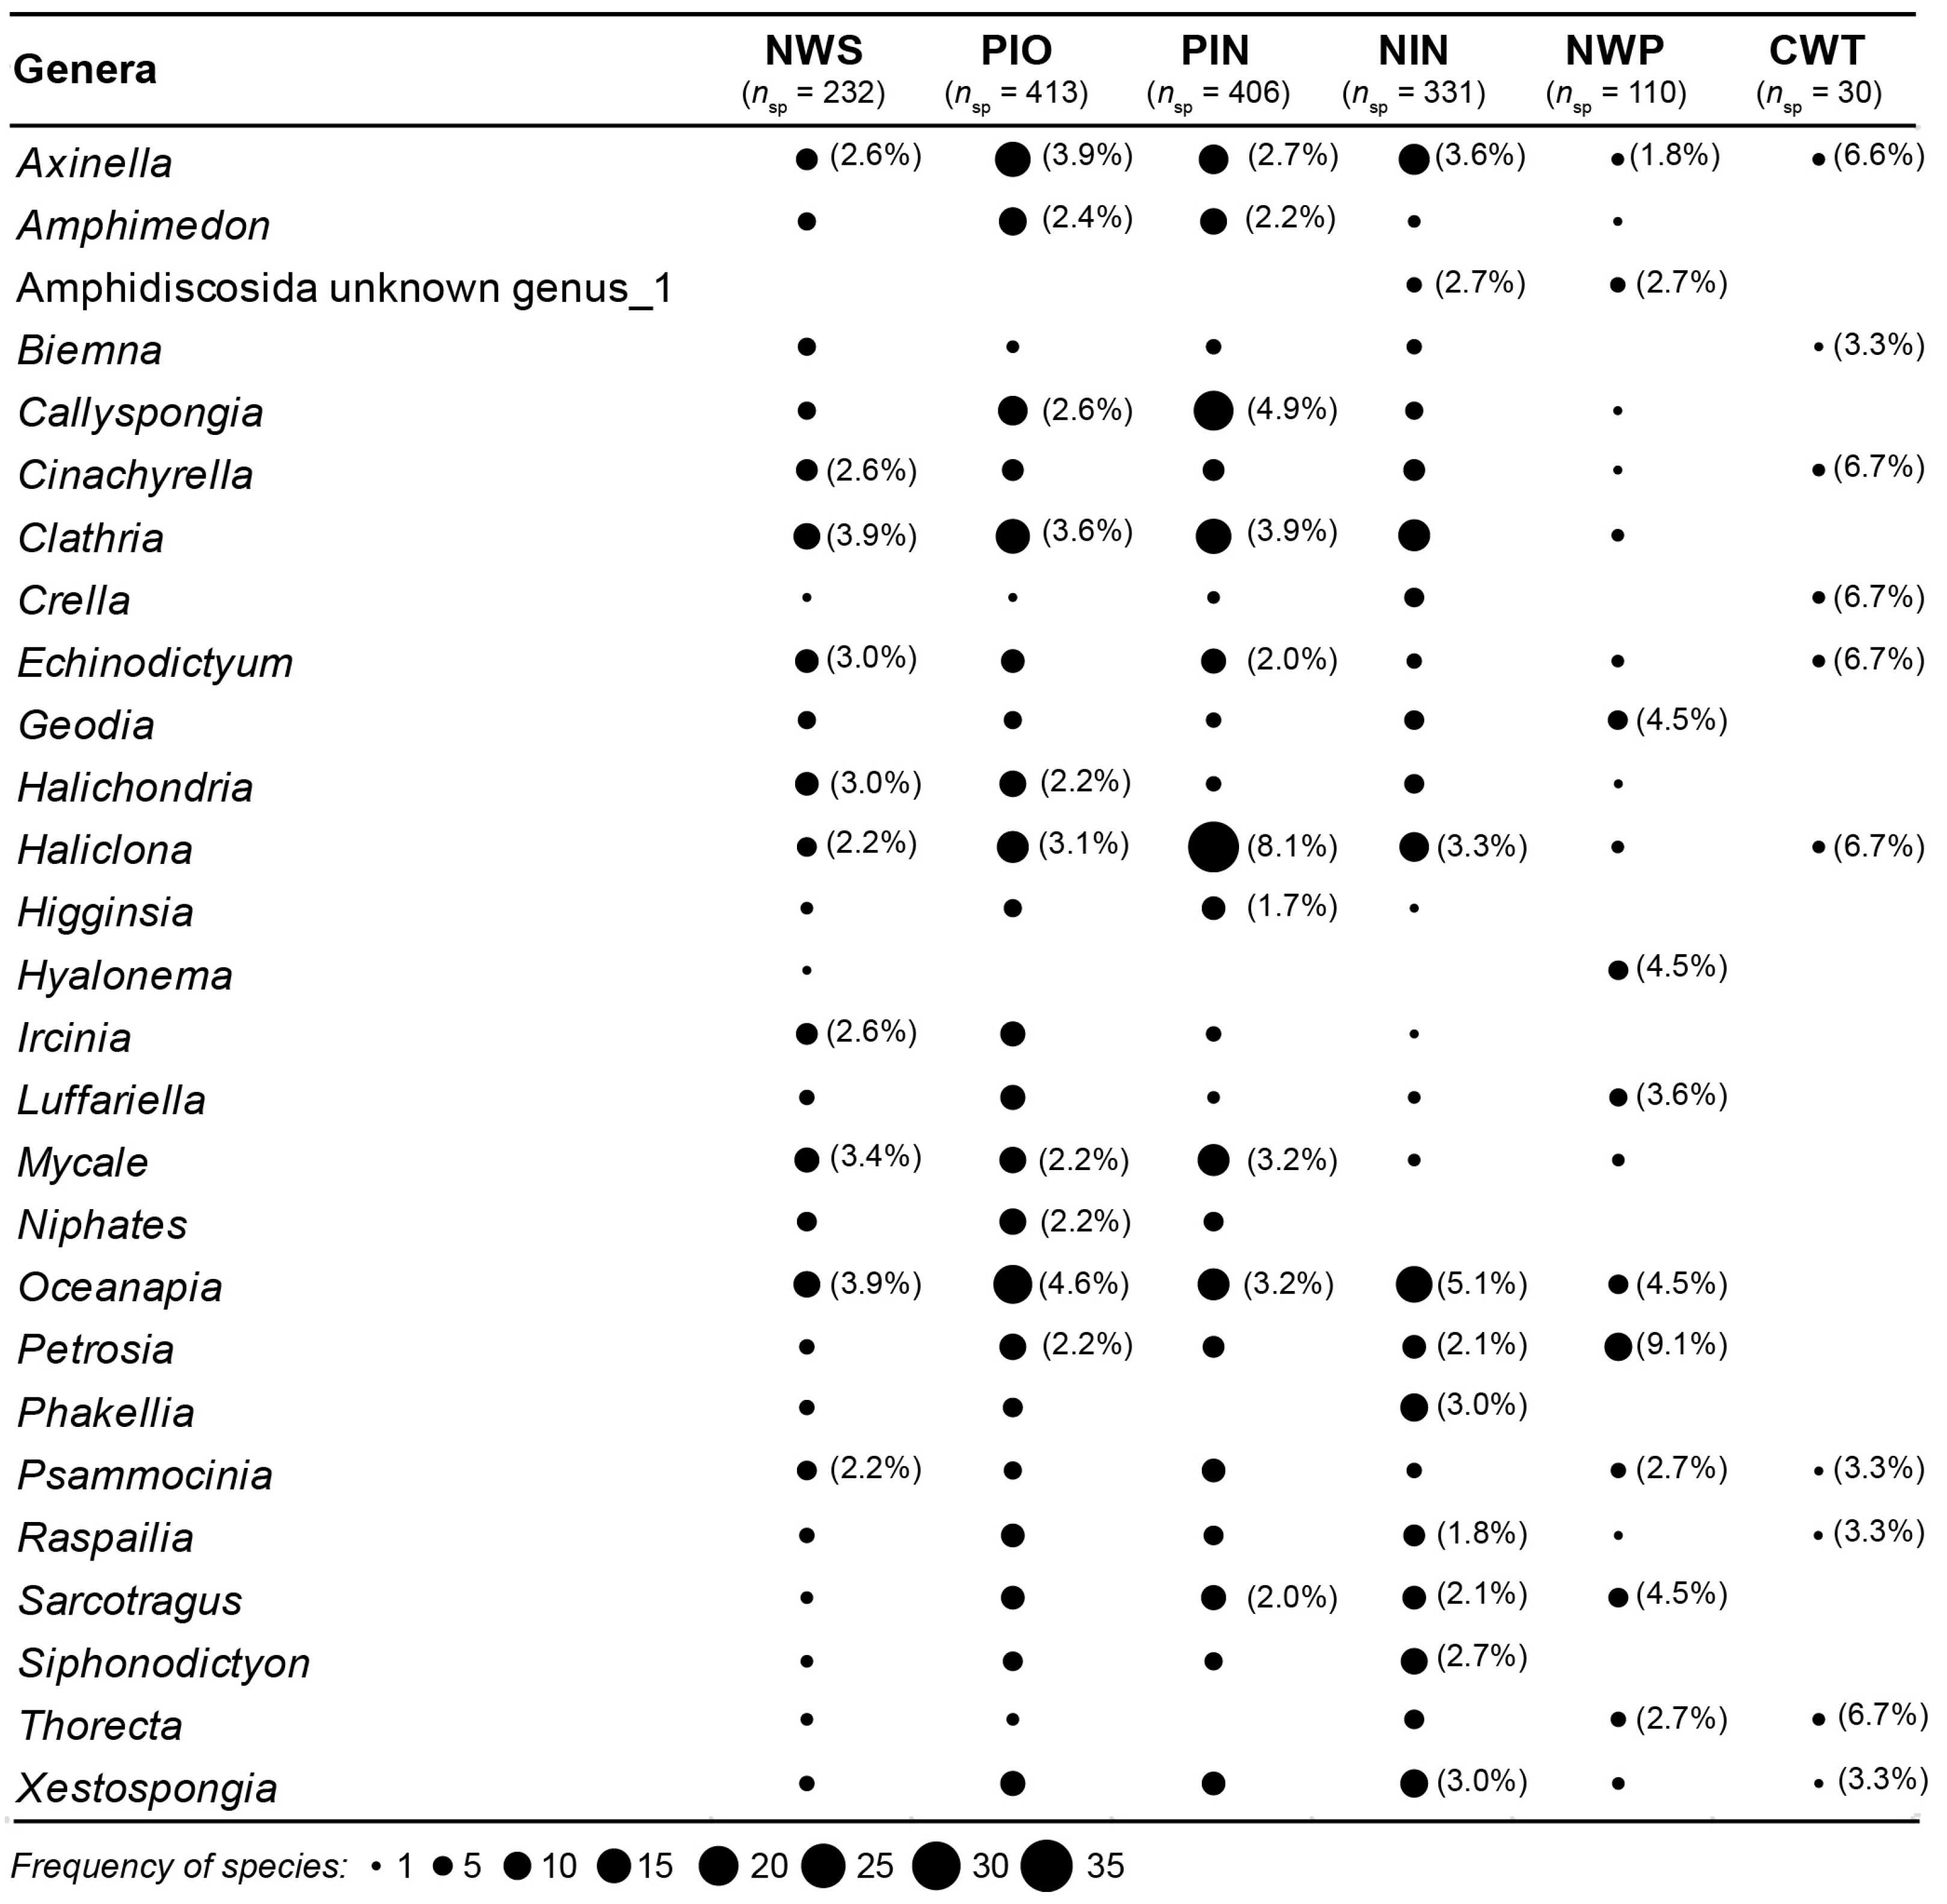
3.1. Species Composition

A total of 1164 species and OTUs were recorded for the study area, comprising 12 hexactinellid sponges, 15 calcareans, 8 homoscleromorphs, and 1129 demosponges (Figure 2a). This corresponds to 209 genera, 78 families and 23 orders. The class Demospongiae was best represented in the collections and was dominated by the orders Axinellida, Haplosclerida, Poecilosclerida, Tetractinellida and Dictyoceratida (>100 species within each family, Figure 2b). No sponge species were reported from the Eighty Mile Beach (EMB) and North West Transition (NWT), as no sampling has been done in these bioregions, and these areas were excluded from all analyses.
Well over two thirds of the species (78%) only occurred in a single bioregion and were “apparent endemics” (sensu [59], Figure 3a). Specifically, 285, 209, 225, 117, 64 and 7 “apparent endemic” species and OTUs were found in PIN, PIO, NIN, NWS, NWP and CWT respectively. Less than 10% of the species were considered to be widely distributed within the Pilbara study area by occurring in three or more bioregions (>50% of bioregions), and less than 1% of the species, viz. Echinodictyum clathrioides, Acanthella cavernosa, Clathria (Thalysias) abietina and Clathria (Thalysias) lendenfeldi, were very widely distributed and occurred in five bioregions (Figure 3a). When only described species were considered (n = 172), a similar pattern in species occurrence was seen, with about half of the species occurring only in one bioregion (Figure 3b). Sediment-dwelling, endopsammic sponges displayed a notable diversity, with 51 Oceanapia spp., 19 Siphonodictyon spp., 11 Spheciospongia spp., 10 Biemna spp. and 8 Ciocalypta spp. recorded.

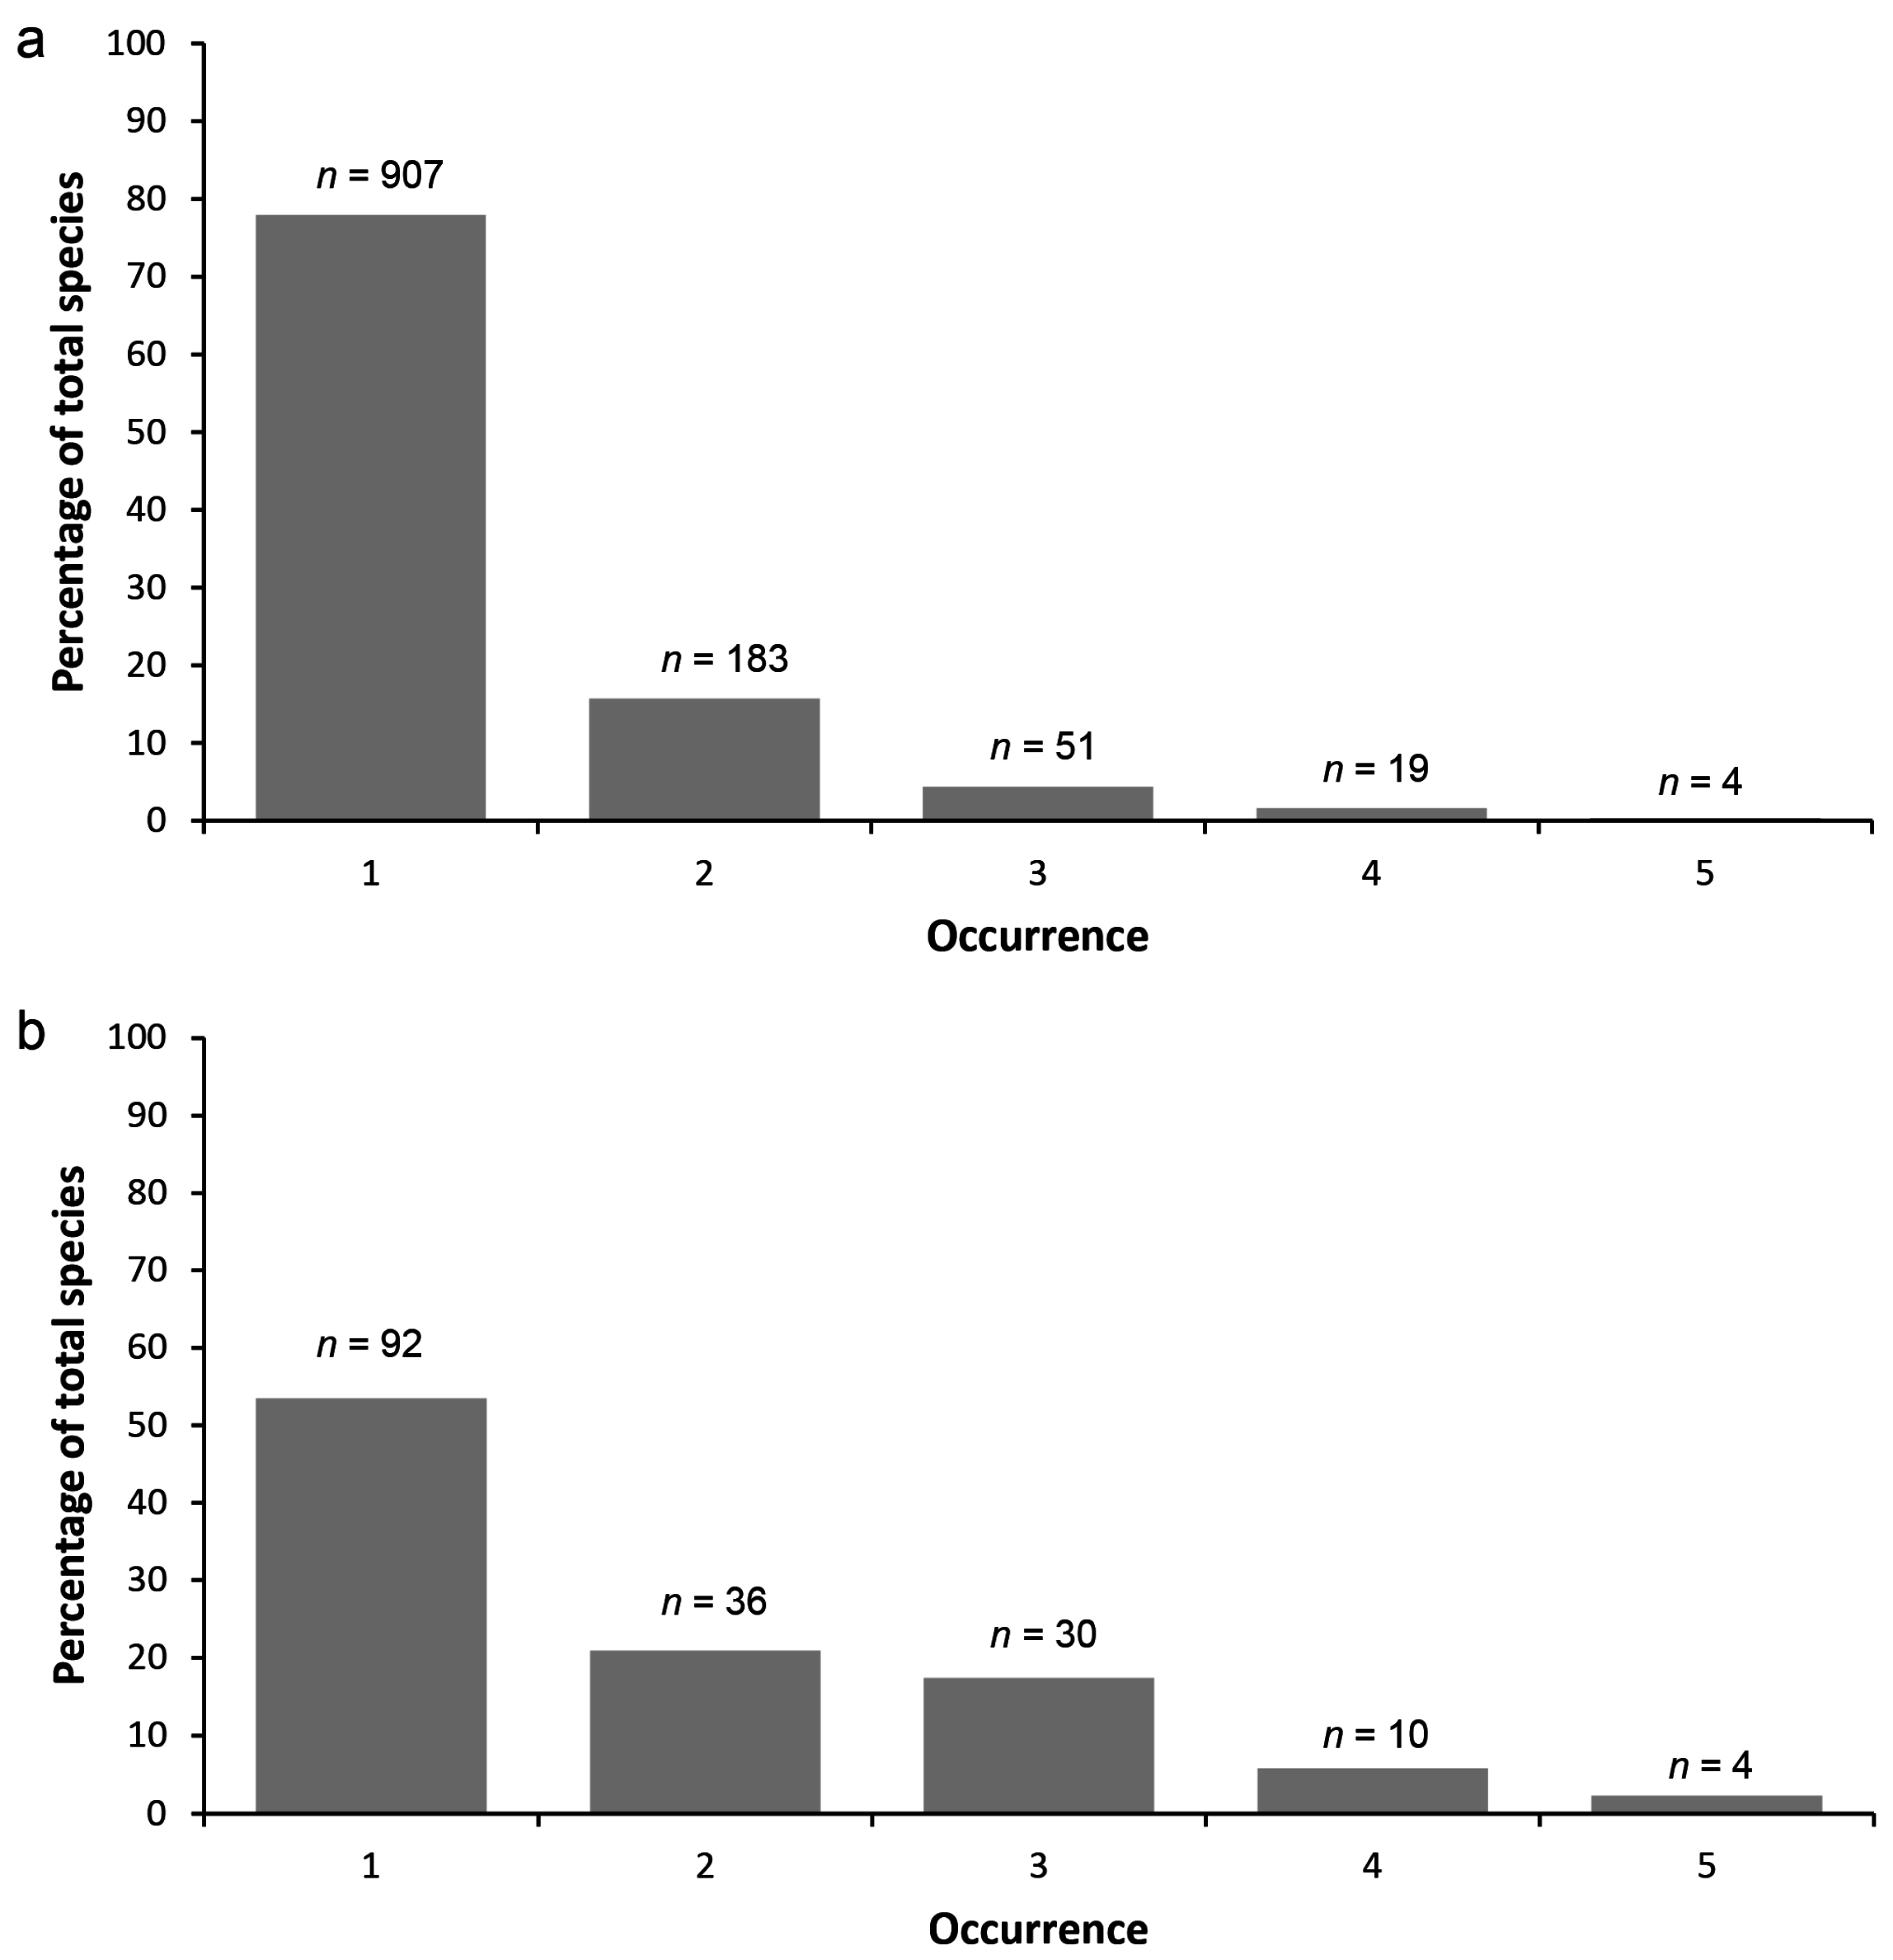
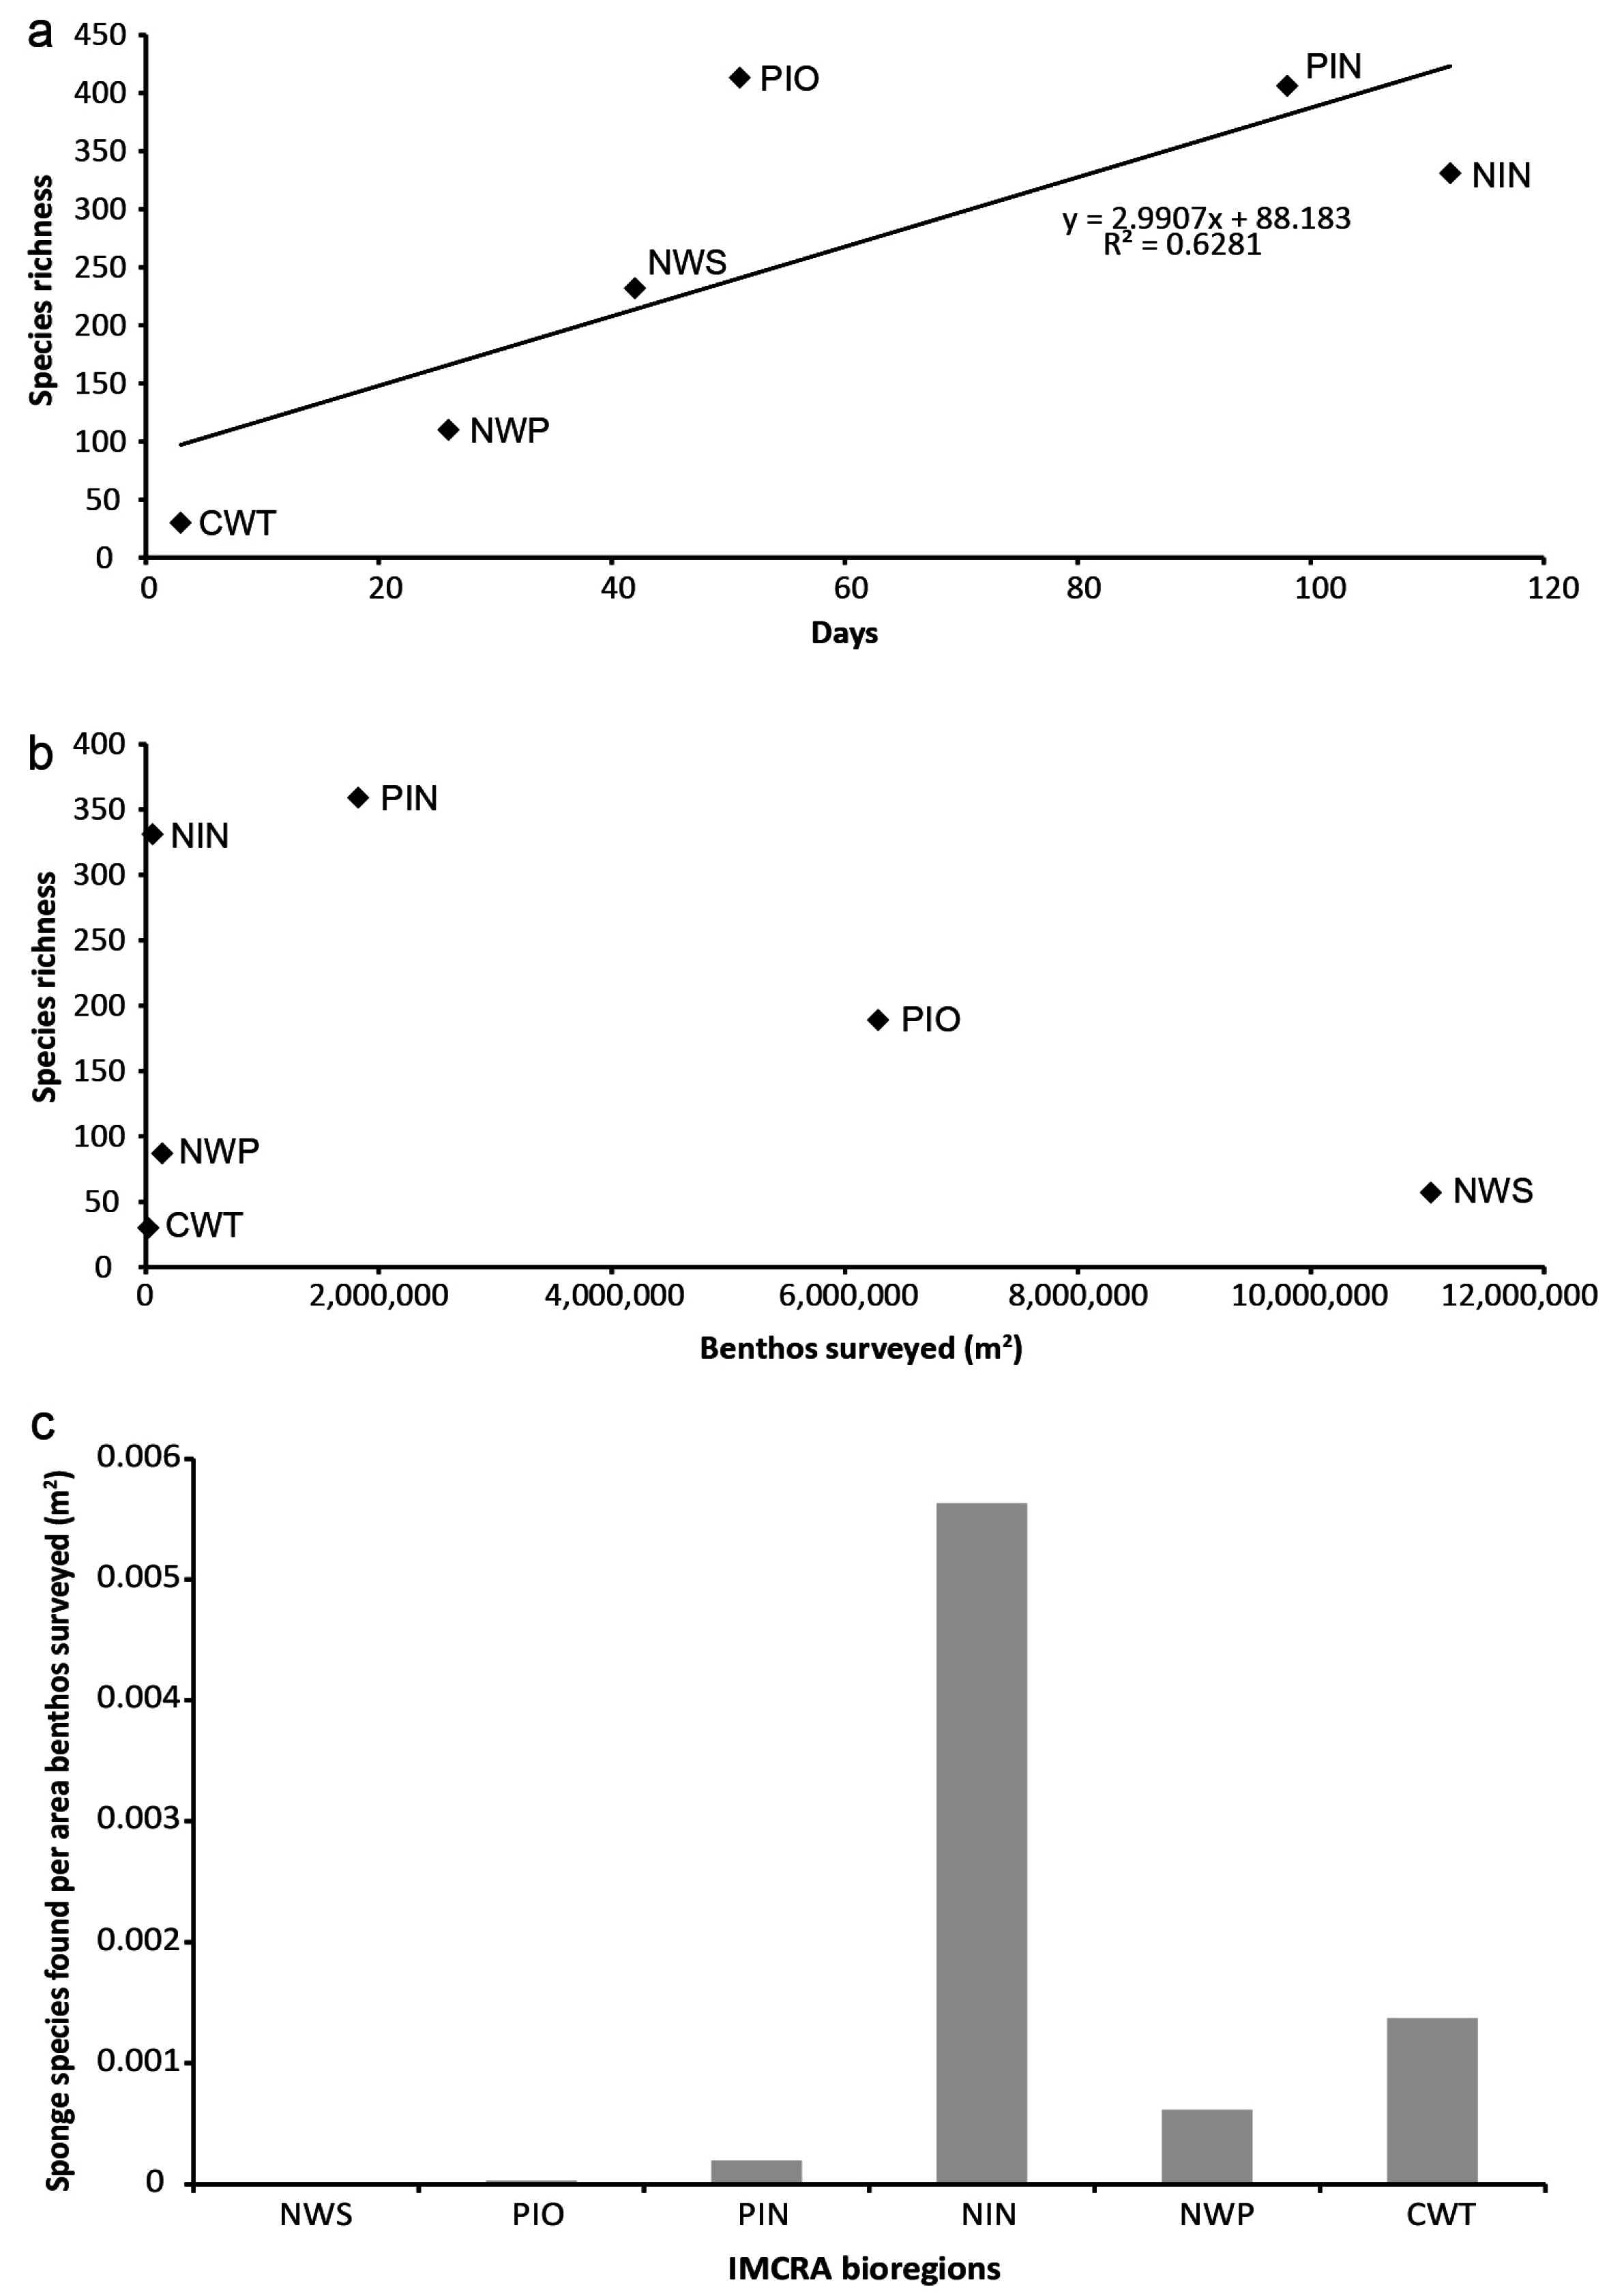
3.2. Species Richness and Collection Effort

Species richness varied considerably between IMCRA bioregions but was highest nearshore, whereas offshore bioregions had lower and more variable values. Highest species richness was recorded for Pilbara Offshore (PIO), followed by Pilbara Nearshore (PIN), Ningaloo (NIN), North West Shelf (NWS), North West Province (NWP) and Central West Transition (CWT) (see Table 2). While the entire areas of the nearshore bioregions were represented within the study area (PIO, PIN, NIN), only sections of the offshore bioregions were included (NWS, NWP, CWT), likely contributing to lower species richness. In general, adjacent bioregions had a greater number of shared species than those that were further apart (Table 2).
Sampling success was significantly affected by collection effort. An increase in sampling days corresponded to an increase in number of stations with sponges, and in a higher number of unique species recorded for all bioregions, except for North West Shelf (Table 3, Figure S1). However, no significant relationship between sampling days and species richness was detected for the entire study area (n = 6, R2 = 0.628, p = 0.061, Figure 4a). More stations with sponges and higher species richness were found with increasing number of collection stations within the Pilbara Nearshore, Ningaloo and North West Province bioregions, but this relationship was weak or not significant for North West Shelf and Pilbara Offshore (Table 3, Figure S2). No regression analysis was conducted for Central West Transition due to the small sample size (n = 2 sampling events).
As collection and survey methods differed between collection trips (expeditions) and bioregions (Table S2), a standardisation of collection effort to area of benthos surveyed (m2) was conducted to provide a more rigorous assessment of species richness within each bioregion (concerning WAM database only). After standardisation to area of benthos surveyed, no significant relationship between the area sampled and species richness was detected (R2 = −0.153, p = 0.593; Figure 4b). Within the nearshore bioregions, Ningaloo showed the highest species richness relative to area of benthos surveyed (1 additional species/180 m2), followed by Pilbara Nearshore (1 species/5000 m2) and Pilbara Offshore (1 species/33,333 m2; Figure 4c).

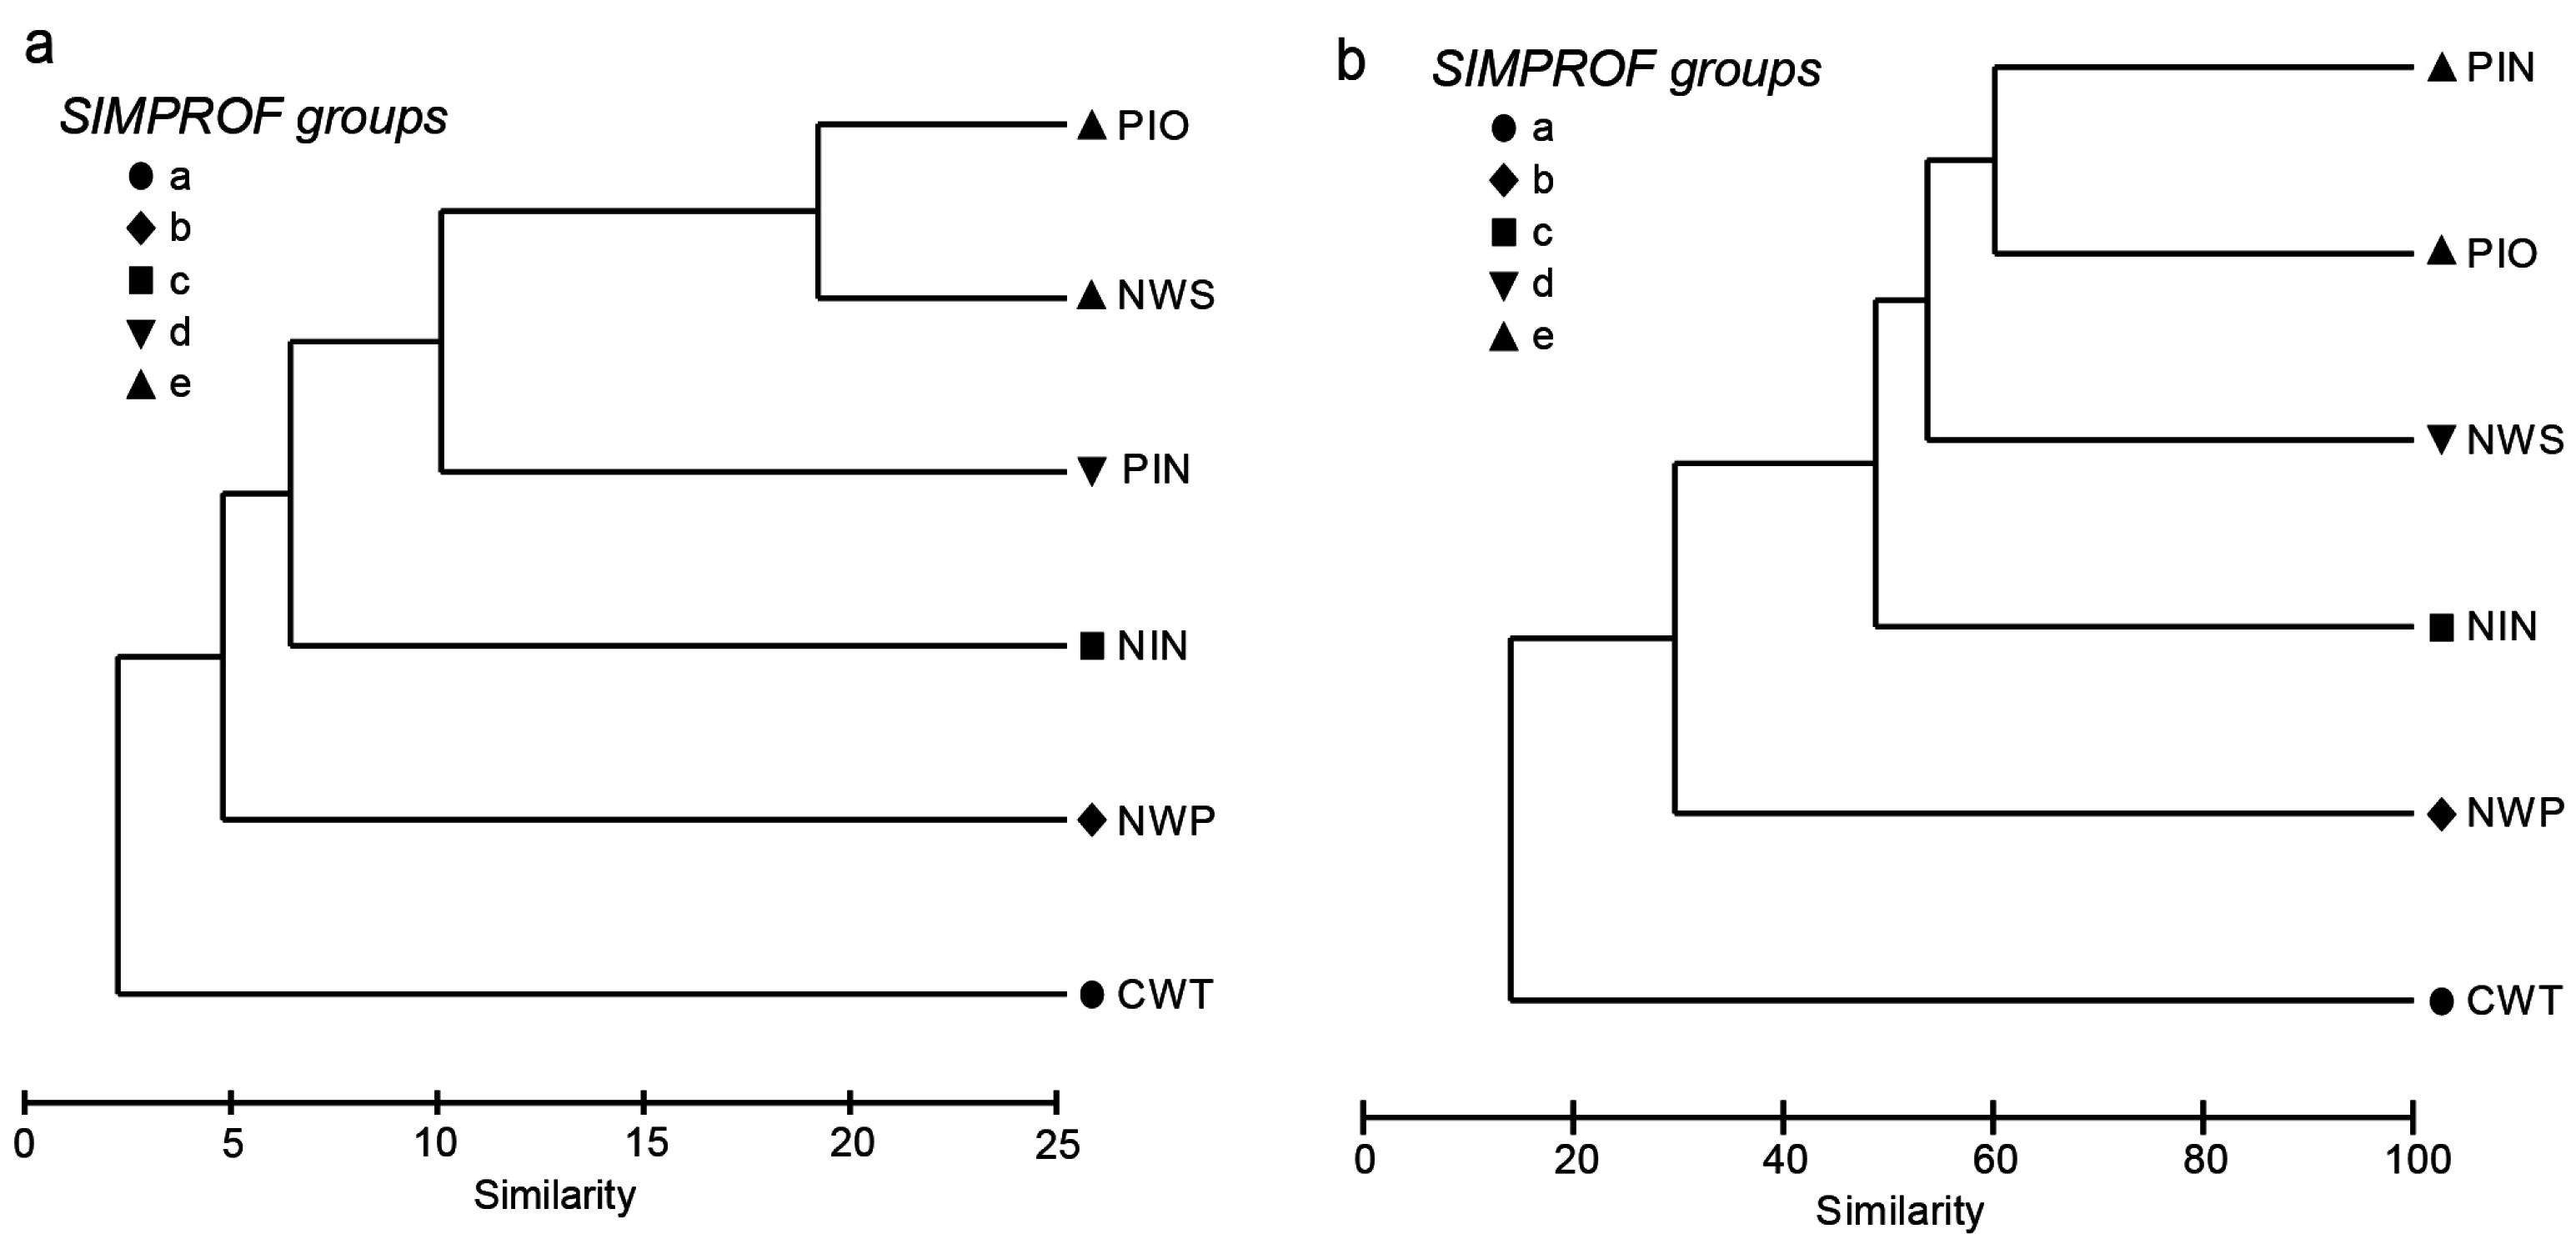
3.3. Community Classification between Bioregions

A comparison of sponge community structure at the species level (mean diversity) resulted in a significant difference between bioregions (Cochran’s Q = 568.82, p < 0.0001). Pairwise comparisons between bioregions showed that Pilbara Offshore shared a large number of species with North West Shelf (n = 104) and Pilbara Nearshore (n = 93; Table 2). Moreover, five statistically distinct clusters were recovered that supported the similarity of sponge communities in Pilbara Offshore and the neighbouring North West Shelf (Figure 5a). The similarity between these two bioregions was further supported by an MDS ordination, corresponding to 15% similarity between groups (Figure 6a). The distribution of the species data within the MDS ordination reflects the actual distribution of the bioregions (see Figure 1), with the spatially most separated bioregions, North West Shelf and Central West Transition, showing the least similarity in species composition and having only one species in common (Table 2).
Similarly, analysis at the genus level resulted in five distinct clusters, with Pilbara Nearshore grouping with neighbouring Pilbara Offshore at 60% similarity (Figure 5b and Figure 6b). Across all bioregions variable average group dissimilarity ranged from 35.1% to 83.9%, with larger dissimilarity encountered between clusters that were spatially distant, with the exception of Central West Transition, which recovered high dissimilarity to its adjacent bioregion, apparently due to the small sample size it represents (Table 4). Within each pairwise comparison between 8 to 17 genera contributed to 20% of the total between group dissimilarity, highlighting the important role of these genera in the characterisation of their communities (Table 4; Table S3).
Within the ten most speciose genera per bioregion, Axinella was one of the most diverse, and one of the most widely distributed across the Pilbara, contributing 1.8% to 6.6% of the species richness, and ranging from one to 15 species, within the bioregions (Figure 7). Highest Axinella species numbers were recovered from the Pilbara Offshore, Pilbara Nearshore and Ningaloo (Figure 7). Echinodictyum, Raspailia, Thorecta and Xestospongia species also occurred in all six bioregions. A number of other genera were diverse and widespread, and likely represented important taxa in the study area, for example Haliclona (2.2% to 8.1% of total bioregion species diversity, with 35 species in Pilbara Nearshore, and 10 in both Pilbara Offshore and Ningaloo), Oceanapia (3.2% to 5.1% and 5–20 species in 5 bioregions), Callyspongia (2.6% to 4.9%, 1–25 species in 5 bioregions) and Clathria (3.6% to 3.9%, 1–20 species in 5 bioregions). Many of these genera have been found to be speciose in other studies in the area, such as at Ningaloo, which found greater than 7 species in the genera Axinella, Xestospongia, Raspailia, Oceanapia and Clathria [3].
In contrast, some genera were found in a number of bioregions but were diverse in only one, for example Crella (6.7% of records in the Central West Transition), Geodia and Hyalonema (both 4.5% in North West Province), and Phakellia and Siphonodictyon (3% and 2.7% in Ningaloo respectively), highlighting the potential influence of habitats in driving genus level diversity within bioregions. The guild of sediment-dwelling, endopsammic sponges was well represented in this study and mostly distributed in the inshore bioregions: Pilbara Offshore, Pilbara Nearshore and Ningaloo.

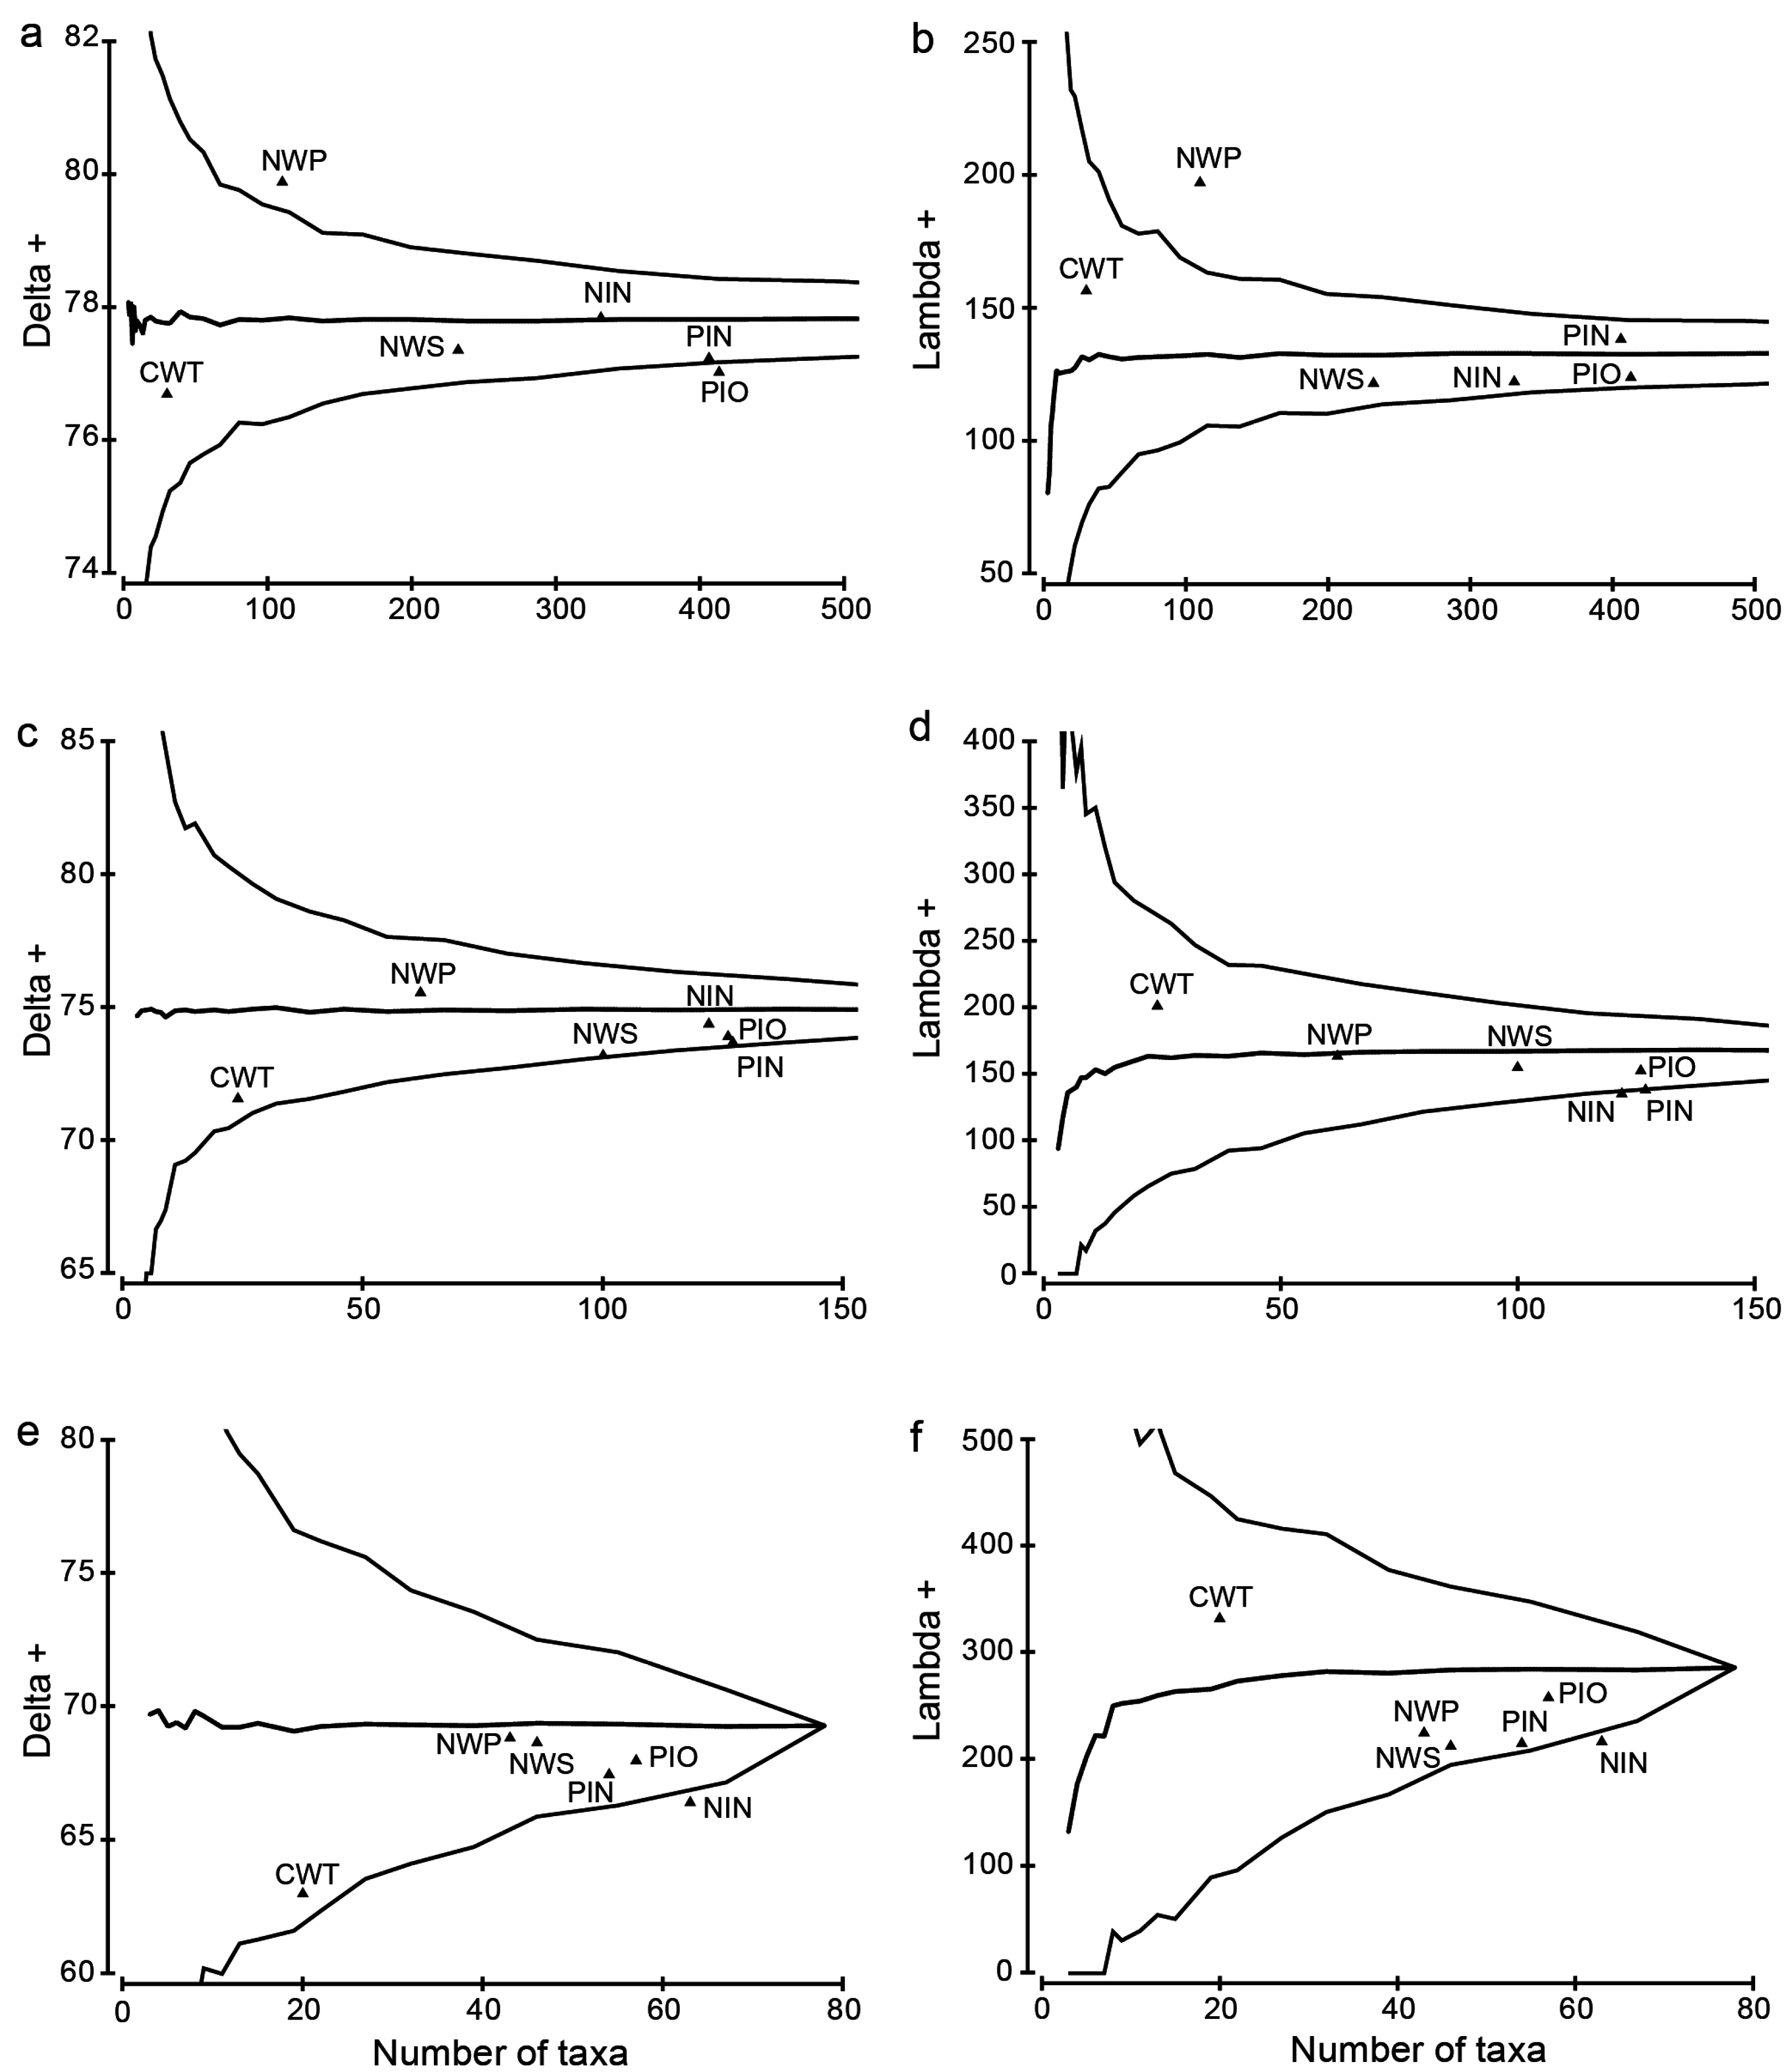
3.4. Taxonomic Distinctness Analyses

At species level, most of the bioregions fell within the 95% predicted range for average taxonomic distinctness that was computed for the Pilbara, except for North West Province (highest distinctness) and Pilbara Offshore (lowest distinctness) deviating from the general pattern (Delta +; p < 0.05 respectively; Figure 8a). The North West Province was the only bioregion that was over-represented in terms of taxonomic heterogeneity in space, measured by variation in taxonomic distinctness (Lambda +; p < 0.05; Figure 8b), i.e., the taxonomic distinctiveness of the North West Province sponge fauna at the species level differed significantly from, and was more heterogeneous than the expected probability model for the whole of the Pilbara. The simulated means for taxonomic distinctness were similar to values derived from the entire dataset, corresponding to 77.8 (AvTD) and 133.0 (VarTD; Figure 8a,b) and suggesting that statistics were independent of differing sample sizes between bioregions (i.e., points for bioregions fell within the 95% modelled probability contour despite bioregion species richness). At the generic level, all of the bioregions were of similar heterogeneity within the overall region (Figure 8c,d; p > 0.05), while at the family level only Ningaloo deviated from the overall study area (Figure 8d,e; p < 0.05 for both, AvTD and VarTD). Thus, with the exception of the North West Shelf and Pilbara Nearshore at species level, and Ningaloo at family level, the modelled 95% probability contour was a reasonable fit for these sponge faunal distributions.

4. Discussion

With 1164 sponge species of which 1129 are demosponges, the Pilbara is characterised by very high species richness, yielding one of the highest species counts recorded for an area of similar size, even in a global context. A similar study, but based exclusively on beam trawl and epibenthic sled collections of the inter-reef fauna (i.e., excluding sponges associated with shallow emergent coral reefs collected by SCUBA and reef walking), reported 1200 sponge morphospecies for the Great Barrier Reef on the east coast of Australia [60]. Taxonomic resolution of those OTUs remains a work in progress. The high species richness observed for northern tropical Australia highlights the immense significance of the Australian continental shelf as a habitat for marine sponges, with numerous biodiversity hotspots reported [3,4,19,26,27]. Presently the Pilbara stands out in northwestern Australia, with the number of sponge species recorded in this study much higher than in the neighbouring Kimberley (342 species, based on a similar historic study, [46]), although this difference may lessen with sampling programs presently being undertaken in the latter region.
Using the ‘biodiversity hotspot’ concept of [26] (i.e., a bioregion with >250 species) indicates that Pilbara Offshore, Pilbara Nearshore and Ningaloo are all bioregional diversity hotspots for sponges (413, 406 and 331 species respectively). While the North West Shelf bioregion did not meet this criterion, it was still considered highly biodiverse with 232 species. The World Heritage proclaimed Ningaloo Reef has already been recognised as a sponge biodiversity hotspot [1,3], with this study increasing the number of species for Ningaloo from 261 to 331. Based on locally rich sponge grounds, the value of this region has been acknowledged with the establishment of a non-anchoring zone within the Ningaloo bioregion at Mandu [1,3]. The Ningaloo bioregion is unique compared to the other bioregions investigated possessing more diverse habitats, including fringing reefs to the north and a transition zone from tropical to temperate climates in the south (see Table 1). This tropical-temperate transition may have contributed to the high sponge diversity in this bioregion by supporting both tropical and temperate species, as also seen for other marine transition zones and taxa (e.g., [61,62,63]. Greater habitat heterogeneity has been associated with higher biodiversity for marine fish and invertebrates [64,65], and this also affects sponge communities. In the Dampier Archipelago, where a marine park has long been proposed [66], high habitat complexity corresponded to high sponge species richness [27], which contributed to the high biodiversity values recorded here for the Pilbara Nearshore bioregion. In contrast, less complex habitats, typical for offshore localities such as continental slopes, are limited to more specialised species such as the glass sponge genus Hyalonema, which was found mainly in North West Province. Interestingly, even though the North West Province was less speciose compared to the other bioregions, it displayed an anomalously high taxonomic distinctness and heterogeneity at the species level, thus deviating from the taxonomic composition pattern of other bioregions and making it a unique bioregion within the Pilbara. This finding may represent the effect of another ‘transition zone’, where shallow water communities merge into deep water communities over a small spatial distance, but both communities occur within the same bioregion.
While high species richness near or above 250 species was recorded for some bioregions, two other regions only exhibited moderate to low diversities. The comparative paucity of species in the North West Province (110) and Central West Transition (30) may in part be attributed to incomplete inclusion of these bioregions in the present study, which by choice of study area excluded additional unique sponge species that have been sampled, but fell outside the boundaries of the study area. In addition, in contrast to increased sampling days generally corresponding to higher number of species recovered, there was a lack of relationship between species richness and area of benthos surveyed. Although it is acknowledged that sampling days and collection methods differ greatly between bioregions, sampling methodology may partly be influential in species recovery. For example, beam trawling, which was the main sampling method in the North West Shelf bioregion, may not be as effective in sampling sponges as an epibenthic sled, which was primarily used at Ningaloo. Furthermore, while sampling methods may play a role in the effectiveness of collecting within specific habitats, naturally heterogeneous distributions of sponge communities within bioregions could also influence rates of species discovery.
To date, two of the IMCRA bioregions in the study area, North West Transition and Eighty Mile Beach, have not yet been sampled for sponges. These two bioregions are environmentally distinct from the others in the Pilbara, with the inshore Eighty Mile Beach region having a shallow coastline and no emergent reef systems [37], and the offshore North West Transition being comprised of slope, terraces and bathyal habitats with very high gravel content [67]. It is likely that these habitats will yield additional sponge species presently not part of the studied collections. Despite the high species richness reported in this study, a sampling effort of <1% of the total area for every bioregion is apparent, and a high likelihood of recovering new sponge species is expected with future sampling. Furthermore, these OTUs are morphology-based. With increasing molecular studies the discovery of cryptic species (MOTUs) is very likely [32] but this aspect has not been captured in this study.
Demosponges clearly dominated the Pilbara sponge community (97%). This observation is consistent with patterns in the global biodiversity of sponges as by far most of the Linnean species are demosponges [16,68], and for regional studies such as in northern Australian [3,4,27,69]. Not surprisingly, dominant orders in this study with more than 100 species were the axinellids, haplosclerids, poecilosclerids, tetractinellids and dictyoceratids, all of which have been previously recognised as highly diverse taxa [68,70,71].
In contrast, only 15 species of calcareans and eight homoscleromorphs were found in the Pilbara. Previous studies in northwest Australia have reported a low incidence of calcareous species consistent with numbers reported here (7 species: Dampier Archipelago, [70]; 5 species: Northwest Atolls, [69]; 4 species: eastern Joseph Bonaparte Gulf [4]). Likewise, homoscleromorphs were also recorded in low numbers (1 species: Dampier Archipelago, [70]; 4 species: Northwest Atolls, [69]; 3 species: eastern Joseph Bonaparte Gulf [4]). Globally, the Homoscleromorpha have a limited diversity (103 species, [16]). Apart from being a small taxon, they are usually small in size or occur in cryptic habitats (in cavities, under overhangs), and can easily be overlooked during collections [72,73]. This is also true for the Calcarea, which are often small and fragile and may easily be crushed or lost when not specifically sampled by divers (e.g., [16]). In addition, twelve species of the Hexactinellida were recorded, from 60–200 m depth in shallower bioregions, such as PIO and NWS, and most (9 species) recovered from deeper habitats in the NWP bioregion (300–700 m). As hexactinellid sponges are mainly restricted to deeper waters of 200 to >6000 m [16], they were not common in the present collection material which originated from shelf habitats. At least for the hexactinellids more species are expected to be discovered if future sampling extends into deeper water.
Within the 27 most speciose genera (Figure 7), two genera that are known to predominantly contain endopsammic species (Oceanapia and Siphonodictyon), and others that strongly depend on the incorporation of sediment as a skeletal component, (Psammocinia spp.), occur predominantly in Pilbara Offshore, Pilbara Nearshore and Ningaloo and occasionally extend into the North West Shelf bioregion. Sediment conditions are very different between the more sandy grounds at Ningaloo and finer sediments in Pilbara Offshore and Pilbara Nearshore. While it is generally accepted that sediment adapted sponges are mostly known from sandy conditions [52], it is clear that many of them can also inhabit fine sediments or tolerate deposition of fine sand to mud on their surfaces, as commonly occurs in the area. Sediment adapted species were not common in North West Province and Central West Transition, bioregions with low turbidity [41].
An important finding in this study was the very high number of “apparent endemics”, with 907 of the 1164 species (78%) having distributions restricted to one bioregion. Consequently very few species were widespread (74 species occurring in three or more bioregions). Many more species await description, which will likely increase the number of species endemic to northwestern Australia. The 172 Linnean species provided information on affinities on a global scale and further confirmed a high level of endemism in the project area. Almost half the Linnean species (77 = 45%) were endemic to Australia. Within that endemic proportion almost a quarter (17 species = 22%) were endemic to the North West Australian Shelf. Endemism has commonly been explained by past isolation or low dispersal abilities with subsequent speciation within the area, or extinction in surrounding areas [74,75,76]. Given that over two thirds of the species recognised in the present study were perceived as endemics, and considering that sponges have a lower dispersal potential compared to some other taxa, sponges may be comparatively predisposed to endemism. Sponges are sessile benthic organisms with numerous species having larvae of limited swimming capability which commonly display a short pelagic phase of hours to a few days, circumstances which may limit the geographical range of many species [77,78,79].
Overall, endemism of the benthic fauna on the North West Shelf is proposed to be in the order of 20%, and high endemism and high biodiversities have been reported for molluscs and echinoderms [37]. While the North West Shelf was historically directly connected to the Coral Triangle throughout most of the Quarternary (2.6 MA to present), and a connection still remains with the Central Indo-West Pacific via the Indonesian Throughflow, restricted distributions have been found in marine invertebrates that have limited pelagic dispersal [37].
Two examples further stress the value of the area. Earlier research on the Australian Raspailiidae indicated a disproportionately high number of species (38) in northwest compared to northeast Australia (13 species), with fifteen raspailiids thought to be endemic to the northwest [80]. Notably, the northwest had the greatest diversity of Ianthellidae with two apparent endemics, Anomoianthella popae and Ianthella labyrinthus [81]. The more widespread I. basta and I. flabelliformis also occur here, which means that four of the six species of the Ianthellidae reported from Australia and surrounding areas are found in northwest Australia [70,81]. Furthermore, [82] showed that north and northwestern Australian populations of the allegedly widespread I. basta represent at least two genetically distinct cryptic species, different from the nominotypical western Pacific population (including the species’ type locality of Indonesia). These findings emphasise the importance of recognising and maintaining conservation values at ‘local’ (bioregional) levels, where so-called widespread species of sponges are increasingly being found to contain new genetic resources hiding amongst cryptic sibling species.
The small number of Linnean species, 15% compared to 85% tentatively identified species and OTUs, demonstrates the difficult situation in sponge science, where surveys generate increasingly detailed impressions of diversity patterns [33,83], but are not able to determine how these communities function in their environments or react to changes and disturbance events. Sponge taxonomy is challenging and time consuming, and the backlog of scientific descriptions can be overwhelming. Furthermore, knowledge about functional biology is largely nonexistent. Where information is available at species level and some biological traits are known, more precise conservation evaluations can be made.
Large data analyses such as this one will likely encourage future research in the area, on taxonomy, as well as on distribution patterns, and species ecology and biology. Museum collections and records not only represent challenging formats and workloads, they also present opportunities to generate large scale information, explain developments over time, find relationships between the studied biota and their environments, and will ultimately create a better understanding of the value of certain bioregions or the rarity of certain species [84,85,86,87]. In order to enable continuation of such metastudies, museum records need to be standardised and OTUs need to be matched between different collections. Such a national project, matching OTUs Australia wide, is currently underway for sponges [33,34], including the OTUs in this study.
Careful assessments of impacts on potentially unique species in each bioregion are required as part of effective management procedures for sponges in the rapidly changing Pilbara. Recent heating events caused coral bleaching and mortality, but local coral species are also known from other areas [44]. However, for sponges the risk of losing not only local communities, but endemic species, to disturbance events is considerably larger, which needs to be taken into consideration for management priorities [4,19,88,89]. To ensure the sustained occurrence of these habitat forming communities, the species rich and rapidly changing bioregions, Pilbara Nearshore and Offshore, should be assessed for marine protection.
In summary, this study is a clear testimony of the immense diversity and the high level of endemism of sponges in northwestern Australia. It is the first to synthesise and analyse recent and historical sponge data for such a large marine area in Western Australia, and extends the high species richness recorded for the Indo-West Pacific to the tropical eastern Indian Ocean. The data presented here is valuable as it enhances our understanding of sponge communities in the Pilbara, and builds a base for ensuing monitoring and research programs.

Supplementary Materials

The following are available online at www.mdpi.com/1424-2818/8/4/21/s1, Figure S1: Frequency plots of stations with sponges against number of collection days for all bioregions, Figure S2: Frequency plots of stations with sponges against total number of collection stations for all bioregions, Table S1: Complete described species list and occurrences, Table S2: Summary of collection effort to the final species list, Table S3: Pairwise SIMPER comparison statistics for genera contributing to average dissimilarity between bioregions.

Acknowledgments

This project was funded by the Western Australian Marine Science Institution (WAMSI) as part of the WAMSI Dredging Science Node, and made possible through investment from Chevron Australia, Woodside Energy Limited, BHP Billiton and co-investment from the WAMSI Joint Venture partners. The commercial investors and data providers had no role in the data analysis, data interpretation, the decision to publish or on the preparation of the manuscript. Numerous funding sources enabled the collection of the specimens: Woodside Pty Ltd., WAMSI Node I, the surrogates project of the Commonwealth Environmental Research Facility, CReefs, Murdoch University, CSIRO Wealth from Oceans Flagship. DPaW provided the permits for the fieldwork, conducted on the research vessels RV Soela, RV Southern Surveyor, RV Cape Ferguson, RV Solander. Bob Clarke from the PRIMER team is acknowledged for discussions on the relative merit of different statistical analyses.

Author Contributions

J.F. conceived and led the study, and determined the databases and historical data to be sourced for information. O.G. finalized project area definition and maps, undertook data extraction and data Q.A.Q.C. M.A.A.W., J.H., M.E. and M.G. provided statistical support, and M.A.A.W. and M.G. performed statistical analyses and produced figures and tables. J.F., M.A.A.W., J.H., M.E. and M.G. wrote the paper.

Conflicts of Interest

The authors declare no conflict of interest. The founding sponsors had no role in the design of the study; in the collection, analyses, or interpretation of data; in the writing of the manuscript, and in the decision to publish the results.

References

  1. Heyward, A.; Fromont, J.; Schönberg, C.Z.; Colquhoun, J.; Radford, B.; Gomez, O. The sponge gardens of Ningaloo Reef, Western Australia. Open Mar. Biol. J. 2010, 4, 3–11. [Google Scholar]
  2. Wörheide, G.; Vargas, S.; Lüter, C.; Reitner, J. Precious coral and rock sponge gardens on the deep aphotic fore-reef of Osprey Reef (Coral Sea, Australia). Coral Reefs 2011, 30, 901. [Google Scholar] [CrossRef]
  3. Schönberg, C.H.L.; Fromont, J. Sponge gardens of Ningaloo Reef (Carnarvon Shelf, Western Australia) are biodiversity hotspots. Hydrobiologia 2012, 687, 143–161. [Google Scholar] [CrossRef]
  4. Przeslawski, R.; Alvarez, B.; Battershill, C.; Smith, T. Sponge biodiversity and ecology of the Van Diemen Rise and eastern Joseph Bonaparte Gulf, northern Australia. Hydrobiologia 2014, 730, 1–16. [Google Scholar] [CrossRef]
  5. Wulff, J.L. Ecological interactions of marine sponges. Can. J. Zool. 2006, 84, 146–166. [Google Scholar] [CrossRef]
  6. Wulff, J.L. Assessing and monitoring coral reef sponges: Why and how? Bull. Mar. Sci. 2001, 69, 831–846. [Google Scholar]
  7. Bell, J.J. The functional roles of marine sponges. Estuar. Coast. Shelf Sci. 2008, 79, 341–353. [Google Scholar] [CrossRef]
  8. Richter, C.; Wunsch, M.; Rasheed, M.; Kötter, I.; Badran, M.I. Endoscopic exploration of Red Sea coral reefs reveals dense populations of cavity-dwelling sponges. Nature 2001, 413, 726–730. [Google Scholar] [CrossRef] [PubMed]
  9. Maldonado, M.; Carmona, M.C.; Velásquez, Z.; Puig, A.; Cruzado, A.; López, A.; Young, C.M. Siliceous sponges as a silicon sink: An overlooked aspect of the benthopelagic coupling in the marine silicon cycle. Limnol. Oceanogr. 2005, 50, 799–809. [Google Scholar] [CrossRef]
  10. Maldonado, M.; Ribes, M.; van Duyl, F.C. Nutrient fluxes through sponges. Biology, budgets, and ecological implications. In Advances in Marine Biology; Elsevier Ltd.: London, UK, 2012; Volume 62, pp. 113–182. [Google Scholar]
  11. De Goeij, J.M.; van Oevelen, D.; Vermeij, M.J.A.; Osinga, R.; Middelburg, J.J.; de Goeij, A.F.P.M.; Admiraal, W. Surviving in a marine desert: The sponge loop retains resources within coral reefs. Science 2013, 342, 108–110. [Google Scholar] [CrossRef] [PubMed]
  12. De Goeij, J.M.; van Den Berg, H.; van Oostveen, M.M.; Epping, E.H.G.; van Duyl, F.C. Major bulk dissolved organic carbon (DOC) removal by encrusting coral reef cavity sponges. Mar. Ecol. Prog. Ser. 2008, 357, 139–151. [Google Scholar] [CrossRef]
  13. Keesing, J.K.; Strzelecki, J.; Fromont, J.; Thomson, D. Sponges as important sources of nitrate on an oligotrophic continental shelf. Limnol. Oceanogr. 2013, 58, 1947–1958. [Google Scholar] [CrossRef]
  14. Becerro, M. Quantitative trends in sponge ecology research. Mar. Ecol. 2008, 29, 167–177. [Google Scholar] [CrossRef]
  15. Przeslawski, R.; Ahyong, S.; Byrne, M.; Wörheide, G.; Hutchings, P. Beyond corals and fish: The effects of climate change on noncoral benthic invertebrates of tropical reefs. Glob. Chang. Biol. 2008, 14, 2773–2795. [Google Scholar] [CrossRef]
  16. Van Soest, R.W.M.; Boury-Esnault, N.; Vacelet, J.; Dohrmann, M.; Erpenbeck, D.; de Voogd, N.J.; Santodomingo, N.; Vanhoorne, B.; Kelly, M.; Hooper, J.N.A. Global diversity of sponges (Porifera). PLoS ONE 2012, 7, e35105. [Google Scholar] [CrossRef] [PubMed] [Green Version]
  17. Saleuddin, A.; Fenton, M. Biology of neglected groups: Porifera (sponges). Can. J. Zool. Res. 2006, 82, 143–356. [Google Scholar]
  18. Bell, J.J.; Mcgrath, E.; Biggerstaff, A.; Bates, T.; Cárdenas, C.A.; Bennett, H. Global conservation status of sponges. Conserv. Biol. 2015, 29, 42–53. [Google Scholar] [CrossRef] [PubMed]
  19. Przeslawski, R.; Alvarez, B.; Kool, J.; Bridge, T.; Caley, M.J.; Nichol, S. Implications of sponge biodiversity patterns for the management of a marine reserve in Northern Australia. PLoS ONE 2015, 10, e0141813. [Google Scholar] [CrossRef] [PubMed]
  20. Al-Zibdah, M.K.; Damhoureyeh, S.A.; Badran, M.I. Temporal variations in coral reef health at a coastal industrial site on the Gulf of Aqaba Red Sea. Oceanologia 2007, 49, 565–578. [Google Scholar]
  21. Mirams, A.G.K.; Treml, E.A.; Shields, J.L.; Liggins, L.; Riginos, C. Vicariance and dispersal across an intermittent barrier: Population genetic structure of marine animals across the Torres Strait land bridge. Coral Reefs 2011, 30, 937–949. [Google Scholar] [CrossRef]
  22. Pitcher, C.R.; Ellis, N.; Venables, W.N.; Wassenberg, T.J.; Burridge, C.Y.; Smith, G.P.; Browne, M.; Pantus, F.; Poiner, I.R.; Doherty, P.J.; et al. Effects of trawling on sessile megabenthos in the Great Barrier Reef and evaluation of the efficacy of management strategies. ICES J. Mar. Sci. 2016, 73, i115–i126. [Google Scholar] [CrossRef]
  23. Gilliam, D.S.; Walker, B.K.; Saelens, S.J.; Fahy, D.P.; Kosmynin, V.N. Recovery of injured giant barrel sponges, Xestospongia muta, offshore southeast Florida. Proc. 11th Int. Coral Reef Symp. 2008, 55, 7–11. [Google Scholar]
  24. Makowski, C.; Keyes, P. Using the benthic ecological assessment for marginal reefs (BEAMR) method to quantify nearshore reef conditions in the southeast Gulf of Mexico. J. Coast. Res. 2011, 27, 428–440. [Google Scholar] [CrossRef]
  25. Lang, J.; Marks, K.; Kramer, P.; Ginsburg, R. AGRRA Protocols Version 5.4. Available online: http://www.agrra.org/method/AGRRA-V5.4_2010.pdf (accessed on 10 August 2012).
  26. Hooper, J.N.A.; Kennedy, J.A.; Quinn, R.J. Biodiversity “hotspots”, patterns of richness and endemism, and taxonomic affinities of tropical Australian sponges (Porifera). Biodivers. Conserv. 2002, 11, 851–885. [Google Scholar] [CrossRef]
  27. Fromont, J.; Vanderklift, M.A.; Kendrick, G.A. Marine sponges of the Dampier Archipelago, Western Australia: Patterns of species distributions, abundance and diversity. Biodivers. Conserv. 2006, 15, 3731–3750. [Google Scholar] [CrossRef]
  28. Currie, D.R.; Dixon, C.D.; Roberts, S.D.; Hooper, G.E.; Sorokin, S.J.; Ward, T.M. Relative importance of environmental gradients and historical trawling effort in determining the composition and distribution of benthic macro-biota in a large inverse estuary. Fish. Res. 2011, 107, 184–195. [Google Scholar] [CrossRef]
  29. Fromont, J.; Althaus, F.; McEnnulty, F.R.; Williams, A.; Salotti, M.; Gomez, O.; Gowlett-Holmes, K. Living on the edge: The sponge fauna of Australia’s southwestern and northwestern deep continental margin. Hydrobiologia 2012, 687, 127–142. [Google Scholar] [CrossRef]
  30. Sorokin, S.; Fromont, J.; Currie, D. Demosponge biodiversity in the Benthic Protection Zone of the Great Australian Bight. Trans. R. Soc. South Aust. 2007, 131, 192–204. [Google Scholar]
  31. Van Soest, R.W.M.; Boury-Esnault, N.; Hooper, J.N.A.; de Voogd, N.J.; de Glasby, B.A.; Hajdu, E.; Pisera, A.; Manconi, R.; Schönberg, C.H.L.; Janussen, D.; et al. World Porifera Database. Available online: http://www.marinespecies.org/porifera (accessed on 13 July 2015).
  32. Poppe, J.; Sutcliffe, P.; Hooper, J.N.A.; Wörheide, G.; Erpenbeck, D. CO I barcoding reveals new clades and radiation patterns of indo-pacific sponges of the family Irciniidae (Demospongiae: Dictyoceratida). PLoS ONE 2010, 5. [Google Scholar] [CrossRef] [PubMed] [Green Version]
  33. Hooper, J.N.A.; Hall, K.A.; Ekins, M.; Erpenbeck, D.; Wörheide, G.; Jolley-Rogers, G. Managing and sharing the escalating number of sponge “unknowns”: The Sponge Maps project. Integr. Comp. Biol. 2013, 53, 473–481. [Google Scholar] [CrossRef] [PubMed]
  34. Hooper, J.; Ekins, M. Collation and validation of museum collection databases related to the distribution of marine sponges in Northern Australia. Tech. Rep. Queensl. Museum 2004, 2, 1–225. [Google Scholar]
  35. Semeniuk, V. Coastal forms and quaternary processes along the arid Pilbara coast of northwestern Australia. Palaeogeogr. Palaeoclimatol. Palaeoecol. 1996, 123, 49–84. [Google Scholar] [CrossRef]
  36. Semeniuk, V. The Pilbara coast: A riverine coastal plain in a tropical arid setting, northwestern Australia. Sediment. Geol. 1993, 83, 235–256. [Google Scholar] [CrossRef]
  37. Wilson, B. The Biogeography of the Australian North West Shelf: Environmental Change and Life’s Response; Elsevier: Burlington, NJ, USA, 2013. [Google Scholar]
  38. Sainsbury, K.; Campbell, R.; Whitelaw, A. Effects of Trawling on the Marine Habitat on the North West Shelf of Australia and Implications for Sustainable Fisheries Management; Geoscience Australia: Symonston, Australia, 1993; pp. 137–145.
  39. Daume, S.; Fromont, J.; Hart, A. Management of Bioeroding Sponges in Wild Stocks of Pinctada Maxima in Western Australia; Final Fisheries Report No. 196, 2009; Western Australian Fisheries and Marine Research Laboratories: Perth, Australia, 2009.
  40. Ball, A.; Bernie, K.; Feng, A.; McCluskey, C.; Stanwix, G.; Willcock, T.; Wokker, N. Energy in Australia 2014; Australian Government: Canberra, Australia, 2014.
  41. Atlas of Living Australia. Available online: http://www.ala.org.au (accessed on 1 March 2013).
  42. Short, A.D. Sediment transport around Australia—Sources, mechanisms, rates, and barrier forms. J. Coast. Res. 2010, 263, 395–402. [Google Scholar] [CrossRef]
  43. Short, A.D. Australian beach systems—Nature and distribution. J. Coast. Res. 2006, 221, 11–27. [Google Scholar] [CrossRef]
  44. Lafratta, A.; Fromont, J.; Speare, P.; Schönberg, C.H.L. Coral bleaching in turbid waters of north-western Australia. Mar. Freshw. Res. 2016, MF15314. [Google Scholar] [CrossRef]
  45. Bancroft, K.P.; Long, S. Modelling Suggests Connectivity between the Ningaloo Reef and Coral Reefs of the Pilbara. In Discovering Ningaloo: Latest findings and their implications for management; Waples, K., Hollander, E., Eds.; Ningaloo Research Coordinating Committee: Kensington, WA, USA, 2008; pp. 61–64. [Google Scholar]
  46. Fromont, J.; Sampey, A. Kimberley Marine Biota. Historical Data: Sponges (Porifera). Rec. West. Aust. Museum 2014, 84, 69–100. [Google Scholar] [CrossRef]
  47. Sampey, A.; Bryce, C.; Osborne, S.; Miles, A. Kimberley marine biota. Historical data: Introduction and methods. Records of the Western Australian Museum Supplement. Rec. West. Aust. Museum Suppl. 2014, 84, 19–43. [Google Scholar] [CrossRef]
  48. Interim Marine and Coastal Regionalisation for Australia Technical Group. Interim Marine and Coastal Regionalisation for Australia: An Ecosystem-Based Classification for Marine and Coastal Environments. Version 3.3; Environment Australia, Department of the Environment: Canberra, Australia, 1998; pp. 1–27.
  49. Commonwealth of Australia. A Guide to the Integrated Marine and Coastal Regionalisation of Australia: IMCRA Version 4.0.; Australian Government: Canberra, Australia, 2006.
  50. Spalding, M.D.; Fox, H.E.; Allen, G.R.; Davidson, N.; Ferdaña, Z.A.; Finlayson, M.; Halpern, B.S.; Jorge, M.A.; Lombana, A.; Lourie, S.A.; et al. Marine Ecoregions of the World: A Bioregionalization of Coastal and Shelf Areas. Bioscience 2007, 57, 573–583. [Google Scholar] [CrossRef]
  51. Morrow, C.; Cardenas, P. Proposal for a revised classification of the Demospongiae (Porifera). Front. Zool. 2015, 12. [Google Scholar] [CrossRef] [PubMed]
  52. Schönberg, C.H.L. Happy relationships of marine sponges with sediments–a review and some observations from Australia. J. Mar. Biol. Assoc. UK 2015, 96, 493–514. [Google Scholar] [CrossRef]
  53. Zar, J. Biostatistical Analysis; Northern Illinois University: DeKalb, IL, USA, 1999. [Google Scholar]
  54. Clarke, K.R.; Gorley, R. Primer Version 7: User Manual/ Tutorial; PRIMER-E: Plymouth, UK, 2015. [Google Scholar]
  55. Clarke, K.R.; Warwick, R.M. A further biodiversity index applicable to species lists: Variation in taxonomic distinctness. Mar. Ecol. Prog. Ser. 2001, 216, 265–278. [Google Scholar] [CrossRef]
  56. Clarke, K.R.; Warwick, R.M. A taxonomic distinctness index and its statistical proprieties. J. Appl. Ecol. 1998, 35, 523–531. [Google Scholar] [CrossRef]
  57. Warwick, R.M.; Clarke, K.R. Taxonomic distinctness and environmental assessment. J. Appl. Ecol. 1998, 35, 532–543. [Google Scholar] [CrossRef]
  58. Izsak, C.; Price, A. Measuring β-diversity using a taxonomic similarity index, and its relation to spatial scale. Mar. Ecol. Prog. Ser. 2001, 215, 69–77. [Google Scholar] [CrossRef]
  59. Hooper, J.N.A.; Kennedy, J.A. Small-scale patterns of sponge biodiversity (Porifera) on Sunshine Coasts reefs, eastern Australia. Invertebr. Syst. 2002, 16, 637–653. [Google Scholar] [CrossRef]
  60. Sutcliffe, P.R.; Hooper, J.N.A.; Pitcher, C.R. The most common sponges on the Great Barrier Reef seabed, Australia, include species new to science ( Phylum Porifera ). Zootaxa 2010, 2616, 1–30. [Google Scholar]
  61. Connolly, S.R.; Bellwood, D.R.; Hughes, T.P. Indo-Pacific biodiversity of coral reefs: Deviations from a mid-domain model. Ecology 2003, 84, 2178–2190. [Google Scholar] [CrossRef]
  62. Malcolm, H.A.; Jordan, A.; Smith, S.D.A. Biogeographical and cross-shelf patterns of reef fish assemblages in a transition zone. Mar. Biodivers. 2010, 40, 181–193. [Google Scholar] [CrossRef]
  63. Anderson, R.; Bolton, J.; Smit, A.; da Silva Neto, D. The seaweeds of Angola: The transition between tropical and temperate marine floras on the west coast of southern Africa. Afr. J. Mar. Sci. 2012, 34, 1–13. [Google Scholar] [CrossRef]
  64. Gratwicke, B.; Speight, M.R. The relationship between fish species richness, abundance and habitat complexity in a range of shallow tropical marine habitats. J. Fish Biol. 2005, 66, 650–667. [Google Scholar] [CrossRef]
  65. Kovalenko, K.E.; Thomaz, S.M.; Warfe, D.M. Habitat complexity: Approaches and future directions. Hydrobiologia 2012, 685, 1–17. [Google Scholar] [CrossRef]
  66. Western Australia, Department of conservation and land management. Indicative Management Plan for the proposed Dampier Archipelago Marine Park and Cape Preston Marine Management Area; Marine Parks and Reserves Authority: Kensington, Australia, 2005.
  67. Li, J.; Potter, A.; Huang, Z.; Daniel, J.; Heap, A. Predicting Seabed Mud Content Across the Australian Margin: Comparison of Statistical and Mathematical Techniques Using A Simulation Experiment; Geoscience Australia: Canberra, Australia, 2011.
  68. Hooper, J.; van Soest, R. Systema Porifera: A Guide to the Classification of Sponges; Kluwer Academic/Plenum Publishers: New York, NY, USA, 2002. [Google Scholar]
  69. Fromont, J.; Vanderklift, M.A. Porifera (sponges) of Mermaid, Scott and Seringapatam Reefs, north Western Australia. Rec. West. Aust. Museum 2009, 77, 89–103. [Google Scholar] [CrossRef]
  70. Fromont, J. Porifera (Sponges) in the Dampier Archipelago: Taxonomic Affinities and Biogeography. The Marine Flora and Fauna of Dampier, Western Australia; Western Australian Museum: Perth, Australia, 2003; pp. 405–417.
  71. Kelly, M.; Hooper, J.N.A.; Paul, V.; Pauley, G.; van Soest, R. Taxonomic inventory of sponges (Porifera) of the Mariana Islands. Micronesia 2002, 6, 100–120. [Google Scholar]
  72. Domingos, C.; Moraes, F.; Muricy, G. Four new species of Plakinidae (Porifera: Homoscleromorpha) from Brazil. Zootaxa 2013, 3718, 530–544. [Google Scholar] [CrossRef] [PubMed]
  73. Cruz-Barraza, J.A.; Carballo, J. First record of Plakortis Schulze (Porifera: Homosclerophorida) from the Northeast Pacific coast, with the description of Plakortis albicans sp. nov. Zootaxa 2005, 868, 1–12. [Google Scholar]
  74. Poloczanska, E.; Babcock, R.C.; Butler, A.; Hobday, A.; Hoegh-Guldberg, O.; Kunz, T.; Matear, R.; Milton, D.; Okey, T.; Richardson, A. Climate change and Australian marine life. Ocean. Mar. Biol. Ann. Rev. 2007, 45, 407. [Google Scholar]
  75. Reaka, M.; Rodgers, P.; Kudla, A. Patterns of biodiversity and endemism on Indo-West Pacific coral reefs. Proc. Nat. Acad. Sci. USA 2008, 105, 11474–11481. [Google Scholar] [CrossRef] [PubMed]
  76. Eble, J.; Toonen, R.; Bowen, B. Endemism and dispersal: Comparative phylogeography of three surgeonfishes across the Hawaiian Archipelago. Mar. Biol. 2009, 156, 689–698. [Google Scholar]
  77. Maldonado, M. The ecology of the sponge larva. Can. J. Zool. 2006, 84, 175–194. [Google Scholar] [CrossRef]
  78. Abdul Wahab, M.A.; de Nys, R.; Whalan, S. Larval behaviour and settlement cues of a brooding coral reef sponge. Coral Reefs 2011, 30, 451–460. [Google Scholar] [CrossRef]
  79. Abdul Wahab, M.A.; Fromont, J.; Whalan, S.; Webster, N.; Andreakis, N. Combining morphometrics with molecular taxonomy: How different are similar foliose keratose sponges from the Australian tropics? Mol. Phylogenet. Evol. 2014, 73, 23–39. [Google Scholar] [CrossRef] [PubMed]
  80. Hooper, J. Revision of the family Raspailiidae (Porifera: Demospongiae), with description of Australian species. Invertebr. Taxon. 1991, 5, 1179–1481. [Google Scholar] [CrossRef]
  81. Bergquist, P.R.; Kelly-Borges, M. Systematics and biogeography of the genus Ianthella (Demospongiae: Verongida: Ianthellidae) in the south-west Pacific. Beagle Rec. Mus. Art Gall. North. Territ. 1995, 12, 151–176. [Google Scholar]
  82. Andreakis, N.; Luter, H.M.; Webster, N.S. Cryptic speciation and phylogeographic relationships in the elephant ear sponge Ianthella basta (Porifera, Ianthellidae) from northern Australia. Zool. J. Linn. Soc. 2012, 166, 225–235. [Google Scholar] [CrossRef]
  83. Fisher, R.; O’Leary, R.; Low-Choy, S.; Mengersen, K.; Knowlton, N.; Brainard, R.; Caley, M.J. Species richness on coral reefs and the pursuit of convergent global estimates. Curr. Biol. 2015, 25, 500–505. [Google Scholar] [CrossRef] [PubMed]
  84. Shaffer, H.; Fisher, R.; Davidson, C. The role of natural history collections in documenting species declines. Trends Ecol. Evol. 1998, 13, 27–30. [Google Scholar] [CrossRef]
  85. Ponder, W.; Carter, G.; Flemons, P.; Chapman, R.R. Evaluation of museum collection data for use in biodiversity assessment. Conserv. Biol. 2001, 15, 648–657. [Google Scholar] [CrossRef]
  86. Graham, C.; Ferrier, S.; Heuttman, F.; Moritz, C.; Peterson, A.T. New developments in museum-based informatics and applications in biodiversity analysis. Trends Ecol. Evol. 2004, 19, 497–503. [Google Scholar] [CrossRef] [PubMed]
  87. Lister, A. Natural history collections as sources of long-term datasets. Trends Ecol. Evol. 2011, 26, 153–154. [Google Scholar] [CrossRef] [PubMed]
  88. Roberts, C.; McClean, C.; Veron, J.; Hawkins, J.; Allen, G.; McAllister, D.; Mittermeier, C.; Schueler, F.; Spalding, M.; Wells, F. Marine biodiversity hotspots and conservation priorities for tropical reefs. Science 2002, 295, 1280–1294. [Google Scholar] [CrossRef] [PubMed]
  89. Fox, N.; Beckley, L. Priority areas for conservation of Western Australian coastal fishes: A comparison of hotspot, biogeographical and complementarity approaches. Biol. Conserv. 2005, 125, 399–410. [Google Scholar] [CrossRef]
Figure 1. Overview map of the study area within the Pilbara region, northwestern Australia, showing the areas designated for Integrated Marine and Coastal Regionalisation for Australia (IMCRA), with three provincial and five meso-scale bioregions, and associated abbreviations. The black line represents the boundary for the present study.
Diversity 08 00021 g001
Figure 2. Proportions of higher sponge taxa across 1164 species and OTUs distinguished in the study (Pilbara region). (a) Sponge classes; (b) Sponge orders within Demospongiae. Values were rounded off to the nearest percentage.
Diversity 08 00021 g002
Figure 3. Proportions of sponge species shared between IMCRA bioregions. Bars represent percentages of species occurring in 1, 2, 3, 4 or 5 of the IMCRA bioregions at the level of A) combined described species and OTUs (n = 1164) and B) described species only (n = 172). Numbers above each bar represent actual frequencies of species. For example, 4 species occurred in 5 bioregions. No species occurred in all six bioregions.
Diversity 08 00021 g003
Figure 4. Sponge species richness relative to collection effort for all six bioregions in the study area. (a) Scatterplot and regression of sampling days and species richness; (b) Scatterplot of total area of benthos surveyed (m2) and species richness; (c) Sponge species found per area of benthos surveyed (species m−2). PIN–Pilbara Nearshore, PIO–Pilbara Offshore, NIN–Ningaloo, NWS–Northwest Shelf, NWP–Northwest Province and CWT–Central West Transition.
Diversity 08 00021 g004
Figure 5. Cluster analyses of similarities between sponge communities in the study area (Pilbara region) and corresponding Jaccard similarity index at the (a) species and OTU level and (b) genus level. PIN–Pilbara Nearshore, PIO–Pilbara Offshore, NIN–Ningaloo, NWS–Northwest Shelf, NWP–Northwest Province and CWT–Central West Transition.
Diversity 08 00021 g005
Figure 6. Multi-dimensional scaling (MDS) ordination of the Jaccard similarity matrix for sponge communities within the Pilbara region at the (a) species level with bubble plots representing species richness at each bioregion and (b) at the genus level with cluster groupings based on SIMPROF analysis shown. Final stress of configuration = 0 at the two taxonomic levels investigated. PIN–Pilbara Nearshore, PIO–Pilbara Offshore, NIN–Ningaloo, NWS–Northwest Shelf, NWP–Northwest Province and CWT–Central West Transition.
Diversity 08 00021 g006
Figure 7. Representation of the 27 most speciose genera across the six IMCRA bioregions. Dot diameters represent frequencies of species within genera, and numbers within parentheses, where they appear next to a bubble, represent the percentage of species out of total species within bioregion (total species n is shown underneath abbreviated bioregion names; PIN–Pilbara Nearshore, PIO–Pilbara Offshore, NIN–Ningaloo, NWS–Northwest Shelf, NWP–Northwest Province and CWT–Central West Transition). Within each bioregion, dots with parentheses represent the ten most speciose genera for that bioregion.
Diversity 08 00021 g007
Figure 8. Probability funnels (95% confidence interval) of average taxonomic distinctness (delta +) and variation in taxonomic distinctness (lambda +) values for species-level (a, b), genus-level (c, d) and family-level taxa (e, f). The middle horizontal lines represent the simulated means for the study area from 1000 random selections from the master list of 1164 species for each sub-list. Intervals within which 95% of the simulated values are represented by a probability funnel (outer solid lines). PIN–Pilbara Nearshore, PIO–Pilbara Offshore, NIN–Ningaloo, NWS–Northwest Shelf, NWP–Northwest Province and CWT–Central West Transition.
Diversity 08 00021 g008
Table 1. Characteristics of the six bioregions examined in this study. Eighty Mile Beach and North West Transition bioregion characteristics are not provided as no sponges were recorded from these regions [48,49].
Environmental Characteristics
LocalityArea (km2)Depth (m)CurrentsSeafloorCharacteristics
North West Shelf (NWS)238,75930–200Indonesian Throughflow, Holloway CurrentLargely flat shelf, some slope, terrace, to shelf edgeStrong tides, cyclonic storms, long-period swells, high primary production, low mud, with gravel, generally clear waterTropical
North West Province (NWP)178,651Max. 5170Indonesian Throughflow, Leeuwin Current, Eastern Gyral CurrentSlope, terraces, valley, trench, plateauBathyal, low primary productionTropical
Pilbara Offshore (PIO)41,49110–155Holloway CurrentLargely inner shelf with terraces and some slopeVaried region, from high effective disturbance, high primary production, low mud, warm—to low primary production in north, low disturbance, rugose, less turbid than nearshore, outer limit of wave influence, natural inner shelf hydrodynamic boundaryTropical
Pilbara Nearshore (PIN)13,86110–30Holloway CurrentShallow inshore shelf with banks and shoals, fringing coral reefs around some islandsLow primary production, highly turbid water, large tidal range, innershelf, coastalTropical
Central West Transition (CWT)162,891Max. 5330Leeuwin Current, Leeuwin Undercurrent, Ningaloo CurrentSlope and terraceSporadic productivity, high gravel, low mud, flat terrainTropical-temperate transition
Ningaloo (NIN)73390–200Leeuwin Current, Leeuwin Undercurrent, Ningaloo CurrentLargely shelf, some slope and terrace, interrupted fringing reefs in south, continuous offshore reefs in northInnershelf, coastal, reef flat,~300 km fringing reef, low mud, low gravel, low primary production, clear water, in south cold and flat terrainTropical-temperate transition
Table 2. Pairwise comparisons of sponge species composition between the six IMCRA bioregions. The upper half of the matrix represents frequencies of co-occurring species between bioregions (in italics). The lower half of the matrix represents percentage similarity of sponge compositions between bioregions based on the Jaccard similarity index (%). Bold text represents the species richness at each bioregion and bold text in parentheses represents corresponding Shannon-Wiener index values. Total described sponge species and OTUs = 1164.
Number of Shared Species
LocalityNWSPIOPINNINNWPCWT
North West Shelf (NWS)232 (5.447)104441891
Pilbara Offshore (PIO)32.248413 (6.023)9364346
Pilbara Nearshore (PIN)13.79322.710406 (6.006)46185
Ningaloo (NIN)6.39417.20412.483331 (5.802)2519
North West Province (NWP)5.26313.0016.97711.338110 (4.700)4
Central West Transition (CWT)0.7632.7082.29310.5265.71430 (3.401)
Table 3. Regression statistics for species richness against collection stations and sampling days. Numbers represent R2 values and asterisks represent significant regression relationships. Data for regression analyses was derived from combined Atlas of Living Australia and Western Australian Museum databases. NWS–North West Shelf, PIO–Pilbara Offshore, PIN–Pilbara Nearshore, NIN–Ningaloo and NWP–North West Province. * Refers to significant test p < 0.05.
LocalityNWSPIOPINNINNWP
Sampling days0.1790.294 *0.344 *0.821 *0.718 *
Collection stations0.0900.1330.385 *0.900 *0.787 *
Table 4. Summary of pairwise similarity percentage (SIMPER) analyses between statistically relevant groups of sponges as reflected by cluster, MDS and SIMPROF analyses (see Figure 5b and Figure 6b). Each pairwise group comparison ranks genera according to the overall percentage contribution each makes to the average between-group dissimilarity. Only genera adding to cumulative contributions totaling more than 20% are shown in this table (see Supplementary Table S3 for details of comparisons).
Pairwise Group ComparisonsAverage Group DissimilarityGenera Contributing Most to Defining Between-Group Dissimilarity (% Contribution)No. Genera Accounting for Between-Group Dissimilarity (% Dissimilarity)
a v. b75.80%Petrosia (3.9%), Sarcotragus (2.82%), Oceanapia (2.82%), Geodia (2.82%), Hyalonema (2.82%), Luffariella (2.52%), Amphidischosida unknown genus_1 (2.18%), Ectyoplasia (1.78%)8 (21.76%)
a v. c77.73%Oceanapia (2.51%), Clathria (2.2%), Phakellia (1.93%), Siphonodictyon (1.83%), Sarcotragus (1.61%), Petrosia (1.61%), Theonella (1.49%), Polymastia (1.36%), Halichondria (1.36%), Geodia (1.36%), Xestospongia (1.32%), Axinella (1.25%), Calcarea unknown genus_1 (1.22%)13 (21.07%)
a v. d79.84%Oceanapia (2.22%), Clathria (2.22%), Mycale (2.09%), Halichondria (1.96%), Ircinia (1.81%), Niphates (1.65%), Tethya (1.65%), Stelletta (1.65%), Spirastrella (1.48%), Spongia (1.48%), Callyspongia (1.48%), Amphimedon (1.48%)12 (21.18%)
a v. e83.93%Oceanapia (2.05%), Clathria (2.03%), Callyspongia (2.01%), Mycale (1.7%), Haliclona (1.68%), Amphimedon (1.59%), Sarcotragus (1.41%), Petrosia (1.40%), Niphates (1.35%), Reniochalina (1.26%), Theonella (1.26%), Halichondria (1.22%), Dysidea (1.21%)13 (20.18%)
b v. c58.89%Phakellia (2.05%), Siphonodictyon (1.94%), Crella (1.45%), Hyalonema (1.45%), Clathria (1.42%), Axinella (1.33%), Calcarea unknown genus_1 (1.29%), Pararhapoxya (1.29%), Coelosphaera (1.29%), Jaspis (1.29%), Ecionemia (1.29%), Haliclona (1.23%), Oceanapia (1.22%), Xestospongia (1.13%), Biemna (1.12%)15 (20.79%)
b v. d57.09%Ircinia (1.94%), Niphates (1.77%), Biemna (1.59%), Spongia (1.59%), Phakellia (1.37%), Fasciospongia (1.37%), Thorectandra (1.37%), Amphidiscosida unknown genus_1 (1.37%), Halichondria (1.30%), Clathria (1.26%), Cinachyrella (1.15%), Petrosia (1.13%), Pericharax (1.12%), Reniochalina (1.12%), Higginsia (1.12%)15 (20.58%)
b v. e62.18%Haliclona (1.86%), Callyspongia (1.65%), Niphates (1.49%), Clathria (1.43%), Reniochalina (1.39%), Higginsia (1.32%), Ircinia (1.30%), Axinella (1.28%), Hyalonema (1.27%), Carteriospongia (1.26%), Spheciospongia (1.25%), Spongia (1.25%), Siphonodictyon (1.20%), Amphimedon (1.18%), Mycale (1.08%)15 (20.21%)
c v. d43.51%Niphates (1.57%), Calcarea unknown genus_1 (1.40%), Pararhaphoxya (1.40%), Ecionemia (1.40%), Agelas (1.22%), Chondrilla (1.22%), Fasciospongia (1.22%), Thorectandra (1.22%), Erylus (1.22%), Microscleroderma (1.22%), Siphonodictyon (1.11%), Ircinia (1.02%), Theonella (1.02%), Phakellia (1.00%), Xestospongia (1.00%), Pericharax (0.99%), Pipestela (0.99%)17 (20.22%)
c v. e35.08%Niphates (1.92%), Carteriospongia (1.63%), Phakellia (1.50%), Pararhaphoxya (1.47%), Ecionemia (1.47%), Callyspongia (1.39%), Mycale (1.38%), Hyattella (1.27%), Amphimedon (1.22%), Fasciospongia (1.18%), Thorecta (1.12%), Taonura (1.04%), Zyzzya (1.04%), Guitarra (1.04%), Echinoclathria (1.04%), Aplysinidae unknown genus_1 (1.04%)16 (20.73%)
d v. e35.13%Haliclona (2.00%), Callyspongia (1.55%), Phorbas (1.53%), Pseudoceratina (1.49%), Agelas (1.40%), Cymbastela (1.23%), Aplysina (1.23%), Theonella (1.18%), Rhaphoxya (1.16%), Pleraplysilla (1.16%), Fascaplysinopsis (1.16%), Homaxinella (1.16%), Cinachyra (1.16%), Aplysinella (1.16%), Arenosclera (1.12%), Topsentia (1.12%)16 (20.81%)

