1. Introduction
Biodiversity-friendly farming is a growing area of discussion among farmers, as well as in government departments and non-government organizations interested in habitat conservation on private land. Critically, however, the adoption of biodiversity-friendly farming hangs upon the willingness of farmers to encourage wildlife on their farm. The negative impacts of nuisance wildlife can be a significant barrier to the encouragement of biodiversity in agriculturally productive areas.
Scientists and farmers generally agree that ecological function provides essential ecosystem services for farming, such as nutrient cycling, water regulation, and pollination [
1,
2], the replacement of which would involve many expensive inputs. It is also evident, however, that biodiversity presents some disservices, such as potential competition, browse and grazing pressure, predation, and toxicity [
3,
4]. The impact of nuisance species varies geographically and over time, often depending on the amount of intact habitat or other feed sources that exist. As such, the tendency for the human footprint to expand into such habitat is, in many cases, at the root of the problem [
5,
6]. Nonetheless, to improve the relationship between humans and wildlife, it is critical to understand stakeholder perception of nuisance wildlife.
Social scientists have typically used the concept of wildlife acceptance capacity (WAC) to understand perceptions of nuisance wildlife. This builds on the concept of cultural carrying capacity, or sociological carrying capacity, which is more consistent with commensurate language from biology but is likely to be very different in outcome. WAC is complex, based on an individual’s values, role, and experience within the external context such as species abundance [
7]. Species abundance, however, may not be the same as perceived abundance, as first-hand interaction between humans and wildlife will likely influence this perception. Proximity to species has also been demonstrated to be related to WAC, although this relationship is species-dependent and inconsistent in the literature. It was found, for example, in Scandinavia, that people were more accepting of carnivores the less direct experience they had with those species [
8]. The inverse, however, was found in Alberta, Canada, where those with the least amount of experience with cougars were also the most fearful and least accepting of them [
9].
WAC is highly sensitive to the perception of risk and benefit [
10]. For instance, Zajac
et al. (2012) found that risk and benefit perceptions explained nearly 70% of the variability in the preferred population size of black bears in Ohio [
11]. Perceived benefits can be deep-seated or superficial, depending on the values and attitudes from which those opinions are formed. Affect for species can be linked to superficial and changeable attitudes (for example, enjoying the aesthetic look of a particular animal) or more persistent core beliefs or values (for example, a particular species that is linked to cultural identity) [
12,
13]. Perceived risk may or may not be based on experience. The degree to which an individual feels they have control over a risk will impact their tolerance or acceptance of that risk [
14]. If the individual has methods to cope, then there is a tendency toward greater acceptance of that species. The assessment of risk is also often measured as “perceived risk” rather than the actual risk. For example, an attack by a large carnivore may be very unlikely, but the severity and uncontrollable nature of a hypothetical attack will increase the perceived risk of that species [
15]. For example, some individuals may consider hiking in the woods more risky than driving a car, while the risk of hitting a deer with a car may be more significant than being attacked by a bear while hiking. High perceptions of risk and benefit are rarely held about the same species [
16]. The factors impacting WAC will dictate what management methods are considered acceptable. Much of the literature on the human dimensions of wildlife management is focused on one species, and often even one “treatment” approach (e.g., lethal control).
Farmers’ tolerance toward wildlife is complex [
17,
18]. The tipping point between acceptable and unacceptable wildlife risks and damages and the selection of appropriate methods to deal with those risks/damages are driven by factors affecting WAC. There are few, if any, universal variables that predict conservation behaviour by farmers, including coping mechanisms for nuisance wildlife [
19]. Despite the financial costs that wildlife may represent to this economically pinched sector, many farmers accept some losses as the “cost of doing business” in balance with nature [
9,
20]. The close tie between farmers and the land has been well-documented, historically described by conservationists such as Leopold as a “land-ethic” [
17,
21]. Many family farmers in particular have long-range stewardship goals and management styles [
22], although these can be purely symbolic [
23,
24]. Farmers’ aesthetic judgments about production land are different to non-farmers’ [
25,
26,
27] and may involve using the presence of wildlife as indicators of land health [
28]. Other benefits of wildlife for farmers may include the simple enjoyment of seeing wildlife, knowing that they created the conditions for wildlife to be there, and showing wildlife to friends and family, but how commonly farmers perceive these benefits is poorly understood [
29]. It is critical to understand better what distinguishes amenity, balance, and nuisance for individual species and, thus, habitat types if agriculture is to co-exist with nature and, thus, the ecosystem services of which nature is the engine [
30].
We surveyed farmers in two of the Canadian Maritime provinces to understand the drivers of their tolerance for wildlife (
i.e., their stated acceptability of the presence of a species after weighing the pros and cons). Often, measuring the WAC of species involves measuring all the factors influencing that capacity. Our survey was too short to accomplish this. Instead, we measured farmer tolerance of species—the acceptance of the impacts from a species rather than acceptance of the species itself (
sensu [
13], p. 931)—and factors that were expected to significantly affect that tolerance among farmers. This focus emerged from our efforts to understand some of the contextualizing factors within a larger investigation of farmer conservation behaviour (in this case, their perception of and response to nuisance wildlife as a barrier to adopting biodiversity conservation practices). We did not provide farmers with a list of species but instead asked farmers to nominate those species they perceived as a nuisance. In this paper, we identify the species nominated most often, and explore how the nature and magnitude of their nuisance and the cultural benefits those same species may also represent for farmers affect overall tolerance of these species. We discuss how the perception of benefits moderated tolerance regardless of the type of nuisance involved, and the implications of this for the encouragement of biodiversity-friendly farming. We also discuss the benefits and challenges of designing a quantitative survey as an elicitation tool.
2. Methods
We studied the perceptions and attitudes of farmers in two Canadian Maritime provinces toward “nuisance nature”. The Canadian Maritime provinces are small and have only 3% of Canada’s farms [
31], but these are agriculturally diverse: most farms produce multiple commodities to take advantage of the various land capabilities that result from their finely grained topographic variation. Farms in Nova Scotia (NS) and New Brunswick (NB) are smaller than the Canadian average (105 and 145 ha, respectively, compared with 315 for Canada) [
32], and tend to grow fruit (25% and 15% of farms, respectively, including apples, blueberries, and cranberries), hay (12% and 16%), cattle for meat (11% and 14%) and dairy (7% and 9%), and nursery plants (11% and 6%) [
33]. New Brunswick also grows potatoes (7% of farms). By far the largest share of the agricultural landscape, however, is in wild or semi-wild areas such as forests, Christmas trees, and wetlands (71% and 64%, respectively, by area) [
34]. In fact, private landowners control the majority of lands in these provinces, meaning they foster a large share of animal habitat and both live and work in close proximity to wildlife.
Nuisance nature issues have been prominent in the news media in both Nova Scotia and New Brunswick. Farmers are not the only ones complaining; so called “exurbanization”—the increase of large-lot suburban developments in commuting distance to workplaces [
35]—is extending into wild and farmed areas [
36] and exurban residents can also be vocal. Goose, bear, and deer impacts have been particular concerns, leading to calls by local member groups of the Canadian Farmers Federation (as well as hunting and outfitter lobby groups) to expand “nuisance animal” categories, lengthen hunting seasons, and increase leniency in managing those populations within municipal boundaries. The provincial Departments of Natural Resources (DNR) and Agriculture have to balance agricultural production with the management and conservation of these species [
37], and try to ensure all other mitigation options are attempted before issuing licenses to destroy nuisance animals. Despite increasing media coverage of nuisance nature issues, inquiries to the NS DNR for agriculturally related nuisance issues, tracked in the Biodiversity Investigation Report (BIR) System, have been decreasing, suggesting many are bypassing government help to solve their nuisance wildlife issues. Previous work with Nova Scotia farmers and farm extension workers on biodiversity-friendly farming practices suggested that nuisance wildlife was a barrier to adoption [
38,
39,
40]. Our quantitative mail-out survey sought to determine which species were considered to be a nuisance to farmers in Nova Scotia and New Brunswick and explore farmer tolerance of those species.
2.1. Survey Design
The questionnaire was unconventionally designed as an elicitation tool. Rather than asking the respondents to convey their feelings about a provided list of animals, they were instead first asked to identify which animals they considered to be a nuisance, and then to answer a series of questions about each species they listed. This elicitation method draws on Kelly’s Personal Construct Theory, which in part holds that the mental maps that guide everyday decision-making are deeply held and difficult to elicit through direct questioning [
41]. Rather, it can be more effective to design a constrained task of some kind to allow the drivers of decision-making to emerge. Moreover, survey design is subject to many biases such as item context effects [
42]. That is, the inclusion of a species in a survey about nuisance nature may be then interpreted as a nuisance, independent of the pre-existing attitude of the rater. For instance, in a recent Australian survey that positively framed ecosystem services and did not force choices, farmers rated all ecosystem services highly [
43]. Being presented with a blank survey, however, was potentially overwhelming, so after pre-testing the survey, we included an information insert about four common animal species to initiate thinking (
Box 1). Our elicitation-based design presented some analytical challenges that will be discussed later, but it also enriched the picture by avoiding some of those biases.
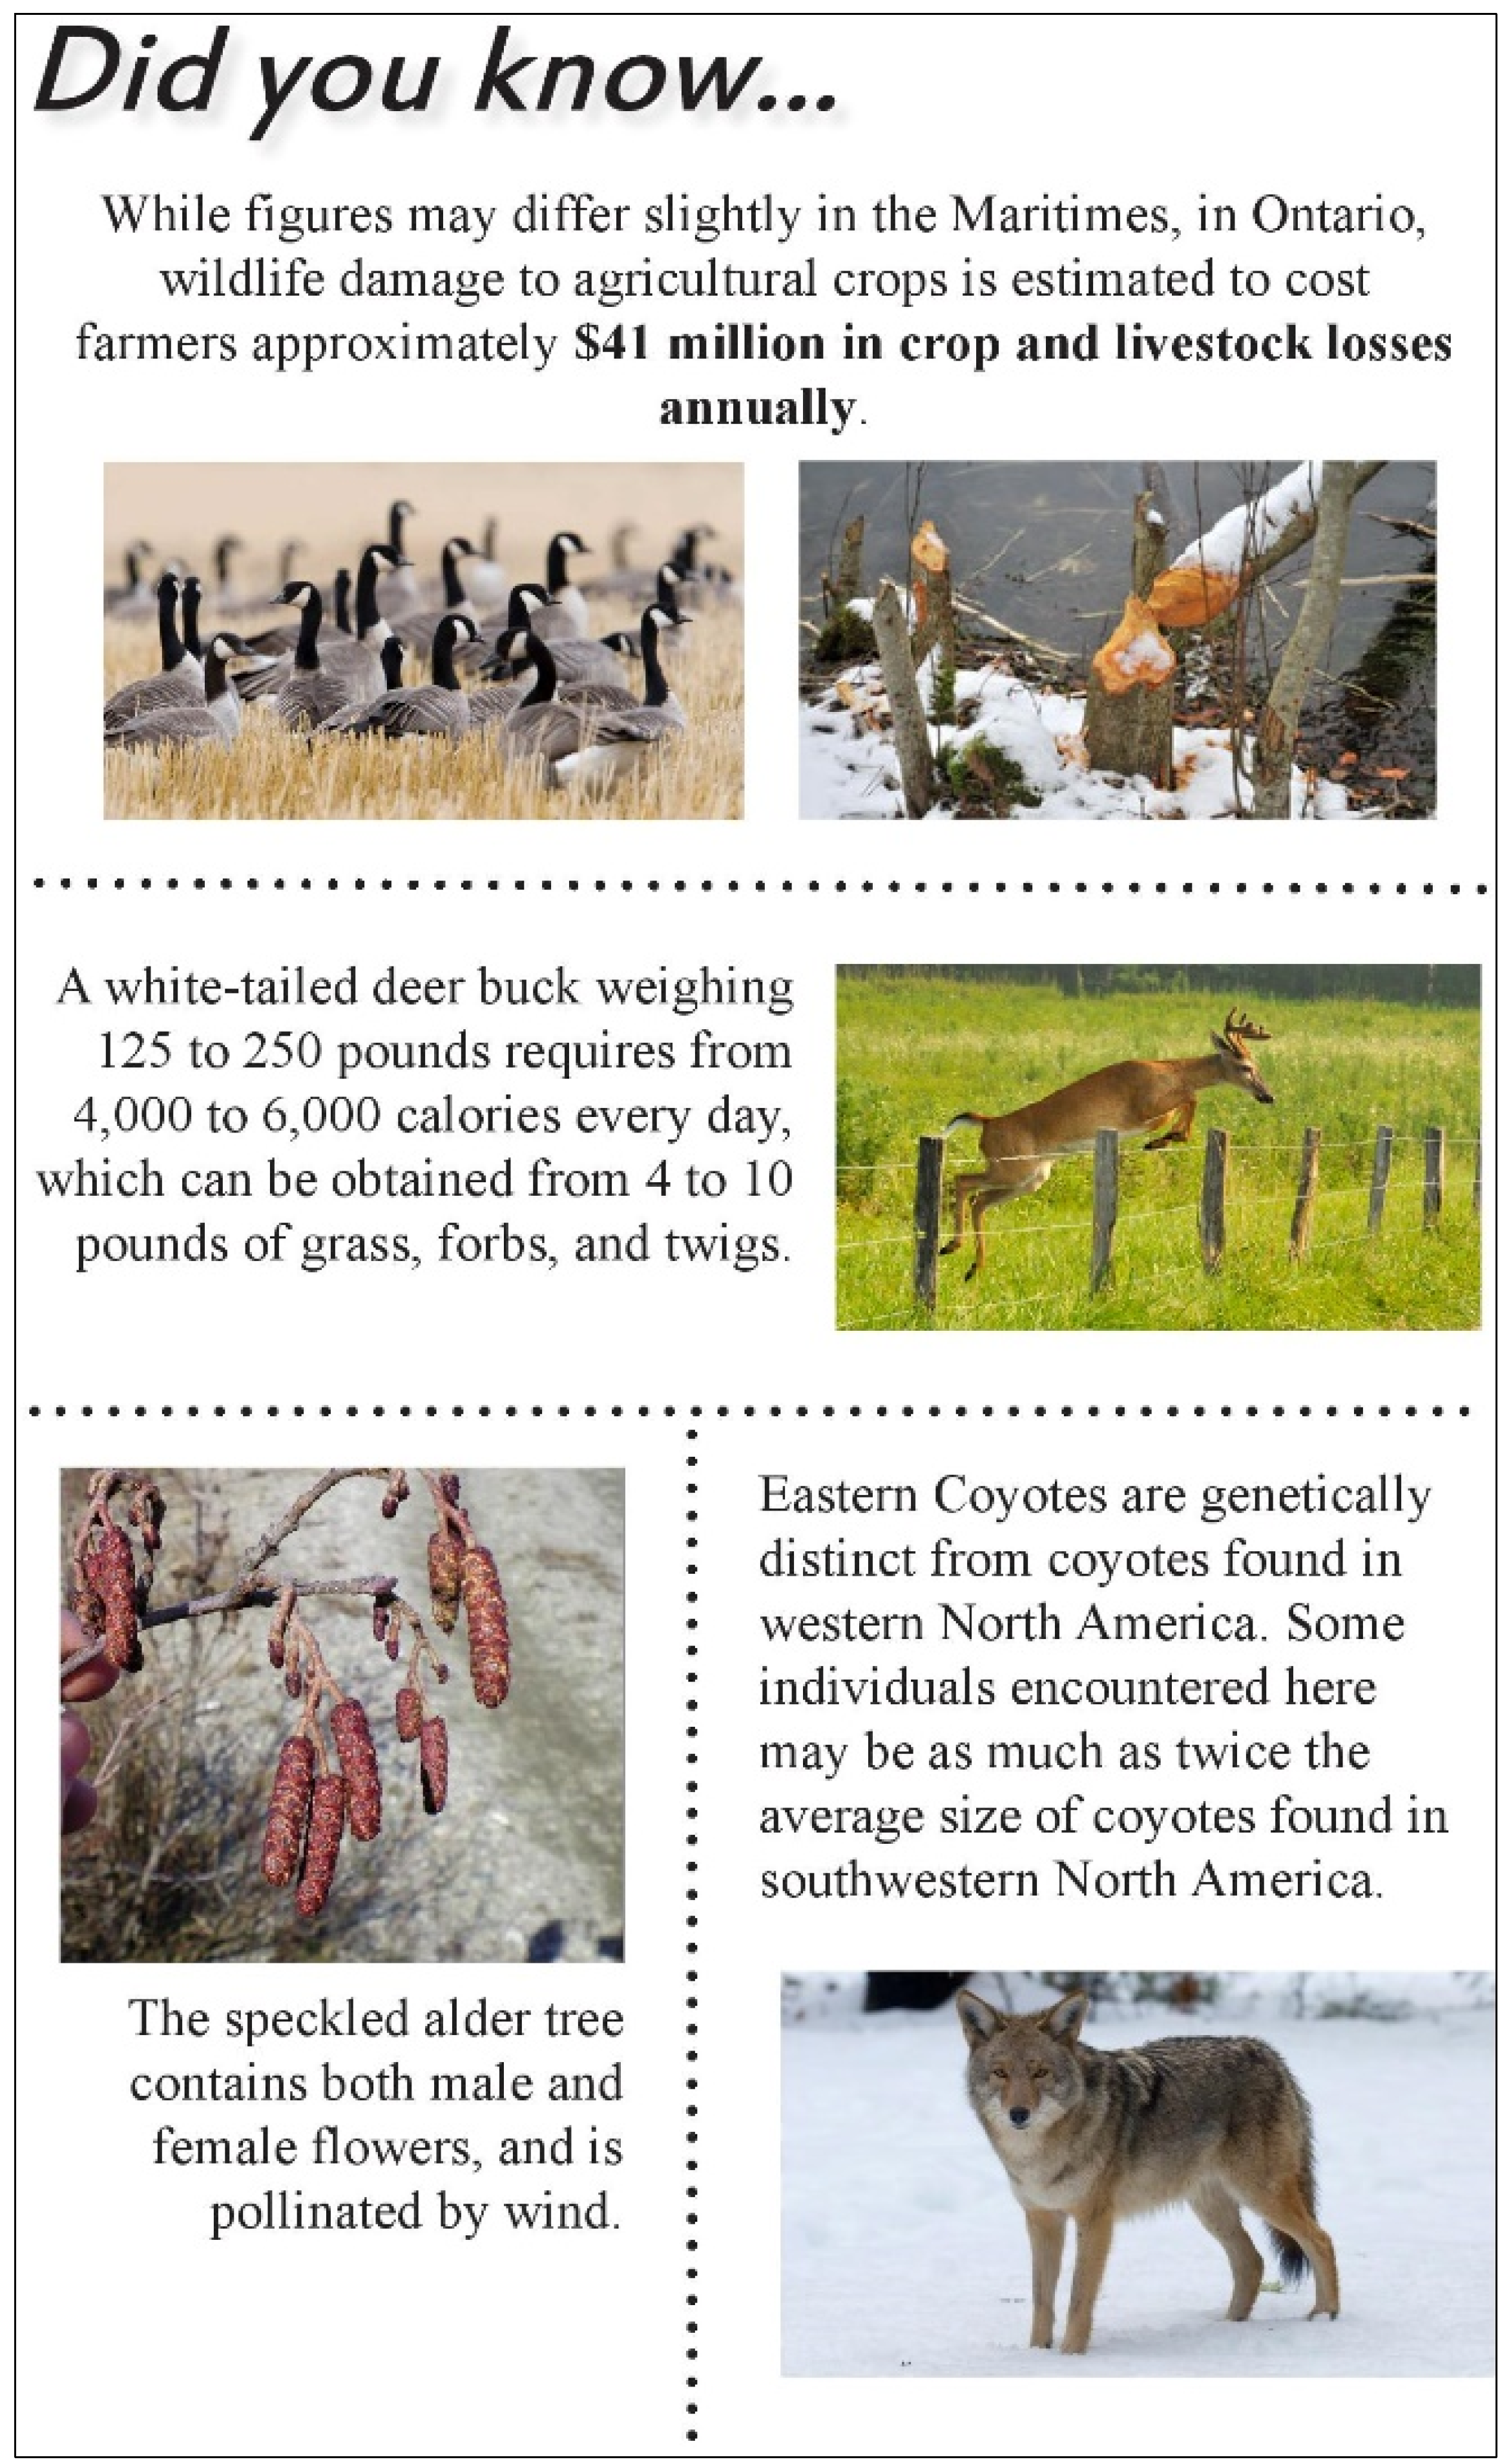
Box 1. Survey insert, designed to initiate thinking.
The information insert was carefully designed to assist respondents while avoiding the introduction of negative perceptions toward specific species. The introductory sentence provided a quantitative estimate of overall damage as a result of nuisance species (with no individual species listed). This negative framing was appropriate given the broadly negative framing of the survey as being about nuisance wildlife. The four species selected were chosen based on literature and discussion with managers as to what species farmers were likely to encounter. A fact was included about each species. These facts were designed to be neutral, with no mention of negative or positive aspects of those species. In fact, it has been suggested that providing basic biological facts leads to an increasing acceptance of a species [
44].
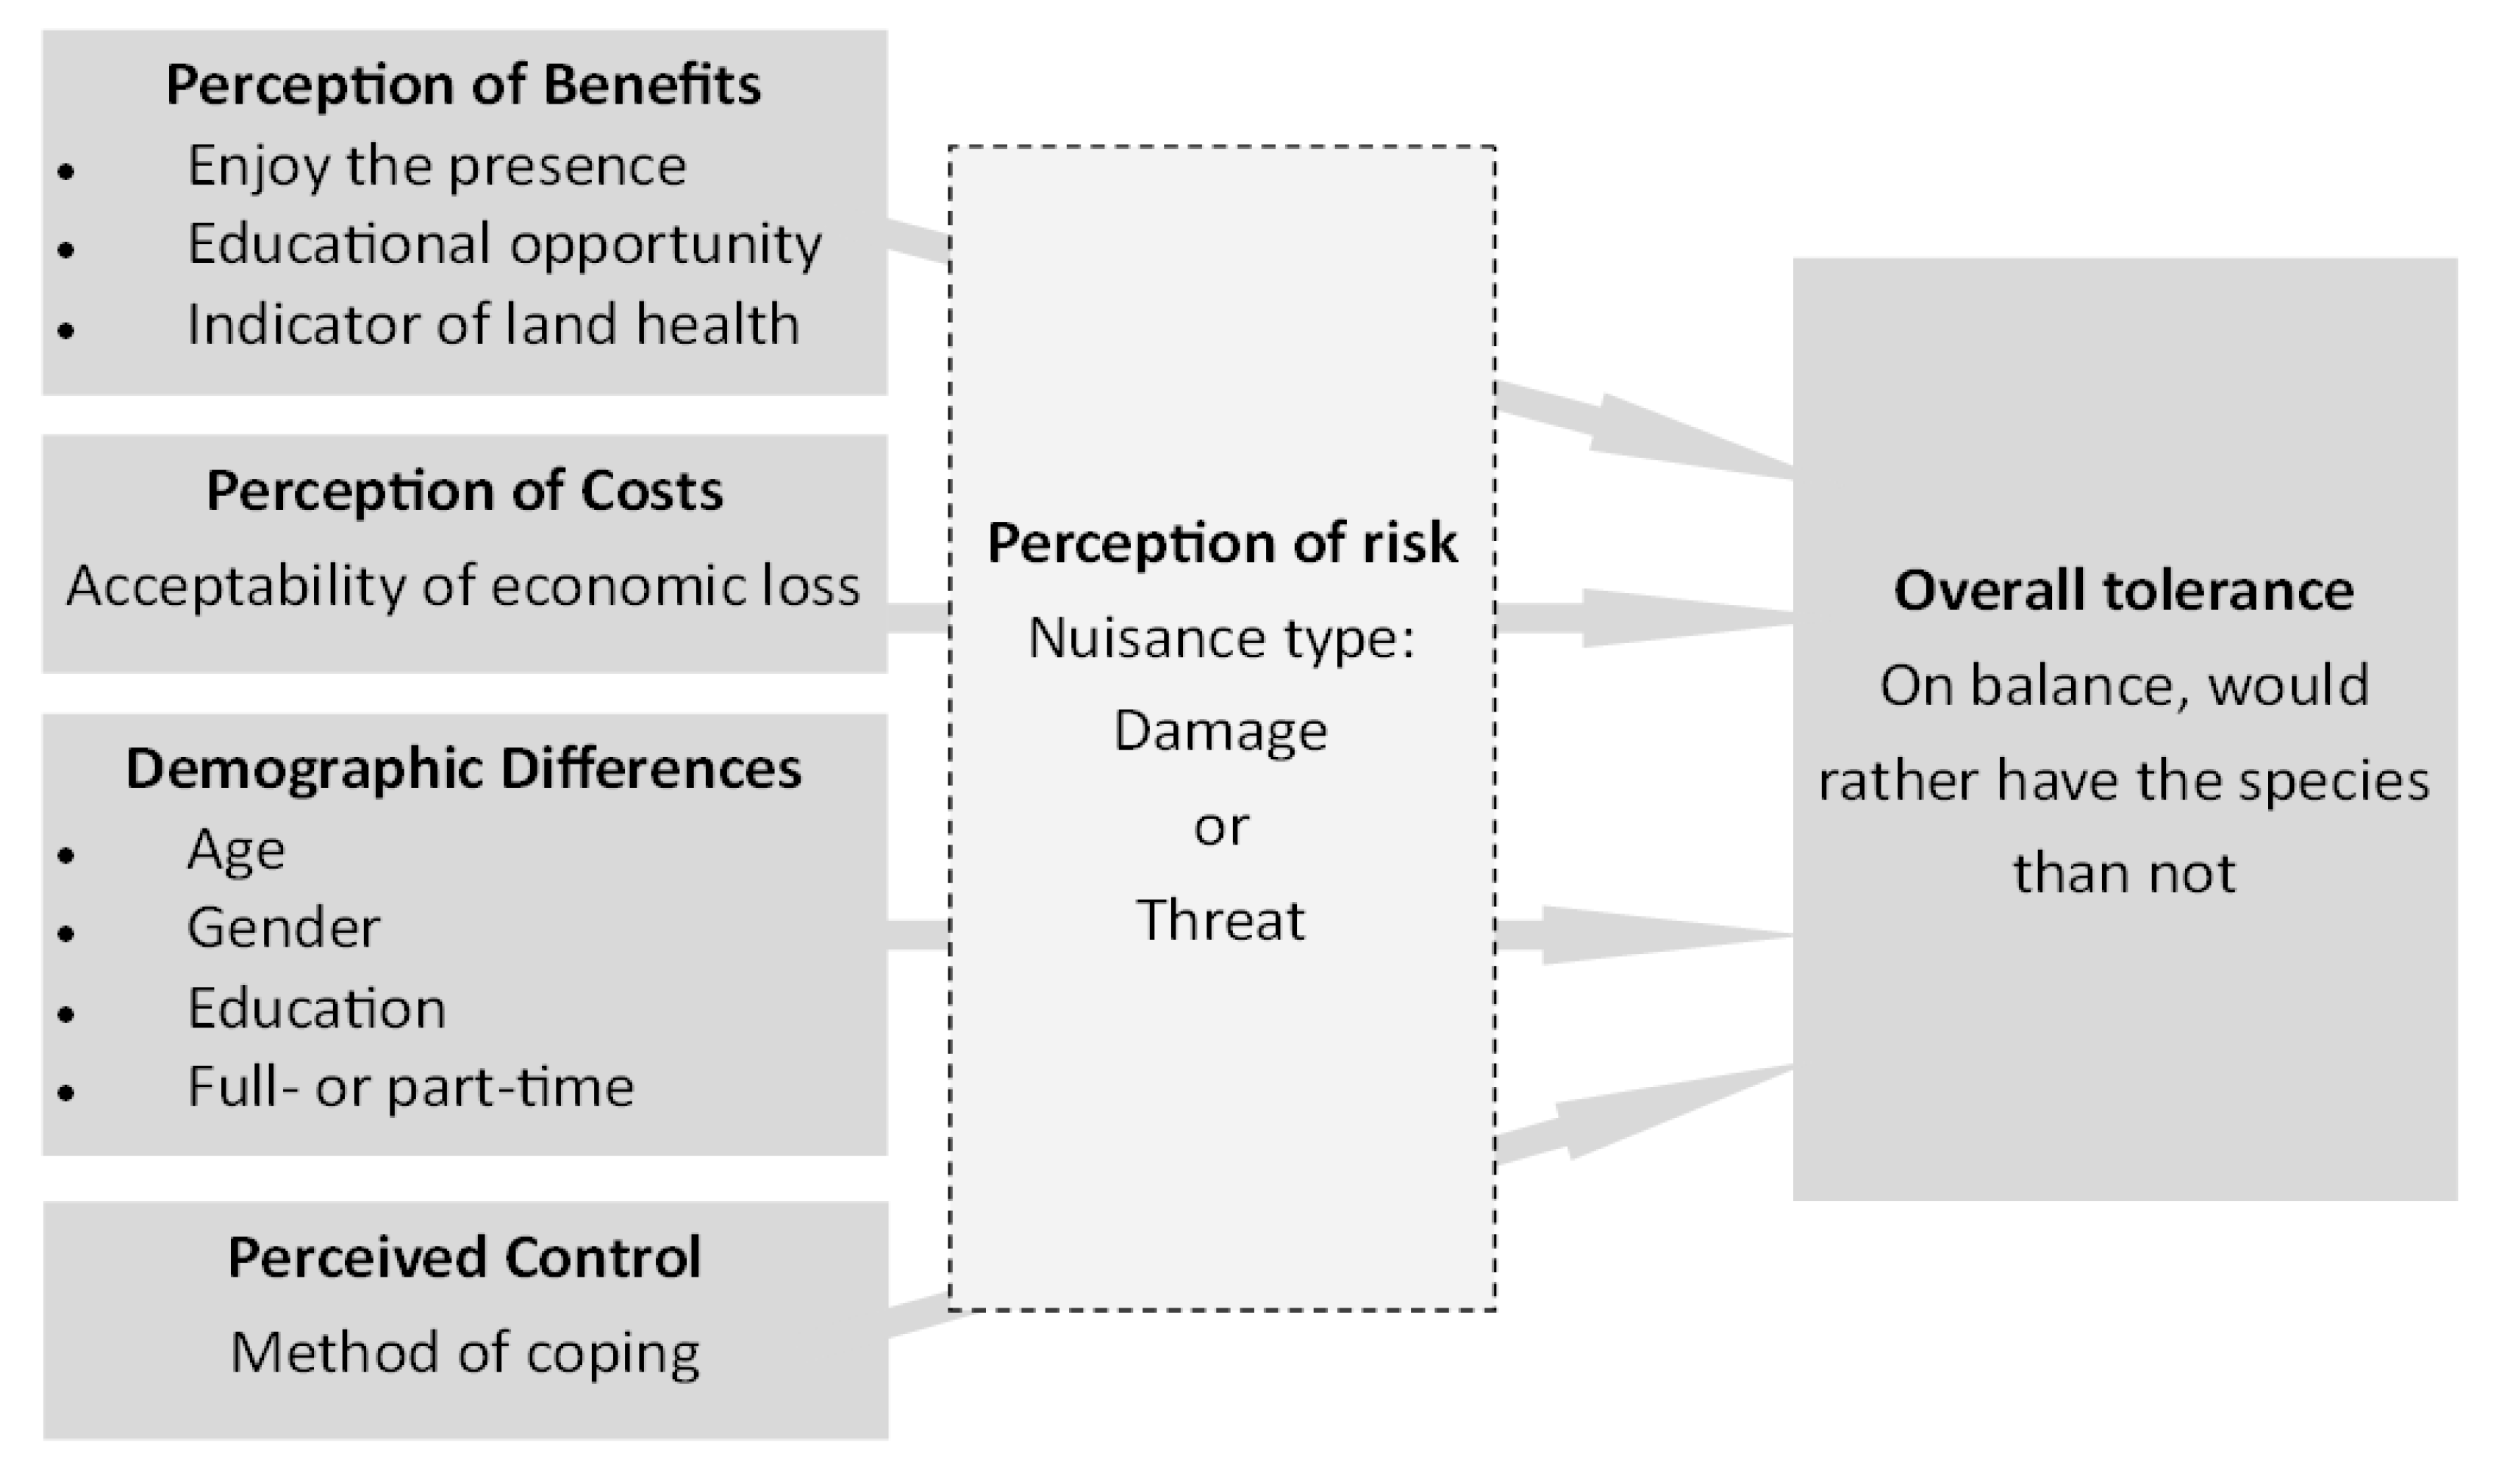
We designed the short (one 11 × 25.5 inch tri-fold, ~10 min) survey to capture different factors that might influence the overall acceptability of a species to a farmer: the perception of monetary costs and the acceptability of those costs, the perception of benefits, the nature of the nuisance, and the different methods of coping used by the respondents (
Figure 1). We asked that the primary farm decision-maker fill out the survey. For each animal the farmer identified on the survey, they were asked to describe the nature of the nuisance from a list of options including crop damage, harm to livestock, a threat to personal safety or pets, or other. When asked to describe “other” damage, many farmers volunteered damage to farm infrastructure, such as fences, which we added as an analytical category. Then respondents were asked to estimate the financial loss they had incurred as a result of this species over the last two years. We chose two years to prevent responses from being influenced by one particularly challenging year. They were then asked if that financial loss was acceptable, using a five-point Likert-scale from completely unacceptable to completely acceptable. Respondents were also asked to select each method they used for coping with each species, including: hunted for sport or food; shot to eliminate nuisance; trapped for fur harvest; trapped for relocation; physical barrier (e.g., fence, net); repellent (e.g., pheromones); deterrent (e.g., scarecrow); poisoned; or other (please describe). These categories were developed in collaboration with NS DNR. Respondents were also asked if they had sought help from the government to cope with the nuisance wildlife problem.
Figure 1.
Theoretical framework guiding survey design and analysis.
Figure 1.
Theoretical framework guiding survey design and analysis.
The perception of any species’ benefits for farmers was measured through a cultural lens. Cultural ecosystem services are some of the more intangible services that are provided to humans through the presence and natural function of an ecosystem [
45]. For example, a cultural service can be the sense of well-being from walking through a forest or the sense of place or identity created by farming family land [
38]. Using this framework to measure cultural benefits associated with the species, respondents were asked to indicate their agreement with each of the following three statements on a five-point Likert scale from completely disagree to completely agree (with corresponding cultural services, not conveyed to respondents) [
46]:
- (1)
I enjoy the presence of this species [aesthetic values/inspiration]
- (2)
This species provides an educational opportunity for me or my family [educational values/recreation]
- (3)
This species indicates that my land is healthy [knowledge systems/sense of place]
These cultural services were selected based on previous interviews with farmers in Nova Scotia. In one set of interviews, farmers were asked to discuss any species that they would like to see on their land, and to explain the reasons for their choice. Interviewees consistently discussed the enjoyment of seeing different species, the connection of those species to their land health, and to a lesser extent, the use of those species as a teaching tool for their children [
20]. Furthermore, in interviews regarding biodiversity and wetlands more generally, cultural services were discussed at length compared to other services such as regulating or provisioning, suggesting that these services are among the most important to or recognized by farmers [
39].
Finally, respondents were asked to indicate if they would prefer to have the species on their land, if they were unsure, or if they would rather not have the species on their land. A series of demographic questions were included on the final page of the questionnaire, including county, year of birth, sex, highest level of education achieved, commodities, and whether farming was their primary source of income. We also included a short section on nuisance plants, which is not discussed here.
The title of the survey was “Nuisance Nature”, which is consistent with local conversation in agricultural settings about farm biodiversity. The negative framing was intentional, and helped us to contrast this survey with a 2012 survey titled “Biodiversity on Farms” that was sent to a sample of Nova Scotia farmers via the Nova Scotia Federation of Agriculture (NSFA) [
40], potentially including some of the same individuals given the randomization process. Several logos were included at the bottom of the survey, including Dalhousie University (where the primary investigators were based); NS DNR and Agriculture and Agri-Food Canada, who funded the work; and, the logo of the local Canadian Federation of Agriculture member group assisting us with each provincial implementation. No incentive was provided for completing the survey.
2.2. Implementation
An unstratified random sample was generated from the farmer mailing lists of the two provincial Canadian Federation of Agriculture member groups. These mailing lists are quite comprehensive because of the role these groups play in farm registration and reimbursements for monetary costs farmers incur in their management of pollution. The NSFA database included 2373 farmers at the time, representing 61% of the 3905 farms reported in the Census of Agriculture, and they sent our survey to a random group of 625 of these. The Agricultural Association of New Brunswick/Association Agricole de Nouveau-Brunswick (AANB) database includes 2275 farmers, representing 87% of the 2611 farms reported in 2011, and this association mailed out the survey to a random sample of 625 of these. A French version of the survey was also included in the New Brunswick mail-out, as a third of that province is francophone, compared with only 3.8% in Nova Scotia [
47]. To maintain the anonymity of respondents and adhere to the Nova Scotia Freedom of Information/Protection of Privacy Act, farmer addresses were unknown to the research team, and no identifying features were included on the survey. The nature of our access to the mailing lists also meant only one mail-out was possible. The selected individuals were mailed the survey(s), insert, and a reply-paid mailing envelope around 17 April 2014. No online version was offered after experiences of low uptake of this option with other surveys [
40] and given the difficulty of implementing the elicitation structure within online survey environments. A single reminder was sent through the CFA-member group newsletters a month later. Most of the surveys were received by early June and we closed the survey at the beginning of July 2014.
2.3. Analysis
Returned surveys were transcribed into an Excel spreadsheet, and then imported into STATA 12 software for analysis. To measure the impact of different factors on the tolerance toward species (Y), an ordinal logit model was built. Main independent variables of interest were the perception of loss (X
1) and the perception of benefits (X
2). Perception of loss was measured by the responses to the question regarding the acceptability of financial loss (five-point Likert scale). A new categorical variable was created from the responses, comprising “completely unacceptable”, “somewhat unacceptable”, and “indifferent to completely acceptable”. Perception of benefits was measured by taking the mean of the numeric values of the responses to the three questions regarding cultural services (good to acceptable, Cronbach’s alpha = 0.76 [
48]). Control over a nuisance is also a likely factor in acceptability of wildlife and was included as a control variable based on whether or not a coping mechanism was indicated [
15]. As demographic factors have also been demonstrated to influence tolerance [
49,
50], age (continuous based on the reported birth year), gender (male or female), education level (high school, university, technical school, and graduate school), and whether the respondent’s primary income source was derived from farming (yes/no response) were included as controls. Dummy variables were used to model categorical variables.
Research has suggested that the perception of risk will have a strong influence on the tolerance of species [
7,
11,
50]. Perception of risk was measured by the responses describing the type of nuisance. Responses were divided into categories of “Threat” and “Damage”. Threat was measured by the responses indicating that the species was considered a threat to the personal safety of the respondent, or their family/family pets, or a threat to livestock. “Damage” was measured by the responses indicating that the species caused damage to property (e.g., creating flooding or damaging fences) or to crops. “Harm to Livestock” could conceivably be categorized as either threat or damage categories. The decision was made to place it in the threat category as a result of the language in the survey: the text in the survey read “harm to livestock”, not damage to livestock. These created categories were exclusive and, thus, any responses where the species was considered explicitly as both causing damage and a threat were omitted from analysis in the logit models.
To measure the difference in the factors influencing tolerance toward species, the logit model was run twice: first with the responses to threat only, and then with the responses to damage only. Thus, we examined only the perception of nuisance type—regardless of the individual species that were listed on the surveys.
2.4. Confounding Elements
Some analytical challenges were introduced by our survey design and implementation. First, by allowing farmers to nominate species, they provided less data—e.g., fewer responses to analyze per species—and, thus, there was a reduction in the overall predictive power at a species level. In the multivariate analysis described here, however, we overcame this limitation by focusing on the type of nuisance rather than the individual species. Second, we included a small insert to spark reflection. This insert was carefully designed to include diverse species, including those that we expected, based on literature and conversations with industry experts, to be the most commonly listed: geese, beavers, deer, and coyotes (
Figure 1). We do not believe this introduced much bias: the text alongside the pictures was neutral; and the negative content introducing the insert was consistent with negative survey framing. Our aim was to measure
nuisance species, an inherently negative construct, and the nature of that nuisance. This is in contrast to other studies that investigate acceptance of a specific species, where the balance of negative and positive information provided in a survey is crucial [
44]. Finally, because of the population being sampled, we had to translate the entire survey into French. While this was undertaken and reviewed by native French speakers, there is no way to ensure that ticking a box on the survey in English meant exactly the same thing as ticking it on the French version. We made the assumption that it did mean the same thing.
Other challenges would have arisen regardless of the structure. For instance, we cannot be sure that the farmers are nominating the correct species as the cause of their negative outcomes. The survey measures species that are perceived to be a nuisance among farmers in Nova Scotia and New Brunswick. While no ground-truthing was done, the results are consistent with media coverage and other research and informal conversations with farmers in the region. Indeed, high media coverage in Nova Scotia around deer damage over the time the survey was in the field may well have influenced the prominence of deer in the results for that province. Regardless of the correct identification of species, however, the categories of “threat” and “damage” are robust: responses will likely genuinely reflect the reality of the relationship between farmers and those broad categories of nuisance wildlife more than the relationship to any specific species.
3. Results
3.1. Demographics
A total of 142 surveys were returned—79 in Nova Scotia and 63 in New Brunswick—for a response rate of 12% once the eight undeliverable surveys or those sent to retired farmers were removed, a typical number for a one-time mail-out [
51]. Most (83%) of those who filled out the survey were male. This is a slightly higher number of males compared to farm ownership records (74% in Nova Scotia, 79% in New Brunswick) [
52]. The mean age of respondents was 59 years (range: 28–96), somewhat older than the 55.45 average for farmers in the provinces in question [
53]. Almost two-thirds (62%) of the respondents described themselves as full-time farmers, more than reported no non-farm income in the 2011 Census of Agriculture (52% and 55%, respectively, for NS and NB), but consistent with those who recorded <20 h of such work (60% and 63%) [
54]. Only 6% of all respondents answered the French survey, comprising 10% of the NB respondents. Although that province is one-third francophone, only 8% of the AANB mailing list notes French as their preferred language.
Education is a commonly cited driver of environmental attitudes and behaviour, and there is some evidence that our sample is somewhat biased towards higher educational attainment [
55]. A third (35%) of the survey respondents had a technical qualification such as from an agricultural or community college. About the same number again (38%) had either some university undergraduate (23%) or graduate (14%) education. The remaining 28% had some high school (22%) or less than grade 10 (6%). Census data from 2006 regarding the educational attainment of farm operators in Nova Scotia suggests that only 16% had completed university (bachelor degree or higher,
Table 1). The previously mentioned “farm biodiversity” survey of Nova Scotia farmers was skewed towards even higher education levels, with over half of respondents having some university [
40]. This survey is more reflective of the general farmer population in the region, considering the educational attainment in these provinces of the general labour force aged from 55 to 64 during October of 2014 (
Table 1). A 2003 survey about the Environmental Farm Plan, also using the NSFA mailing list, demonstrated even lower and likely more representative average educational attainment among respondents [
23].
Table 1.
Educational attainment of this cohort (%) in comparison with other survey results of the NSFA membership (Goodale et al. 2015; Atari et al. 2008), the 2011 Canadian Census general labour force, and the 2006 educational attainment of farm operators in the province of Nova Scotia.
Table 1.
Educational attainment of this cohort (%) in comparison with other survey results of the NSFA membership (Goodale et al. 2015; Atari et al. 2008), the 2011 Canadian Census general labour force, and the 2006 educational attainment of farm operators in the province of Nova Scotia.
| | Goodale et al. 2015 [40] | This Cohort | 2011 Labour Force [56] | Atari
et al. 2008 [23] | 2006 Educational Attainment of NS Farm Operators [57] |
|---|
| High school or less | 21 | 28 | 37 | 43 | 84 |
| Some/completed college | 25 | 35 | 38 * | 57 ** |
| Some/completed university | 54 | 38 | 21* | 16 *** |
When asked to describe their farms, respondents indicated commodity types that are characteristic of the region (
Table 2). Survey respondents were asked to tick as many commodities as they produce, and most ticked at least two. The commensurate census-based numbers are based on a primary classification per farm, but the match with the percentage of commodities ticked is close save for woodlots, for which there is no suitable match within the farm classification system.
3.2. Identification of Nuisance Species
The most prevalent nuisance species nominated by respondents were: deer (53% of farmers), coyotes (49%), bears (36%), raccoons (35%), crows (19%), geese (16%), porcupine (15%), songbirds (13%, a category comprised of a variety of small birds including starlings), beavers (12%), and rodents (12%). The top four species were each nominated by over a third of respondents, providing enough data to explore them in more detail. It is difficult to connect specific commodities to the species considered a nuisance because of the fact that most farms had more than one commodity. For instance, the fact that 71% of Christmas tree farmers considered coyotes a nuisance might be based on the other commodities those farmers produced. A few relationships do make sense, however, such as the fact that deer are considered a nuisance by over 70% of those with blueberries, orchards, or vineyards, and coyotes are considered a nuisance by over 80% of poultry and sheep farmers.
Table 2.
Commodity mix of this survey cohort in comparison with the 2011 Census of Agriculture.
Table 2.
Commodity mix of this survey cohort in comparison with the 2011 Census of Agriculture.
| Commodity | % of Respondents (n = 142) | % of Total Commodities Indicated (n = 332) | Corollary from Census % (Major Classification) |
|---|
| Field crops | 62 | 26 | 34 (oilseed, grain, vegetable and other) |
| Woodlot | 55 | 23 | 73^ (Christmas trees, woodlands or wetlands) |
| Beef | 35 | 15 | 12 |
| Blueberries | 22 | 9 | 21 (fruit and tree-nut farming) |
| Orchard | 15 | 6 |
| Vineyard | 5 | 5 |
| Sheep | 13 | 5 | 2 |
| Dairy | 12 | 5 | 7 |
| Poultry | 9 | 4 | 3 |
| Christmas trees | 5 | 2 | 9 (Nursery and tree production) |
| Fur | 4 | 2 | 2 |
3.3. Methods of Coping with Nuisance Species
Coping mechanisms differed by species. Coyotes and raccoons were most frequently shot or trapped to eliminate the nuisance (54% and 71%, respectively, of those who listed the species as a nuisance), or trapped for fur harvest (24% and 22%); much fewer used physical barriers such as fences for these species (14% and 18%). Less than a quarter of those who nominated these species as a nuisance did not identify a coping mechanism (23% and 16%), and these are the only species that a few farmers admitted trapping and relocating or poisoning, despite the latter practice being illegal. A quarter of those who listed bears as a nuisance species hunted it for food, trapped or shot it to remove the nuisance, and/or used a physical barrier, and a third nominated no coping mechanism. Finally, deer were typically hunted for food (44%), fenced out (28%), repelled with pheromones (12%) or a deterrent such as scarecrows (8%). A third of those who mentioned deer also noted no coping mechanism.
3.4. Estimated Losses and the Acceptability of Those Losses by Species
As would be expected on a survey about “nuisance nature”, when asked about the acceptability of financial losses caused by these four species, the general attitude was that they were “unacceptable”. For all species identified, losses were generally unacceptable (46% were listed as “completely unacceptable” and 41% “somewhat unacceptable”) and only 13% were neutral or positive (7% “indifferent”, 4% “somewhat acceptable”, and 2% “completely acceptable”). When asked if they had been compensated for their losses, five times as many farmers elected to write in “no” where otherwise only a box marked “yes” was available to tick. Acceptability of loss scores were converted to a scale from −2 to 2, where −2 means completely unacceptable, and 2 completely acceptable. The most acceptable losses among the top four species were those caused by deer, with a mean score of −0.83 (
n = 54). The other three species had mean acceptability scores of −1.22 (bear;
n = 37) to −1.33 (raccoon;
n = 36). The estimated monetary values of those losses over the last two years self-reported in the survey were higher, on average, for deer than the other three most dominant species (
Table 3). Interestingly, the losses caused by deer were also the least unacceptable. Measuring the relationship between estimated loss and acceptability of loss using ordinal logistic regression revealed no significant relationship between the two measures.
3.5. Perceived Benefits or Cultural Ecosystem Services
An overall benefits score was calculated by taking the mean of the three questions regarding cultural ecosystem services (Cronbach’s alpha = 0.76). Of the top four species, deer had the most perceived benefits with a mean score of 0.2, and raccoon had the least benefits at −1.1 (
Table 4). Respondents were generally negative to the remaining top four with coyotes scored at −0.7, and bears at −0.4.
Perceived benefits of species were measured by their agreement to three statements regarding cultural ecosystem services. Farmers generally agreed that: they enjoyed the presence of deer, deer provided an educational opportunity, and deer were an indicator of land health (
Table 4). Farmers disagreed with those statements more or less for all the other top 10 species, save for a slight agreement that beavers were an indicator of land health. Including the standard error, the score for coyotes also reached slightly above zero on that measure.
A one-way ANOVA reveals significant (p < 0.05) differences in the mean benefits scores between responses stating losses were completely unacceptable (mean = −1.1, n = 142), somewhat unacceptable (mean = −0.29 n = 129), and indifferent to acceptable (mean = −0.32, n = 39). A Tukey post hoc test revealed that the mean score of the “completely unacceptable” group was significantly (p < 0.01) lower than either “somewhat unacceptable” or “indifferent to acceptable”.
3.6. Overall Tolerance toward Species
Respondents were asked to indicate if they would prefer to have or not have the species on their land. Generally, respondents would rather not have the nuisance species. Out of all species nominated, 64% respondents would rather not have it, 20% said they would rather have it, and 15% were unsure. The scale was converted numerically where −1 means they would rather not have the species and 1 means they would rather have the species. Respondents were the most positive toward deer, with a mean score of zero (
Table 4).
Table 3.
Estimated financial losses for the top four species, based on survey responses.
Table 3.
Estimated financial losses for the top four species, based on survey responses.
| Species | n Estimating $ Losses | Min | Mean | Max | StDev | n Assessing Acceptability of Losses | Acceptability of Losses (−2 to 2) |
|---|
| Deer | 28 | $60 | $10,295 | $63,000 | $17,798 | 54 | −0.83 |
| Bears | 24 | $150 | $4219 | $37,500 | $7924 | 37 | −1.22 |
| Raccoons | 19 | $200 | $2666 | $10,000 | $2446 | 36 | −1.33 |
| Coyotes | 17 | $0 | $886 | $2500 | $792 | 41 | −1.24 |
Table 4.
Cultural benefits perceived by survey respondents about the most commonly nominated “nuisance” species, sorted by overall desirability. Potential scores range from −2 to +2, with the exception of “overall tolerance” which has a range of −1 to +1.
Table 4.
Cultural benefits perceived by survey respondents about the most commonly nominated “nuisance” species, sorted by overall desirability. Potential scores range from −2 to +2, with the exception of “overall tolerance” which has a range of −1 to +1.
| | Enjoy the Presence | Educational Opportunity | Indicator of Land Health | Benefits Score (EGS) | Overall Tolerance |
|---|
| N | Score | S.E. | N | Score | S.E. | N | Score | S.E. | N | Score | S.E. | N | Score | S.E. |
|---|
| Deer | 60 | 0.3 | 0.2 | 59 | 0.1 | 0.2 | 63 | 0.1 | 0.2 | 65 | 0.2 | 0.1 | 64 | 0.0 | 0.1 |
| Beaver | 13 | −0.8 | 0.4 | 12 | −0.4 | 0.4 | 14 | 0.2 | 0.4 | 15 | −0.1 | 0.3 | 14 | −0.3 | 0.3 |
| Bears | 41 | −0.7 | 0.2 | 39 | −0.2 | 0.2 | 42 | −0.3 | 0.2 | 44 | −0.4 | 0.2 | 45 | −0.3 | 0.1 |
| Geese | 21 | −0.7 | 0.3 | 18 | −1.2 | 0.3 | 20 | −0.3 | 0.3 | 21 | −0.7 | 0.2 | 22 | −0.5 | 0.2 |
| Crows | 25 | −1.2 | 0.2 | 24 | −0.9 | 0.3 | 24 | −0.6 | 0.3 | 25 | −0.9 | 0.2 | 25 | −0.6 | 0.1 |
| Songbirds | 16 | −0.9 | 0.3 | 16 | −1.1 | 0.3 | 16 | −1.0 | 0.4 | 16 | −1.0 | 0.3 | 15 | −0.6 | 0.2 |
| Coyotes | 57 | −1.2 | 0.2 | 55 | −0.6 | 0.2 | 58 | −0.1 | 0.2 | 60 | −0.7 | 0.1 | 60 | −0.6 | 0.1 |
| Raccoons | 40 | −1.4 | 0.2 | 40 | −1.1 | 0.2 | 41 | −1.0 | 0.2 | 43 | −1.1 | 0.2 | 43 | −0.7 | 0.1 |
| Porcupines | 19 | −1.0 | 0.3 | 19 | −0.4 | 0.3 | 19 | −0.4 | 0.3 | 19 | −0.6 | 0.2 | 19 | −0.8 | 0.1 |
| Rodents | 16 | −1.8 | 0.3 | 15 | −1.9 | 0.1 | 13 | −0.5 | 0.4 | 16 | −1.5 | 0.1 | 15 | −0.9 | 0.1 |
3.7. Nuisance Type: Damage vs. Threat
To understand how the nuisance type drove acceptability, responses were separated into categories based on the nature of the nuisance respondents felt that each species represented: damage to property/crops, or threat to the safety of people, pets, or livestock. Species were not placed in one or another category, but rather responses were placed based on farmer responses. For instance, most people considered deer a “damage” species, based on browse and fence damage, but a handful also noted the threat they posed as a result of vehicle collisions. Farmers who found bears a threat would be included in the “threat” model, as long as they did not also note them as causing damage, and
vice versa. Damage species most often included deer, raccoons, bears, geese, crows, songbirds, and beavers (
Table 5). Threat species most often included coyotes, raccoons, and raptors. Bear was the species most often perceived as both.
Table 5.
Species listed at least 10 times, categorized by threat, damage, or both.
Table 5.
Species listed at least 10 times, categorized by threat, damage, or both.
| Species | Threat n = 126 | Combination n = 67 | Damage n = 248 | Total |
|---|
| Deer | 1 | 7 | 64 | 72 |
| Coyotes | 53 | 9 | 3 | 65 |
| Bears | 8 | 19 | 23 | 50 |
| Raccoons | 14 | 8 | 27 | 49 |
| Crows | 3 | 1 | 18 | 22 |
| Geese | 0 | 0 | 22 | 22 |
| Porcupines | 5 | 4 | 11 | 20 |
| Songbirds | 1 | 2 | 15 | 18 |
| Beavers | 0 | 0 | 15 | 15 |
| Rodents | 3 | 4 | 7 | 14 |
| Groundhogs | 1 | 3 | 8 | 12 |
| Raptors | 11 | 0 | 0 | 11 |
| Seagulls | 2 | 0 | 9 | 11 |
There were broad differences between these two categories of nuisance type. Threatening species were generally perceived to have fewer cultural benefits, with low mean scores for each category; −0.9 enjoy the presence (compared to −0.7 for damaging species), −0.8 educational opportunity (−0.7 for damaging), and −0.3 as a symbol of land health (−0.4 for damaging species). Damaging species were more likely to be hunted for sport (22.2% of responses compared with 5.6% for threat species), whereas threat species were significantly more likely to be dealt with using other lethal means (shooting, poisoning, or trapping) (54% of threatening species compared with 35.5% of damaging). There was no difference in non-lethal deterrents such as fences, pheromones, or repellents. Women were more likely than men to list threatening species as a nuisance (59% compared with 25% of males listed species as exclusively a threat; p < 0.01), as were part-time farmers (compared with full-time, p < 0.05), and older farmers (p < 0.01).
3.8. Impact of Acceptability of and Perception of Benefit on Overall Tolerance
Ordinal logistic regression was used to model the impact of perceived benefits (measured as the mean score of perceived ecosystem services), and acceptability of loss on overall tolerance (measured as the willingness to have or not have the species). The model was then run separately using the two nuisance type categories, threat or damage (irrespective of species). “Perceived control” (whether or not a coping method was used) and demographic differences (age, gender, education, and full-time status) were included as control variables. For both models, “perceived benefits” was significantly associated with tolerance toward a species (
Table 6). This relationship was particularly strong among damaging species (
p < 0.01), but still strong for species considered a threat (
p < 0.05).
Table 6.
Influence of independent variables on the overall acceptability of species, by type of nuisance.
Table 6.
Influence of independent variables on the overall acceptability of species, by type of nuisance.
| | Damage (n = 146) | Threat (n = 50) |
|---|
| Coef | Std Err | Coef | Std Err |
|---|
| Perceived Benefit (EGS score) | 0.97 *** | 0.22 | 1.03 ** | 0.48 |
| Acceptability of $ Loss (Compared to “completely unacceptable”) |
| Somewhat Unacceptable | 1.02 ** | 0.51 | 2.93 ** | 1.34 |
| Indifferent or Acceptable | 3.17 *** | 0.84 | 1.87 | 1.29 |
| Demographics |
| Age | −0.06 ** | 0.03 | −0.004 | 0.05 |
| Gender (compared to female) | 0.23 | 0.70 | 4.07 ** | 1.57 |
| Education (compared to technical school) |
| High School or Less | 0.01 | 0.51 | −1.88 | 1.32 |
| University | 0.29 | 0.53 | −0.97 | 1.07 |
| Full Time | −0.80 * | 0.49 | −1.99 | 1.24 |
| Indicated Coping Method | −0.40 | 0.51 | −1.48 | 1.11 |
There were differences in the relationship between the acceptability of loss and overall tolerance among damaging and threatening species (
Table 6). Among species considered to be damaging, compared to losses that were completely unacceptable, losses that were somewhat unacceptable (
p < 0.05) and neutral to acceptable (
p < 0.01) were significantly linked to tolerance of a species. Among species considered a threat, losses that were somewhat unacceptable were linked to tolerance (
p < 0.05), but losses that were considered neutral to acceptable were not linked to overall tolerance. Age was a significant variable for damaging species (
p < 0.05), where older respondents were less tolerant. Women were significantly less tolerant of threatening species (
p < 0.05), and full-time farmers somewhat significantly less tolerant of damaging ones (
p < 0.1). Education had no impact.
4. Discussion
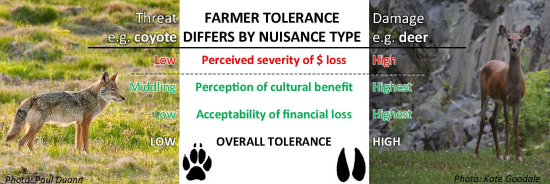
We used an elicitation-style survey to understand what motivates farmers to accept co-existence with some wildlife but not others. The four most commonly listed nuisance species were not surprising: deer, coyote, raccoon, and bear. This study was undertaken during a time of heightened farmer complaints about nuisance species, especially deer, and increased media coverage of coyote sightings in peri-urban areas. Farmers perceived species they saw as causing damage, such as deer, very differently from those that posed a threat, such as coyote. These two species serve as useful archetypes for understanding the dynamics because they were exclusively considered one or the other, and are used as examples here (
Figure 2).
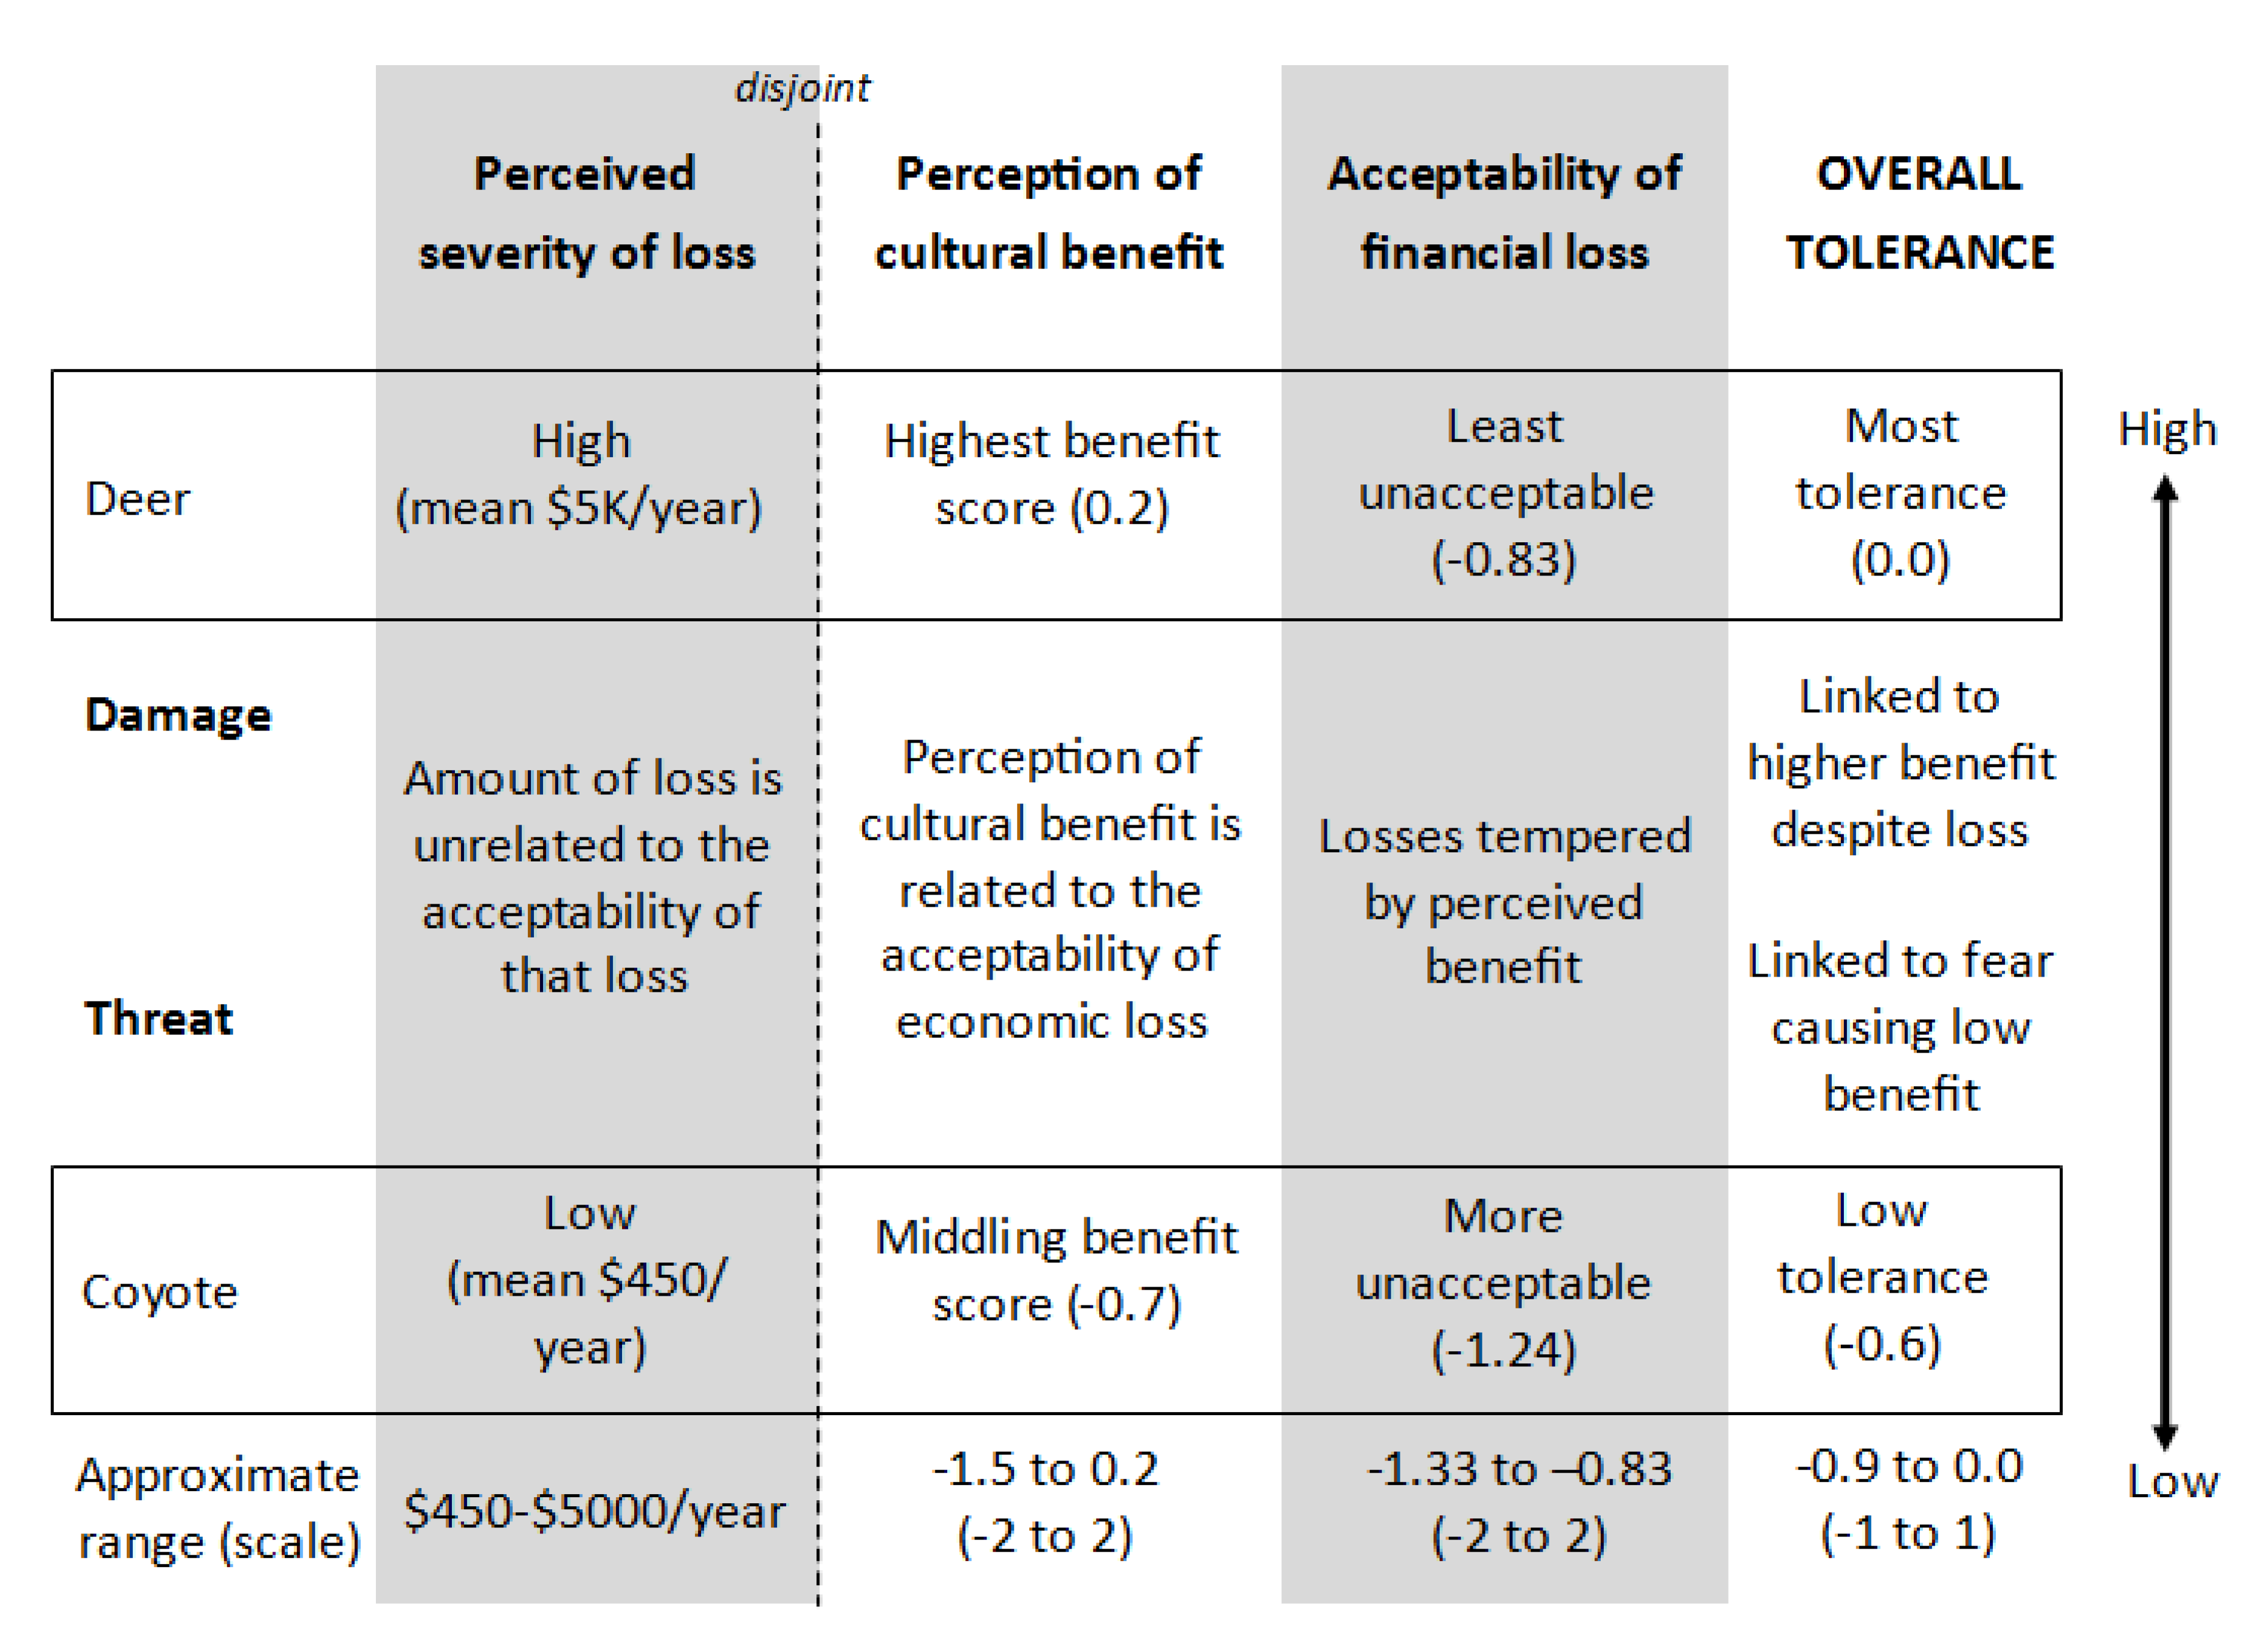
Figure 2.
Theoretical drivers of species tolerance by nuisance type, using examples.
Figure 2.
Theoretical drivers of species tolerance by nuisance type, using examples.
The negative framing of the survey led to an overwhelmingly negative perception of all listed species, which was to be expected. This negative perception was not associated with monetary cost, however. Losses were generally seen as unacceptable, but there was no link between the declared monetary losses and the perceived acceptability of that loss. Still, estimates of monetary loss must be interpreted with caution since they cannot be verified. It was not the intention, however, to measure the actual monetary cost of the nuisance species. Self-reported acceptance of losses can instead be used as a qualitative indicator of perceived damage severity. Further studies could assess severity of negative impact more qualitatively to more clearly target perceived losses in relation to the unique farm enterprise. Such assessments of impact perceptions have been useful indicators of acceptability in other settings [
50]. Overall, however, losses from species perceived as a threat were considered more unacceptable than those from species perceived as simply causing damage, although the reported monetary costs were lower for threatening species (
Figure 2). Deer primarily cause damage to crops or property: they had the highest estimations of financial cost, but those losses were the least unacceptable, perhaps because of perceived benefits such as enjoying their presence, making them overall slightly more desirable to have than not have. Coyotes, by contrast, represent a threat to livestock, pets, or humans: respondents reported very little financial loss, but those losses were considered very unacceptable, perhaps because of a lack of other perceived benefits. Alternately, respondents preferred not to have species that were considered to be a threat. Other surveys have reported similar results,
i.e., that damage from carnivores such as bears was less tolerated than that from deer [
58]. A wider range of negative impacts, such as intangible effects like fear or trauma, must be captured in order to fully understand the interplay between a fuller range of costs and benefits as drivers of tolerance.
The perceived prevalence of or exposure to a species is another likely driver of acceptability [
9] not explicitly tested here. Deer were considered more enjoyable to see than they were appreciated as a sign of ecosystem health, perhaps because of their regional abundance. A Minnesota study suggests that many farmers enjoy seeing deer on their property because they are deer hunters [
58]. Discussions with the Nova Scotia Department of Natural Resources suggest that farmers in the Maritimes are often quite negative about hunters, and avoid letting hunters use their land, even though it is an acceptable form of population control according to regulators (within bag limits), and a third of farmers reported that they had no coping mechanism for deer or bear, two species with hunting seasons. Seven respondents to this survey listed humans as a nuisance, in part because of the behaviour of hunters on their land. An agreed code of practice may need to be developed to bring these communities together for mutual benefit.
In contrast with the abundant deer, the comparatively less abundant coyotes were very undesirable overall, but the respondents were slightly (perhaps grudgingly) inclined to agree that the presence of coyotes indicates their farm ecosystem is healthy. Other research suggests that nuisance animals such as bears should be tolerated for similar reasons [
13,
59]. This may reflect a certain intrinsic value perceived with rarer species, which carnivores are always likely to be, relative to herbivores, in an ecosystem. Rarity is perhaps associated with natural heritage in a way that would be less unlikely to be extended to introduced or with overly abundant species perceived of doing ecological harm [
60]. These findings suggest that emphasizing the rarity and benefits of a species, rather than the risks, could increase the tolerance of people toward such species. Outreach about benefits should not be limited, however, to cultural benefits. This survey did not explore other services, such as food, natural pest control, or pollination that wildlife may also provide. In Alberta, it was found that the benefits associated with elk, such as hunting and the ecological role of elk, are not emphasized in policy, reinforcing negative attitudes and low tolerance among farmers towards elk [
61]. Further work should explore farmer knowledge of such relationships, and explore whether they influence tolerance.
The nature of the nuisance that a species presents—damage or threat—seemed to be associated with how perceived benefits and losses from that species contributed to overall tolerance (
Figure 2). The overall tolerance of damaging species is strongly significantly related (
p < 0.01) to the perception of cultural benefits (using the average of the three “cultural” questions) and the acceptability of losses, although the order of causality cannot be determined. It may be that the species is tolerated because of more deep-seated values, not tested here, and that this drives the perception of cultural benefits and, for some, an acceptance of damage. Our model is largely consistent with existing work in human-wildlife interaction that suggests acceptability is a function of monetary costs, benefits, and risks, as well as personal and contextual factors [
7,
10]. Relationships between independent variables, however, suggest the picture is more complex. More work is needed to disentangle the order of causality, ideally as a theory that works across species.
Species that present a threat incurred a very different algebra by farmers. While perceived cultural benefits were also strongly significantly related to the acceptability of a threatening species, the acceptability of economic loss was inconsistently linked to overall tolerance: somewhat unacceptable losses were linked to tolerance, but this relationship did not extend to losses that were acceptable. The lack of connection between monetary loss and tolerance for threat-based species in particular may be affected by the gap between perceived and actual risk. For instance, depredation of stock actually increased tolerance of carnivores in Norway when two regions with different stock mortalities were surveyed [
62]. There is heightened alarm about coyotes in the region due to increased provincial coyote awareness programs and media coverage of peri-urban coyote sightings, especially since 2009, when a solitary female hiker in Cape Breton National Park in Nova Scotia was killed by a coyote. This may be contributing to an elevated sense of fear among all residents, but especially those who live and work in close proximity to nature.
Demographic variables associated with tolerance by nuisance type were largely built into the dataset that the survey design elicited. This can be viewed in two ways. For conventional survey analysts, this bias represents analytical weakness. All three of the demographic relationships in our models can be somewhat discarded because that demographic cohort is over-represented in one of the models. Women seem less tolerant of threatening species, but they also listed more of them; same for older farmers. Similarly, full-time farmers seem less tolerant of damaging species, but also listed more of them. In order to fully test demographic relationships, this bias would need to be removed by sampling within the dataset. This was not possible in the small dataset produced by this survey implementation.
The flip side of the above analytical weakness is the fact that the elicitation mode presented front-of-mind nuisance species, largely without prompts, and that there are demographic differences in not only the species but the kind of nuisance that is most concerning to farmers. Full-time farmers are most concerned with damage, perhaps coming from a farming background and being accustomed to dealing with the present risks of wild animals. The part-time farmers, especially the small-holders or “hobby farmers” among them, may not actually grow or raise much, and thus damage is not a concern as much as the safety of their family for whose benefit they likely chose a rural block. Other research has shown differences between these cohorts, for instance, in weed control [
63] and conservation [
17]. Age is also a frequently mentioned differentiator of farming practices, as well as more contextual variables such as commodities [
64] and the presence of a succession plan [
17]. A more extensive survey could explore these relationships further.
While we cannot fully test the influence of gender on tolerance, the proposition of Dougherty
et al. (2003) [
65] that gender is an important moderator of the relationship between values, beliefs, and attitudes is likely robust. One can imagine many reasons why this is the case; many may be based on stereotypes (
i.e., “Mama bear”), but many studies testing the influence of gender (including this one) are inadequate to understand the impact [
66]. More fulsome studies of this dynamic show that it can be difficult to control for the ways that genders differ in, for instance, value orientations and negative-consequence beliefs [
67]. While gender may mediate the relationship between values and management, a survey like this one cannot explore those relationships; while a female may be filling out the survey, decisions about wildlife management are likely to be joint decisions on a farm. This may, in fact, be one of the intractable challenges of farm surveys of this type. By contrast with surveying residents about their preferred government wildlife management options, farm management is often negotiated between individuals who may not share values, beliefs, or attitudes, yet only one of those managers typically fills out the survey. Qualitative interviews with farming couples and other management teams can help to fill such gaps in understanding.
This brief, elicitation-style survey had strengths and weaknesses in terms of understanding farmer perception of nuisance wildlife species. Its small size was intended to encourage a high response rate, which was not achieved. While we achieved a typical response for a single mail-out (12%), response rates are dropping with all surveys [
68]. Making the surveys shorter in response may well be counter-productive. A short survey may seem insignificant or unimportant and thus be just as likely to be discarded as a long one. The resulting battle for space on the survey meant that some scales were compressed and some variables ignored. Some of these have already been mentioned, such as non-cultural ecosystem services perceived to be provided by a species, but, also, we did not ask about the farmer’s level of success or satisfaction with various coping mechanisms. We did test to see if respondents who listed no coping mechanisms for a given species were less likely to tolerate it, but it is questionable to assume that not filling out that question indicated they had no method; nonetheless, the relationship was not significant. As discussed above, the elicitation design allowed us to see which species were top-of-mind as a nuisance to farmers of different kinds, largely without prompts, but it also provided less data to use in modeling the drivers of acceptability.


