Dissimilarity of Ant Communities Increases with Precipitation, but not Reduced Land-Use Intensity, in Indonesian Cacao Agroforestry


Abstract
:1. Introduction
2. Experimental Section
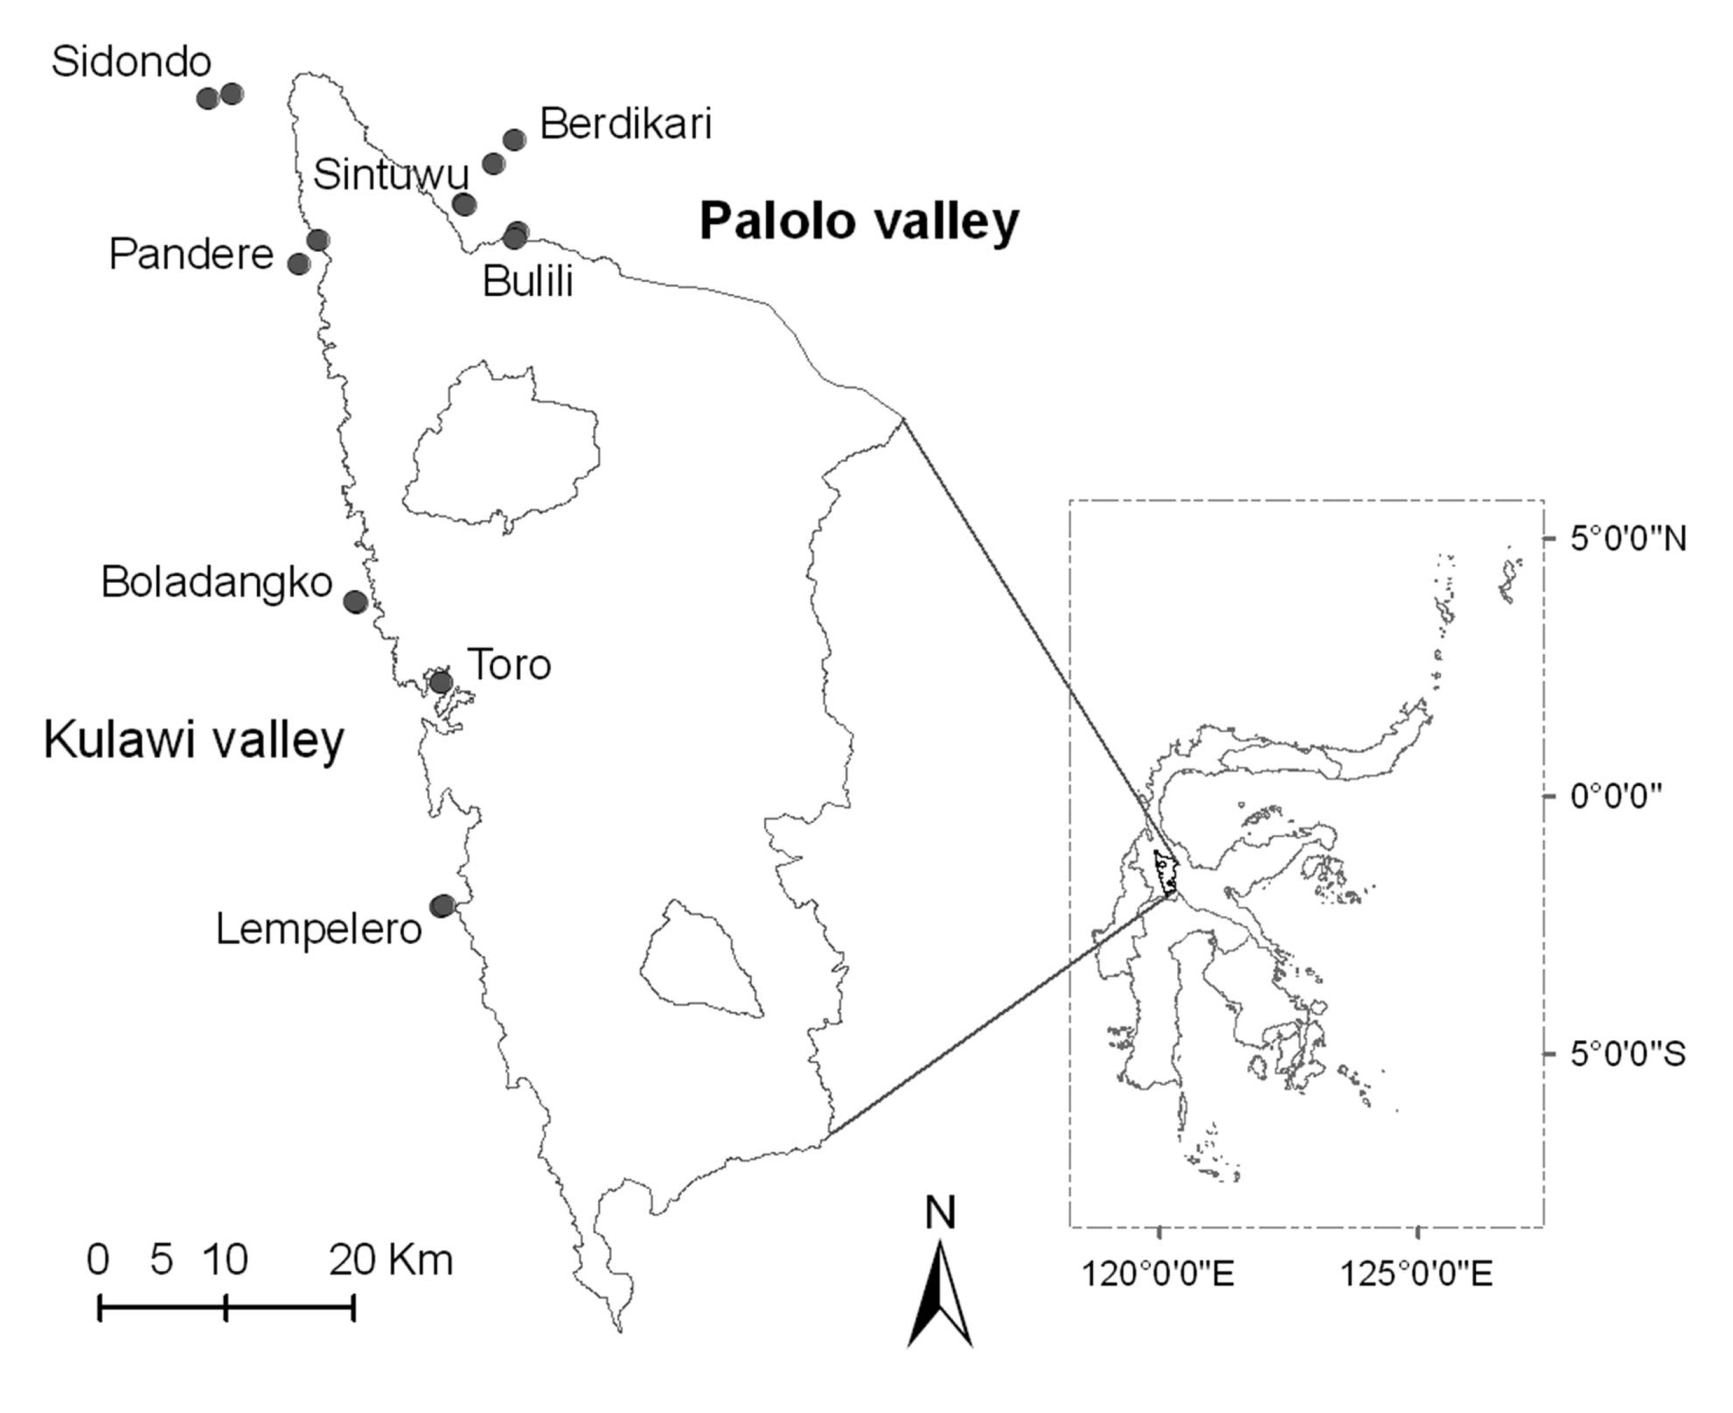
2.1. Study Sites

| No | Village | Land-use | Latitude (°S) | Longitude (°E) | Altitude (m asl) | Precipitation (mm/year) | Observed species | Estimated species (%)* |
|---|---|---|---|---|---|---|---|---|
| 1. | Berdikari | A | 01.11693 | 120.09266 | 646 | 2,051 | 24 | 28.5 (84.2) |
| B | 01.13420 | 120.07861 | 603 | 17 | 25.0 (68.0) | |||
| 2. | Sintuwu | A | 01.16213 | 120.05642 | 554 | 1,430 | 26 | 32.8 (79.4) |
| B | 01.16339 | 120.05790 | 567 | 20 | 52.0 (38.5) | |||
| 3. | Bulili | A | 01.18261 | 120.09550 | 582 | 1,504 | 17 | 29.3 (58.1) |
| B | 01.18738 | 120.09239 | 652 | 18 | 22.2 (81.2) | |||
| 4. | Pandere | A | 01.18844 | 119.95393 | 179 | 1,160 | 21 | 23.1 (91.0) |
| B | 01.20482 | 119.94063 | 102 | 18 | 19.5 (92.3) | |||
| 5. | Sidondo | A | 01.08366 | 119.89272 | 41 | 1,032 | 23 | 35.3 (65.2) |
| B | 01.08764 | 119.87599 | 27 | 16 | 17.5 (91.4) | |||
| 6. | Boladangko | A | 01.44530 | 119.98057 | 523 | 1,590 | 24 | 44.3 (54.2) |
| B | 01.44499 | 119.98001 | 558 | 18 | 20.7 (87.1) | |||
| 7. | Toro | A | 01.50238 | 120.04055 | 800 | 1,704 | 26 | 32.4 (80.2) |
| B | 01.50237 | 120.04109 | 797 | 21 | 24.1 (87.0) | |||
| 8. | Lempelero | A | 01.66104 | 120.04093 | 432 | 1,742 | 14 | 16.7 (84.0) |
| B | 01.66035 | 120.04307 | 438 | 22 | 30.1 (73.1) |
2.2. Plots Selection and Ant Sampling
2.3. Data Analysis
3. Results
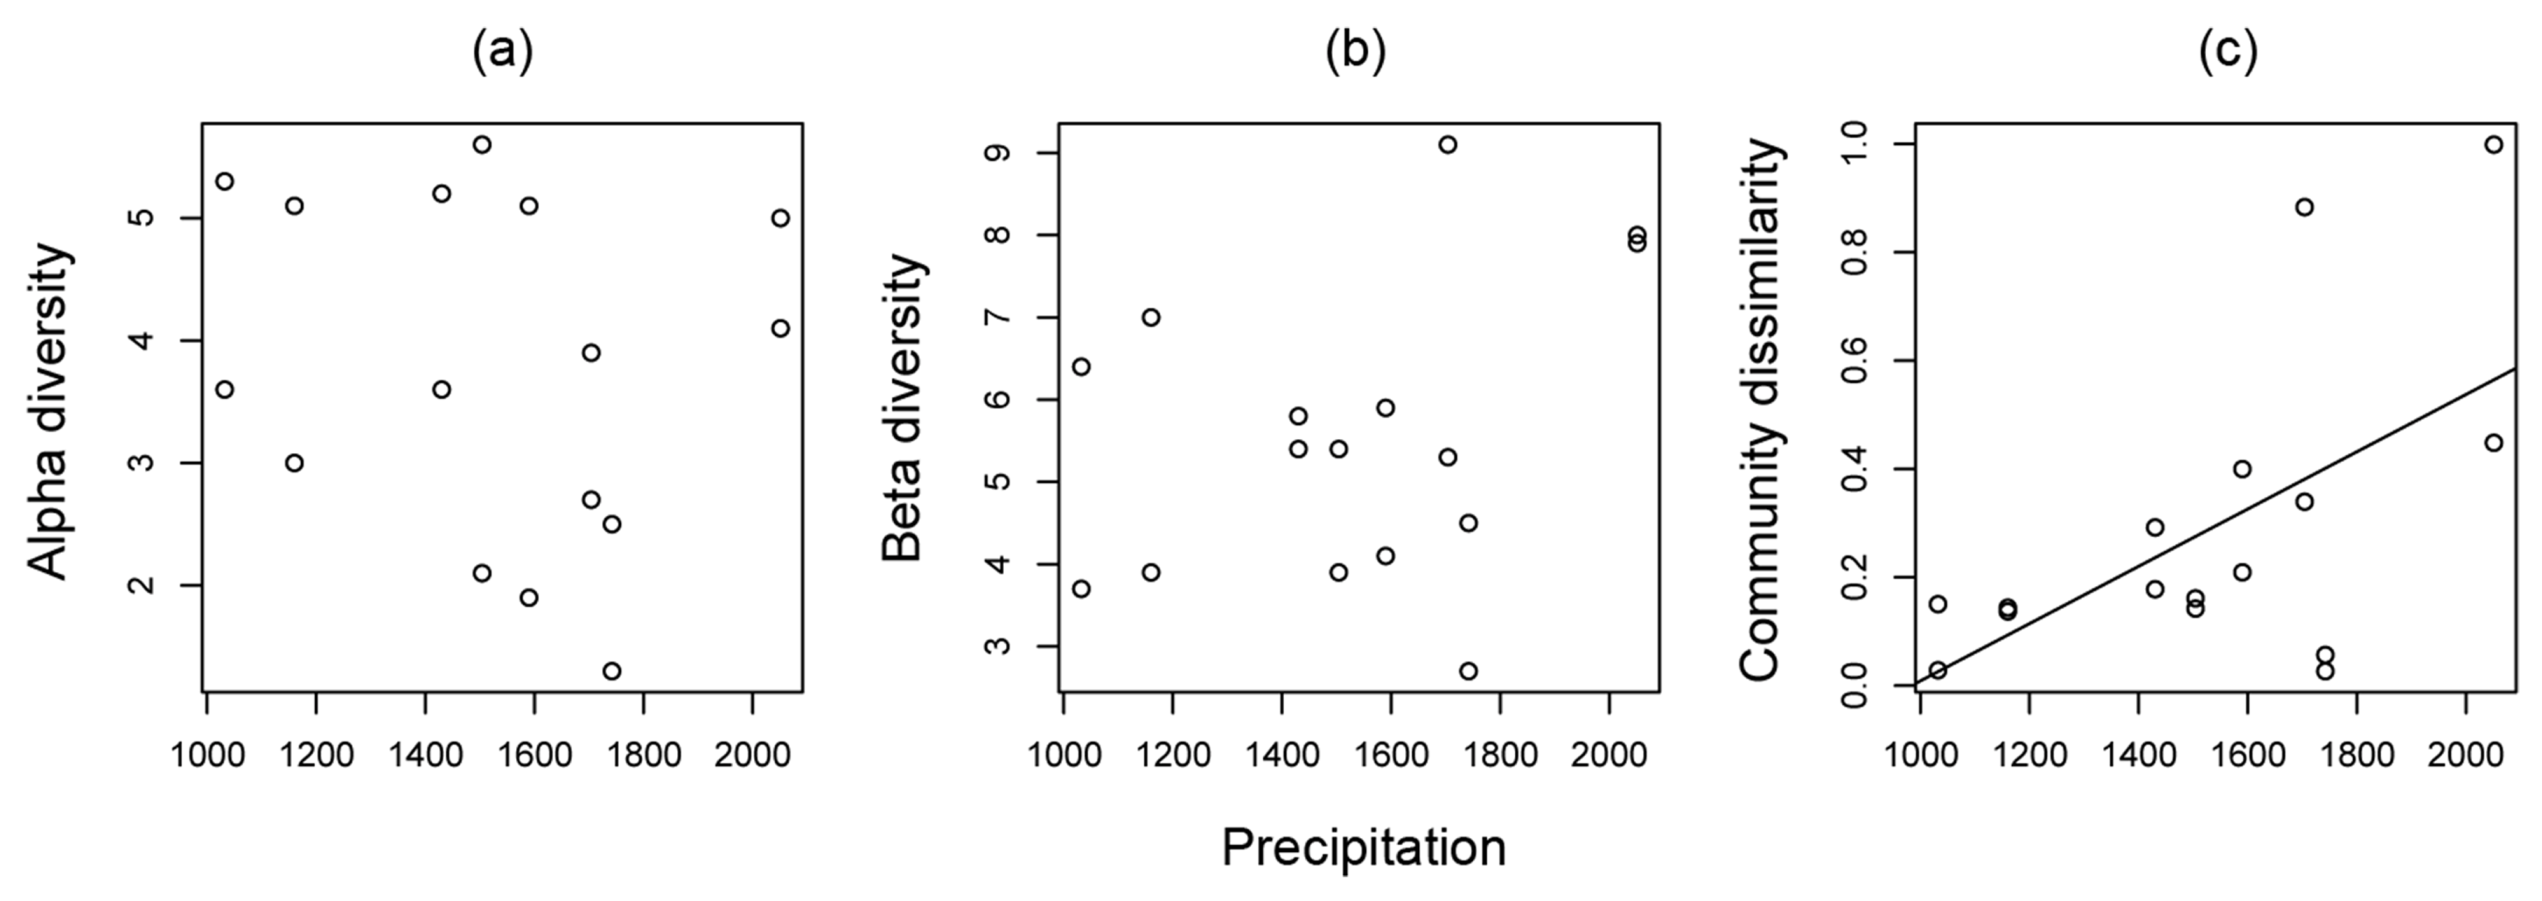
3.1. Ant Community Structure along Land-Use Intensity and Precipitation Gradients
| Parameters | Strata | |||
|---|---|---|---|---|
| Total | Tree | Soil surface | ||
| Alpha diversity | ||||
| Land-use | F1,12 = 0.084, P = 0.777 | F1,12 = 0.070, P = 0.796 | F1,12 = 0.006, P = 0.940 | |
| Precipitation | F1,12 = 0.003, P = 0.957 | F1,12 = 0.415, P = 0.532 | F1,12 = 0.059, P = 0.813 | |
| Altitude | F1,12 = 0.001, P = 0.982 | F1,12 = 0.014, P = 0.907 | F1,12 = 1.372, P = 0.264 | |
| Beta diversity | ||||
| Land-use | F1,12 = 4.950, P = 0.046 | F1,12 = 1.511, P = 0.243 | F1,1 = 2.379, P = 0.149 | |
| Precipitation | F1,12 = 0.223, P = 0.645 | F1,12 = 1.708, P = 0.216 | F1,12 = 0.134, P = 0.721 | |
| Altitude | F1,12 = 2.779, P = 0.121 | F1,12 = 0.286, P = 0.603 | F1,12 = 1.980, P= 0.185 | |
| Ant community similarity | ||||
| Land-use | F1,12 = 0.277, P = 0.608 | F1,12 = 1.854, P = 0.198 | F1,12 = 0.576, P = 0.463 | |
| Precipitation | F1,12 = 5.032, P = 0.045 | F1,12 = 7.613, P = 0.017 | F1,12 = 0.008, P = 0.932 | |
| Altitude | F1,12 = 1.025, P = 0.331 | F1,1 2= 0.588, P = 0.458 | F1,12 = 0.008, P = 0.932 | |
| Parameters | Strata | ||
|---|---|---|---|
| Total | Tree | Soil | |
| Alpha diversity | r2 = −0.071, F1,14 = 0.003, P = 0.954 | r2 = −0.036, F1,14 = 0.481, P = 0.450 | r2 = −0.067, F1,14 = 0.062, P = 0.808 |
| Beta diversity | r2 = −0.059, F1,14 = 0.159, P = 0.697 | r2 = 0.047, F1,14 = 1.733, P = 0.209 | r2 = −0.063, F1,14 = 0.114, P = 0.740 |
| Ant community similarity | r2 = 0.223, F1,14 = 5.296, P =0.037 | r2 = 0.280, F1,14 = 6.828, P = 0.021 | r2 = −0.071, F1,14 = 0.009, P = 0.927 |

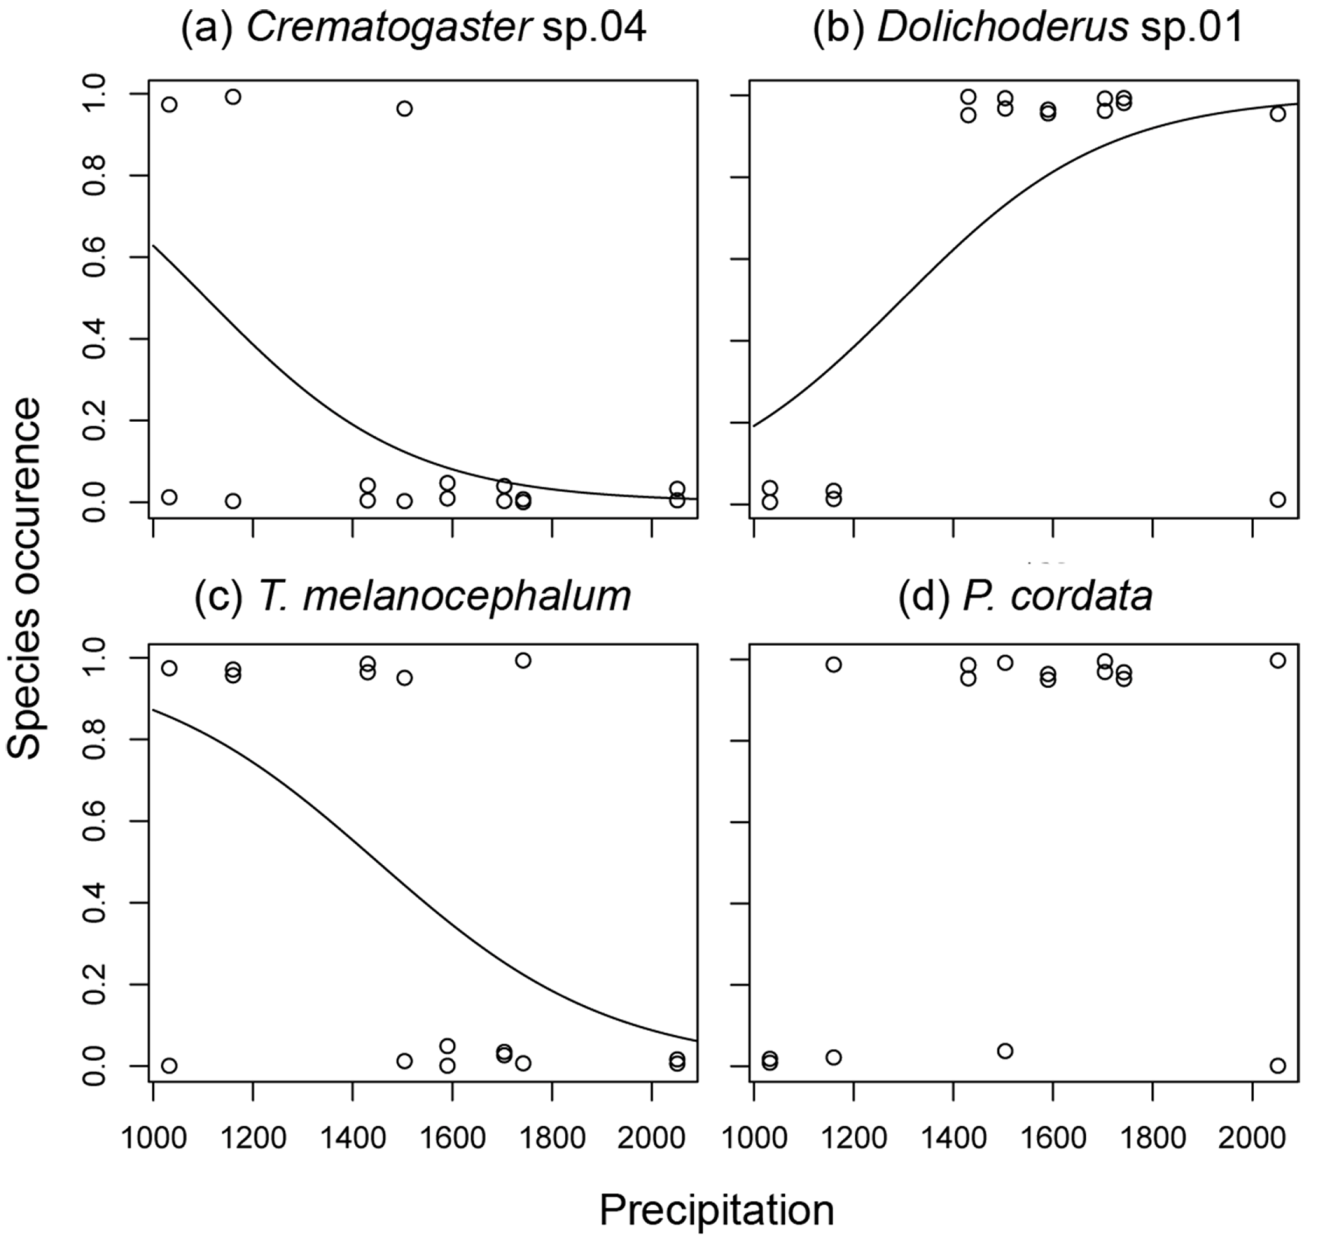
3.2. Ant species Responses to Precipitation Gradients
4. Discussion
5. Conclusions
Acknowledgments
References
- Sala, O.E.; Chapin, F.S.; Armesto, J.J.; Berlow, E.; Bloomfield, J.; Dirzo, R.; Huber-Sanwald, E.; Huenneke, L.F.; Jackson, R.B.; Kinzig, A.; et al. Biodiversity-Global biodiversity scenarios for the year 2100. Science 2000, 287, 1770–1774. [Google Scholar] [CrossRef]
- Lovejoy, T.E. Climate change. In Conservation Biology for All; Sodhi, N.S., Ehrlich, P.R., Eds.; Oxford University Press: Oxford, UK, 2010; pp. 153–162. [Google Scholar]
- Hellmann, J.J.; Byers, J.E.; Bierwagen, B.G.; Dukes, J.S. Five potential consequences of climate change for invasive species. Conserv. Biol. 2008, 22, 534–543. [Google Scholar] [CrossRef]
- Tylianakis, J.M.; Didham, R.K.; Bascompte, J.; Wardle, D.A. Global change and species interactions in terrestrial ecosystems. Ecol. Lett. 2008, 11, 1351–1363. [Google Scholar] [CrossRef]
- Gornall, J.; Betts, R.; Burke, E.; Clark, R.; Camp, J.; Willett, K.; Wiltshire, A. Implications of climate change for agricultural productivity in the early twenty-first century. Philos. Trans. R. Soc. Lond. Ser. B 2010, 365, 2973–2989. [Google Scholar] [CrossRef]
- Bhagwat, S.A.; Willis, K.J.; Birks, H.J.B.; Whittaker, R.J. Agroforestry: a refuge for tropical biodiversity? Trends Ecol. Evol. 2008, 23, 261–267. [Google Scholar] [CrossRef]
- Tscharntke, T.; Clough, Y.; Bhagwat, S.A.; Buchori, D.; Faust, H.; Hertel, D.; Holscher, D.; Juhrbandt, J.; Kessler, M.; Perfecto, I.; Scherber, C.; Schroth, G.; Veldkamp, E.; Wanger, T.C. Multifunctional shade-tree management in tropical agroforestry landscapes- a review. J. Appl. Ecol. 2011, 48, 619–629. [Google Scholar] [CrossRef]
- Clough, Y.; Barkmann, J.; Juhrbandt, J.; Kessler, M.; Wanger, T.C.; Anshary, A.; Buchori, D.; Cicuzza, D.; Darras, K.; Putra, D.D.; et al. Combining high biodiversity with high yields in tropical agroforests. Proc. Natl. Acad. Sci. USA 2011, 108, 8311–8316. [Google Scholar]
- Wanger, T.C.; Rauf, A.; Schwarze, S. Pesticides and tropical biodiversity. Front. Ecol. Environ. 2010, 8, 178–179. [Google Scholar]
- Philpott, S.M.; Armbrecht, I. Biodiversity in tropical agroforests and the ecological role of ants and ant diversity in predatory function. Ecol. Entomol. 2006, 31, 369–377. [Google Scholar] [CrossRef]
- Bos, M.M.; Steffan-Dewenter, I.; Tscharntke, T. The contribution of cacao agroforests to the conservation of lower canopy ant and beetle diversity in Indonesia. Biodivers. Conserv. 2007, 16, 2429–2444. [Google Scholar] [CrossRef]
- Wielgoss, A.; Tscharntke, T.; Buchori, D.; Fiala, B.; Clough, Y. Temperature and a dominant dolichoderine ant species affect ant diversity in Indonesian cacao plantations. Agric. Ecosyst. Environ. 2010, 135, 253–259. [Google Scholar] [CrossRef]
- Bestelmeyer, B.T.; Agosti, D.; Alonso, L.E.; Brandão, C.R.F.; Brown, W.L., Jr.; Delabie, J.H.C.; Silvestre, R. Field techniques for the study of ground-dwelling ants: an overview, description, and evaluation. In Ants: Standard Methods for Measuring and Monitoring Biodiversity; Agosti, D., Majer, J.D., Alonso, L.E., Schultz, T.R., Eds.; Smithsonian Institution Press: Washington, DC, USA, 2000; pp. 122–144. [Google Scholar]
- Bolton, B. Identification Guide to the Ant Genera of the World; Harvard University Press: Cambridge, UK, 1994; p. 222. [Google Scholar]
- Lattke, J.E. Specimen processing: building and curating an ant collection. In Ants: Standard Methods for Measuring and Monitoring Biodiversity; Agosti, D., Majer, J.D., Alonso, L.E., Schultz, T.R., Eds.; Smithsonian Institution Press: Washington, DC, USA, 2000; pp. 155–171. [Google Scholar]
- Antweb. Available online: http://www.antweb.org (accessed on 20 January 2010).
- Colwell, R.K.; Coddington, J.A. Estimating terrestrial biodiversity through extrapolation. Philos. Trans. R. Soc. Lond. Ser. B 1994, 345, 101–118. [Google Scholar] [CrossRef]
- Mantel, N. The detection of disease clustering and a generalized regression approach. Cancer Res. 1967, 27, 209–220. [Google Scholar]
- Legendre, P.; Legendre, L. Numerical ecology, 2nd English ed; Elsevier: Dordrecht, The Netherlands, 1998. [Google Scholar]
- Gering, J.C.; Crist, T.O. The alpha-beta-regional relationship: providing new insights into local-regional patterns of species richness and scale dependence of diversity components. Ecol. Lett. 2002, 5, 433–444. [Google Scholar] [CrossRef]
- R Development Core Team, R: A Language and Environment for Statistical Computing; R Foundation for Statistical Computing: Vienna, Austria, 2011.
- Delsinne, T.; Roisin, Y.; Herbauts, J.; Leponce, M. Ant diversity along a wide rainfall gradient in the Paraguayan dry Chaco. J. Arid Environ. 2010, 74, 1149–1155. [Google Scholar] [CrossRef]
- Dunn, R.R.; Agosti, D.; Andersen, A.N.; Arnan, X.; Bruhl, C.A.; Cerdá, X.; Ellison, A.M.; Fisher, B.L.; Fitzpatrick, M.C.; Gibb, H.; et al. Climatic drivers of hemispheric asymmetry in global patterns of ant species richness. Ecol. Lett. 2009, 12, 324–333. [Google Scholar] [CrossRef]
- Dunn, R.R.; Guenard, B.; Weiser, M.D.; Sanders, N.J. Geographic gradients. In Ant Ecology; Lach, L., Parr, C.L., Abbott, K.L., Eds.; Oxford University Press: New York, NY, USA, 2010; pp. 38–58. [Google Scholar]
- Andersen, A.N. Global ecology of rainforest ants: functional groups in relation to environmental stress and disturbance. In Ants: Standard Methods for Measuring and Monitoring Biodiversity; Agosti, D., Majer, J.D., Alonso, L.E., Schultz, T.R., Eds.; Smithsonian Institution Press: Washington, DC, USA, 2000; pp. 25–34. [Google Scholar]
- Andersen, A.N. A classification of Australian ant communities, based on functional groups which parallel plant life-forms in relation to stress and disturbance. J. Biogeogr. 1995, 22, 15–29. [Google Scholar] [CrossRef]
- MacArthur, R.; Levins, R. The limiting similarity, convergence, and divergence of coexisting species. Am. Nat. 1967, 101, 377–385. [Google Scholar]
- Brown, W.L., Jr. Diversity of ants. In Ants: Standard Methods for Measuring and Monitoring Biodiversity; Agosti, D., Majer, J.D., Alonso, L.E., Schultz, T.R., Eds.; Smithsonian Institution Press: Washington, DC, USA, 2000; pp. 45–79. [Google Scholar]
- Gerold, G.; Leemhuis, C. Effects of “ENSO-events” and rainforest conversion on river discharge in Central Sulawesi (Indonesia). In Tropical Rainforests and Agroforests under Global Change: Ecological and Socio-economic Valuations; Tscharntke, T., Leuschner, C., Veldkamp, E., Faust, H., Guhardja, E., Bidin, A., Eds.; Springer-Verlag: Berlin, 2010; pp. 327–350. [Google Scholar]
- McGlynn, T.P. The worldwide transfer of ants: geographical distribution and ecological invasions. J. Biogeogr. 1999, 26, 535–548. [Google Scholar] [CrossRef]
Supplementary Material
| No | Species | Village | |||||||||||||||
|---|---|---|---|---|---|---|---|---|---|---|---|---|---|---|---|---|---|
| 1 | 2 | 3 | 4 | 5 | 6 | 7 | 8 | ||||||||||
| A | B | A | B | A | B | A | B | A | B | A | B | A | B | A | B | ||
| Dolichoderinae | |||||||||||||||||
| 1. | Dolichoderus sp.01 | 0.5 | 0.4 | 0.5 | 0.2 | 0.7 | 0.9 | 0.2 | 0.5 | 0.2 | 0.1 | 0.2 | |||||
| 2. | Dolichoderus thoracicus | 1 | 1 | ||||||||||||||
| 3. | Philidris cordata | 0.7 | 1 | 1 | 1 | 1 | 0.7 | 1 | 0.9 | 1 | 1 | 1 | |||||
| 4. | Tapinoma melanocephalum | 0.2 | 0.7 | 0.3 | 0.3 | 0.9 | 1 | 0.2 | |||||||||
| 5. | Tapinoma sp.01 | 0.4 | 1 | 0.2 | 0.7 | 0.9 | 0.1 | 0.7 | 0.8 | 0.7 | 0.2 | ||||||
| 6. | Technomyrmex albipes | 0.3 | 1 | 0.9 | 0.2 | ||||||||||||
| 7. | Technomyrmex sp.01 | 0.3 | |||||||||||||||
| Formicinae | |||||||||||||||||
| 8. | Anoplolepis gracilipes | 0.1 | 0.5 | 1 | 0.8 | 0.3 | 0.5 | 0.4 | |||||||||
| 9. | Camponotus recticulatus | 0.4 | 0.9 | 0.2 | 0.7 | 0.1 | 0.1 | 0.3 | 0.6 | 0.1 | 0.5 | ||||||
| 10. | Camponotus sp.01 | 0.9 | 0.1 | 0.1 | 0.1 | 0.1 | 0.1 | 0.1 | 0.1 | 0.1 | |||||||
| 11. | Camponotus sp.02 | 0.1 | |||||||||||||||
| 12. | Echinopla lineata | 0.1 | 0.8 | 0.5 | |||||||||||||
| 13. | Oecophylla smaragdina | 0.1 | 0.2 | 0.1 | 1 | ||||||||||||
| 14. | Paratrechina longicornis | 1 | 0.4 | ||||||||||||||
| 15. | Nylanderia sp.01 | 1 | 0.9 | 1 | 1 | 1 | 0.6 | 1 | 0.8 | 1 | 0.8 | 1 | 1 | 1 | 0.9 | ||
| 16. | Nylanderia sp.02 | 1 | |||||||||||||||
| 17. | Nylanderia sp.03 | 0.7 | |||||||||||||||
| 18. | Nylanderia sp.04 | 0.1 | 0.8 | 0.3 | 1 | ||||||||||||
| 19. | Plagiolepis sp.01 | 0.9 | |||||||||||||||
| 20. | Polyrachis abdominalis | 0.3 | 0.2 | ||||||||||||||
| 21. | Polyrachis dives | 0.7 | 0.5 | 0.3 | 0.2 | 0.2 | 0.1 | ||||||||||
| 22. | Polyrachis sp.01 | 0.3 | 0.4 | ||||||||||||||
| 23. | Polyrachis sp.02 | 0.5 | 0.4 | ||||||||||||||
| 24. | Polyrachis sp.03 | 0.1 | |||||||||||||||
| 25. | Polyrachis sp.04 | 0.2 | |||||||||||||||
| 26. | Polyrachis sp.05 | 0.8 | |||||||||||||||
| 27. | Polyrachis sp.06 | 0.1 | 0.2 | 0.1 | |||||||||||||
| 28. | Polyrachis sp.07 | 0.4 | |||||||||||||||
| 29. | Pseudolasius sp.01 | 0.2 | 0.3 | 0.1 | |||||||||||||
| 30. | Pseudolasius sp.02 | 0.3 | |||||||||||||||
| Myrmicinae | |||||||||||||||||
| 31. | Crematogaster sp.01 | 0.6 | 0.1 | 0.7 | 0.6 | ||||||||||||
| 32. | Crematogaster sp.02 | 0.6 | 0.1 | 0.1 | 0.2 | 0.2 | 0.6 | 0.1 | 0.1 | 0.7 | 0.3 | 0.2 | 0.8 | 0.2 | 0.6 | ||
| 33. | Crematogaster sp.03 | 0.2 | |||||||||||||||
| 34. | Crematogaster sp.04 | 0.2 | 0.9 | 0.8 | |||||||||||||
| 35. | Crematogaster sp.05 | 0.3 | 0.1 | ||||||||||||||
| 36. | Monomorium floricola | 0.7 | 0.7 | 1 | 0.3 | 1 | 0.3 | 0.2 | 0.1 | ||||||||
| 37. | Monomorium sp.01 | 0.2 | 0.1 | 0.2 | |||||||||||||
| 38. | Monomorium sp.02 | 0.4 | 0.1 | 0.3 | |||||||||||||
| 39. | Monomorium sp.03 | 0.2 | |||||||||||||||
| 40. | Monomorium sp.04 | 0.1 | 0.1 | ||||||||||||||
| 41. | Monomorium sp.05 | 0.1 | 0.2 | ||||||||||||||
| 42. | Monomorium sp.06 | 0.1 | 0.1 | ||||||||||||||
| 43. | Pheidole sp.01 | 0.3 | 0.7 | 0.1 | 0.3 | 0.3 | 0.3 | 0.7 | 0.7 | 0.7 | 0.6 | 0.3 | 0.5 | 0.2 | |||
| 44. | Pheidole sp.02 | 0.9 | 0.1 | 0.1 | 0.1 | 0.1 | 0.6 | 0.4 | 0.1 | ||||||||
| 45. | Pheidole sp.03 | 0.4 | 0.9 | 0.7 | 0.7 | 0.5 | 0.1 | 0.4 | 0.1 | 0.3 | 0.1 | ||||||
| 46. | Pheidole sp.04 | 0.1 | |||||||||||||||
| 47. | Pheidole sp.05 | 0.5 | 0.1 | 0.6 | |||||||||||||
| 48. | Pheidole sp.06 | 0.1 | 0.4 | 0.1 | 0.1 | 0.2 | 0.2 | 0.2 | |||||||||
| 49. | Pheidole sp.07 | 0.1 | |||||||||||||||
| 50. | Pheidole sp.08 | 0.1 | 0.1 | ||||||||||||||
| 51. | Pheidologeton sp.01 | 0.1 | |||||||||||||||
| 52. | Pyramica paradoxa | 0.1 | |||||||||||||||
| 53. | Solenopsis geminata | 0.4 | |||||||||||||||
| 54. | Strumigenys sp.01 | 0.1 | 0.1 | 0.1 | 0.1 | ||||||||||||
| 55. | Tetramorium bicarinatum | 0.9 | 0.1 | 0.4 | |||||||||||||
| 56. | Tetramorium pasificum | 0.2 | 0.9 | 0.5 | 0.3 | ||||||||||||
| 57. | Tetramorium smithi | 0.4 | 0.3 | 0.1 | 0.1 | 0.1 | 0.1 | ||||||||||
| 58. | Tetramorium sp.01 | 0.5 | |||||||||||||||
| 59. | Tetramorium sp.02 | 0.2 | 0.2 | ||||||||||||||
| 60. | Tetramorium sp.03 | 0.2 | 0.3 | ||||||||||||||
| 61. | Tetramorium sp.04 | 0.4 | 0.1 | 0.1 | |||||||||||||
| 62. | Tetramorium sp.05 | 0.1 | 0.1 | 0.3 | 0.1 | 0.1 | 0.1 | 0.1 | |||||||||
| 63. | Tetramorium sp.06 | 0.3 | 0.4 | 0.1 | |||||||||||||
| 64. | Tetramorium sp.07 | 0.3 | |||||||||||||||
| 65. | Tetramorium sp.08 | 0.2 | 0.1 | ||||||||||||||
| Ponerinae | |||||||||||||||||
| 66. | Anochetus graeffei | 0.3 | 0.3 | 0.4 | 0.2 | 0.3 | 0.2 | ||||||||||
| 67. | Diacamma rugosum | 0.4 | 0.1 | 0.6 | 0.9 | ||||||||||||
| 68. | Hypoponera sp.01 | 0.2 | 0.1 | 0.1 | 0.2 | 0.1 | 0.2 | ||||||||||
| 69. | Hypoponera sp.02 | 0.8 | 0.9 | 0.3 | 0.1 | 0.6 | 0.8 | 0.9 | 0.5 | 0.7 | 0.3 | ||||||
| 70. | Hypoponera sp.03 | 0.1 | 0.4 | 0.2 | |||||||||||||
| 71. | Hypoponera sp.04 | 0.2 | 1 | ||||||||||||||
| 72. | Leptogenys sp.01 | 0.1 | 0.2 | 0.1 | 0.3 | ||||||||||||
| 73. | Odontomachus simillimus | 0.2 | 0.5 | 0.7 | 0.7 | 1 | 0.1 | 0.4 | 0.3 | 0.7 | 0.3 | 1 | 0.9 | 1 | 0.2 | ||
| 74. | Pachycondyla sp.01 | 0.4 | 0.1 | 0.2 | 0.2 | 0.1 | 0.2 | 0.4 | |||||||||
| 75. | Pachycondyla sp.02 | 0.1 | |||||||||||||||
| 76. | Pachycondyla sp.03 | 0.2 | |||||||||||||||
| 77. | Pachycondyla sp.04 | 0.1 | |||||||||||||||
| 78. | Platythyrea sp.01 | 0.1 | 0.1 | 0.1 | 0.2 | 0.1 | 0.1 | ||||||||||
| Pseudomyrmicinae | |||||||||||||||||
| 79. | Tetraponera sp.01 | 0.1 | |||||||||||||||
| 80. | Tetraponera sp.02 | 0.2 | 0.1 | ||||||||||||||
© 2013 by the authors; licensee MDPI, Basel, Switzerland. This article is an open access article distributed under the terms and conditions of the Creative Commons Attribution license (http://creativecommons.org/licenses/by/3.0/).
Share and Cite
Rizali, A.; Clough, Y.; Buchori, D.; Tscharntke, T. Dissimilarity of Ant Communities Increases with Precipitation, but not Reduced Land-Use Intensity, in Indonesian Cacao Agroforestry. Diversity 2013, 5, 26-38. https://doi.org/10.3390/d5010026
Rizali A, Clough Y, Buchori D, Tscharntke T. Dissimilarity of Ant Communities Increases with Precipitation, but not Reduced Land-Use Intensity, in Indonesian Cacao Agroforestry. Diversity. 2013; 5(1):26-38. https://doi.org/10.3390/d5010026
Chicago/Turabian StyleRizali, Akhmad, Yann Clough, Damayanti Buchori, and Teja Tscharntke. 2013. "Dissimilarity of Ant Communities Increases with Precipitation, but not Reduced Land-Use Intensity, in Indonesian Cacao Agroforestry" Diversity 5, no. 1: 26-38. https://doi.org/10.3390/d5010026
APA StyleRizali, A., Clough, Y., Buchori, D., & Tscharntke, T. (2013). Dissimilarity of Ant Communities Increases with Precipitation, but not Reduced Land-Use Intensity, in Indonesian Cacao Agroforestry. Diversity, 5(1), 26-38. https://doi.org/10.3390/d5010026