Using DNA Barcoding and Standardized Sampling to Compare Geographic and Habitat Differentiation of Crustaceans: A Hawaiian Islands Example

Abstract
: Recently, the Census of Marine Life has explored methods to assess coral reef diversity by combining standardized sampling (to permit comparison across sites) with molecular techniques (to make rapid counts of species possible). To date, this approach has been applied across geographically broad scales (seven sites spanning the Indian, Pacific and Atlantic Oceans), focusing on similar habitats at all sites (10–12 m forereef). Here we examine crustacean spatial diversity patterns for a single atoll, comparing results for four sites (comprising forereef, backreef, and lagoon habitats) at French Frigate Shoals (FFS), Northwestern Hawaiian Islands, Hawaii, USA, within the Papahanaumokuakea Marine National Monument. The Bray-Curtis index of similarity across these habitats at FFS was the same or greater than the similarity between similar habitats on Heron Island and Lizard Island in the Great Barrier Reef and much greater than similarity between more widely separated localities in the Indo-Pacific Ocean (e.g., Ningaloo, Moorea, French Polynesia or the Line Islands). These results imply that, at least for shallow reefs, sampling multiple locations versus sampling multiple habitats within a site maximizes the rate at which we can converge on the best global estimate of coral reef biodiversity.1. Introduction
Corals reefs are well known as areas of exceptionally high biodiversity [1,2] and may contain one quarter of all of the diversity of the ocean [3]. For this reason, one of the 14 field projects of the Census of Marine Life focused on coral reefs. The Census of Coral Reef Ecosystems project (CReefs) began in 2005 and ran for five years. Clearly, a complete census of coral reef organisms was not feasible within this limited time span, and was never the goal of the project. Rather, CReefs strove to develop and ground-truth methods that could be used for such a census over a longer time frame.
Most studies aimed at understanding reef biodiversity patterns have used easy-to-census and well-known groups, such as fish and corals. However, most of the diversity of coral reefs consists of small cryptic species, and corals and fishes may not act as good surrogates for them [4]. CReefs chose to address three challenges that face any attempt to assess this understudied but large component of coral reef biodiversity. First, these organisms can be very difficult to sample, and often require destructive sampling for which permits can be difficult to obtain. Second, it has been difficult to compare studies because they are often based on non-quantitative sampling using different methods, involving different people with different skills. Third, it can be very difficult to identify small cryptic species, resulting in a situation where many years elapse between initial surveys and published results. To address these challenges, CReefs focused on two methodological approaches. The first was quantitative sampling, including the use of non-natural reef structures; these have proven surprisingly effective in collecting reef invertebrates compared to hand collecting [5] and provide a standardized approach with which to compare reef biodiversity across space and time. The second was the use of DNA barcoding [6], allowing species counts to be made without having to assign names.
Previous publications from the CReefs project reported on analyses of coral reef biodiversity at global or regional scales [7,8]. Yet many, perhaps most, reef species show clear preferences for particular zones across the reef profile based on factors such as wave energy, temperature, water chemistry and light. Although reef ecologists have long referred to habitat types within reefs—e.g., patch reef, back reef, reef flat, reef crest, and forereef or reef slope—modern assessments of biodiversity have rarely attempted to determine the extent to which these habitats differ with respect to species composition. Such information is critical for designing global assessments of coral reef biodiversity because one must decide the relative importance of sampling across geographic regions versus across habitats within locations.
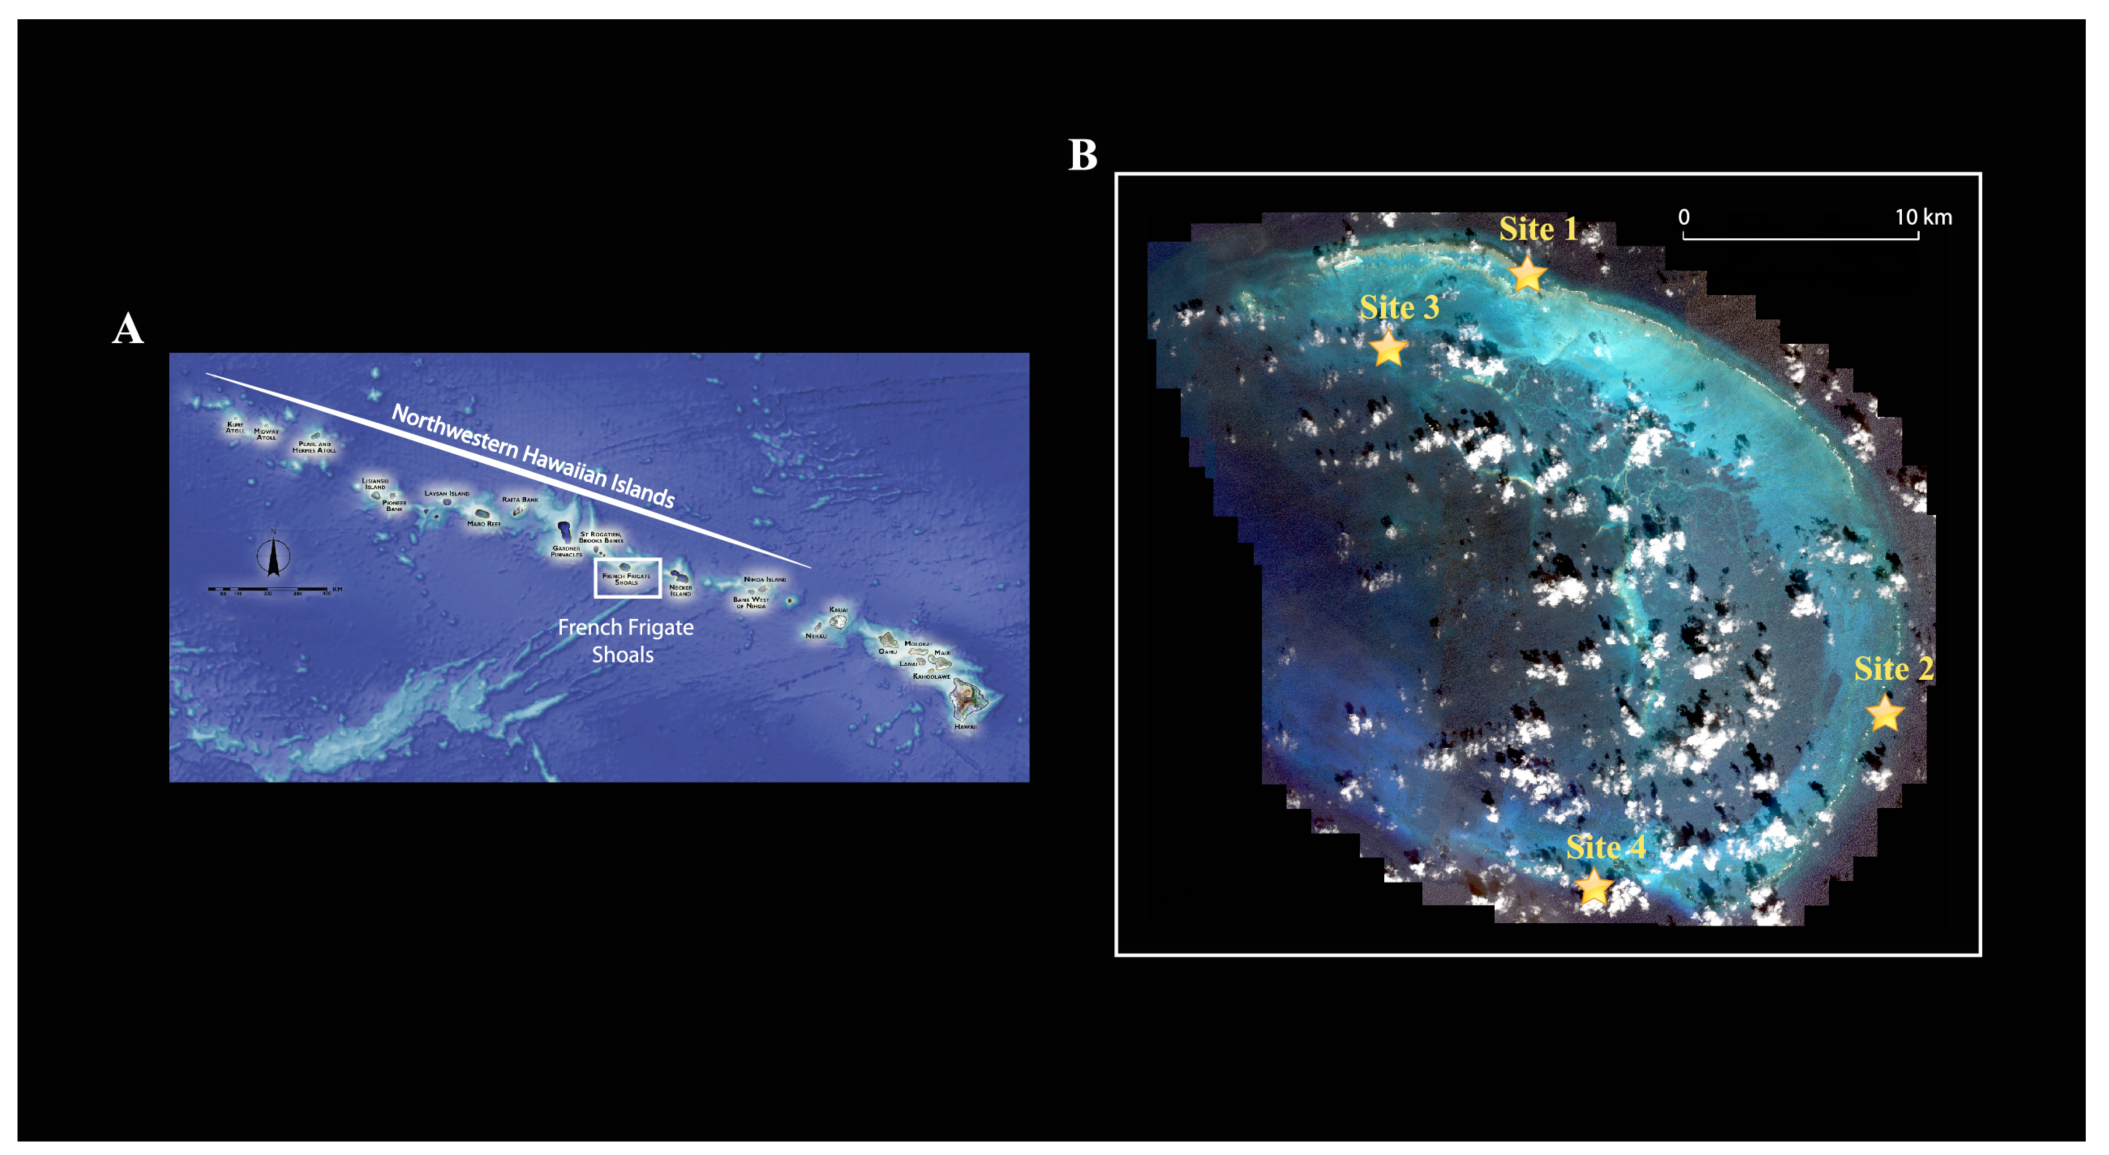
Because crustaceans represent a large part of the invertebrate fauna associated with coral reefs, are the second most diverse group of marine multicellular organisms [9] and are relatively easy to DNA barcode, we chose to focus on this group for this study. We compared the crustacean diversity from three distinct reef habitats (lagoonal patch reef, backreef and forereef) at French Frigate Shoals, an open-atoll reef system in the Northwestern Hawaiian Islands. French Frigate Shoals is the largest atoll in the Northwestern Hawaiian Islands (Figure 1A). It consists of a 32 km long crescent-shaped reef. The total land area of the islets is 248,910 m2 and the total coral reef area of the shoals is over 940 km2.
These islands have been protected since 1909 as part of the Hawaiian Islands National Wildlife Refuge (HINWR); in 2000 they were the subject of a Presidential proclamation that established the NWHI Coral Reef Ecosystem Reserve and were further protected in 2006 with the establishment of the NWHI Marine National Monument as one of the world's largest marine protected areas (MPAs). Because of these protections and their remoteness, the NWHI contain among the healthiest apex predator populations for coral reef ecosystems in the world [10,11]. They are, in addition, an area with a high degree of endemism [12].
We compare the data obtained in this study with data from Indo-Pacific coral reef locations collected using similar methods [8].
2. Materials and Methods
2.1. Selection of Sampling Sites
Four sampling sites were chosen: two forereef sites (reefs adjacent to the seaward edge of the reef crest, relatively exposed to wave energy; Site 1, 14 m depth and site 4, 12 m depth), one back reef site (protected reef located on the landward side of the reef crest; site 3, 1 m depth), and one lagoonal patch reef (protected reef in the lagoon isolated from other reef habitats by non-reef habitats; site 2, 7 m depth) (Figure 1B; Table 1). Here our purpose was to sample across habitats in order to enumerate the greatest possible number of species given some currently unknown spatial turnover of species among habitats (e.g., beta-diversity) and limited resources. Our purpose was not to provide estimates on species richness among sites within habitats.
2.2. Sampling Methods
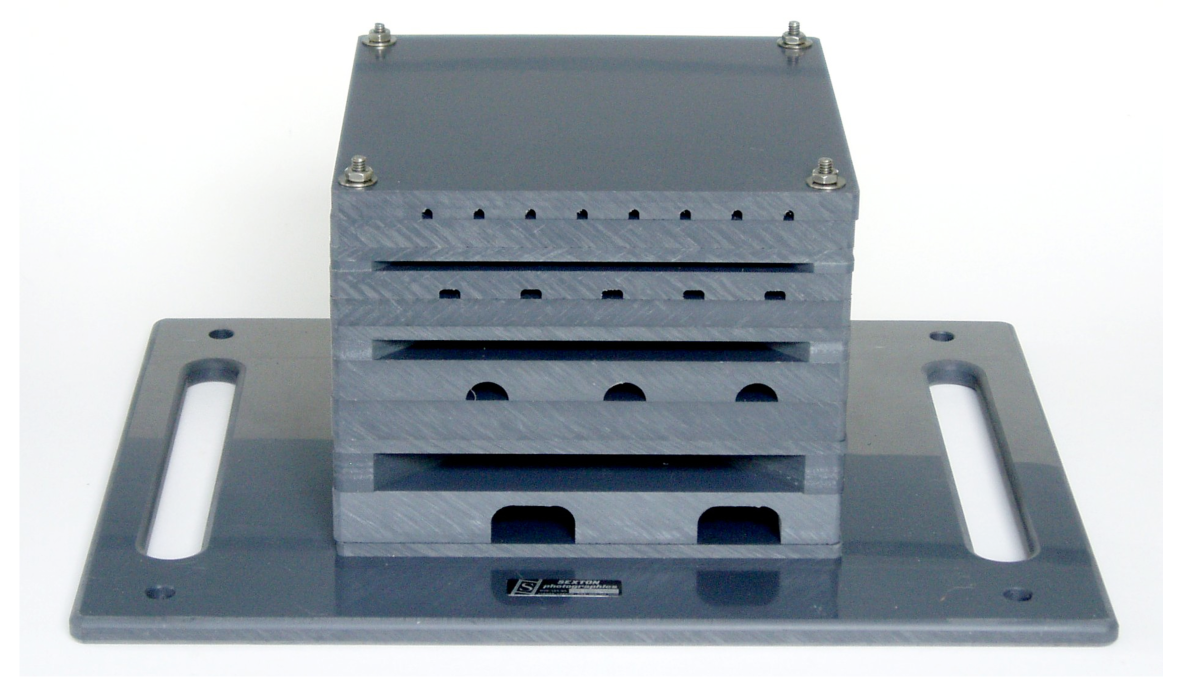
We used man-made Autonomous Reef Monitoring Structures (ARMS) to sample reef invertebrate diversity at French Frigate Shoals. The ARMS are small, long-term collecting devices designed to mimic, to some degree, the structural complexity of a coral reef, and they create minimal disturbance to the reef when they are installed and removed. For this reason, permits for their use are usually easier to obtain than for collecting from natural reef substrates, particularly where destructive sampling is involved.
The prototype ARMS used in this study consisted of stacked PVC layers with different sized and shaped openings that allow organisms to settle or shelter within the structure (Figure 2). Each of the ARMS were 35.5 cm × 45.7 cm × 20.3 cm. Layers (22.8 cm × 22.8 cm) include flat sandwich and layers with holes of varying sizes ranging from 1.9 cm to 0.5 cm height. The ARMS in this study were deployed in October 2006. Three ARMS, several meters apart, were deployed per site. As four different sites were investigated, the total number of ARMS was 12. The ARMS were retrieved the following year (September 2007).
During their retrieval, a cage lined with 100 μm mesh was placed around them and securely attached, to prevent organisms from escaping. On board the research vessel, the ARMS were disassembled in a tray, and each layer was scanned carefully in order to collect mobile invertebrates that had settled on them. Crustaceans down to ∼1–2 mm total length were easy to pick out; thus, for decapods, all but very small juveniles were reliably sampled using this method. However, small crustaceans in other groups (e.g., some peracarids) were probably not adequately sampled.
All crustaceans were sorted to morphospecies based on shape and color patterns. Each morphospecies was identified in the field to the lowest taxonomic rank possible, and abundances of each were recorded. One to three exemplars were photographed. All the crustaceans collected were then fixed in 95% ethanol for molecular analyses (all were sequenced). This same procedure was applied for each of the 12 ARMS sampled.
2.3. Molecular Analyses
All preserved samples were transported to the Smithsonian Institution for molecular processing. Tissue samples (most commonly a leg or a part of the side of the body for smaller crustaceans like amphipods or tanaids) were removed and prepared for Phenol/Chloroform DNA extraction using the AutoGeneprep 965 (Autogen), following the protocol for Animal DNA Extraction proposed by Autogen. DNA was eluted in a final volume of 200 μL of TE buffer.
The resulting DNA was used directly in polymerase chain reactions (PCR). A 658 base-pair (bp) fragment of the mitochondrial cytochrome oxidase subunit I gene (COI) was amplified using the primers LCO1490 and HCO2198 [13]. Ten μL PCR amplifications were performed with 1μL of DNA extract, 10 pM of each PCR primer, 1.5 mM MgC12, 1 μL of Bovine Serum Albumin, 1 M of each dNTP, and 1 μL of Taq Polymerase (Promega). The PCR conditions consisted of 3 min at 94 °C followed by 5 cycles of 40 s at 94 °C, 40 s at 45 °C, 60 s at 72 °C; followed by 35 cycles of 40 s at 94 °C, 40 s at 51 °C, 60 s at 72 °C; followed by 5 min at 72 °C.
PCR products were purified using ExoSAP-IT PCR clean-up kit (GE Healthcare). Automated sequencing was performed directly on purified PCR products using ABI BigDye terminator V3.1. Sequence reactions were purified using Millipore 96-well plates loaded with Sephadex G-50 and run on an ABI 3130x1 genetic analyzer (Applied Biosystems). Products were sequenced in both directions using LCO1490 and HCO2198. Sequences were assembled and edited using Sequencher v. 4.5 (Gene Codes, Ann Arbor, MI). The sequences were subsequently aligned using Geneious [14] and submitted to GenBank (accession numbers: JN679601-JN679842).
2.4. Statistical Analyses
In order to cluster the sequences into Operational Taxonomic Units (OTUs), nucleotide sequence divergences were calculated with MOTHUR [15]. A 5% dissimilarity threshold was chosen for species discrimination based on previous studies (see Plaisance et al. [7,8]). The furthest neighbor clustering algorithm was used for clustering sequences into OTUs, generating rarefaction curves, and calculating the species richness estimators ACE and Chao1 [16] for both the total crustacean fauna and for the decapods only. Chao1 and ACE are abundance-based nonparametric estimators of species richness that work by examining the number of species in a sample observed more than once (2 times or up to 10 times for Chao1 and ACE, respectively) relative to the number of species that are observed just once. The Bray Curtis index was selected for the pairwise comparison of sites, as it not only integrates the binary, presence/absence information, but also factors in abundance of species. This index provides a single value between 0 and 1, with higher values associated with greater similarity.
3. Results and Discussion
3.1. Number of OTUs
Overall, we sequenced 242 individuals from the backreef and lagoon sites and added 334 sequences from GenBank from the ARMS deployed on the two forereef sites that were part of the study by Plaisance et al. [8]. Using a 5% dissimilarity threshold for species delimitation, we identified 80 different OTUs (Supplementary Table). Most of the OTUs were brachyuran crabs (21 species), amphipods (18 species), true shrimps (14 species) and anomuran crabs (12 species). The remainders were tanaids (4 species), isopods (3 species), stomatopods (2 species) and five undetermined crustacean species. The identification of each crustacean to order or suborder was first done in the field and was later confirmed by comparing the COI sequence with the closest match in GenBank. As of 1 June 2011, seventeen of the eighty species had a match in GenBank with a sequence similarity higher than 95% (8 brachyurans, 7 anomurans, one caridean and one amphipod; this excludes matches to the sequences submitted by Plaisance et al. [8] that are part of this study). Therefore, if we accept that a similarity threshold of 95% corresponds to intraspecific variation [7,8], at least 10 species in our samples have been sequenced and have been previously described (Tweedieia laysani, Calcinus hazletti, Calcinus aff. latens, Calcinus laurentae 1, Calcinus laurentae 2, Ciliopagurus strigatus, Percnon abbreviatum, Chlorodiella laevissima, Xanthias latifrons, Pilodius flavus); the remaining seven have been previously sequenced but do not have an associated species name in GenBank (Metalpheus sp., Carupa sp., Dromiidae sp., Paguridae sp., Pagurixus sp., Xanthidae sp., Jassa sp.).
3.2. Distribution and Abundance of OTUs
Only six species out of 80 were present at all four stations investigated, and only seven species were present in all three habitats (lagoon, backreef, forereef). Those species found in more than one habitat were also among the most abundant (all but one were represented by more than 10 sequenced individuals with a sequence similarity higher than 95%). Overall, only 12 species were represented by more than 10 individuals (the most abundant species, a stomatopod, being represented by 56 individuals). Most of the species were rare; 23 (29%) were singletons (only one individual was recorded) and 33 (41%) were only represented by two to four individuals.
3.3. Comparisons of Habitats
The lowest number of species was observed on the lagoonal patch reef (23 species, four singletons) (Table 2). The remaining habitats had similar, higher total numbers of species (backreef: 38 species, nine singletons; forereef-site 1:36 species, eight singletons; forereef-site 4:40 species, two singletons). When the data are normalized to eliminate potential biases due to the different numbers of individuals collected for the four sites, by randomly taking 100 sequences 100 times, the rank order of diversity was backreef, the two forereef sites, and the lagoonal patch reef (34, 29, 32, and 21 species, respectively).
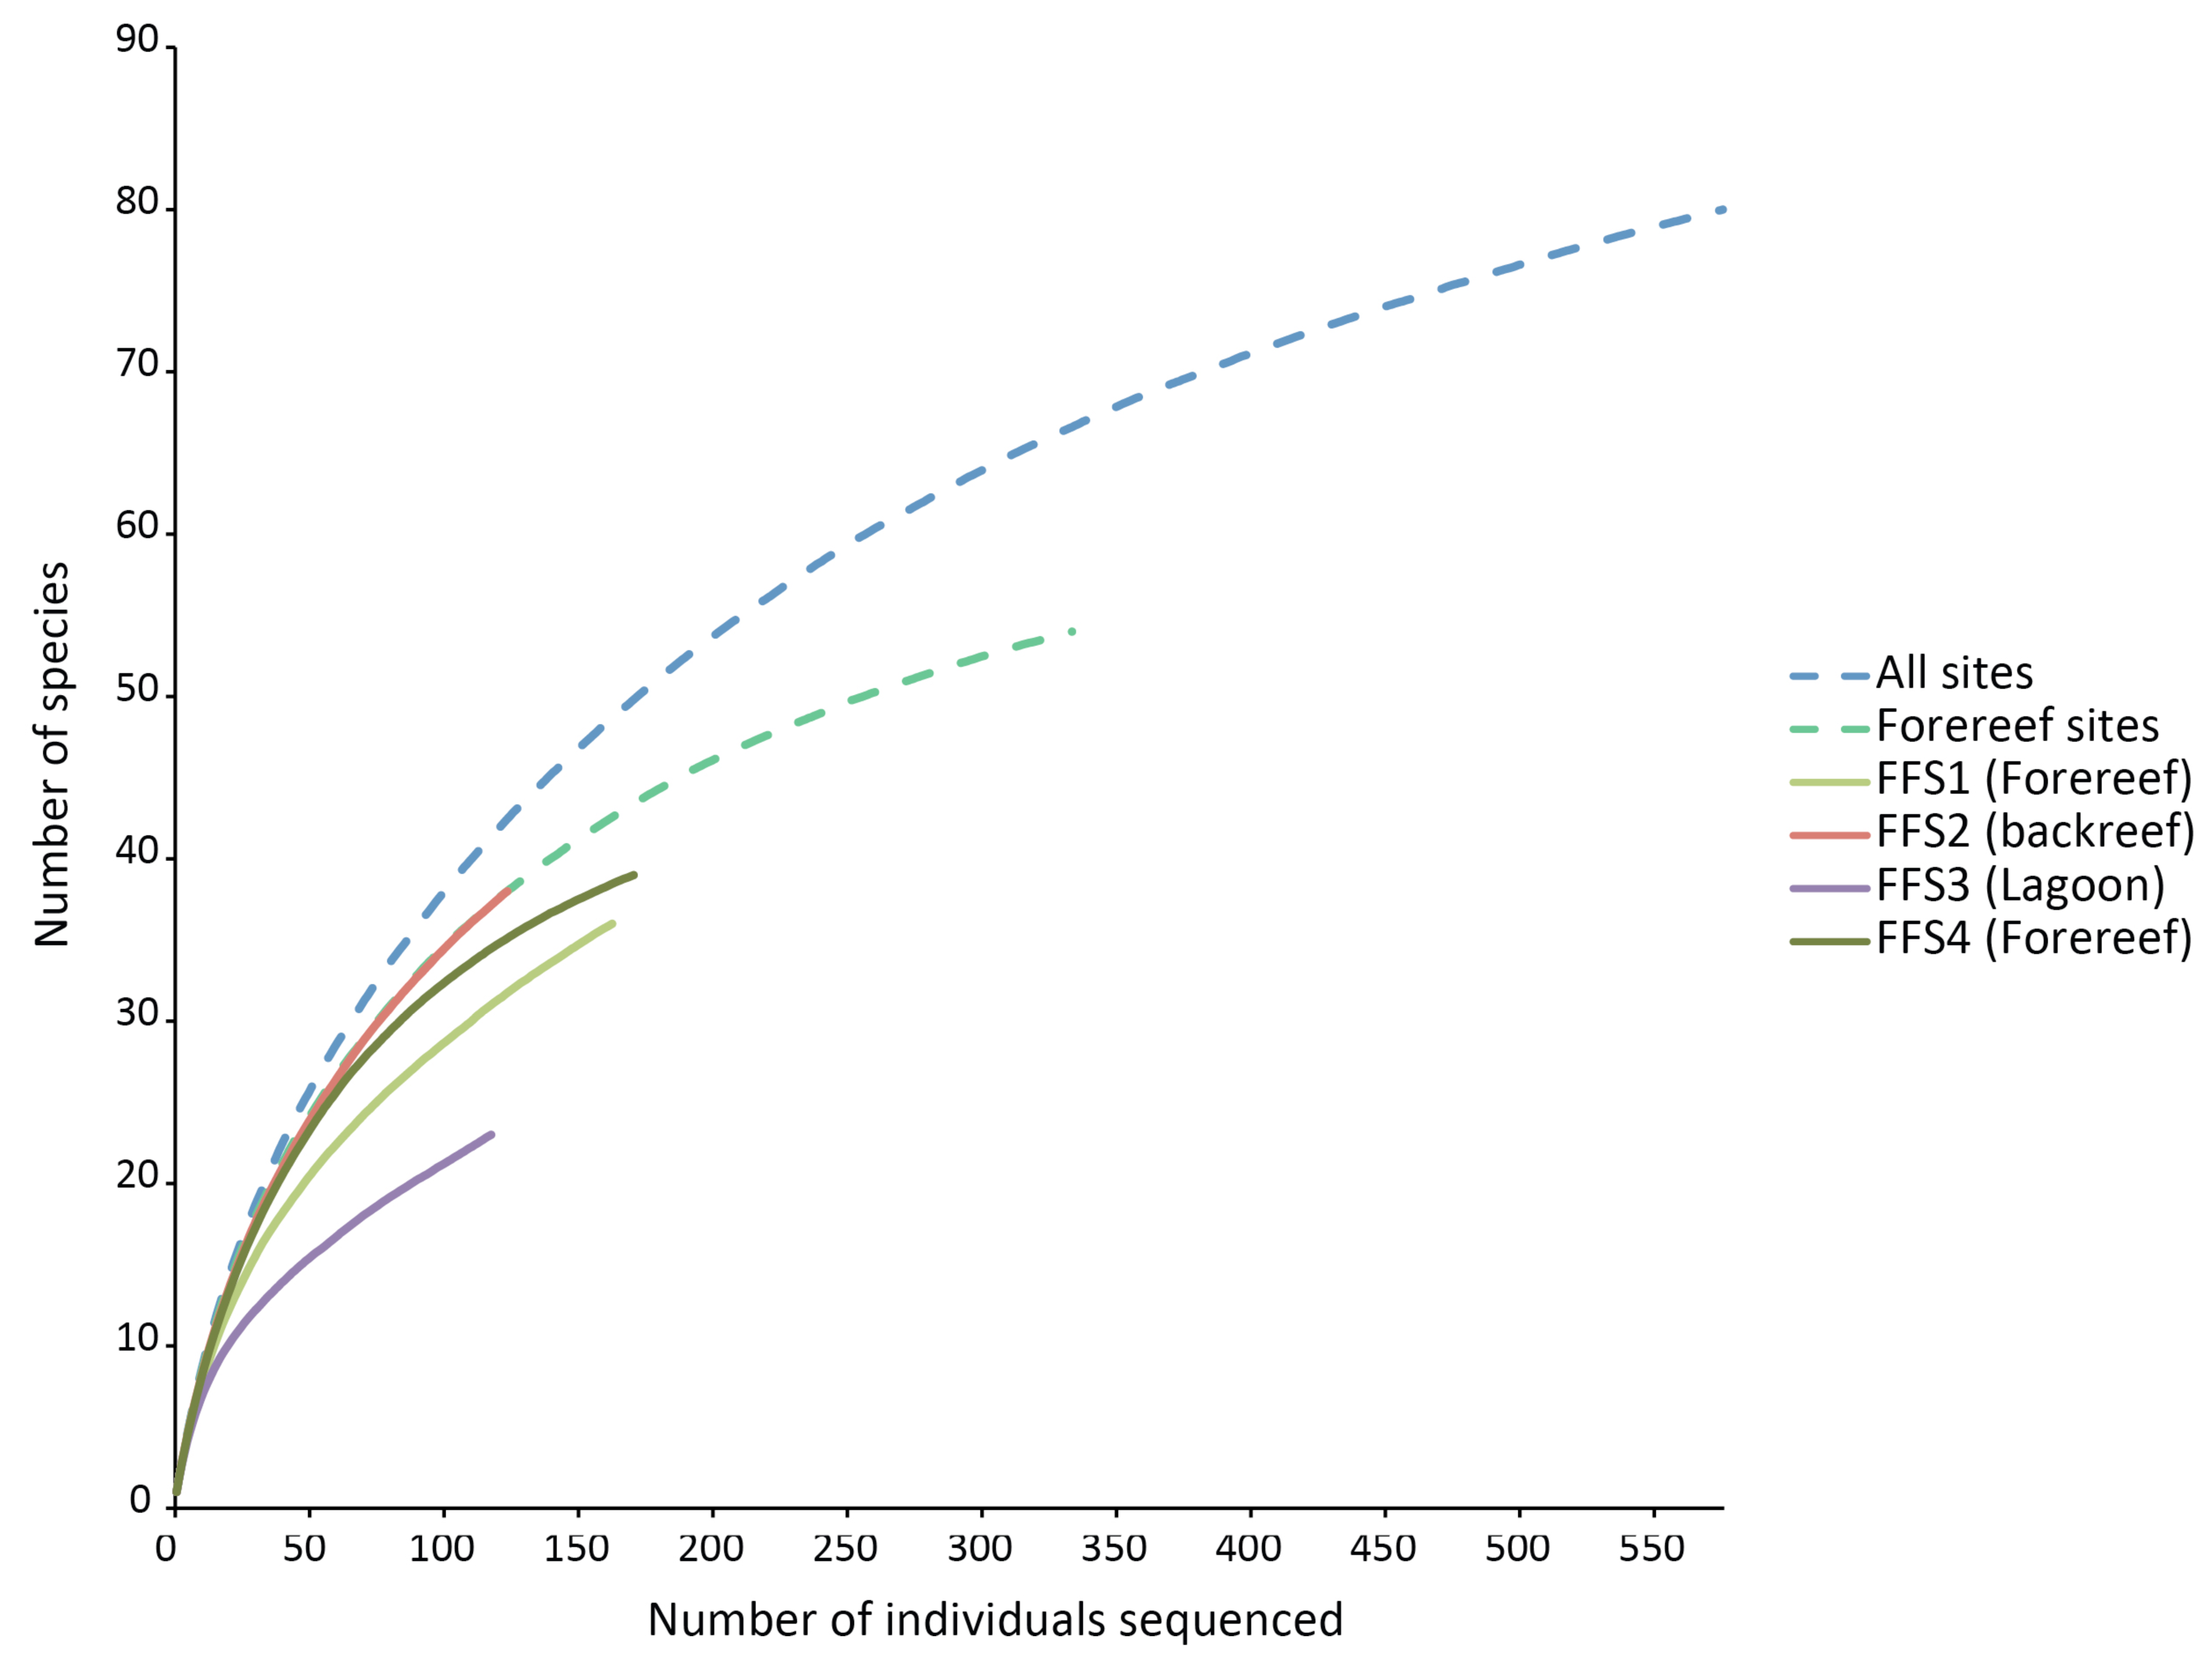
None of the species rarefaction curves (Figure 3) reached asymptotes, indicating that more sampling would be required to estimate reliably the total number of crustaceans likely to settle into ARMS in these habitats. Samples from backreef, forereef and lagoon habitats had the same shape of curve as that of all habitats combined and forereef combined stations. However, the lagoonal patch reef station had a much lower trajectory on the rarefaction curve and likely has substantially fewer species. Using two biodiversity estimators, Chao1 and ACE, on all four stations, about 100 species are predicted to be present on the ARMS, and patterns of projected diversity are similar to patterns of observed diversity (Table 2). However, those estimates are uncertain because much of the crustacean community likely to recruit into the ARMS remains to be sampled [17].
3.4. Similarity of Sites
The two forereef sites were the most similar to each other (Bray-Curtis index = 0.401), and the lowest similarity was between the backreef and the two forereef sites (BC = 0.237 and 0.292, respectively) (Table 3). Similarities between individual ARMS ranged from 0.076 and 0.532.
When compared to a previous study by Plaisance et al. [8] that examined forereef crustacean diversity among several locations in the Pacific (the Northern Line Islands; Moorea, French Polynesia; Heron and Lizard Island, Great Barrier Reef, Australia), the Indian Ocean (Ningaloo, Australia), and the Caribbean (Bocas del Toro, Panama) using similar methods, the similarities observed within the French Frigate Shoals sites (0.237–0.401) were generally higher than similarities observed between different locations (0.240 between Heron Island and Lizard Island; 0.118 between the Northern Line Islands and Moorea; <0.06 for all other comparisons (Table 3)). The French Frigate Shoals sites shared 17 of the 468 crustacean species reported from these other locations. The forereef sites in French Frigate Shoals (FFS1 and FFS4) shared more species with other Indo-Pacific forereef localities (8–4.9% and 9–5.3% respectively), than the backreef (5–4% shared species) or the lagoon (3–2.5% shared species).
3.5. Caveats and Comparisons with Other Studies
The ARMS have proven to be an effective way to quantitatively collect large numbers of crustaceans with relatively little effort, cost and disturbance to the reef. For example, in the case of the French Frigate Shoals samples, 12 ARMS (total area of only 0.6 m2) yielded 80 species, of which 21 were brachyuran crabs, 14 were caridean shrimp, and 12 were anomuran crabs; this represents about 7% (of 319 spp), 8% (of 184 spp) and 18% (of 65 spp) of the reported Hawaiian diversity for these three groups [18], respectively. Even the undoubtedly under-represented amphipods included 18 species, or 9% (of 200 spp) of the reported diversity. These numbers are surprisingly high given the small area sampled, and the steeply rising rarefaction curves (Figure 3) indicate that many more species would be detected with a modest increase in effort. Naturally, some groups will tend to be under-represented (e.g., coral associates); like any collection method, ARMS yield a biased sample of the true diversity and will miss many species. However, by systematically providing quantitative data, the ARMS allow for comparisons among different reef zones and locations.
Although we conclude that differences in biodiversity patterns are greater across large distances than across habitats within a location, we note that we did not study deep reefs, which could have quite different communities [19]. Additional deployments on deep reefs would allow determination of how distinctive deep reefs are from what will always be better-sampled shallow water habitats.
Moving forward, a variety of different protocols could be added to those employed here. For example, ARMS could provide quantitative samples of reef fauna for environmental DNA sequencing; this will allow for very small organisms from many groups difficult to collect using the approach described here to be assayed, thus increasing the data available for biodiversity estimates in coral reef habitats. Shorter or longer deployment times might also be preferable for some groups. The ability to compare samples based on different protocols would depend on the questions being asked.
Most important, however, is the need to scale up the number of samples. More than 650 ARMS have now been deployed worldwide in shallow (12–15 m) forereef coral habitats across biogeographic, oceanographic, and human impact gradients in the Pacific, Atlantic, and Indian Oceans [20]. This will allow scientists to address the most significant limitations for estimating the biodiversity of coral reefs, namely the sparseness of quantitative diversity data that can be compared across sites.
Our results agree with general diversity patterns shown by other reef organisms, in particular coral species at depths similar to those we sampled. Although variable, there is often a trend with respect to depth gradient and distance from the shore with diversity being lowest in shallow water near the shore and increasing to a maximum between 15 and 30 m depth (below 30 m, diversity typically decreases down the reef slope [21,22]). Conceivably, this zonation pattern of diversity of reef-building coral species, because of the physical change in reef structure it creates, could influences the diversity patterns of reef-associated organisms (e.g., echinoderms [23] and the patterns observed in the study). Other variables (e.g., extremes in temperature, runoff from land) may also contribute to the lower diversity observed in lagoons. However, our results do not show strong differences in the diversity patterns between the shallow backreef and the mid-depth forereef, and the rarefaction curves of the backreef and the combined forereef sites perfectly overlap (Figure 3).
The Bray-Curtis index of similarity (Table 3) was greatest between the two forereef sites (0.401) and lowest between the forereef sites and the backreef site (0.237 and 0.292). The high similarity between lagoon and backreef (0.355) has also been shown for cryptic reef fishes [24]. Even though the forereef sites were the most similar, they were geographically the most distant, supporting the contention that species composition is more tightly linked to habitat type than to distance between sites within a location. This primacy of habitat over distance is also illustrated on a regional scale with greater similarities between the forereef sites of French Frigate Shoals and other forereef sites from Indo-Pacific Ocean locations [8].
4. Conclusions
For the habitats and locations studied, the similarity among habitats at a single location is greater than the similarity among locations for a single habitat type, suggesting that given scarce resources, greater priority should be given to sampling locations than habitats when attempting to estimate the global diversity of shallow coral reefs. The failure of rarefaction curves to level off for any site or habitat suggests that much greater sampling effort is needed at each site, in addition to the need for more locations to be sampled.
Supplementary Material
diversity-03-00581-s001.doc

| Habitat | Deployment date | Retrieval date | Depth | Latitude | Longitude | |
|---|---|---|---|---|---|---|
| Site 1 | Forereef | 2006/10/19 | 2007/09/25 | 14.0 m | 23.704 | −166.060 |
| Site 2 | Backreef | 2006/10/22 | 2007/09/19 | 1.0 m | 23.867 | −166.214 |
| Site 3 | Lagoon Patch Reef | 2006/10/25 | 2007/09/22 | 7.0 m | 23.836 | −166.266 |
| Site 4 | Forereef | 2006/10/25 | 2007/09/30 | 13.0 m | 23.638 | −166.180 |
| Site 1 | Site 2 | Site 3 | Site 4 | Site 1&4 | All sites | |
|---|---|---|---|---|---|---|
| Habitat | ||||||
| Forereef | Backreef | Lagoon | Forereef | Forereef | All | |
| # sequences | 163 | 124 | 118 | 171 | 334 | 576 |
| # OTUs | 36 | 38 | 23 | 40 | 54 | 80 |
| # singletons | 8 | 9 | 4 | 2 | 10 | 23 |
| # OTUs (normalized for 100 sequences) | 29 | 34 | 21 | 32 | 34 | 38 |
| ACE | 79 | 63 | 61 | 47 | 67 | 99 |
| Chao1 | 81 | 63 | 37 | 46 | 64 | 96 |
| FFS1 (Forereef) | FFS2 (Backreef) | FFS3 (Lagoon) | FFS4 (Forereef) | Ningaloo | Lizard Is. | Heron Is. | Moorea | Line Is. | |
|---|---|---|---|---|---|---|---|---|---|
| FFS1 | 12 | 11 | 22 | 3 | 0 | 1 | 4 | 2 | |
| FFS2 | 0.244 | 10 | 15 | 0 | 0 | 2 | 3 | 3 | |
| FFS3 | 0.377 | 0.355 | 13 | 3 | 0 | 0 | 1 | 0 | |
| FFS4 | 0.401 | 0.292 | 0.374 | 5 | 1 | 0 | 3 | 4 | |
| Ningaloo | 0.015 | 0 | 0.011 | 0.048 | 16 | 20 | 7 | 8 | |
| Lizard Is. | 0 | 0 | 0 | 0.01 | 0.042 | 45 | 5 | 4 | |
| Heron Is. | 0.003 | 0.003 | 0 | 0 | 0.053 | 0.24 | 6 | 3 | |
| Moorea | 0.024 | 0.031 | 0.011 | 0.028 | 0.021 | 0.041 | 0.022 | 11 | |
| Line Is. | 0.011 | 0.025 | 0 | 0.037 | 0.016 | 0.019 | 0.004 | 0.118 |
Acknowledgments
We thank Amy Hall, Megan Moews, Russell Moffitt, Molly Timmers, Scott Godwin, and Leslie Harris for their assistance in the field, the numerous helpers that have participated in the CReefs field trips to French Frigate Shoals, as well as Marc Denis and Audrey Plaisance. We are grateful to Amy Driskell, Genelle Harrison, Andrea Ormos and Lee Weigt for their assistance with DNA barcoding. We greatly appreciate the financial support by the Alfred P. Sloan Foundation and BHP Billiton of the Census of Marine Life CReefs project.
References
- Paulay, G. Diversity and distribution of reef organisms. In Life and Death of Coral Reefs; Birkeland, C., Ed.; Chapman & Hall: New York, NY, USA, 1997; pp. 298–353. [Google Scholar]
- Reaka-Kudla, M. The global biodiversity of coral reefs: A comparison with rain forests. In Biodiversity II: Understanding and Protecting our Biological Resources; Reaka-Kudla, M., Wilson, D.E., Wilson, E.O., Eds.; Joseph Henry Press: Washington, DC, USA, 1997; pp. 83–108. [Google Scholar]
- Knowlton, N.; Brainard, R.E.; Fisher, R.; Moews, M.; Plaisance, L.; Caley, M.J. Coral reef biodiversity. In Life in the World's Oceans: Diversity, Distribution, and Abundance; McIntyre, A.D., Ed.; Blackwell Publishing Ltd.: Oxford, UK, 2010; pp. 65–77. [Google Scholar]
- Mellin, C.; Delean, S.; Caley, J.; Edgar, G.; Meekan, M.; Pitcher, R.; Przeslawski, R.; Williams, A.; Bradshaw, C. The effectiveness of biological surrogates for predicting marine biodiversity: A global meta-analysis. PLoS One 2011, 6, e20141. [Google Scholar]
- Zimmerman, T.L.; Martin, J.W. Artificial Reef Matrix Structures (ARMS): An inexpensive and effective method for collecting coral reef-associated invertebrates. Gulf Caribb. Res. 2004, 16, 59–64. [Google Scholar]
- Herbert, P.D.N.; Cywinska, A.; Ball, S.L.; de Waard, J.R. Biological identification through DNA barcodes. Proc. R. Soc. Lond. B 2003, 270, 313–321. [Google Scholar]
- Plaisance, L.; Knowlton, N.; Paulay, G.; Meyer, C. Reef-associated crustacean fauna: Biodiversity estimates using semi-quantitative sampling and DNA barcoding. Coral Reefs 2009, 28, 977–986. [Google Scholar]
- Plaisance, L.; Caley, J.; Brainard, R.; Knowlton, N. The diversity of coral reefs: What are we missing? PLoS One 2011. (in press). [Google Scholar]
- Bouchet, P. The magnitude of marine biodiversity. In The Exploration of Marine Biodiversity: Scientific and Technological Challenges; Duarte, C.M., Ed.; Fundación BBVA: Bilbao, Spain, 2006; pp. 31–64. [Google Scholar]
- Friedlander, A.M.; DeMartini, E.E. Contrasts in density, size, and biomass of reef fishes between the Northwestern and the main Hawaiian Islands: The effects of fishing down apex predators; Mar. Ecol. Prog. Series; 2002; Volume 230, pp. 253–264. [Google Scholar]
- Williams, I.D.; Richards, B.L.; Sandin, S.A.; Baum, J.K.; Schroeder, R.E.; Nadon, M.O.; Zgliczynski, B.; Craig, P.; McIlwain, J.L.; Brainard, R.E. Differences in reef fish assemblages between populated and remote reefs spanning multiple archipelagos across the central and western pacific. J. Mar. Biol. 2011, 2011. [Google Scholar] [CrossRef]
- DeMartini, E.E.; Friedlander, A.M. Spatial patterns of endemism in shallow reef fish populations of the Northwestern Hawaiian Islands; Mar. Ecol. Prog. Series; 2004; Volume 297, pp. 281–296. [Google Scholar]
- Folmer, O.; Black, M.; Hoeh, W.; Lutz, R.; Vrijenhoek, R. DNA primers for amplification of mitochondrial cytochrome c oxidase subunit I from diverse metazoan invertebrates. Mol. Mar. Biol. Biotechnol. 1994, 3, 294–297. [Google Scholar]
- Drummond, A.J.; Ashton, B.; Buxton, S.; Cheung, M.; Cooper, A.; Duran, C.; Field, M.; Heled, J.; Kearse, M.; Markowitz, S.; et al. Geneious v5.3. Biomatters Ltd: Auckland, New Zealand, 2010. Available online: http://www.geneious.com (accessed on 10 June 2011).
- Schloss, P.D.; Westcott, S.L. Introducing mothur: A computational toolbox for describing and comparing microbial communities; The University of Michigan: Ann Arbor, MI, USA, 2009. Available online: http://www.mothur.org/ (accessed on 10 June 2011).
- Hortal, J.; Borges, P.A.V.; Gaspar, C. Evaluating the performance of species richness estimators: Sensitivity to sample grain size. J. Anim. Ecol. 2006, 75, 274–287. [Google Scholar]
- Bebber, D.P.; Marriott, F.H.C.; Gaston, K.J.; Harris, S.A.; Scotland, R.W. Predicting unknown species numbers using discovery curves. Proc. R. Soc. B 2007, 274, 1651–1658. [Google Scholar]
- Marine Invertebrates of the Hawaiian Islands—Summary Statistics for Major Taxa; Bishop Museum: Honolulu, HI, USA, 2011. 2011; Available online: http://www2.bishopmuseum.org/HBS/invert/taxa_summary.htm (accessed on 12 August 2011).
- Hinderstein, L.M.; Marr, J.C.A.; Martinez, F.A.; Dowgiallo, M.J.; Puglise, K.A.; Pyle, R.L.; Zawada, D.G.; Appeldoorn, R. Theme section on Mesophotic Coral Ecosystems: Characterization, ecology, and management. Coral Reefs 2010, 29, 247–251. [Google Scholar]
- Autonomous Reef Monitoring Structures (ARMS); CReefs, NOAA Fisheries Coral Reef Ecosystem Division: Honolulu, HI, USA, 2011. Available online: http://www.creefs.org/research_arms.html (accessed on 10 June 2011).
- Cornell, H.V.; Karlson, R.H. Coral species richness: Ecological versus biogeographical influences. Coral Reefs 2000, 19, 37–49. [Google Scholar]
- Huston, M.A. Patterns of species diversity on coral reefs. Annu. Rev. Ecol. Syst. 1985, 16, 159–177. [Google Scholar]
- Adjeroud, M.; Salvat, B. Spatial patterns in biodiversity of a fringing reef community along Opunohu Bay, Moorea, French Polynesia. Bull. Mar. Sci. 1996, 59, 175–187. [Google Scholar]
- Smith-Vaniz, W.F.; Jelks, H.L.; Rocha, L.A. Relevance of cryptic fishes in biodiversity assessments: A case study at Buck Island Reef National Monument, St. Croix. Bull. Mar. Sci. 2006, 79, 17–48. [Google Scholar]
© 2011 by the authors; licensee MDPI, Basel, Switzerland. This article is an open access article distributed under the terms and conditions of the Creative Commons Attribution license (http://creativecommons.org/licenses/by/3.0/).
Share and Cite
Plaisance, L.; Brainard, R.; Caley, M.J.; Knowlton, N. Using DNA Barcoding and Standardized Sampling to Compare Geographic and Habitat Differentiation of Crustaceans: A Hawaiian Islands Example. Diversity 2011, 3, 581-591. https://doi.org/10.3390/d3040581
Plaisance L, Brainard R, Caley MJ, Knowlton N. Using DNA Barcoding and Standardized Sampling to Compare Geographic and Habitat Differentiation of Crustaceans: A Hawaiian Islands Example. Diversity. 2011; 3(4):581-591. https://doi.org/10.3390/d3040581
Chicago/Turabian StylePlaisance, Laetitia, Russell Brainard, M. Julian Caley, and Nancy Knowlton. 2011. "Using DNA Barcoding and Standardized Sampling to Compare Geographic and Habitat Differentiation of Crustaceans: A Hawaiian Islands Example" Diversity 3, no. 4: 581-591. https://doi.org/10.3390/d3040581
APA StylePlaisance, L., Brainard, R., Caley, M. J., & Knowlton, N. (2011). Using DNA Barcoding and Standardized Sampling to Compare Geographic and Habitat Differentiation of Crustaceans: A Hawaiian Islands Example. Diversity, 3(4), 581-591. https://doi.org/10.3390/d3040581