Forest Biodiversity Assessment in Relic Ecosystem: Monitoring and Management Practice Implications

Abstract
: The remnants of old-growth cedar forests in Lebanon are currently protected since they are taken to represent relic ecosystems sheltering many endemic, rare and endangered species. However, it is not always obvious how “natural” these forest relics are, and how the past use, conservation and management history have affected their current structural properties and species community composition. Even though Integrated Monitoring Programs have been initiated and developed, they are not being implemented effectively. The present research studied the effect of forest stand structure and the impacts of the anthropogenic activities effects on forest composition and floristic richness in four cedar forests in Lebanon. Horizontal and vertical structure was assessed by relying on the measurement of the physical characteristics and status of cedar trees including diversity and similarity indices. Two hundred and seventeen flora species were identified, among which 51 species were found to have biogeographical specificity and peculiar traits. The species composition seems not to be correlated with stand age structure; however, the occurrence of multiple age cedar stands favors floristic richness and variability in species composition as observed in one of the stands where the variation in diversity indices was high. In conclusion; to conserve biodiversity across landscapes, it is necessary to maintain a collection of stands of different vertical structure; an effect produced both by natural and anthropogenic disturbances since they both create a mosaic of different aged succession stands.1. Introduction
Forest inventories aimed at building up long term national databases for integrated monitoring purposes are central to conservation. They give insights into the best forest conservation and management practices and have high conservation value as well as great potential for the development of adaptive management strategies. Meanwhile, since broad-scale biodiversity monitoring programs are often expensive and complex to design and maintain they depend most of the time on external funding in developing countries [1,2].
The sustainable management of forests is increasingly recognized as an urgent worldwide challenge. The future of forests not only has serious socio-economic implications but also socio-cultural ones alongside global concerns that include impacting on biodiversity loss and climate change. Given the broad diversity of forest ecosystems worldwide, the challenge is highly complex and requires effective monitoring programs [3,4]. Therefore, the design of natural resource conservation and forest management plans need to synergize all activities in order to conserve, in an appropriate way, each particular forest stand, the environmental services and goods it provides. This integration is an important feature of conservation policies, as the uses which are made of the forest, play an important role in the shaping of stand structure and determining the associated floristic richness [3-5].
In Lebanon, forestry studies directly linked to stand structure and composition are at best scarce or fragmentary. The first forest resource assessment was carried out by the Ministry of Agriculture in the framework of a project funded by the Food and Agriculture Organization [6]. Subsequently, Integrated Monitoring Programs (IMPs) have been initiated and developed in the context of internationally funded projects in the mid-nineties; however, these programs are not being implemented effectively as the management practices focus more on promoting the reserves through rural development and eco-tourism activities rather than on biodiversity assessments and conservation practices. This is understandable and is due to the self-reliance of the reserves in securing sufficient funding for their own administrative and managerial aspects. The IMPs have set specific aims of data collection on the basis of the management objectives of the reserves. In turn, they have been developed to be less time consuming and more practical. They have been designed to integrate monitoring indicator species and floristic richness, the measurement of biodiversity indices, forest structure and composition as the basis for defining conservation and adaptive management practices in Cedrus libani A. Rich. forest nature reserves. The design of the data collection required for adaptive management practices took into account the study of the effect of present management regime on stand structure and expansion [7-9].
Cedar is recognized as a genus among fourteen genera endemic or sub-endemic to the Mediterranean basin [10]. C. libani is one among 4 Cedrus species which are found in the Western Himalayas and the Mediterranean Region. It extends over a discontinuous mountain range in the Eastern border of the Mediterranean Sea in Syria, Lebanon and the Taurus Mountains in Turkey [3-6]. It figures among the species which are listed as a taxon at lower risk and near threatened (LR/nt) in IUCN-The World Conservation Union-Red List [11]. National Lebanese records classified cedar as an endangered species, threatened or on the way to extinction [12]. C. libani forests are limited to remnant patches of old-growth forests in Lebanon [13-16]. The present-day cedar populations, which have survived natural and human disturbances, are spread over the western slopes of the Mount Lebanon chain and fragmented into 12 populations [16-19]. Most of these forests are fairly pure cedar stands sheltering sporadic tree species such as Cilician fir, wild apple, maple, cedar oak, brant's oak and juniper. The floristic composition of mixed cedar forests is composed of approximately fifty plant species including trees, shrubs and herbs [20,21]. Most of the remaining old-growth cedar forests are currently legally protected since it was recognized that they represent relic ecosystems sheltering many of the endemic, rare and endangered species. However, it is not always clear how natural disturbances, past uses and management history have affected their present structural properties and species community composition. But what is clear is that some of these forests shelter considerable biodiversity, while others provide sanctuary for old-growth trees.
Even though cedar forests have been recognized as having great value and have faced extreme exploitation for decades, there are major deficiencies in research studies on their horizontal and vertical structures. At present they are subject to strict conservation and management policies, the effects of which, on plant diversity, are unknown. There are also no diachronic records of vegetation association and development. Nevertheless, the IMPs developed since the mid-nineties can be stepping stones for the establishment of databases on cedar forest structures and composition. These can give insight on best management strategies either for those declared as nature reserves or those that are protected forests. Few of these forests, Shouf cedars, Horsh Ehden and Tannourine cedar forest nature reserves, have been subject to systematic management strategies with appropriately defined objectives. However, the present management regime applies a strict but narrowly defined conservation policy following the declaration of these forests as nature reserves or protected forests falling respectively under the stewardship of the Ministry of Environment and the Ministry of Agriculture. The restricted approach to managing and conserving natural resources in Lebanese forests dates back to the 1950s [22]. Although understandable, the regulatory regime has unfortunately affected stand structures and composition. It has also disrupted the previous harmonious relationships, whenever found, between local communities and their natural areas, thus in reality leaving the effect of the management regimes unsatisfactory. An understanding of the resulting effect of conservation policies and management practices, in cedar nature reserves, on stand structure and floristic composition is needed either to decide on innovative management practices or to propose guidelines for the amendment of the Lebanese forestry law.
The first objective of the present study was to assess biodiversity in four stands of cedar forest in Lebanon. The second objective investigated was whether the difference in stand structure affects biodiversity richness in the cedar stands and whether previous anthropogenic activities have to any extent shaped the present landscape. The third objective was to develop guidelines for management and conservation practices in order to sustain biodiversity.
2. Materials and Methods
2.1. Study Site
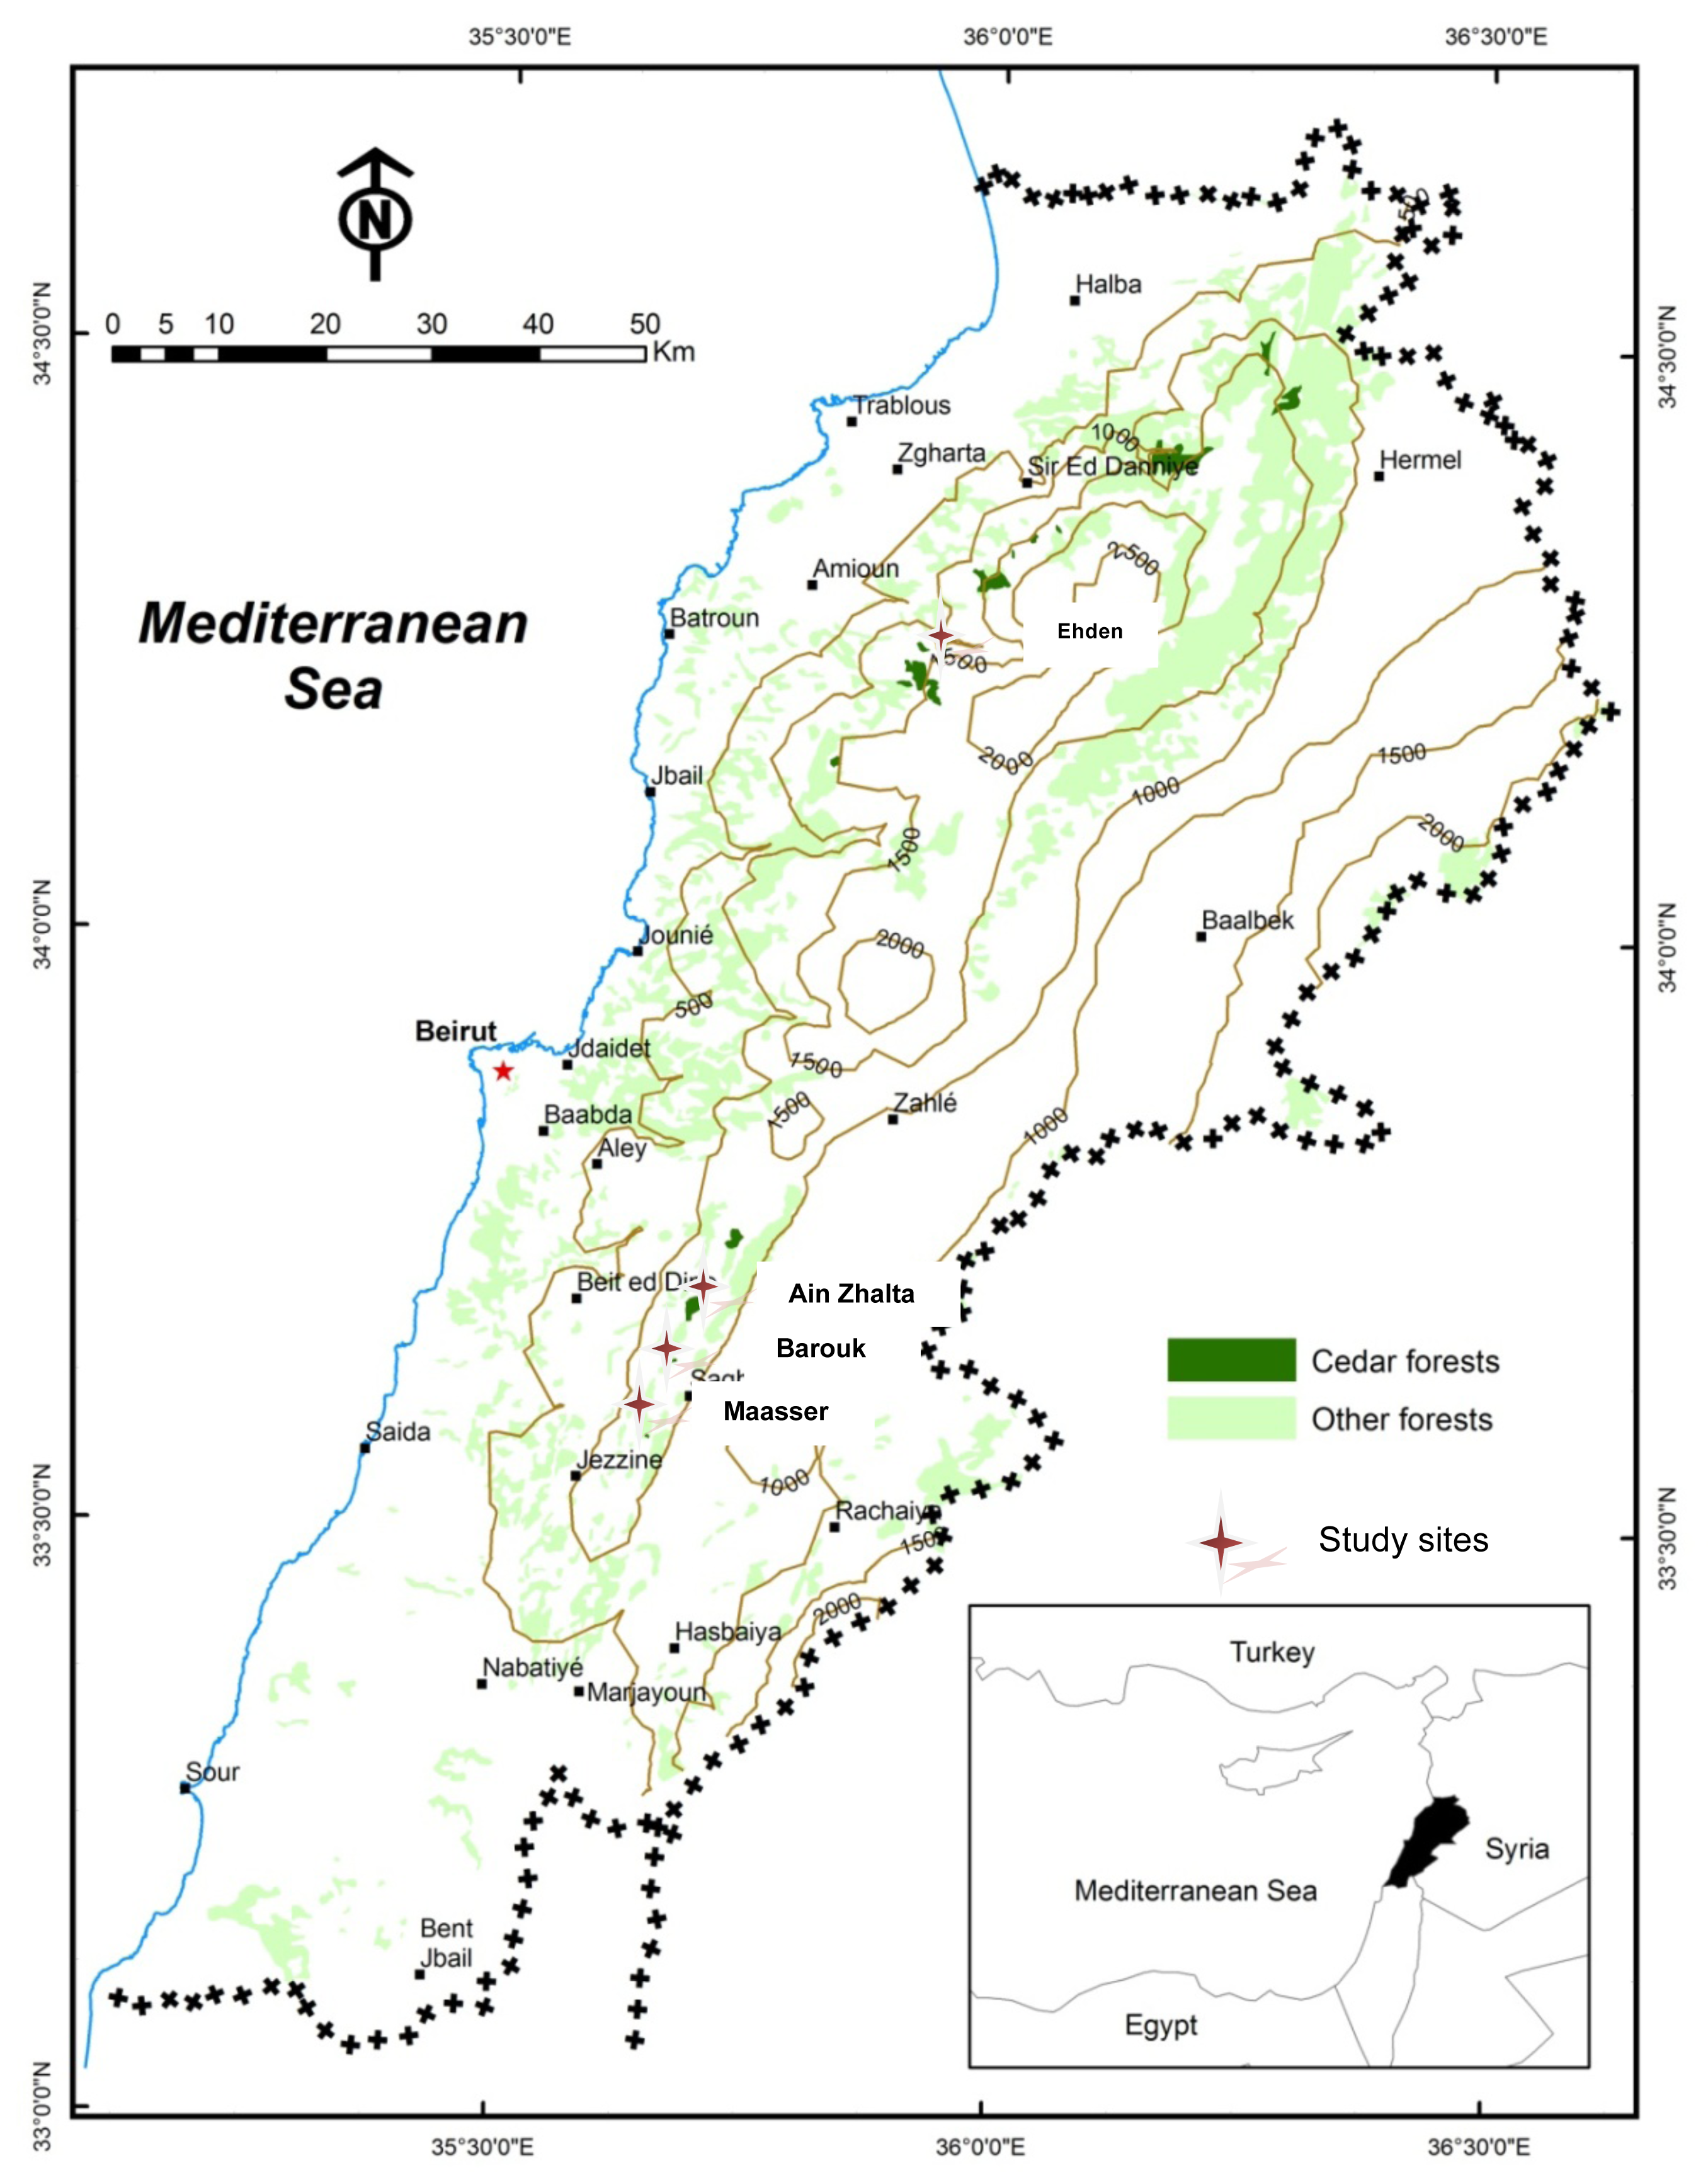
The selection criteria of the study sites included the latitudinal differences, slope exposure, topography and associations types and their accessibility. Having been declared as nature reserves in the early nineties, the differences in the anthropogenic activities and conservation practices have also been considered (Table 1). On this basis four study sites were chosen: Horsh Ehden and three stands in Shouf Biosphere Reserve (SBR), namely Ain Zhalta, Barouk and Maasser (Figure 1).
Declared as a nature reserve in 1992, Horsh Ehden Nature Reserve extends over 1,000 ha. Within this reserve there is a mixed coniferous forest of C. libani and Abies cilicica (Ant. & Kotschy) Spach. and other tree species covering 424 ha. Located at N34°49″ latitudes and EO36°00″ longitude, it is recognized as a nationally outstanding remnant forest sheltering high biological diversity. The minimum average rainfall is 1,100 mm and the average temperature registered in the month of January is 3 ° while in August the minimum average temperature is registered as 18 °C. Ehden, ranging from 1,300 to 1,950 m altitudes, harbors a mosaic of mixed forest communities; Pinus brutia Ten. and Quercus calliprinos (Webb.) Boiss at lower altitudes while C. libani A. Rich., Abies cilicica (Ant. & Ky.) Carr. and Juniperus excelsa Bieb., Quercus cerris L. at higher altitude. Other tree species such as Quercus infectoria Oliv., Acer tauricaulum Boiss. & Bal., and the endemic Malus trilobata C. K. Schneider are found. It is internationally acknowledged to be the southernmost limit for the growth of the graceful species of Cilician fir [20,21].
Shouf cedar was declared as a nature reserve in 1996 and has figured in the UNESCO-MAN and THE BIOSPHERE Programme in 2005. The reserve lies along the Barouk Mountain range, the reserve is mostly known for its three separated cedar forests of Maasser Shouf, Barouk and Ain Zhalta. It is located between EO35°28′–EO35°47′ longitudes and N33°32′–N35°48′ latitudes and at an altitude ranging from 1,200 to 1,980 m with an annual rainfall average of 1,200 mm and a 11.3 °C mean annual temperature. It covers an area of 165 km². While the west-eastern slopes are covered with oak forests, the reserve's southern slopes are covered by the Q. calliprinos (Webb.) Boiss., J. oxycedrus Boiss., Q. infectoria Oliv. and scattered patches of C. libani forests. The reserve is well known to be the southernmost limit of cedar in the Niha region [14].
All four stands have undergone anthropogenic activities over recorded history (Table 1). In Ehden, the effects of human interaction have changed the apparent features of the forest in terms of vegetation cover. These woods were used to provide firewood, hunting and grazing. Also, during ancient times, clearings were used for the cultivation of wheat. Wild boars invaded the valleys after their introduction to areas located in the vicinity of the reserve. In SBR, one can observe human interactions through traces of severe wood cutting. During the past decades, these cedar forest areas were used for grazing, firewood, hunting, recreation and plant gathering. In 1970s, Ain Zhalta was subject to severe woodcutting and it was reported that cedar seeds were sown from the air while Maasser was replanted under the Green Plan after being subject to severe woodcutting and fragmentation.
2.2. Forest Structure and Composition
Field data collection was initiated in May 2000 and finalized in May 2002. The data recorded comprised geographical locations using a Global Positioning System GARMIN GPS 12® to measure the latitudes, altitudes, slopes and exposure of the sampled quadrats. Survey forms registered habitat type, topographical characteristics, disturbance factors as well as the physical characteristics of cedar trees including diameter at breast height (DBH) [24], basal area (BA), height of tree using a clinometer as well as their physical status. The habitat types were defined on basis of the density of the vegetation cover. Three categories were defined: highly dense vegetation cover (80–100%), dense vegetation cover (60–80%) and sparse vegetation cover (<60%). The topographical characteristics took into account the degree of stoniness of the soil, the steepness of the slopes as well as their exposure. The degree of stoniness of the soil was defined based on the levels of the top soil coverage with stones. The disturbance factors considered animal (e.g., wild boars) and human impacts. The physical status of a tree was assessed with the following categories: Standing alive, Broken alive, Leaning alive, Standing alive/dead (Tree partly dead and partly alive), Standing dead, Broken dead, Leaning dead. The distances of each cedar tree from a central-point, defined within the sampled quadrats, were measured.
The locations of the 400 m2 quadrats, targeting forest structure measurements, were set to capture the different tree age categories found within the study site namely even-aged and uneven-aged categories [23-24]. Both categories included three classes: Even-aged I, II and III and Uneven-aged I, II and III. The classes of both categories were defined based on canopy coverage, vegetation cover and the age structure (Table 2).
The systematic methodology of quadrats sampling was adopted as it was simpler to implement and avoided undue biases. The quadrat positioning relied on the combination of many parameters found in the four study sites, thus effectively capturing different stand structures and vegetation compositions. This methodology has been adopted widely and used in many studies for the definition of stand structure, species richness and composition [2-25]. The point-centered quarter method was used to define the density of the forest [26,27]. This technique constitutes the selection of central points in the considered 400 m2 quadrat where these represent the center of four compass directions dividing the sampling quadrat into four quadrants. In each quadrant, trees were mapped and distance from the center point to the center of all individual tree categories was measured. The point-centered quarter method was adopted for future monitoring purposes and for establishing baseline data for conducting stand structure models which would help in the prediction of forest expansion and growth model.
The total area sampled in SBR covered approximately 0.08% of the total cedar stands area, while in Ehden the sampled area was slightly higher at 0.1% of the total cedar forest area.
Specimens of plant species, collected during field visits carried out in 2000 and 2001, covered the 4 seasons to capture the maximum number of species thriving in cedar forest. Number of species and composition; measured in each quadrat as well as computation of diversity indices relied on random sampling of 1 m2 quadrats in defined transects. Transects were considered to loop the different forest demographic structures identified. These were taken at 50 to 100 m distance in parallel. The length of transects varied from 400 to 800 m. The relative abundance of herbaceous, bulbous and woody (trees and bushes) plant species was measured through a visual evaluation following the Domin scale of vegetation cover [25].
2.3. Data Analysis
The criteria defining the age categories were a combination of the DBH measurements with the observed productivity of the tree. The five age categories defined were (a) juvenile, (b) non-bearing (cones), (c) bearing, (d) mature and (e) old. The frequency of cedar tree categories/plant species was measured as the percentage of plots in the study sites in which a given category/plant species existed.
Species diversity was measured using the Shannon index where s is the number of species, pi is the abundance of the ith species expressed as a proportion of total cover, ln is the natural logarithm [25].
The density of individuals in different categories was calculated [3,27,28] as follows where d is the mean point-to tree distance of trees with same age, di is the point-to-tree distance for ith individual and Σn is the number of individual measures.
Similarity indices in the different tree age structure categories relied on Sørenson coefficient (Bray-Curtis similarity) [25] where a is the number of herbaceous and woody plant species common to both quadrats 1 and 2, b and c are the number of species respectively absent from quadrats 1 and 2.
Sørenson similarity indices (Is) were calculated using PopTools version 2.5. Duncan multiple range tests were made using SPSS 11.0. The sequential agglomerative hierarchical non-overlapping clustering (SAHN) used for the similarity indices was the unweighted pair group method with the arithmetic mean (UPGMA) using NTSYS-pc version 1.80.
Herbaceous, bulbous and woody plant specimens collected were identified and confirmed in the Post Herbarium in the Art and Sciences Department of the American University of Beirut and in the Herbarium of the School of Plant Sciences at The University of Reading in England. The identifications were made using Floras pertaining to the Middle East and Eastern Mediterranean countries [13,29-32]. Med-Checklist was also used to update plant names [33].
3. Results
3.1. Demographical Structure
The categories of tree age were defined according to the measurements of DBH and field observations. The tree age categories comprised juvenile registering a DBH less than 30 cm, non-bearing trees between 30 and 100 cm, bearing-mature trees between 100 and 350 cm, old trees between 350 and 500 cm and the very old tree specimens more than 500 cm (Table 3).
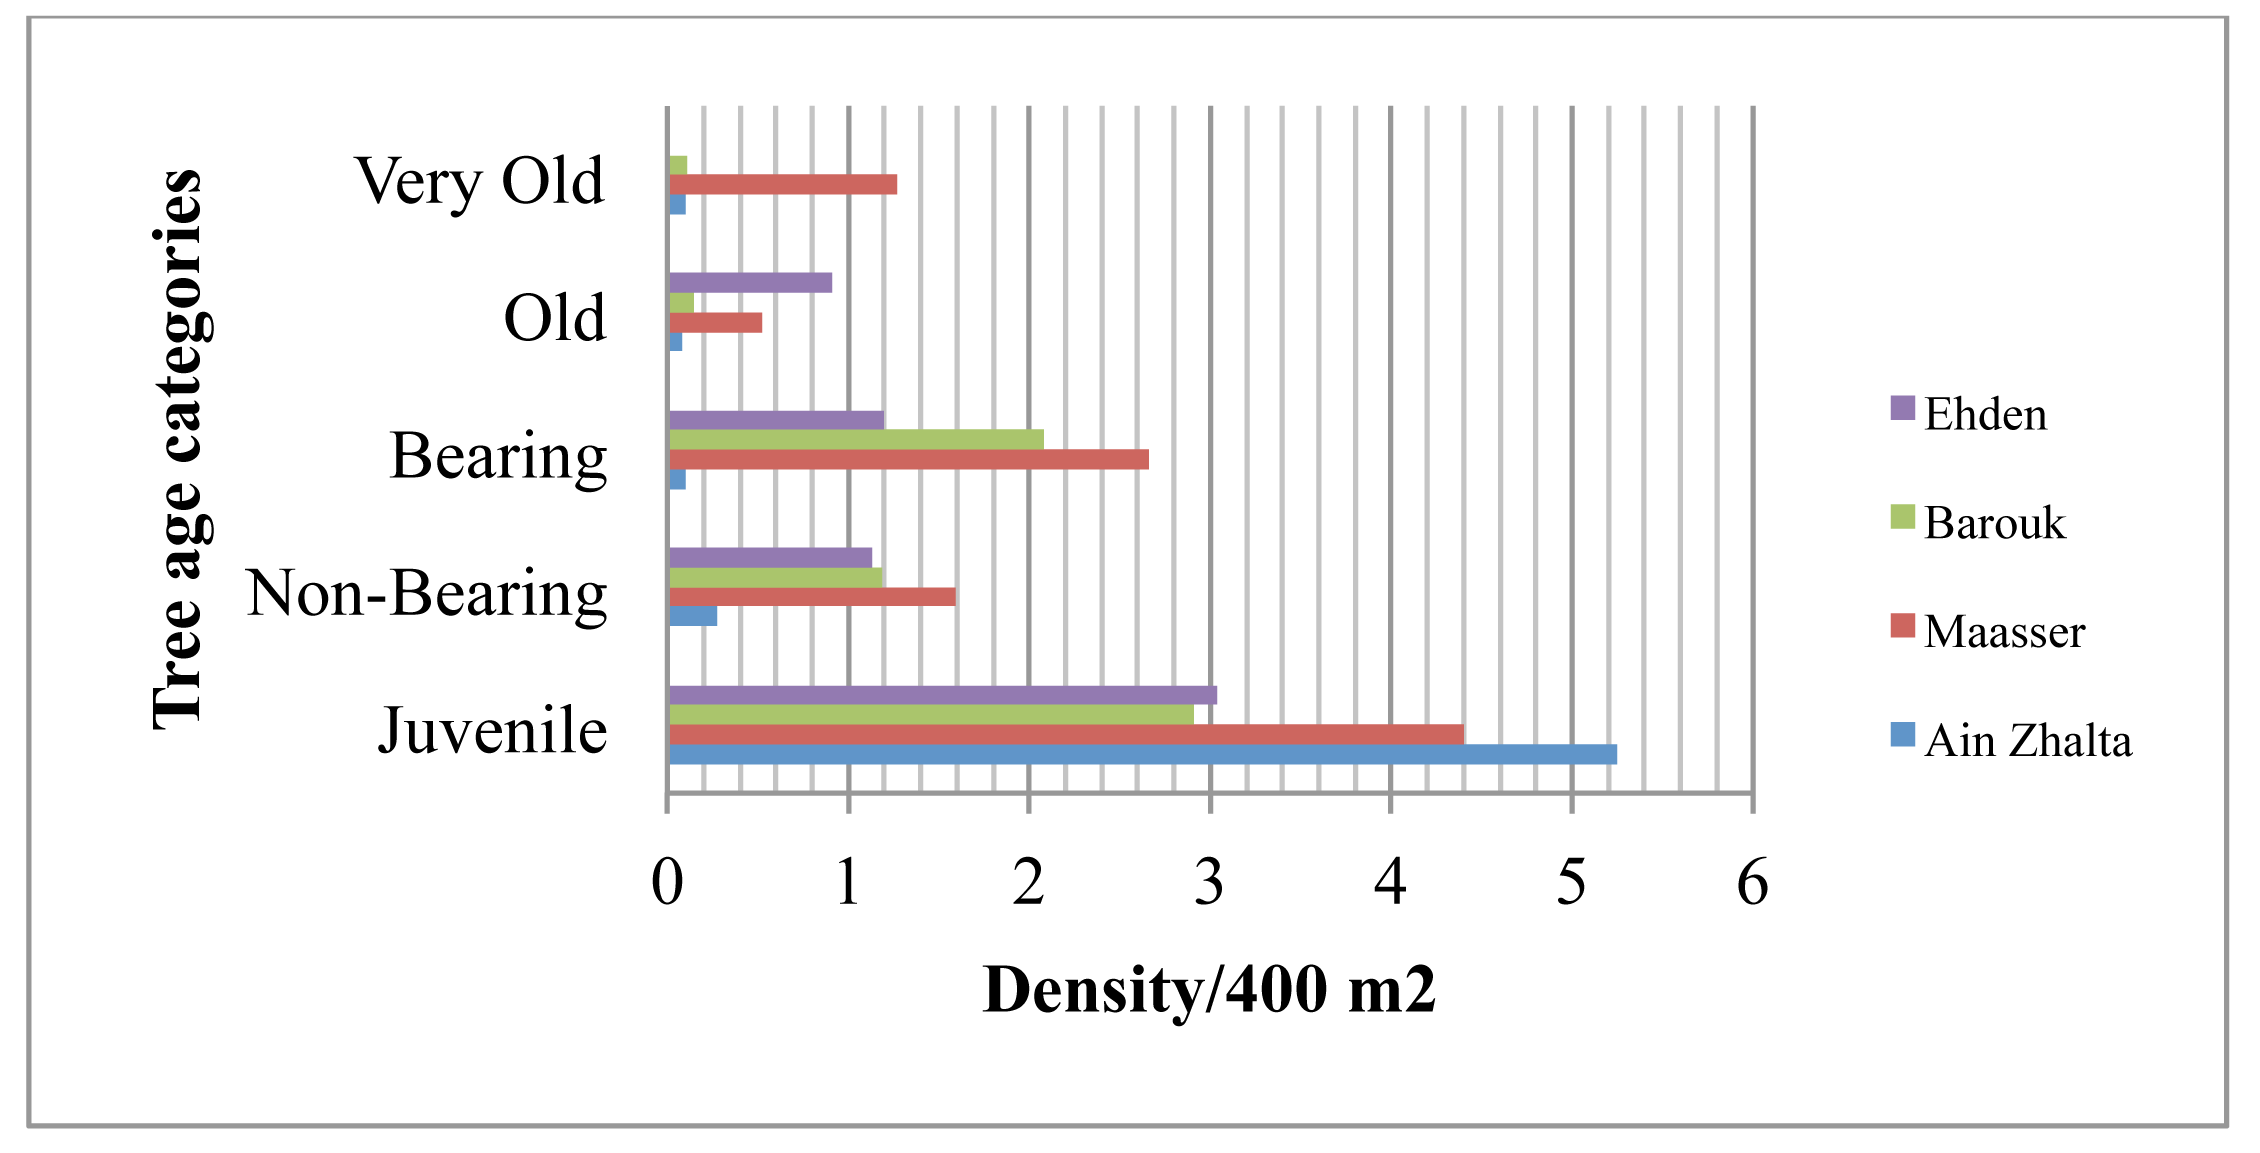
The difference in tree age categories between the stands in Shouf and Ehden revealed the diversity in stand structures. A high density and high frequency of juveniles was recorded in all four stands (Figures 2 and 3). The highest mean density values of juvenile trees were observed in Ain Zhalta and Maasser measuring respectively 5.25 and 4.40 trees/400 m2 (Figures 2 and 3). The highest densities of very old, old and bearing trees were recorded in Maasser having respectively an average value of 1.27, 0.52 and 2.66 trees/400 m2.
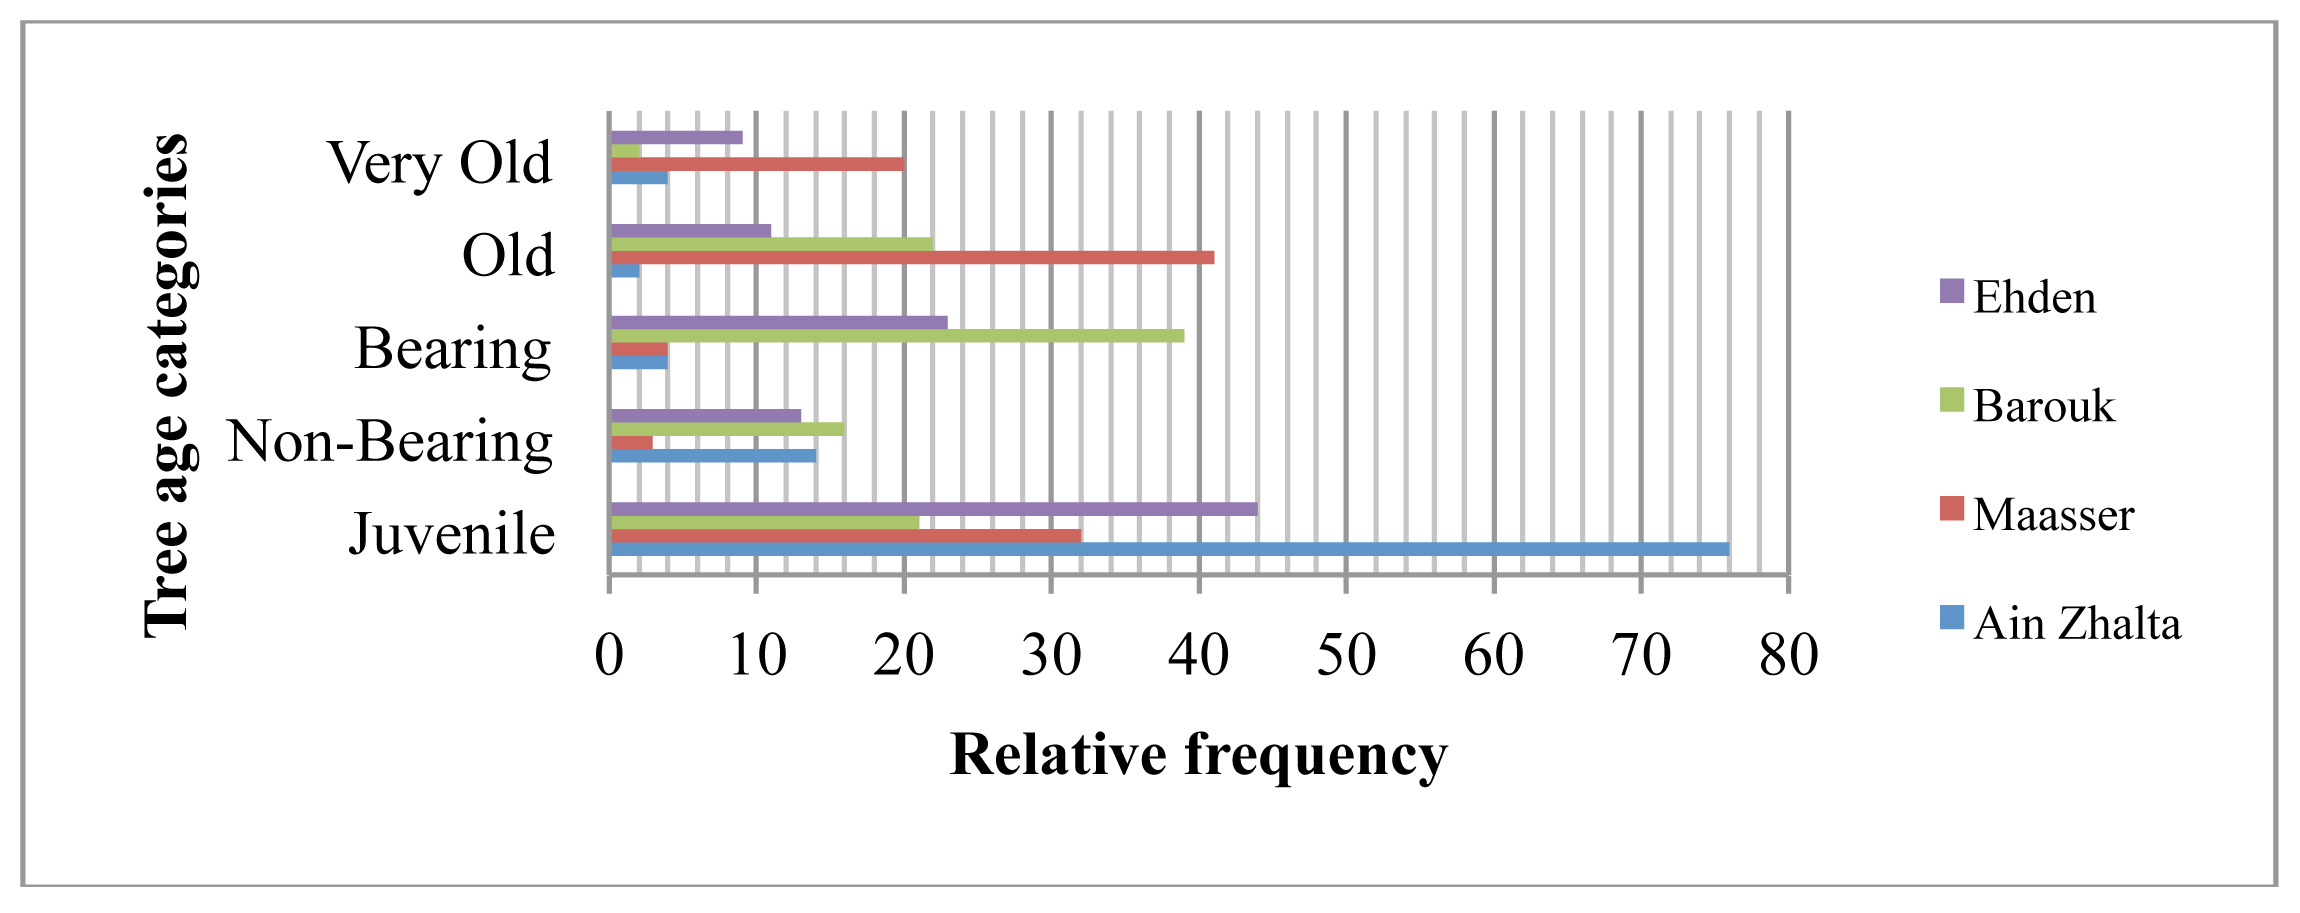
In Barouk and Ehden, multiple ages of cedar trees were identified. These two forest stands tend to be younger than Maasser. The juvenile and bearing tree age categories registered respectively a relative frequency of 21% and 39% in Barouk. The lowest relative frequency in very old tree age category was observed in Barouk (2%). In Ehden, a relative high frequency was observed for juvenile (44%) and bearing (23%) (Figure 3). Maasser registered the highest frequency in the old (41%) and very old (20%) tree age categories. In Ain Zhalta, the highest frequency of juvenile trees was measured (76%) with the lowest frequency in old (2%) and a low frequency (4%) of very old tree age categories.
All classes related to the status of the tree were found in Ehden in contrast to the stands studied in SBR. In Ehden, the presence of multiple classes reflects the natural dynamic ecological process. The relative frequency of standing dead trees (16%) and broken dead ones (1%) in Ehden on the hillside seems to be the result of natural processes. In Ain Zhalta, Maasser and Barouk, the presence of standing alive tree class registered a high frequency (>90%) while in Ehden this class was found with lower relative frequency (75%). In Maasser and Barouk, other tree classes were recorded. These are broken alive, standing alive dead and leaning alive in Barouk. While in Maasser, standing alive dead, broken dead and standing dead were found.
3.2. Vertical Forest Structure and Species Diversity
The comparison of means using Duncan multiple range test revealed a difference between the four study sites (Table 3). While Shannon diversity indices in 1 m2 quadrats varied between the four stands, the highest resulting diversity index (1.16) was registered in Maasser where the stand structure is composed of even-aged and uneven-aged trees. Even though Ehden showed the highest floristic richness, it did not register the highest value in relation to diversity indices. Barouk registered the lowest diversity indices. The disturbance caused by grazing and woodcutting in this study site have affected, to some extent, the vegetation composition, thus causing a uniformity in species composition.
The stand structure has shown a significant effect on diversity indices in even-aged stands characterized by a dense canopy and uneven-aged stands characterized by very low canopy coverage. In contrast, diversity indices were not significantly different in the other two even-aged categories as well as the uneven-aged category with sparse canopy. The Sørenson coefficient (Bray-Curtis similarity) of the pair-wise comparison of species composition ranged from 0.032 in Ehden to 0.5 in Maasser and Barouk. In Ain Zhalta, floristic composition showed the highest similarity at 88 %. While the similarity in the uneven-aged II was low (24%), 64% similarity was recorded in the uneven-aged I stand category. In Maasser, similarity is observed in even-aged categories and in uneven-aged categories. Similarity in species composition in these two stand categories is lower than plant communities in stands with dense and homogenous tree ages. In Barouk, plant communities were divided into two clusters within the fragmented stands with multiple ages of cedar trees (uneven-aged III). Uneven-aged II category recorded the highest similarity at 72% (Table 3).
3.3. Understory Composition
A checklist of the two forests, Ehden and Shouf, based on the flora reported by Mouterde (1966) and Post (1933) [13,29], roughly indicated the presence of 348 species in Ehden and 88 species in Shouf. The sampling strategy for the floristic richness covered a total number of 156 quadrats of 1 m2. This number was defined by reference to the cumulative number of species measured in each stand. The number varied in the 4 study sites with 72 in Ehden, 25 in Barouk, 35 in Maasser and 24 in Ain Zhalta.
In the current study 217 of the reported species were identified through field collection in SBR and Ehden forests among which 11 undefined species [Annex 1]. This number refers to the specimens collected from the sampled quadrats and to those collected while traversing transects. The differences in numbers between the checklist and the specimens collected reflects limited time constraints and technical management in handling the first year plants collection in the laboratory during the preparatory phase for their identification and conservation. Sixty-nine different plant species were recorded in the total quadrats sampled in SBR and Ehden. While Ehden has the highest number of species (63) recorded in the sampled quadrats, Ain Zhlata, Maasser and Barouk had between 20 and 30 species. Some species were present in all stands, others in only some. Fifty one herbaceous, bulbous and bush species were found with biogeographical specificity and peculiar traits which are endemic to Lebanon, Syria and Turkey. These species reveal a degree of speciation and differentiation to these Eastern Mediterranean countries. Seven of the species are endemic to Lebanon such as Astragalus ehdenensis Mt. and Orchis romana ssp. libanotica Mt.; eight endemic to Lebanon and Syria such as Berberis libanotica Ehrenb. and five endemic to Lebanon, Syria and Turkey such as Rubia aucheri Boiss. and Galium libanoticum Ehren [12,34] (Table 4).
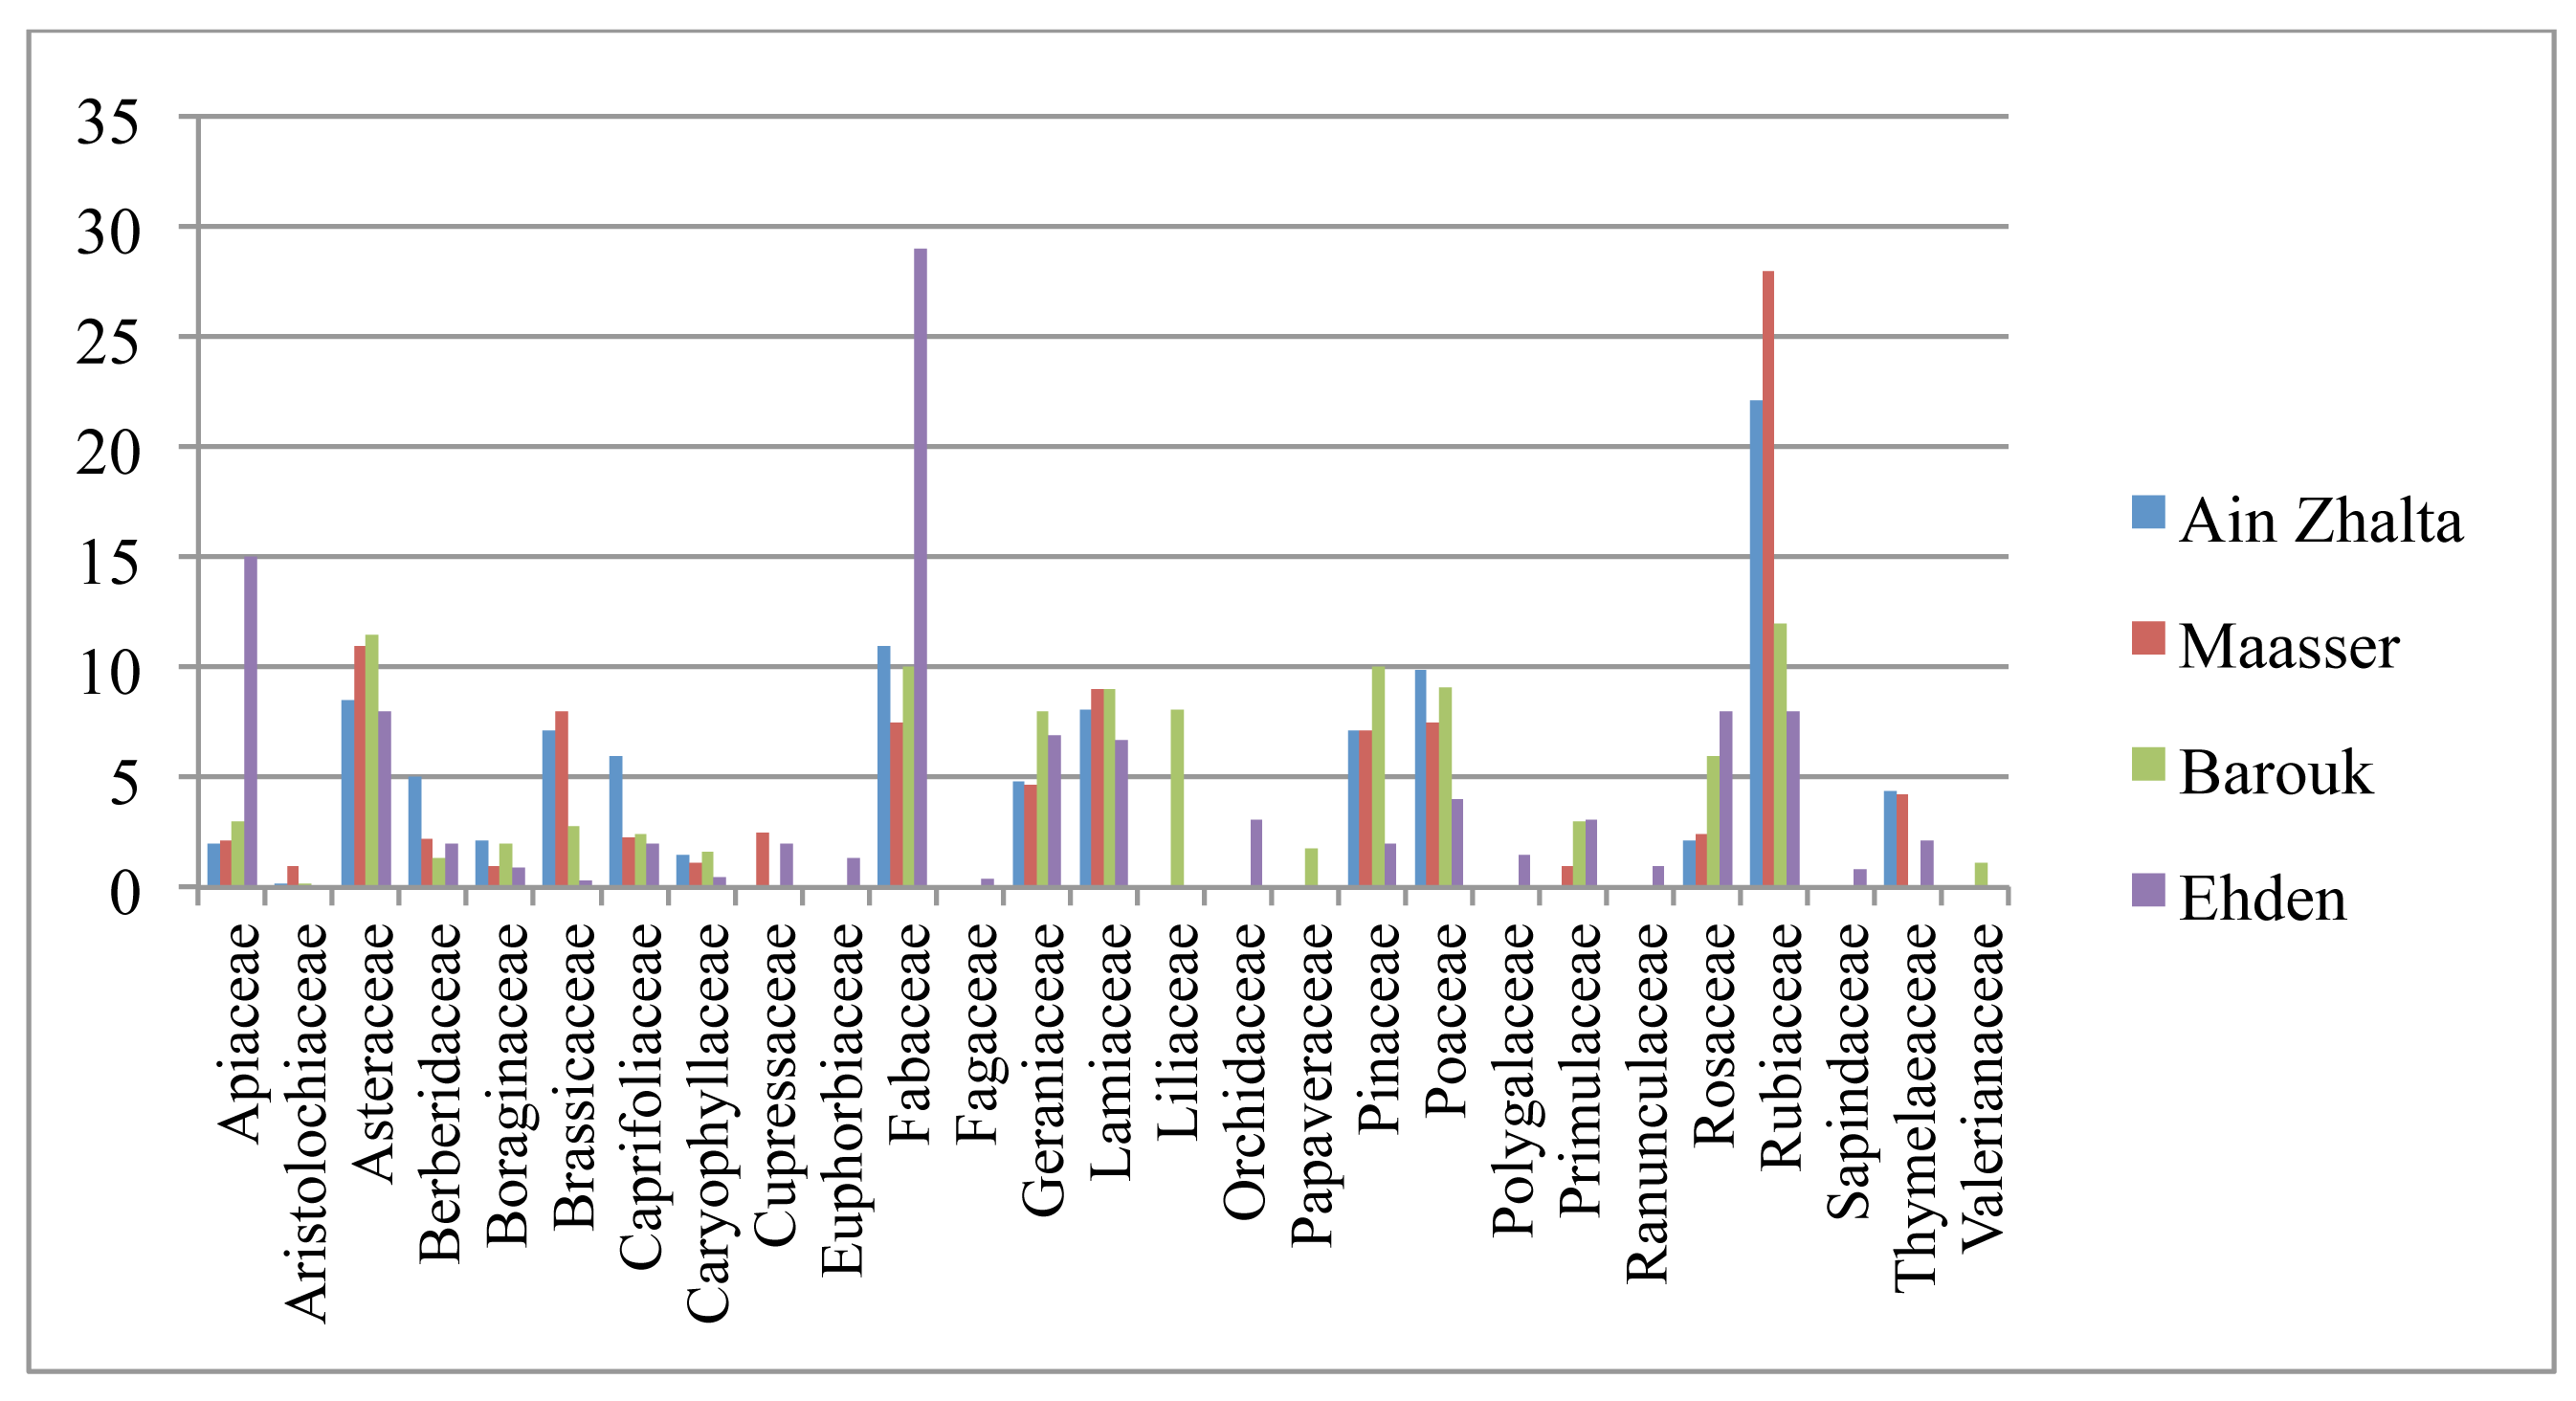
The relative frequency of plant families reflects past land uses. The relative frequencies of the Fabaceae and Apiaceae families were the highest in Ehden. While the highest relative frequency for Asteraceae was measured in Barouk, the highest relative frequency for Poaceae was observed in SBR reflecting previously grazed land while a high density of Rubiaceae family was observed in Maasser. In this latter forest, the dominant ground cover underneath the cedar trees was composed of the endemic Rubia aucheri Boiss. because of the canopy of the old growth tree and the conserved soil moisture most of the year (Figure 4).
4. Discussion
The relative frequencies of the different tree age categories show the values in Ehden forest fluctuate little, in contrast to Ain Zhalta and Maasser where the fluctuation range is high between the different tree categories. The difference in the relative frequencies in Maasser reflect the age structure of this stand whereby severe woodcutting and grazing has left the forest with mature and old trees and the strict conservation policies applied in the mid-nineties have favored the high survival rate of juvenile categories. The low frequency in the non-bearing and bearing tree categories reflect the low success of the reforestation plans undertaken by the state in the seventies. In addition to the newly applied conservation policy, the high frequency of juveniles in Ain Zhalta seems to be the result of the topography of this region whereby frequent water courses passing in the forests render high humidity to the soil. The past uses of the forest, mainly woodcutting, have left the Maasser forest with a high frequency of relics of old growth trees. The complexity of age structure and tree classes in the Ehden forests has enriched the forest in floristic composition which supports conclusions in other research studies [35-37].
In SBR stands, the low frequency of tree status classes excluding standing alive is related to management practices. In these stands, the management team has been collecting dead branches and trees for firewood. In contrast, the migration of the local communities during winter time from Ehden to a coastal village reduces the firewood cutting of these dead or broken trees and the management regime does not take into account the collection of this tree class. The disturbances caused by wild boars living in Ehden forest are reflected by the high frequency of the class including leaning alive trees.
The species composition seems not to be correlated with stand age structure, however, the occurrence of multiple age cedar stands favors floristic richness and variability in species composition, for example as observed in Ehden where the variation in Is values is high. The similarity was independent of stand age structure category. Four major clusters are observed in Ehden. One cluster was further divided into six groups. High similarity in species composition was observed in even-aged II category. The highest diversity indices were recorded in even-aged stands in Maasser characterized by high canopy coverage. This may be explained by the fact that as time progresses, it is expected that the degree of horizontal and microenvironment heterogeneity increases as the succession stages evolve [38].
Maasser, Ain Zhalta and Barouk do not have high floristic richness. Plant communities were generally similar over the same age structure categories. The difference in species richness between Ehden and Shouf is related, in addition to the presence of mosaic of age structure, to: the presence of mixed cedar stands in Ehden; the difference in locations; and the variation in environmental factors such as rainfall, temperature, and exposure. The location of the forest, its management and its historical uses, influence its floristic richness and are keys to its future conservation. The presence of multiple tree status classes in Ehden forest when compared to Shouf is mainly a reflection of the management regime. This illustrates the complexity of the ecosystem dynamics and complements the diversity in age structure in the Ehden forest.
To conserve biodiversity across landscapes, it is necessary to maintain a collection of stands of different vertical structure; an effect produced both by natural and anthropogenic disturbances since they both create a mosaic of different aged succession stands. The presence of multiple tree status classes is thus a product of the dynamics of forests which have critical functions. This thus plays an important role within forest ecosystems, including nutrient cycling and structural habitat features for a wide variety of other plants and animals. Accordingly, it is in the best interest of forest managers to actively manage the dead wood resource if they wish to maintain these functions within managed forests. Consequently, the integration of dead, dying and decayed trees in forest management should be a cornerstone in any management prescription [37].
The resilience of the structure and function of the ecosystems depends as much on the links between human and ecological components, as it does ecological and social characteristics. Monitoring the extent to which these practices are used and adjusted to changing conditions could offer an indication of not only the resilience of ecosystems but also the resilience of social systems as also revealed in other studies [39].
5. Conclusions
In Lebanon, the early period of nature reserve management regimes relied on strict conservation practices which have affected not only the ecological evolutionary processes but also disrupted the existing relationship between humans and their environment. Thus these approaches have ignored the role that local communities have played in shaping the landscapes of cedar forest relics including their vertical and horizontal structures. Lately, the exclusionary approach has been replaced by participatory management practices where local communities are considered as an integral part of the application of the management regime. However, the existing past interactions between local communities and the reserves are still very limited and unclear. They need to be defined in way where the ecological evolutionary processes are the basis.
The study shows that to conserve biodiversity across landscapes, it is best to maintain a collection of stands of different vertical structures, as produced by natural or anthropogenic disturbances that create a mosaic of different aged succession stands. The location of the forest, its management and uses over the history are factors to be taken into account in relation to conservation and the enhancement of the floristic richness.
Therefore, various anthropogenic activities and their effect on floristic composition and stand structure must be considered in future and more focused studies on this subject in Lebanon and other Middle Eastern countries. Being restricted within a timeframe, additional work is needed in which the main parameters considered are the forest management regime adopted and conservation practices as well as the interaction of local communities with the nature reserves.
A common framework for understanding past land use and management practices needs to be part of botanical assessments and forest inventories as well as monitoring programs to achieve a more concerted shift to participatory management that not only include communities but also support and rely on their ways of using and maintaining the landscape.
Supplementary Material
diversity-03-00531-s001.pdf


| Stand | Latitudes | Altitude range (m) | Slope exposure | Anthropogenic activities | Management and conservation practices |
|---|---|---|---|---|---|
| Ehden | N34°49″ EO36°00″ | 1,300 1,950 | North East West | Wheat plantation, Grazing, Wood cutting | Nature Reserve (1992) |
| Barouk | N33°42″ EO35°42″ | 1,400 1,800 | West | Grazing, Wood cutting, Collection of Wild edible, medicinal and aromatic plants | Nature Reserve (1996) Reforestation (1960) |
| Ain Zhalta | N33°44″ EO35°43″ | 1,400 1,700 | North East/West | Grazing, Severe wood cutting, Collection of Wild edible, medicinal and aromatic plants | Nature Reserve (1996) Reforestation (1970) |
| Maasser | N33°40″ EO35°41″ | 1,550 1,780 | West/South West | Grazing, Wood cutting, Collection of Wild edible, medicinal and aromatic plants | Nature Reserve (1996) Reforestation (1970) |
| Category | Class | Characteristics |
|---|---|---|
| Even-aged Homogeneous demographic structure | I | Dense canopy coverage, Dense vegetation cover |
| II | Medium canopy coverage, Patchy vegetation cover | |
| III | Low canopy coverage, Scattered vegetation cover | |
| Uneven-aged Heterogeneous demographic structure | I | Dense canopy coverage, Dense vegetation cover |
| II | Medium canopy coverage, Patchy vegetation cover | |
| III | Low canopy coverage, Scattered vegetation cover |
| Stand | Diversity indices |
|---|---|
| Ain Zhalta | 1.02 a* |
| Barouk | 0.73 b |
| Maasser | 1.16 a |
| Ehden | 1.03 a |
| Age structure categories | |
| Uneven-aged I | 1.06 b |
| Uneven-aged II | 1.03 b |
| Uneven-aged III | 0.78 c* |
| Even-aged I | 1.30 a |
| Even-aged II | 0.99 bc |
| Even-aged III | 0.93 bc |
*Numbers followed by the same letter in the column are not significantly different (p < 0.05) according to Duncan multiple range test.
| Endemic | Peculiar to Eastern Mediterranean Region |
|---|---|
| Rare | Status not reported |
| Astragalus ehdenensis Mt. * |
|
| Abundant | |
| Status not reported | |
|
Endemic to*Lebanon,**Lebanon and Syria,***Lebanon, Syria and Turkey.
Acknowledgments
The research was part of a PhD study carried out in the School of Plant Sciences at the University of Reading in England. We gratefully acknowledge the financial support of the European Union (Contract number: ERBIC18-CT97-0177). We are thankful to Salma N. Talhouk from the American University of Beirut for her comments on the early part of the study. We are also grateful to the Faculty of Agriculture and Food Sciences at the American University of Beirut for hosting the study in its laboratory. We acknowledge Eng. Lichaa El-Koury for the development of the map. We appreciate the technical support provided by Al-Khatib, Hani and Bou Daher during field expeditions.
References
- Katzner, T.; Miller-Gulland, E.J.; Bragin, E. Using modeling to improve monitoring of structured populations: Are we collecting the right data? Conserv. Biol. 2007, 21, 241–252. [Google Scholar]
- Harris, R.R., Erman, D.C., Kerner, H.M., Eds.; Proceedings of the Symposium on Biodiversity of North-Western California, Santa Rosa, CA, USA, 28–30 October 1991; Wildland Resources Center, University of California: Santa Rosa, CA, USA, 1991.
- Antos, J.; Parish, R. Dynamics of an old-growth, fire initiated, subalpine forest in southern interior British Columbia: Tree size, age, and spatial distribution. Can. J. For. Resour. 2002, 32, 1935–1946. [Google Scholar]
- Salafsky, N.; Margoluis, R.; Redford, K. Adaptive Management: A Tool for Conservation Practitioners; Biodiversity Support Program: Washington, DC, USA, 2001. [Google Scholar]
- Huang, W.; Pohjonen, V.; Johansson, S.; Nashanda, M.; Katigula, M.I.L.; Luukkanen, O. Species diversity, forest structure and species composition in Tanzanian tropical forests. For. Ecol. Manage. 2003, 173, 11–24. [Google Scholar]
- Dalsgaard, S. National Forest and Tree Assessment and Inventory; Final Report TCP/LEB/2903; FAO & Ministry of Agriculture: Beirut, Lebanon, 2005. [Google Scholar]
- Sattout, E.; Abi Said, M.; Naylor, C.; Sadek, R.; Nemer, N. Shouf Biosphere Reserve. Integrated Monitoring Programme; Strengthen Nature Reserve in Lebanon, FGEF/AFD: Beirut, Lebanon, 2010. [Google Scholar]
- Sattout, E.J. Flora biodiversity assessment and monitoring. Presented at Tannourine Cedar Forest Nature Reserve, Integrated Management of Cedar Forests in Lebanon; GEF-UNEP, AUB, MOE, SETS, TCFNR: Beirut, Lebanon, 2007. [Google Scholar]
- Sattout, E.; Talhouk, S.N. A Proposed Monitoring Programme for the Flora of the Natural Reserves of Al-shouf, Ehden and Palm Islands; Ministry of Environment and Green Line: Beirut, Lebanon, 2001. [Google Scholar]
- Quézel, P.; Medail, F.; Loisel, R.; Barbero, M. Biodiversity and Conservation of Flora Species in the Mediterranean Basin; Forest Department, FOA: Rome, Italy, 1999. Unasylva Journal 197. Available online: http://www.fao.org/docrep/x1880e/x1880e05.htm# (Accessed on 16 February 2011).
- Hilton-Taylor, C. 2000 IUCN Red List of Threatened Species; IUCN-The World Conservation Union: Gland, Switzerland, 2000. [Google Scholar]
- Khouzami, M.; Bassil, M.; Fortunat, L.; Hayek, A. Etude de la diversité biologique du liban. Liste des espèces basée sur les rapports de l'étude de la diversité biologique du Liban; Ministère de l'Agriculture et Program des Nations Unies pour l'Environnement: Beyrouth, Liban, 1996. [Google Scholar]
- Mouterde, P. Nouvelle flore du Liban et de la Syrie; Editions de l'imprimerie catholique: Beyrouth, Liban, 1966; Volume 1–3. [Google Scholar]
- Browicz, K. Chorology of Trees and Shrubs in South-West Asia and Adjacent Regions; Polish Scientific Publishers: Warszawa, Poland, 1982; Volume 1. [Google Scholar]
- Bariteau, M.; Ferrandes, P. Les Cèdres. In L'Amélioration des plantes; Gallais, A., Bannerot, H., Eds.; INRA: Paris, France, 1992; pp. 732–743. [Google Scholar]
- Bariteau, M.; Panetsos, K.P.; M'hirit, O.; Scaltsoyiannes, A. Genetic variation of the Atlas Cedar compared to that other Mediterranean cedars. Forets Mediterranneennes 1999, 4, 175–190. [Google Scholar]
- De Vaumas, E. Le Liban: Montagne Libanaise, Bekaa, Anti-Liban, Hermon, Haute Galilée Libanaise. Etude de géographie physique; Firmin-Didot: Paris, France, 1954. (in French) [Google Scholar]
- Basbous, M.; De Tarade, R. Notes sur l'écologie du cèdre du Liban; Publications de l'Université Libanaise: Beyrouth, Liban, 1968. [Google Scholar]
- Khouzami, M.; Nahal, I. Les bioclimats du Cèdre du Liban (Cedrus libani A. Rich.) et leurs particularités dans son aire naturelle. Res. J. Aleppo Univ. Agr. Sci 1983, 5, 39–62. [Google Scholar]
- Beals, E.W. The remnant cedar forests of Lebanon. J. Ecol. 1965, 53, 679–694. [Google Scholar]
- Chouchani, B.; Khouzami, M.; Quézel, P. A propos de quelques groupements forêstiers du Liban. Biol. Ecol. Méditerranéenne 1974, 1, 63–77. [Google Scholar]
- Ministry of Agriculture. Forestry Law; Sader Publisher: Beirut, Lebanon, 2000. [Google Scholar]
- Kent, M.; Coker, P. Vegetation Description and Analysis. A Practical Approach; Belhaven Press: Devon, UK, 1992. [Google Scholar]
- Roberts-Pichette, P.; Gillepsie, L. Terrestrial Vegetation Biodiversity Monitoring Protocols; Ecological Monitoring & Assessment Network: Burlington, ON, Canada, 1999. Available online: http://eqb-dqe.cciw.ca/eman/ecotools/protocols/terrestrial/vegetation (accessed on 6 September 2001).
- Oosting, H.J. The study of plant communities. In An Introduction to Plant Ecology; W.H. Freeman: San Francisco, CA, USA, 1956. [Google Scholar]
- Brower, J.E.; Zar, J.H.; von Ende, C.N. Field and Laboratory Method for General Ecology; Wm. C. Brown Publishers: Ottumwa, IA, USA, 1990. [Google Scholar]
- Heyting, A. Discussion and development of the point-centered quarter method of sampling grassland vegetation. J. Range Manage. 1968, 21, 370–380. [Google Scholar]
- Mitchell, K. Quantitative Analysis by the Point-Centered Quarter Method; Hobart and William Smith Colleges, Department of Mathematics and Computer Science: New York, NY, USA, 2001. Available online: http://people.hws.edu/mitchell/PCQM.pdf (accessed on 20 June 2011).
- Post, G.E.; Dinsmore, J.E. Flora of Syria, Palestine and Sinai; American Press: Beirut, Lebanon, 1933; Volume 1 and 2. [Google Scholar]
- Davis, P.H. Flora of Turkey and the East Aegean Islands; Edinburgh University Press: London, UK, 1965; Volume 1. [Google Scholar]
- Feinburn-Dothan, N. Flora Palaestina; The Israel Academy of Sciences and Humanities: Jerusalem, Israel, 1986; Volume 1–3. [Google Scholar]
- Guner, A.; Ozhatay, N.; Ekim, T.; Baser, K.H.C. Flora of Turkey and the East Aegean Islands; Edinburgh University Press: London, UK, 2000; Volume XI. [Google Scholar]
- Greuter, W.; Burdet, H.M.; Long, G. Med-Checklist; Conservatoire et Jardin Botaniques: Ville de Genève, Switzerland, 1984; Volume 1–3. [Google Scholar]
- Tohme, G.; Tohme, H. A Thousand and One Flowers of Lebanon; Lebanese University: Beirut, Lebanon, 2002. [Google Scholar]
- Bertomeu, M.; Romero, C. Managing forest biodiversity: A zero-one goal programming approach. Agric. Sys. 2001, 68, 197–213. [Google Scholar]
- Pommerening, A. Approaches to quantifying forest structures. Forestry 2002, 75, 305–324. [Google Scholar]
- McComb, W.; Lindenmayer, D. Dying, dead and down trees. In Maintaining Biodiversity in Forest Ecosystems; Hunter, M.L., Ed.; Cambridge University Press: Cambridge, UK, 1999. [Google Scholar]
- Brokaw, N.V.L.; Lent, R.A. Vertical structure. In Maintaining Biodiversity in Forest Ecosystems; Hunter, M.L., Ed.; Cambridge University Press: Cambridge, UK, 1999; pp. 373–399. [Google Scholar]
- Van Oudenhoven, F.J.W.; Mijatovic, D.; Eyzaguire, P.B. Social-ecological indicators of resilience in agrarian and natural landscapes. Manage. Environ. Qual. 2011, 22, 154–173. [Google Scholar]
© 2011 by the authors; licensee MDPI, Basel, Switzerland. This article is an open access article distributed under the terms and conditions of the Creative Commons Attribution license (http://creativecommons.org/licenses/by/3.0/).
Share and Cite
Sattout, E.; Caligari, P.D.S. Forest Biodiversity Assessment in Relic Ecosystem: Monitoring and Management Practice Implications. Diversity 2011, 3, 531-546. https://doi.org/10.3390/d3030531
Sattout E, Caligari PDS. Forest Biodiversity Assessment in Relic Ecosystem: Monitoring and Management Practice Implications. Diversity. 2011; 3(3):531-546. https://doi.org/10.3390/d3030531
Chicago/Turabian StyleSattout, Elsa, and Peter D. S. Caligari. 2011. "Forest Biodiversity Assessment in Relic Ecosystem: Monitoring and Management Practice Implications" Diversity 3, no. 3: 531-546. https://doi.org/10.3390/d3030531