The Impact of Climate Change on Recent Vegetation Changes on Dovrefjell, Norway

Abstract
: The ongoing climate warming has been reported to affect a broad range of organisms, and mountain ecosystems are considered to be particularly sensitive because they are limited by low temperatures. Meteorological data show an increased temperature for the alpine areas at Dovrefjell, Norway, causing a prolonged growing season and increased temperature sum. As part of the worldwide project Global Observation Research Initiative in Alpine Environments (GLORIA), the short-term changes in vascular plant species richness, species composition of lichen and vascular plant communities, and abundance of single species were studied at four summits representing an altitudinal gradient from the low alpine to the high alpine zone. During the period from 2001 to 2008, an increase in species richness at the lowest summit, as well as a change in the composition of vascular plant communities, was found at the two lowest summits. The results also indicate an increase in abundance of some shrubs and graminoids and a decline in the cover of some species of lichens at the lowest summit. These changes are in accordance with climate induced changes reported in other studies, but other causes for the observed vegetation changes, in particular changes in grazing and trampling pressure, cannot be ruled out.1. Introduction
Over the past century, the European continent has experienced an increase in average annual surface temperature of 0.8 °C [1], and the average length of the growing season has increased by 10.8 days since the beginning of 1960 [2]. In Norway the mean annual temperature has increased by 0.5–1.5 °C from 1875 to 2004 [3]. Climate change has already been shown to affect a broad range of organisms [4-6], and over the 21st century the annual temperature in Europe is estimated to continue to increase by 0.1–0.4 °C per decade [1].
Mountain ecosystems are considered highly sensitive to climate change because they are limited by low temperatures [7-11], and for the same reason mountain ecosystems can be used as indicators of the impacts of climate change [8]. Prolonged growing season and increased temperature will remove some of the environmental limitations and open the areas for invading plants from lower elevations [9,12], and an upward shift in distributions is expected. The local species diversity is expected to increase since species from lower elevations invade faster than present species become locally extinct [13]. However, alpine plants are easily outcompeted by thermophilic species [14], and, in the long run, cold adapted species might be driven out of their present distribution range and alpine biodiversity will be reduced [15-17].
An overall trend of upward movement of the alpine flora and increased species richness has been found in the Alps [13,18-22] and the trend is accelerating [6]. Similar findings are also reported from the Scandes [23-25]. In Jotunheimen, Norway, Klanderud and Birks [23] found that 53.5% of the species recorded at 25 mountains in Jotunheimen in 1930, 31 were found at higher altitudes in 1998, with a mean upward movement of 1.2 height meters per year.
Pauli et al. [13] report that the mean number of species per square meter increased by 11.8% in their study site at Mount Schrankogel in the Alps from 1994–2004, and they relate this change to the pronounced temperature rise in the Alps in the last century. Erschbamer et al. [26] found an increase in species richness in mountain summit areas over a five year period in the Dolomites.
Changes in species composition have also been observed, with an increased occurrence of dwarf shrubs and graminoids [27,28], and an increase of viviparous and hemiparasitic species [27]. On the other hand, Chapin et al. [29] report decreased species richness as a response to experimental warming in Arctic tundra over a nine year period, associated with strong dominance of Betula. In this study, evergreen shrubs and understory forbs showed a more pronounced decline than other species.
The Global Observation Research Initiative in Alpine Environments (GLORIA) is an international long-term observation network in alpine environments to detect impacts of climate change on mountain ecosystems [10,30,31]. In 2001 the first fieldwork in GLORIA-Europe was carried out and baseline data from 18 target regions in 13 European countries were collected, amongst them the GLORIA target region at Dovrefjell, Norway [10,32,33].
In this article the re-inventory of the four summits at Dovrefjell in 2008 is presented. The aim of the study was to determine if there have been any changes in the vegetation on alpine summits on Dovrefjell from 2001 to 2008 and whether such changes can be related to changes in the climate in the same period. Other possible causes for changes in vegetation will also be addressed.
The initial hypothesis was that if the temperature has increased in the study area there are reasons to expect that the species richness has increased and that there has been a change in the cover and abundance of some species, primarily an increase of woody plants and graminoids, on the study summits, considering the results of previous studies [13,18-23,27]. This should potentially be related to a decline in lichen cover on the same summits [29].
2. Background and Methods
2.1. Study Area
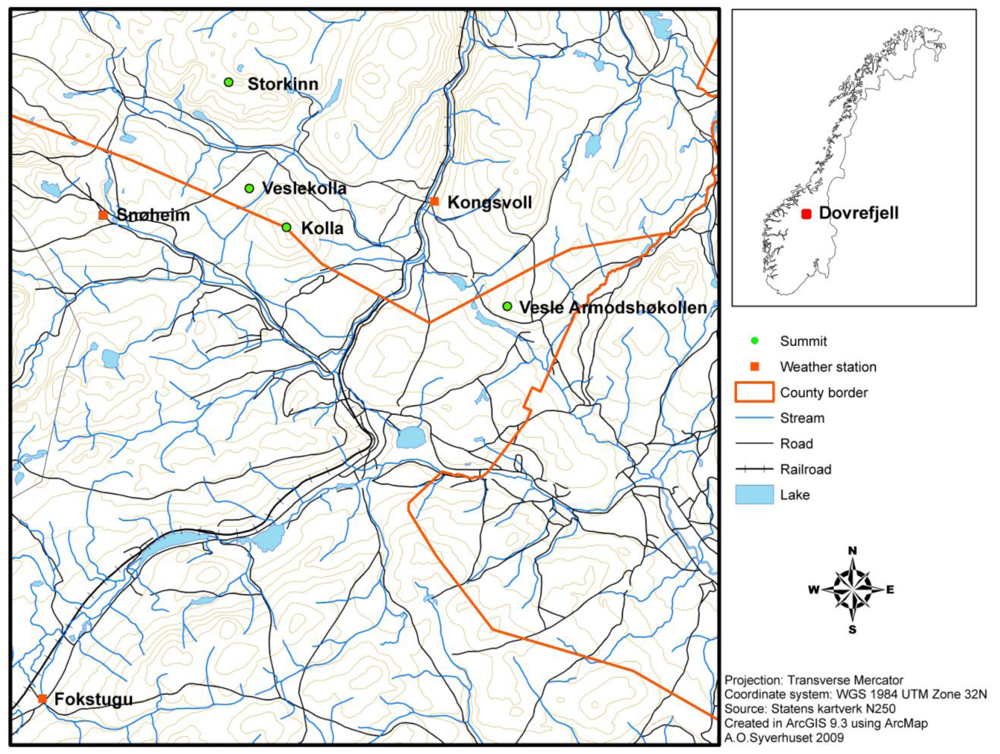
Most GLORIA target regions consist of four summits exposed to the same regional macroclimate. Together the summits represent an elevation gradient from the treeline ecotone and upwards to high alpine areas. The summits selected at Dovrefjell are Vesle Armodshøkollen (1,161 m a.s.l., low alpine zone), Veslekolla (1,418 m a.s.l., in the transition between the low alpine and the middle alpine zone), Kolla (1,651 m a.s.l., in the transition between the middle alpine and the high alpine zone) and Storkinn (1,845 m a.s.l., high alpine zone) (Figure 1).
The area is divided by the Drivdalen valley, which goes in a north-south direction (the railroad in Figure 1 follows the valley). Three of the summits are located to the west of the valley. These parts of the Dovrefjell area are dominated by old Precambrian bedrock which mainly consist of resistant and often strongly metamorphosed rocks. At the summits Storkinn and Veslekolla, the bedrock mainly consists of metamorphosed sandstone, whereas at Kolla, the bedrock consists of gneiss, granite and anorthosite. In the eastern parts of Dovrefjell the bedrock belongs to the Trondheim field, where the bedrock originates from the formation of the Caledonian mountain range. The lowest summit, Vesle Armodshøkollen, is located to the east of Drivdalen valley, and the bedrock at this summit consists of greenstone and amphibolite [34,35]. Vesle Armodshøkollen is characterized by a rich alpine flora, whereas the mountains to the west of Drivdalen have lower species richness [36].
The main large herbivores in this area are musk ox, wild reindeer and sheep. In the area east of the valley, where Vesle Armodshøkollen is located, the number of sheep released in the summer has increased from 4,567 individuals in 1999 to 6,119 in 2008. In addition, about 350 sheep and 700 lambs from a neighboring municipality graze in the area around Vesle Armodshøkollen early in the grazing season [37]. The reindeer herd in the area has been fluctuating over the years and was about 1,500 in the eastern part and 1,700 in the western part in 2008 [37]. The herd in the western part is considerably larger and reached between 8,000–12,000 individuals in the 1950s [38].
The musk ox was reintroduced in the region with new individuals brought in as late as 1953, and the number of musk ox has increased from about 20 individuals in the middle of the 1960s [39] to 213 individuals in 2006. The musk oxen mainly stay in the western part of the Dovrefjell national park, west of Drivdalen valley [39].
Lichen covered areas like those found at Vesle Armodshøkollen are not very suitable as pasture for sheep and are probably not grazed by these animals to any large extent. The areas might be used as a resting area for sheep and hence be exposed to trampling [40]. However, lichen covered ridges where the snow-cover is thin are important as winter pastures for reindeer [41].
2.2. Climatic Conditions
There are three meteorological stations in the area (Figure 1); Fokstugu (930 m a.s.l.) established in 1923 measuring air temperature, precipitation and snow depth, Kongsvoll (972 m a.s.l.) with air temperature data from 1980 to 2004, and Snøheim (1,505 m a.s.l.) with air temperature data from 2001. At the weather station Fokstugu, the climate is characterized by a mean annual temperature of −0.1 °C for the period 1961–1990. The warmest month is July with an average of 9.8 °C for this period, and the coldest month is January with an average of −8.8 °C. The average yearly precipitation at Fokstugu is 435 mm (data available at http://www.eklima.no).
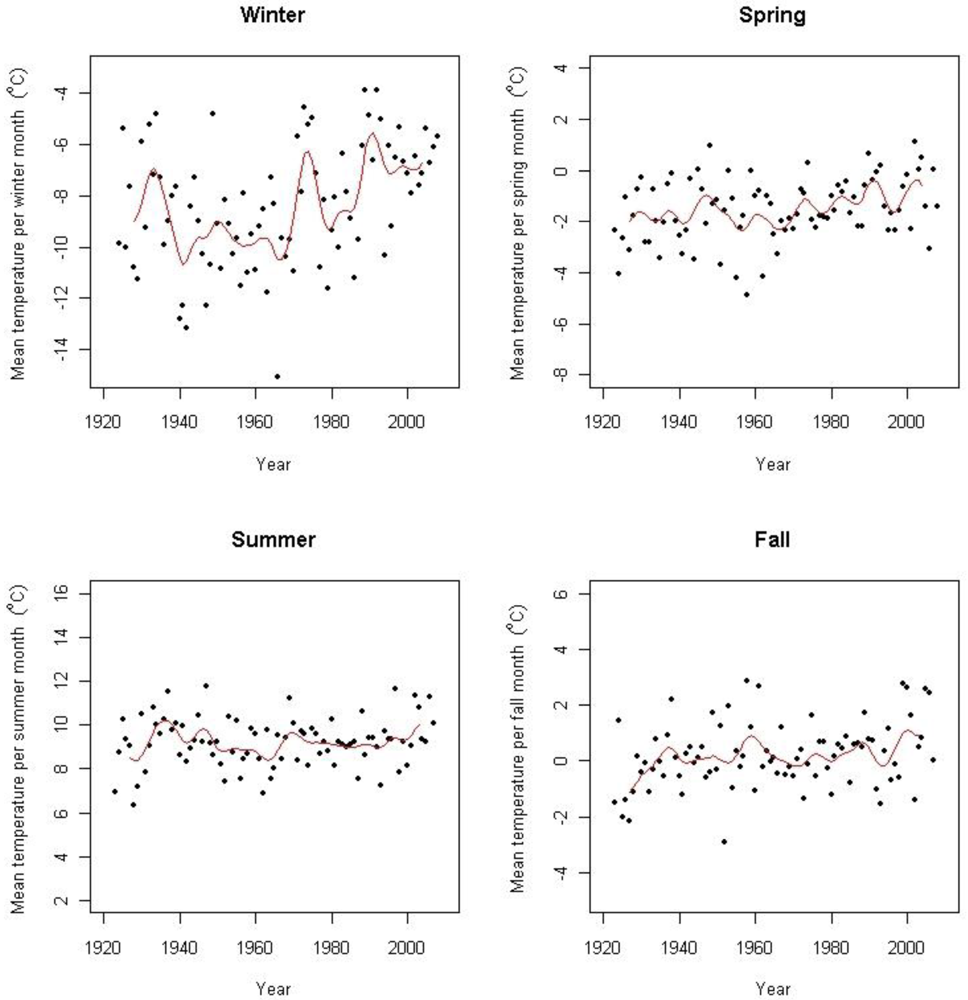
Based on data from several surrounding weather stations including the above-mentioned, Hanssen-Bauer [3] found an increase of 0.06 °C per decade from 1875 to 2004. According to Hanssen-Bauer [3] there has been two periods of warming during this period; the first one starting in the beginning of the 20th century with a peak in the 1930s, and a second period starting in the 1960s which is still ongoing, both with an increase of 0.34 °C per decade. Isaksen et al. [42] has shown an accelerated warming during the last decade based on results from thermal time series data from boreholes in permafrost at Juvasshøe (61°40′N, 8°22′E) at 129 m depth. Figure 2 shows the seasonal temperature trends in the period for Fokstugu weather station. At Fokstugu there are positive trends for winter mean temperature (0.034 ± 0.012 °C year−1), for spring mean temperature (0.014 ± 0.004 °C year−1), and for autumn mean temperature (0.010 ± 0.004 °C year−1) for the period 1923–2008, but no detectable trend for summer mean temperature. The annual trend is 0.017 (± 0.002) °C year−1 for the period March 1923 to May 2008, but with a steeper trend of 0.047 (± 0.008) °C year−1 for the last 30 years (June 1978–May 2008). At the weather station Kongsvoll, the annual trend is of 0.050 (± 0.016) °C year−1 from 1980 to 2004, while there is no detectable trend at the weather station Snøheim.
There is no significant trend for annual temperature for the study period 2001–2008 at Fokstugu (0.100 ± 0.232 °C year−1 (ns)), but the winter temperature isolated shows a significant increase (0.258 ± 0.256 °C year−1 (p = 0.049)).
Using data from Fokstugu, Syverhuset [37] calculated the length of the growing season, defined as the period from the first day after the last day of snow in spring to the last day before a permanent snow cover in autumn, increased by 0.62 days on average per year from 1969 to 2004. Likewise, the effective temperature sum during the growing season increased on average 2.447 °C per year at Fokstugu from 1969 to 2004. Syverhuset [37] calculated the effective temperature sum as the sum of all daily mean temperatures above 0 °C during the growing season, which is an adjustment of Laaksonen's definition to alpine plants [43].
For annual precipitation there is a positive trend corresponding to an increase of 1.774 mm per year at Fokstugu from 1923 to 2008. Splitting into seasons there is a positive trend in the monthly mean precipitation corresponding to an increase of 0.127 mm per year in spring months and an increase of 0.110 mm per year in autumn months, while there is no trend for summer and winter precipitation.
2.3. Study Design
The standardized design “GLORIA Multi-Summit Approach” [4-45] is used. A permanent site was set up in 2001, consisting of four 3 × 3 m quadrate clusters 5 height meters below the highest summit point (HSP) in the four cardinal (N, W, E, S) compass directions on each summit. In all corner 1×1 m quadrates (in total 16 on each summit) percentage cover and frequency counts in 10 × 10 cm quadrates of vascular plants were recorded, both in 2001 and in 2008. Percentage cover of lichens on species level was recorded in the cases where it was possible to determine the species in the field. Each of the analyzed 1 × 1 m quadrates were photographed for visual comparison.
Each summit was divided into eight summit area sections; one section in each of the four cardinal compass directions between the HSP and 5 height meters below the HSP area and similar between 5 and 10 height meters below the HSP. The area of the sections thus depended on the steepness of the terrain. In each summit area section, a complete species list was recorded.
Soil temperature was measured at the study sites. In each of the central quadrates of the 3 × 3 m quadrate clusters, a temperature logger (StowAway TidbiT −20/+50 °C mini-data loggers, Onset Computer Corporation, Massachusetts, U.S.) was buried 10 cm below the surface, measuring the temperature every hour. The loggers were first installed in July 2001, and were later replaced in August 2002 and August 2005. The temperature analysis in this study is based on the logger data from installation in 2001 to July 2008.
In this paper nomenclature for vascular plants follows Lid et al. [46], and for lichens, Santesson et al. [47].
2.4. Statistical Analyses
All statistical analyses, unless otherwise stated, were performed using the statistical software R version 2.8.1 (The R Foundation, Vienna, Austria).
In order to correct for seasonal and random variation in each of the 16 time series of soil temperature, time series were decomposed for monthly means into trend, seasonal and remainder components using a seasonal trend decomposition procedure based on Loess (STL) [48]. Missing values were replaced with the average temperature for that month for all other available years. A straight line model was fitted to each of the resulting trend curves to see if there was a tendency of temperature increase in the soil.
We also studied the evolution of soil temperatures for each season separately. Winter was defined as December to February, spring as March to May, summer as June to August, and autumn as September to November. Seasonal mean temperatures were calculated for each summit and year where means were taken over all time series from the same summit. A straight line model was thereafter fitted to each of the 16 time series of seasonal means.
A repeated measures ANOVA [49], after square root transformation of the response variable, was used to investigate whether the species richness for vascular plants in the 1 × 1 m quadrates had changed from 2001 to 2008. Exposition (N, W, E, S) and summit were treated as fixed factors, and their main effects, their interaction, as well as their interactions with year were included in the linear model. The highest summit, Storkinn, was removed from this analysis due to the low number of observations of vascular plants in the 1 × 1 m quadrates there.
A repeated measures ANOVA was also used to investigate whether the number of species had changed in the summit area sections between 2001 and 2008. Measurements of species number were square root transformed before analysis.
In order to test whether there had been a change in the composition of vascular plant and lichen communities, a distance based, nonparametric MANOVA was carried out using the program DISTLM v.5 [50,51]. Community composition was measured as a multivariate response of species abundance values. Abundance of vascular plants was measured either as percentage cover or frequency counts, while percentage cover measured lichen abundance. The linear model was a multivariate version of the model used in the analyses of species richness and the analyses were based on chi square distances. Significance probabilities of test statistics (pseudo Fs) were estimated by permutation tests with 999 permutations under the full model [52]. To construct design matrices corresponding to factors or interaction terms in the ANOVA design, the computer program XMATRIX [53] was used. Separate analyses were carried out for frequency and cover data for vascular plants and cover data for lichens. Lichens that had been problematic to identify during field work were excluded from the analysis. Where an interaction effect between year and summit was found, the data were split with respect to summit and analyzed separately using the same procedure.
To test if there had been any changes in the cover or abundance of single species in the quadrates, a t-test, a Wilcoxon's signed-rank test or a binomial test was conducted for each species, both vascular plants and lichens, on each of the four summits. Prior to selection of test, the data distribution was examined and the most powerful test was always selected if the test requirements were met. For vascular plants the tests were carried out both with frequency and cover data. Only species present in more than three plots in both years were considered.
3. Results
3.1. Soil Temperature
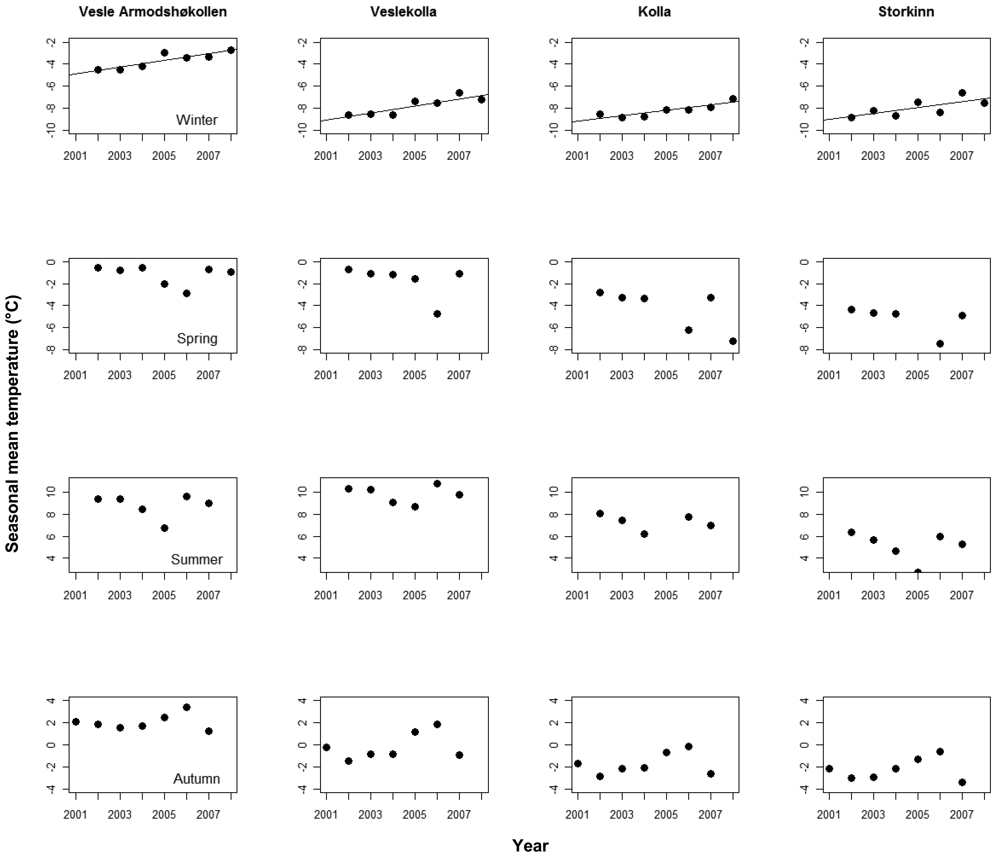
We found significant, positive trends in mean monthly temperatures in nine of the 16 logger time series after correcting for seasonal effects, in three time series at Vesle Armodshøkollen (N,E,S), in four at Veslekolla, and in one at each of Kolla (N) and Storkinn (S). One time series at Storkinn (E) was ended in 2005 due to logger failure, while we found no trends in the remaining six time series (results not shown). When looking at the four seasons separately for the logger data, only winter temperatures showed positive trends (Figure 3).
3.2. Species Richness of Vascular Plant Species
The absolute number of vascular plant species observed, increased at the three lowest summits from 2001 to 2008 (Table 1). The design, however, did not allow any statistical evaluation of these observations. Table 2 gives an overview over new species found at the summits in 2008 compared to 2001 and species lost in the same period.
Table 1 shows total number of species in the summit area sections. There was a significant summit by year interaction from 2001 to 2008 (F = 4.080, df = 3, 24, p = 0.018) and the data was therefore split by summit and reanalyzed. Only the lowest summit, Vesle Armodshøkollen, had a significant increase in number of species (F = 17.661, df = 1, 4, p = 0.014).
Table 3 shows total number of species in the 1 × 1 m quadrates for each summit. There was a significant summit by year interaction from 2001 to 2008 (F = 28.41, df = 2, 36, p < 0.001) and the data was therefore split by summit and reanalyzed. Only the lowest summit, Velse Armodshøkollen, had a significant increase in number of species per quadrate (F = 73.42, df = 1, 12, p < 0.001).
3.3. Species Composition and Single Species Response
An interaction effect between summit and year was found when analyzing the species composition based on species cover of vascular plants in the quadrates (pseudo-F = 1.829, df = 3, 48, p = 0.051), and the data were therefore split with respect to summit. There has been a significant change in the species composition of plant cover from 2001 to 2008 in the quadrates at the two lowest summits, Vesle Armodshøkollen (pseudo-F = 2.675, df = 1, 12, p = 0.017) and Veslekolla (pseudo-F = 4.857, df = 1, 12, p = 0.005). No change was discovered at the other two summits. At Vesle Armodshøkollen there was also a year by exposition interaction (pseudo-F = 1.937, df = 3, 12, p = 0.014), while this effect was marginally significant at Veslekolla (pseudo-F = 1.916, df = 3, 12, p = 0.071), indicating non-parallel changes in the four expositions
Neither changes in species composition of lichens in the quadrates, nor any changes in species composition of vascular plants in the summit area sections were found.
Table 4 gives an overview over species present in at least three quadrates on a summit, which showed significant changes from 2001 to 2008. As can be seen from the table, four vascular plants significantly increased in cover at Vesle Armodshøkollen while five lichens significantly decreased.
At Veslekolla only Juncus trifidus increased in cover, while also Betula nana and Loiseleuria procumbens increased in frequency. Here no significant changes for any lichens were found.
Both on Kolla and Storkinn two species of lichens significantly increased in cover. No significant changes were found for any vascular plants.
4. Discussion
4.1. Climate and Climate Change
The annual increase in soil temperature during the study period shows a steeper increase at the two lowest summits where positive trends were found for seven out of eight loggers, while positive trends were only found for two out of seven at the two highest summits.
Meteorological data from the area show an increasing trend and the temperature development at Fokstugu from 1923 to 2008 corresponds to an increase of 0.17 °C per decade. Both Hanssen-Bauer [3] and Isaksen et al. [42] indicate an accelerated warming during the last decade. The soil temperature data at the lowest summits show a significant trend and thus give some support to this, but a similar significant trend cannot be found at any of the weather stations during the period of the study.
There is no obvious explanation why the increase in winter temperatures seems to decrease with altitude. One reason might however be that the study area experiences temperature inversion, a phenomenon known to occur in the interior of Scandinavia during winter [54], especially under clear sky conditions. This means that Foktstugu at 972 m a.s.l. during winter sometimes experiences temperatures several degrees below the temperatures at Snøheim at 1,505 m. a.s.l. A lower frequency of clear sky conditions could change the winter temperatures, affecting winter temperatures at lower altitudes more than at higher altitudes. Thus, a change in the frequency of temperature inversion may cause temperature trends to decrease with altitude. The increased temperature during winter at Fokstugu gives support to this theory.
The more pronounced temperature increase for winter than for the other seasons at Fokstugu is different from the results of Hanssen-Bauer [3], who only found a significant trend for the spring temperatures in the region including Dovrefjell from 1875 to 2004. The soil temperature from this project is in line with the data from Fokstugu; 10 of the 15 loggers showed a positive trend for winter temperatures. There is a good correlation between July temperature and boundaries of the vegetation zones [55], but also climate related events during other seasons have been found to have important effects on plant performance [11,56]. The timing and length of the snow free season is of great importance to plant growth [56], and the prolonged growing season at Fokstugu may thus be a potential driver for changes in vegetation patterns in the area which then will be more pronounced at the lower altitudes in the study area.
Jonas et al. [56] found significant differences in plant growth between sites with different average duration of the snow-covered period, but over a 10 year period they did not observe any new changes. They argued that between-year effects may represent short time effects of alpine plant communities to climate changes, whereas between-site effects might represent the long-term responses of plant growth to the changing climate. Since the length of the growing season at Fokstugu has increased over a period of 35 years, it may have had time to lead to measurable changes in the vegetation by now.
The effective temperature sum during the growing season has also increased at Fokstugu from 1969 to 2004. Laaksonen [43] argues that both the warmth and the duration of the vegetative period should be taken into account to obtain a more valid indicator of the advantage of the growing season, and emphasizes the use of the effective temperature sum as a useful indicator.
The precipitation in the area has primarily increased in spring and autumn, and precipitation in the outset and at the end of the snow free season has, together with the temperatures during the same periods, been identified as key meteorological factors influencing plant growth [56]. However, the magnitude of increase in monthly mean precipitation at Fokstugu is small and will most likely not have any large effect on the growth and distribution of plants, at least not in the short term.
4.2. Changes in Species Richness
A significant increase in species richness of vascular plants was found in the quadrates and in the summit area sections of the lowest summit. This increase is in line with most other similar studies in alpine areas where the changes are attributed to climate warming [6,13,18-25]. It is also in line with the expected response under a warming climate [11]. Other explanations are still possible, which will be discussed below.
4.3. Changes in Species Composition and in Abundance of Single Species
A significant change in species composition from 2001 to 2008 was found at the two lowest summits using cover data from the quadrates. For vascular plants it is the cover of woody plants and graminoids that increases at the two lowest summits. This is in line with other studies. Bahn and Körner [27] found that frequent graminoids and prostrate dwarf shrubs, in addition to viviparous and hemiparasitic species, showed the most pronounced increases over a period of 13 years in the Austrian Alps, and Cannone et al. [28] found a rapid expansion of shrubs within the alpine belt and an upward migration of the alpine grassland in the Alps. In Alaska, Sturm et al. [57] found an increase in shrub abundance over a period of 50 years. Odland et al. [25] found an average upward movement of 7.3 m for woody plants during the last 40 years at 13 summits in the southern Scandes. In all these studies, recent climate change is identified as an important factor driving the observed changes.
In an experimental study with warming in the Alps dwarf shrubs and graminoids showed a more pronounced response than herbaceous species [58]. However, a warming and nutrient addition experiment conducted in a Dryas octopetala heath at Finse, Norway, gave contrasting results. Here the dwarf shrubs Salix herbacea and S. reticulata decreased in abundance as a response to warming, but the results were not statistically significant [59]. In the same study, different responses from graminoids were found and Klanderud [59] concluded that the use of functional groups often found in studies on vegetation response to environmental changes may conceal information on responses of single species. This is in contradiction to Chapin et al. [60] who conclude that plant functional types are useful as a framework for predicting vegetation responses to the environment.
Syverhuset [37] analyzed quantitative changes of cover of vascular plants in the summit area sections used in this study. The abundance classes used were quite coarse and no significant changes were found. She stills point out a seeming increase in cover of three species at at Vesle Armodshøkollen. Two of these, namely the woody plant Arctous alpinus and the hemiparasitic Bartsia alpina are in line with the results of Bahn and Körner [27]. The third species is Solidago virgaurea. On the second highest summit, Kolla, she found the opposite effect. Here Salix herbacea changed from being common in five, and scattered in three, sections in 2001 to absent in four, and rare in three, sections in 2008.
We found no changes in the species composition of lichens, but a significant decline in cover was found for five species at Vesle Armodshøkollen. The decline in lichen cover is so distinct that it could be identified just by visual inspection (see photos in [33]). Chapin et al. [29] found a similar decrease in Alaska. They assumed that this was primarily caused by the expansion and overgrowth by dwarf shrubs. As can be seen from the photos in Michelsen et al. [33], this is not the case at Vesle Armodshøkollen where areas covered with lichens in 2001 were bare ground in 2007.
Interestingly, the changes in species composition are only revealed from cover and not from frequency data in the quadrates. This is an indication that the changes are primarily due to vegetative expansion of individuals already present and not so much a result of establishment of new individuals, which assumingly would be more scattered. Several of the species are clonal plants and clonal propagation might contribute relatively little to the increase in frequency within the quadrates, but still contribute to an increase in percentage cover. It is also important to bear in mind that some of the species found to increase in cover (Table 4) already had high frequency. Still, the results presented in Tables 1, 2 and 3 show that some new individuals obviously do establish, at least at the three lowest summits.
4.4. Changes with Respect to Summit
A range of vegetation changes are found from 2001 to 2008; an increased number of species, changes in species composition and changes in cover or frequency of single species. As a general conclusion the changes are larger at the lowest summits. The changes are especially pronounced at Vesle Armodshøkollen, located right above the tree limit in the low alpine zone. The number of species generally decreases with increasing altitude [9,61] and plant communities on calcareous soils are known to have a higher richness of vascular plants [62]. Both the altitude and the more calcareous bedrock in this area thus form the basis for the higher species richness at this summit compared to the other study summits. Thus, there are more potential invaders and more species present at the summit that can respond to environmental changes and expand their cover.
At the same time, the changes at Veslekolla were larger than at Kolla with a significant change in species composition, significant changes in frequency for three species and a higher number of new species, although not significant. Here Kolla had a higher number of species to start with so the initial number of species cannot be the only factor explaining the variation in responses among summits. The soil temperature data (Figure 1) also show that the temperature changes are more pronounced at Vesle Armodshøkollen and Veslekolla than at the two highest summits and a relation between changes in temperature and vegetation is thus an obvious possibility.
In similar studies from the Alps, the largest increase in species richness was found in the upper alpine and subnival zone [26] and in the subnival/nival zone [13]. Erschbamer et al. [26] even found that the species richness decreased at the lower summits. Hence, the results from the Alps are contrary to the results from Dovrefjell with respect to at what altitude the changes are more pronounced. However, the conditions at the study summits in the Alps and at the study summits at Dovrefjell are difficult to compare. For instance, the total number of vascular species at most of the summits analyzed by Erschbamer et al. [26] is much higher than at the study summits at Dovrefjell.
4.5. Alternative Explanations to Observed Vegetation Changes
Since this study is observatory and correlative, final causal relationships cannot be drawn and all possible causes must be considered. In particular there are several possible mechanisms by which large herbivores may influence vegetation patterns and changes in grazing and trampling impact are the most relevant in the area.
According to Gaare [38] reduced grazing could over time give a buildup of soil humus and an increased water storage capacity in the soil, enabling vascular plants to compete with lichens and in the long term result in graminoids and dwarf shrubs replacing lichens. The increased abundance of dwarf shrubs and graminoids found at the lower summits could therefore be a natural consequence of a long lasting build up of soil humus. This is a plausible description of the conditions at Vesle Armodshøkollen in the time after the construction of the railway finished in 1921 [38]. This divided the range of the reindeer herd in the Snøhetta area and the old east-west migration routes were not used regularly for a period. They were re-established as the population grew and used regularly between 1957 and 1983. However, after this time the use of the eastern winter ranges in the area around Vesle Armodshøkollen has not been reported [38]. Even though reindeer and sheep have been present at the area in the years before the first analysis in 2001, the numbers might not have been high enough to prevent a build up of the soil humus layer. If this is the driver of the increase of graminoids and dwarf shrubs, it might be expected that this will be reversed due to the recent increase in grazing pressure in the area. The areas of bare soil found on Vesle Armodshøkollen in 2008, previously covered by lichens, are potentially susceptible to wind and erosion, which could eventually remove the accumulated layer of humus and once again give the lichens a competitive advantage.
Trampling by the increasing numbers of herbivores could have caused a disturbance and in itself explain the changes in species diversity [cf. 63]. Plant species richness is expected to be greatest at a moderate level of disturbance [64] and empirical data from alpine tundra in Norway show increased diversity of mosses, lichens, graminoids and dwarf shrubs, on ridges exposed to moderate grazing by reindeer during winter, possibly because of exposure of bare ground, reduction of competition and increased nitrogen turnover [65]. Vistnes and Nellemann [65] also conclude that heavy grazing may be beneficial to a range of colonizing species in the short term, while in the long term the vegetation cover might be destroyed by erosion. However, this is not supported by Olofsson [66] who reports that the short-term effects from increase in reindeer grazing can give good indications of most of the long-term effects on species richness.
Since the number of herbivores has increased in the area over the last years, it cannot be ruled out as a possible explanation to the increased species richness found at the lowest summit. It is, however, difficult to determine the exact grazing pressure and since reindeer move in herds, the grazing pressure might also vary substantially from location to location, depending on the movements of the herds. Continued observations are required to reveal if the trend of increasing species richness continues, accelerates or reverses.
Since there are large differences in the tolerance to grazing between coexisting shrub species [64], the changes in cover and frequency of species from 2001 to 2008 can give an indication on which explanation is most likely to explain the changes. Betula nana was one of the vascular plants that increased in cover and frequency from 2001 to 2008. It is only present at the two lowest summits and therefore seems to increase where it has the possibility. Exclusion of grazing reindeer has been shown to lead to an increase in cover for Betula nana, as well as an increase in the cover of dwarf shrubs, forbs and grasses [67]. Dwarf shrub dominated vegetation on tundra heaths in areas with light grazing pressure from reindeer will often rapidly change into grasslands when the grazing pressure increased [66]. The cover of Betula nana has been shown to increase under moderate grazing of sheep but decrease under a high grazing pressure [68].
As previously mentioned, Vesle Armodshøkollen probably experiences little or no grazing by sheep, however; trampling is likely to occur as the areas might serve as a resting ground. The uncertainty regarding whether the grazing pressure by reindeer can be classified as low, moderate or high, leaves some dubiety concerning what response to expect, but it does not seem likely that the increase of Betula nana is a response to increased grazing pressure. This is further supported by the increase of Salix herbacea and Vaccinium vitis-idaea, both of which are highly sensitive to grazing [69]. The data from Syverhuset [37] also show an increase of Solidago virgaurea in most sectors at Vesle Armodshøkollen. Austrheim et al. [68] found this to be negatively affected by high densities of sheep, giving additional indications on low grazing pressure.
Still, some graminoids have been shown to increase at high intensities of grazing by sheep [68] and reindeer [65]. Vistnes and Nellemann [65] found that Juncus trifidus established at heavily grazed sites, so the increase at Veslekolla might be caused by the increased numbers of herbivores.
Grazing and trampling by reindeer can cause a decrease of the cover of lichens [65,70], as well as giving sites for establishment of new species. This could explain the decline in cover of lichens at Vesle Armodshøkollen and the increased number and cover of vascular plants during the period. In an experimental warming study in Alaska, Chapin et al. [29] found that lichens were outcompeted by vascular plants. This does not seem to be a plausible explanation here since areas covered by lichens in 2001 are turned into bare ground [33], and a trampling effect cannot be excluded.
The changes of single species of vascular plants do thus not give an unambiguous answer to which driver is most likely to explain the vegetation changes found from 2001 to 2008. It seems most likely that the changes are caused by interactions of a number of factors, including climate changes and plant-herbivore interactions.
4.6. Observational Bias
In an observatory study relying on collection of field data, observer bias cannot be eliminated [71]. In this study this is particularly a problem for the species lists for the summit area sections due to their relative large area, while the problem is less for the smaller 1 × 1 m quadrates [71]. The species list given in Table 3 as well as the absolute numbers in Table 1 and 2 must thus be treated carefully since, in particular, small seedlings easily can be overlooked. These results are only treated qualitatively in this study, and there is no reason to believe that potential bias is unidirectional [71] and hence influencing the conclusions to an unacceptable degree.
Observational bias is generally lower in 1 × 1 m quadrates [71] and several precautions were taken during measurement; use of standardized protocols, generally more than one observer, and the investigators from 2001 were initiating the work in 2008 and taking part in almost the entire fieldwork (except a few days on Kolla). Also here there is no reason to believe that potential bias is unidirectional and it is thus not likely that a substantial part of the significant changes found are caused by observational bias.
5. Conclusions
Both data from weather stations in the area and soil temperature measured from 2001 to 2008 show an increasing temperature. It also seems as the increase during the study period is more pronounced at the lower summits. There is thus evidence that there has been an increased temperature in the area both prior to the onset of the study and during the study period, giving both a longer growing season and a higher temperature sum in the growing season.
Species richness increased at the lowest summit in the study from 2001 to 2008, and the species composition at the two lowest summits changed during this period as well. Some species of woody plants and graminoids were found to increase in cover or frequency at the two lowest summits, whereas several species of lichens decreased in cover at the lowest summit. At the two highest summits, two species of lichens increased in cover from 2001 to 2008. The changes are very much in line with what could be expected due to increased temperature based on findings from other studies.
Climate change is thus a plausible explanation for the observed changes in vegetation, but since this is an observatory and correlative study, other causes cannot be ruled out. Changes in grazing and trampling pressure can also cause similar changes, at least in a combination with the observed changes in temperature.

| Number of taxa 2001 | Number of taxa 2008 | |
|---|---|---|
| Vesle Armodshøkollen | 56 (28.6 ± 8.2) | 60 (33.8 ± 4.3) |
| Veslekolla | 14 (10.6 ± 2.0) | 18 (11.6 ± 2.3) |
| Kolla | 21 (11.5 ± 3.1) | 22 (11.4 ± 2.9) |
| Storkinn | 6 (2.8 ± 2.0) | 6 (2.8 ± 1.8) |
| Summit | New species | Lost species |
|---|---|---|
| Vesle Armodshøkollen | Betula nana x pubescens | Artemisia norvegica |
| Carex atrata | Huperzia selago | |
| Carex saxatilis | Myosotis decumbens | |
| Diapensia lapponica | Pedicularis oederi | |
| Euphrasia sp. | Poa pratensis ssp. alpigena | |
| Melampyrum pratense | ||
| Phyllodoce caerulea | ||
| Silene uralensis | ||
| Viola biflora | ||
| Veslekolla | Arctostaphylos uva-ursi | (no lost taxa) |
| Bartsia alpina | ||
| Luzula spicata | ||
| Solidago virgaurea spp. | ||
| lapponica | ||
| Kolla | Carex rupestris | Cardamine bellidifolia |
| Poa arctica | Draba fladnizensis | |
| Potentilla crantzii | ||
| Storkinn | (no new taxa) | (no lost taxa) |
| Number of taxa 2001 | Number of taxa 2008 | |
|---|---|---|
| Vesle Armodshøkollen | 21 (7.7 ± 2.4) | 29 (9.3 ± 2.6) |
| Veslekolla | 9 (4.5 ± 1.0) | 9 (4.5 ± 1.4) |
| Kolla | 5 (1.0 ± 1.3) | 4 (0.9 ± 1.1) |
| Storkinn | 2 (0.2 ± 0.4) | 2 (0.2 ± 0.4) |
| Species | Type | Change in cover | P | Change in frequency | P |
|---|---|---|---|---|---|
| Vesle Armodshøkollen | |||||
| Betula nana | V | ↑ | 0.021 (w) | No change | - |
| Festuca ovina | V | ↑ | 0.002 (t) | ↑ | 0.004 (b) |
| Salix herbacea | V | ↑ | 0.004 (b) | ↑ | 0.039 (b) |
| Vaccinum vitis-idaea | V | ↑ | 0.003 (t) | No change | - |
| Alectoria ochroleuca | L | ↓ | 0.035 (b) | No data | - |
| Flavocetraria cucculata | L | ↓ | 0.010 (w) | No data | - |
| Flavocetraria nivalis | L | ↓ | 0.021 (b) | No data | - |
| Cladonia arbuscula | L | ↓ | 0.002 (b) | No data | - |
| Cladonia stellaris | L | ↓ | 0.039 (b) | No data | - |
| Veslekolla | |||||
| Betula nana | V | No change | - | ↑ | 0.003 (b) |
| Juncus trifidus | V | ↑ | 0.021 (b) | ↑ | 0.004 (b) |
| Loiseleuria procumbens | V | No change | - | ↑ | 0.041 (t) |
| Kolla | |||||
| Alectoria ochroleuca | L | ↑ | 0.002 (t) | No data | - |
| Thamnolia vermicularis | L | ↑ | 0.006 (b) | No data | - |
| Storkinn | |||||
| Alectoria nigricans | L | ↑ | 0.035 (w) | No data | - |
| Alectoria ochroleuca | L | ↑ | <0.001 (b) | No data | - |
Acknowledgments
The field work and data preparation for 2001 was financed by EUs 5th Framework Program through GLORIA Europe. The fieldwork and data preparation for 2008 was financed by the Norwegian Directorate for Nature Management. We thank three anonymous referees for constructive comments to the manuscript.
References
- Alcamo, J.; Moreno, J.M.; Nováky, B.; Bindi, M.; Corobov, R.; Devoy, R.J.N.; Giannakopoulos, C.; Martin, E.; Olesen, J.E.; Shvidenko, A. Europe. In Climate Change 2007—Impacts, Adaptation and Vulnerability. Working Group II Contribution to the Fourth Assessment Report of the IPCC; Parry, M.L., Canziani, O.F., Palutikof, J.P., van der Linden, P.J., Hanson, C.E., Eds.; Cambridge University Press: Cambridge, UK, 2007; pp. 541–580. [Google Scholar]
- Menzel, A.; Fabian, P. Growing season extended in Europe. Nature 1999, 397, 659–659. [Google Scholar]
- Hanssen-Bauer, I. Regional Temperature and Precipitation Series for Norway: Analyses of Time-Series Updated to 2004; Met.no report 15/2005–Climate; Norwegian Meteorological Institute: Oslo, Norway, 2005. [Google Scholar]
- Hughes, L. Biological consequences of global warming: is the signal already apparent? Trends Ecol. Evol. 2000, 15, 56–61. [Google Scholar]
- McCarty, J.P. Ecological consequences of recent climate change. Conserv. Biol. 2001, 15, 320–331. [Google Scholar]
- Walther, G.R.; Post, E.; Convey, P.; Menzel, A.; Parmesan, C.; Beebee, T.J.C.; Fromentin, J.M.; Hoegh-Guldberg, O.; Bairlein, F. Ecological responses to recent climate change. Nature 2002, 416, 389–395. [Google Scholar]
- Chapin, F.S.I.; Körner, C. Arctic and alpine biodiversity—Patterns, causes and ecosystem consequences. Trends Ecol. Evol. 1994, 9, 45–47. [Google Scholar]
- Price, M.F.; Barry, R.G. Climate change. In Mountains of the World—A Global Priority. A Controbution to Chapter 13 of Agenda 21; Messerli, B., Ives, J.D., Eds.; The Parthenon Publishing Group: London, UK, 1997. [Google Scholar]
- Körner, C. Alpine Plant Life: Functional Plant Ecology of High Mountain Ecosystems; Springer: Berlin, Germany, 2003. [Google Scholar]
- Pauli, H.; Gottfried, M.; Hohenwallner, D.; Reiter, K.; Grabherr, G. Ecological Climate Impact Research in High Mountain Environments: GLORIA (Global Observation Research Initiative in Alpine Environments)—its Roots, Purpose and Long-term Perspectives. Adv. Glob. Change Res. 2005, 23, 383–391. [Google Scholar]
- Aerts, R.; Cornelissen, J.H.C.; Dorrepaal, E. Plant performance in a warmer world: General responses of plants from cold, northern biomes and the importance of winter and spring events. Plant Ecol. 2006, 182, 65–77. [Google Scholar]
- Körner, C. Impact of atmospheric changes on high mountain vegetation. In Mountain Environments in Changing Climates; Beniston, M., Ed.; Routledge: London, UK, 1994. [Google Scholar]
- Pauli, H.; Gottfried, M.; Reier, K.; Klettner, C.; Grabherr, G. Signals of range expansions and contractions of vascular plants in the high Alps: observations (1994–2004) at the GLORIA master site Schrankogel, Tyrol, Austria. Glob. Change Biol. 2007, 13, 147–156. [Google Scholar]
- Skre, O. Sensitivity of alpine plants to potential climate changes. In Potential Ecological Impacts of Climate Change in the Alps and Fennoscandian Mountains; Guisan, A., Holten, J.I., Spichiger, R., Tessier, R., Eds.; Editions des Conservatoire et Jardin Botaniques: Genève, Switzerland, 1995. [Google Scholar]
- Theurillat, J.P.; Guisan, A. Potential impact of climate change on vegetation in the European Alps: A review. Climatic Change 2001, 50, 77–109. [Google Scholar]
- Halloy, S.R.P.; Mark, A.F. Climate-Change Effects on Alpine Plant Biodiversity: A New Zealand Perspective on Quantifying the Threat. Arct. Antarct. Alp. Res. 2003, 35, 248–254. [Google Scholar]
- Pauli, H.; Gottfried, M.; Dirnböck, T.; Dullinger, S.; Grabherr, G. Assessing the Long-Term Dynamics of Endemic Plants at Summit Habitats. In Alpine biodiversity in Europe; Nagy, L., Grabherr, G., Körner, C., Thompson, D.B.A., Eds.; Springer: Berlin, Germany, 2003. [Google Scholar]
- Grabherr, G.; Gottfried, M.; Pauli, H. Climate effects on mountain plants. Nature 1994, 369, 448–448. [Google Scholar]
- Holzinger, B.; Hülber, K.; Camenisch, M.; Grabherr, G. Changes in plant species richness over the last century in the eastern Swiss Alps: elevational gradient, bedrock effects and migration rates. Plant Ecol. 2006, 195, 179–196. [Google Scholar]
- Parolo, G.; Rossi, G. Upward migration of vascular plants following a climate warming trend in the Alps. Basic Appl. Ecol. 2006, 9, 100–107. [Google Scholar]
- Lenoir, J.; Gégout, J.C.; Marquet, P.A.; de Ruffray, P.; Brisse, H. A significant upward shift in plant species optimum elevation during the 20th century. Science 2008, 320, 1768–1771. [Google Scholar]
- Walther, G.R.; Beißner, S.; Burga, C. Trends in the upward shift of alpine plants. J. Veg. Sci. 2005, 16, 541–548. [Google Scholar]
- Klanderud, K.; Birks, H.J.B. Recent increases in species richness and shifts in altitudinal distributions of Norwegian mountain plants. Holocene 2003, 13, 1–6. [Google Scholar]
- Kullman, L. Long-term geobotanical observations of climate change impacts in the Scandes of West-Central Sweden. Nord J. Bot. 2007, 24, 445–467. [Google Scholar]
- Odland, A.; Høitomt, T.; Olsen, S.L. Increasing vascular plant richness on 13 high mountain summits in southern Norway since early 1970s. Arct. Antarct. Alp. Res. 2010, 42, 458–470. [Google Scholar]
- Erschbamer, B.; Kiebacher, T.; Mallaun, M.; Unterluggauer, P. Short-term signals of climate change along an altitudinal gradient in the South Alps. Plant Ecol. 2008, 202, 79–89. [Google Scholar]
- Bahn, M; Körner, C. Recent Increases in Summit Flora Caused by Warming in the Alps. In Alpine Biodiversity in Europe; Nagy, L., Grabherr, G., Körner, C., Thompson, D.B.A., Eds.; Springer: Berlin, Germany, 2003. [Google Scholar]
- Cannone, N.; Sgorbati, S.; Guglielmin, M. Unexpected impacts of climate change on alpine vegetation. Front Ecol. Environ. 2007, 5, 360–364. [Google Scholar]
- Chapin, F.S.I.; Shaver, G.R.; Giblin, A.E.; Nadelhoffer, K.J.; Laundre, J.A. Responses of Arctic tundra to experimental and observed changes in climate. Ecology 1995, 76, 694–711. [Google Scholar]
- Grabherr, G.; Gottfried, M.; Pauli, H. GLORIA: A Global Observation Research Initiative in Alpine environments. Mt. Res. Dev. 2000, 20, 190–191. [Google Scholar]
- Grabherr, G.; Gottfried, M.; Pauli, H. Climate change impacts in Alpine environments. Geography Compass 2010, 4, 1133–1153. [Google Scholar]
- GLORIA. GLobal Observation Research in Alpine Environments, Available online: http://www.gloria.ac.at (accessed on 10 October 2010).
- Michelsen, O.; Holten, J.I.; Syverhuset, A.O. An analysis of alpine flora to investigate effects of climate change—preliminary results from a study in Dovre mountain region. Blyttia 2009, 67, 50–57. [Google Scholar]
- Bretten, S.; Gjershaug, J.O.; Gjærevoll, O.; Haugland, K.; Sande, J.; Skogland, T.; Sollid, J.L.; Stabell, E.; Stenvik, L.F.; Sørbel, L. Dovrefjell.; Grøndahl Dreyer: Oslo, Norway, 1994. [Google Scholar]
- The Geological Survey of Norway (NGU). Bedrock Map. Available online: http://www.ngu.no/kart/bg250/ (accessed on 27 April 2009).
- Elven, R.; Fremstad, E.; Hegre, H.; Nilsen, L.; Solstad, H. Botaniske verdier i Dovrefjell-området; NTNU Vitenskapsmuseet: Trondheim, Norway, 1996. [Google Scholar]
- Syverhuset, A.O. Recent Changes in Temperature and Vegetation on Dovrefjell. Master thesis, Norwegian University of Science and Technology, Trondheim, Norway, 2009. [Google Scholar]
- Gaare, E. A hypothesis to explain lichen-Rangifer dynamic relationships. Rangifer 1997, 17, 3–7. [Google Scholar]
- Bretten, S. Moskusfeet. In Pattedyrene; Semb-Johanson, A., Frislid, R., Eds.; Cappelen: Oslo, Norway, 1990; pp. 171–190. [Google Scholar]
- Rekdal, Y.; Angeloff, M.; Hofsten, J. Vegetasjon og beite på Hardangervidda. Oppdragsrapport frå Skog og landskap 11/2009; The Norwegian Forest and Landscape Institute: Ås, Norway, 2009. [Google Scholar]
- Gaare, E. A preliminary report on winter nutrition of wild reindeer in the southern Scandes, Norway. In Comparative Nutrition of Wild Animals; Crawford, M.A., Ed.; Academic Press: New York, NY, USA, 1968; pp. 109–115. [Google Scholar]
- Isaksen, K.; Sollid, J.L.; Holmlund, P.; Harris, C. Recent warming of mountain permafrost in Svalbard and Scandinavia. J. Geophys. Res. 2007, 112, F02S04. [Google Scholar]
- Laaksonen, K. Effective temperature sums and durations of the vegetative period in Fennoscandia (1921–1950). Fennia 1979, 157, 171–197. [Google Scholar]
- Pauli, H.; Gottfried, M.; Hohenwallner, D.; Hülber, K.; Reiter, K.; Grabherr, G. GLORIA—The Multi Summit Approach. Field Manual, 3rd version ed. Available online: http://www.gloria.ac.at (accessed on 23 December 2010).
- Pauli, H., Gottfried, M., Hohenwallner, D., Reiter, K., Casale, R., Grabherr, G, Eds.; The GLORIA Field Manual—Multi-Summit Approach; Directorate-General for Research, European Commission: Luxemburg, 2004.
- Lid, J.; Lid, D.T.; Elven, R.; Alm, T. Norsk flora; Samlaget: Oslo, Norway, 2005. [Google Scholar]
- Santesson, R.; Moberg, R.; Nordin, A.; Tønsberg, T.; Vitikainen, O. Lichen-forming and licheniocolous fungi of Fennoscandia.; Museum of Evolution, Uppsala University: Uppsala, 2004. [Google Scholar]
- Cleveland, R.B.; Cleveland, W.S.; McRae, J.E.; Terpenning, I. STL: A seasonal-trend decomposition procedure based on loess. J. Off. Stat. 1990, 6, 3–73. [Google Scholar]
- Underwood, A.J. Experiments in Ecology. Their Logical Design and Interpretation Using Analysis of Variance; Cambridge University Press: Cambridge, UK, 1997. [Google Scholar]
- Legendre, P.; Anderson, M.J. Distance-based redundancy analysis: Testing multispecies responses in multifactorial ecological experiments. Ecol. Monogr. 1999, 69, 1–24. [Google Scholar]
- Anderson, M.J. DISTLM v.5: a FORTRAN Computer Program to Calculate a Distance Based Multivariate Analysis for a Linear Model; Department of Statistics, University of Auckland: Auckland, New Zealand, 2004. [Google Scholar]
- Anderson, M.J.; ter Braak, C.J.F. Permutation tests for multi-factorial analysis of variance. J. Stat. Comput. Simul. 2003, 73, 85–113. [Google Scholar]
- Anderson, M.J. XMATRIX: a FORTRAN Computer Program for Calculating Design Matrices for Terms in ANOVA Designs in a Linear Model; Department of Statistics, University of Auckland: Auckland, New Zealand, 2003. [Google Scholar]
- Benestad, R.E. Tentative probabilistic temperature scenarios for northern Europe. Tellus 2004, 56A, 90–101. [Google Scholar]
- Moen, A.; Lillethun, A.; Odland, A. Vegetation. National atlas of Norway; Norwegian Mapping Authority: Hønefoss, Norway, 1999. [Google Scholar]
- Jonas, T.; Rixen, C.; Sturm, M.; Stoeckli, V. How alpine plant growth is linked to snow cover and climate variablility. J. Geophys. Res. 2008, 113, G03013. [Google Scholar]
- Sturm, M.; Racine, C.; Tape, K. Increasing shrub abundance in the Arctic. Nature 2001, 411, 546–547. [Google Scholar]
- Kudernatsch, T.; Fischer, A.; Bernhardt-Römermann, M.; Clemens, A. Short-term effects of temperature enhancement on growth and reproduction of alpine grassland species. Basic Appl. Ecol. 2008, 9, 263–274. [Google Scholar]
- Klanderud, K. Species-specific responses of an alpine plant community under simulated environmental change. J. Veg. Sci. 2008, 19, 363–372. [Google Scholar]
- Chapin, F.S.I.; Bret-Harte, M.S.; Hobbie, S.E.; Zhong, H. Plant functional types as predictors of transient responses of arctic vegetation to global change. J. Veg. Sci. 1996, 10, 347–358. [Google Scholar]
- Holten, J.I. Altitude Ranges and Spatial Patterns of Alpine Plants in Northern Europe. In Alpine Biodiversity in Europe; Nagy, L., Grabherr, G., Körner, C., Thompson, D.B.A., Eds.; Springer: Berlin, Germany, 2003. [Google Scholar]
- Virtanen, R.; Dirnböck, T.; Dullinger, S.; Grabherr, G.; Pauli, H.; Studinger, M.; Villar, L. Patterns in the plant species richness of european high mountain vegetation. In Alpine Biodiversity in Europe; Nagy, L., Grabherr, G., Körner, C., Thompson, D.B.A., Eds.; Springer: Berlin, Germany, 2003. [Google Scholar]
- Hobbs, R.J.; Huenneke, L.F. Disturbance, diversity, and invasion: implications for conservation. Conserv. Biol. 1992, 6, 324–337. [Google Scholar]
- Plant Ecol.ogy; Crawley, M.J., Ed.; Blackwell Publishing: Oxford, UK, 1997.
- Vistnes, I.I.; Nellemann, C. Reindeer Winter Grazing in Alpine Tundra: Impacts on Ridge Community Composition in Norway. Arct. Antarct. Alp. Res. 2008, 40, 215–224. [Google Scholar]
- Olofsson, J. Short- and long-term effects of changes in reindeer grazing pressure on tundra heath vegetation. J. Ecol. 2006, 94, 431–440. [Google Scholar]
- Pajunen, A.; Virtanen, R.; Roininen, H. The effects of reindeer grazing on the composition and species richness of vegetation in forest-tundra ecotone. Polar. Biol. 2008, 31, 1233–1244. [Google Scholar]
- Austrheim, G.; Mysterud, A.; Pedersen, B.; Halvorsen, R.; Hassel, K.; Evju, M. Large scale experimental effects of three levels of sheep densities on an alpine ecosystem. Oikos 2008, 117, 837–846. [Google Scholar]
- Wielgolaski, F.E. Comparison of plant structure on grazed and ungrazed tundra meadows. In Fennoscandian Tundra Ecosystems; Wielgolaski, F.E., Ed.; Springer: Berlin, Germany, 1975. [Google Scholar]
- Löffler, J.; Pape, R. Diversity Patterns in Relation to the Environment in Alpine Tundra Ecosystems of Northern Norway. Arct. Antarct. Alp. Res. 2008, 40, 373–381. [Google Scholar]
- Vittoz, P.; Bayfield, N.; Brooker, R.; Elston, D.A.; Duff, E.I.; Theurillat, J.P.; Guisan, A. Reproducibility of species lists, visual cover estimates and frequency methods for recording high-mountain vegetation. J. Veg. Sci. 2010, 21, 1035–1047. [Google Scholar]
© 2011 by the authors; licensee MDPI, Basel, Switzerland. This article is an open access article distributed under the terms and conditions of the Creative Commons Attribution license (http://creativecommons.org/licenses/by/3.0/).
Share and Cite
Michelsen, O.; Syverhuset, A.O.; Pedersen, B.; Holten, J.I. The Impact of Climate Change on Recent Vegetation Changes on Dovrefjell, Norway. Diversity 2011, 3, 91-111. https://doi.org/10.3390/d3010091
Michelsen O, Syverhuset AO, Pedersen B, Holten JI. The Impact of Climate Change on Recent Vegetation Changes on Dovrefjell, Norway. Diversity. 2011; 3(1):91-111. https://doi.org/10.3390/d3010091
Chicago/Turabian StyleMichelsen, Ottar, Anne Olga Syverhuset, Bård Pedersen, and Jarle Inge Holten. 2011. "The Impact of Climate Change on Recent Vegetation Changes on Dovrefjell, Norway" Diversity 3, no. 1: 91-111. https://doi.org/10.3390/d3010091
APA StyleMichelsen, O., Syverhuset, A. O., Pedersen, B., & Holten, J. I. (2011). The Impact of Climate Change on Recent Vegetation Changes on Dovrefjell, Norway. Diversity, 3(1), 91-111. https://doi.org/10.3390/d3010091