
Effectiveness of Seed Traps for Assessing Seed Rain in Periurban Grasslands


1
Institut Agro, Ecole Supérieure des Agricultures, INRAE, BAGAP, 49000 Angers, France
2
Institut Agro, Ecole Supérieure des Agricultures, INRAE, BAGAP, 35000 Rennes, France
*
Authors to whom correspondence should be addressed.
Diversity 2023, 15(9), 1015; https://doi.org/10.3390/d15091015
Submission received: 10 July 2023
/
Revised: 29 August 2023
/
Accepted: 8 September 2023
/
Published: 13 September 2023
Abstract
:Landscape context plays an important role in plant community structuring, with selection pressure affecting dispersal ability. This is particularly true in cities, where land use heterogeneity and habitat fragmentation can affect plant dispersal patterns. Seed rain surveys are often used to study dispersal but involve a wide variety of methods and trap types and rarely address the urban context. This study aimed to (1) compare seed rain, especially of anemochorous seeds, in different spatial contexts in a periurban area in Angers (western France); and (2) compare seed rain captured using different trap types (funnel traps/sticky traps), trap heights, and shapes. Seven sites, each equipped with five replicates of funnel traps, were selected in a periurban area in the western part of Angers. Within one of these sites, ten types of traps (differing in trapping method, height, shape, degree of tilt, and area) were employed and their performance compared. The results show that trap height rather than trap type is responsible for differences in seed density and composition. Furthermore, the composition of collected seeds appears to be associated with surrounding land cover, in particular built areas, which has implications for urban ecology in terms of understanding the influence of landscape factors on plant dispersal.
1. Introduction
The distribution patterns of plants can be strongly influenced by landscape structure. Understanding how landscape facilitates or hinders plant dispersal processes is fundamental to a better understanding of how plants are distributed across different habitats [1,2,3]. Today, with the rapid land use changes and habitat fragmentation caused by human activities, the dynamics of plant dispersal need to be grasped to deal with conservation issues [4]. The research community is therefore now committed to investigating the impacts of landscape changes on plant dispersal in order to better inform conservation and management practices [5]. The study of seed rain is a powerful tool for understanding ecosystem dynamics. It provides information on the types of species present, seed densities, and the spatial and temporal patterns of seed arrival [2,6] that can be interacted with the impact of factors such as habitat fragmentation, land use change, and environmental conditions on plant communities [7,8].
Seed rain in herbaceous habitats is principally assessed under two approaches. The first mainly focuses on vegetation dynamics at the local scale to assess the recovery capacity of plant communities. Studying seed rain provides information about which species (target or non-target) are able to establish and coexist in a plant community; such studies consider seeds from neighboring plants (local seeds) and immigrant seeds dispersed by biotic and abiotic vectors (seeds from outside) [9,10,11]. Most studies in restoration ecology apply this approach. The second approach uses the study of seed rain to better understand species distribution in the landscape, only considering seeds coming from outside the plant community. This can clarify the effect of landscape structure (e.g., landscape composition and/or configuration) on the seed dispersal pattern [5]. Most studies in landscape ecology apply this approach. For instance, urbanization can lead to the creation of fragmented landscapes that may impede the ability of some plant species to disperse between habitats [12]. However, contrary to other human-dominated landscapes, cities are characterized by high heterogeneity at many scales [13], which can induce different ecological responses compared to other landscapes. In addition, understanding how landscape composition and configuration affect seed flows is therefore a prerequisite to addressing biodiversity issues in cities [14].
To assess seed rain, seed traps are usually used to catch seeds that are then identified and quantified [15], providing important information on dispersal mechanisms [16]. However, the literature covers a great diversity of types of seed traps [17,18] without clear evidence of their effectiveness, particularly in capturing seeds from outside (i.e., seeds from species not present in standing vegetation). There is disparity in the type of traps used, their above-ground height, and their tilt, which can affect their effectiveness in capturing seeds [19,20]. Moreover, although seed rain is best assessed using different types of traps [20], most studies use only one type of trap [18].
The most common trap in grasslands is the funnel trap, primarily used in restoration ecology to study epizoochory [21,22] or short- and medium-distance dispersal [23]. While funnel traps are described as capturing the largest number of seeds [24], they may not be the most suitable for studying anemochorous seeds, the main representative of medium/long-distance dispersal strategies in herbaceous habitats [20]. Sticky traps are also widely used [17] to assess local seed rain (i.e., seeds from local standing vegetation) [11] as well as the arrival of seeds from outside the plant community [25]. Contrary to funnel traps, sticky traps are appropriate for the study of anemochorous seed rain [17] due to their height and their angle adjustability to wind dynamics. Other traps, such as tray, gap traps, and pitfall traps, are used more sporadically to study the dynamics of plant populations [26], including of invasive species [27] or for comparison with the soil seed bank [28].
Trap settings vary widely in ecological studies. For example, while funnel traps are mainly placed at 0 cm (at ground level), they can also be set above ground (e.g., 20 cm high in [29]). In contrast, sticky traps are usually placed above ground (between 20 and 70 cm) [20,23], although they can also be set at ground level when vegetation is low or absent [30]. For sticky traps, the tilt of the plate is an important parameter because it allows the trap to face the dominant wind direction [17,20]. There are typically three degrees of slope: 0° (flat to capture at 360°), 45°, and 90° [17]. Finally, no precise information is provided regarding the surface area or shape of the traps, other than plates for sticky traps. However, since seed rain is a stochastic phenomenon [3], a larger surface area should increase the likelihood of catching seeds.
This study seeks to provide useful information for the design and implementation of seed traps to improve their efficiency for the measurement of seed rains along landscape gradients. Our aim is, therefore, (1) to investigate the effectiveness of seed traps in capturing variations in seed rain (composition, density, and richness) in herbaceous habitats located in different landscape contexts using funnel traps and (2) from a single station, to examine how seed trap characteristics (type, height, tilt, surface area, and shape) affect their efficiency in capturing seeds, with a focus on anemochorous seeds immigrating from outside the patch.
2. Materials and Methods
2.1. Study Area
The study was carried out in the Angers conurbation (western France, 47°28′ N, 0° 33′ W), covering 667 km2 with 302,000 inhabitants (https://www.insee.fr accessed on 1 June 2023). This urban area is part of the Armorican massif (mainly composed of acidic schist and granite). The area is characterized by a temperate oceanic climate.
2.2. Spatial Variation in Seed Rain
To determine whether seed traps effectively capture spatial variation in seed rain, seven stations located in contrasting landscape contexts were selected in a suburban area of western Angers. The stations were positioned within extensive herbaceous spaces adjoining agricultural fields or built spaces. They were chosen to reflect landscape variability and were characterized by the proportions of impervious, herbaceous, woody, and water surfaces within a 500 m radius buffer (Figure 1). Land cover proportions were calculated from the BD TOPO 3.0 database, satellite images, and orthophotos (SPOT6-7 and Orthos IRC) using QGIS software (different versions from 2020 to 2022 http://qgis.org accessed on 15 May 2023). The seven stations were equipped with 5 replicates of funnel seed traps placed at ground level. Funnel traps consisted of a PVC tube with a diameter of 10 cm, planted in the soil at a depth of 15 cm, on which a funnel of the same diameter was placed. A water-permeable sachet of polyamide mesh was attached to the funnel inside the PVC tube to capture the seeds and to allow drainage. The sachet was isolated from the soil to avoid mold. In each station, five traps were positioned in a line, and spaced 50 cm apart. No mowing was performed at the stations during the study.
2.3. Comparative Study of Seed Trap Characteristics
To evaluate the efficiency of seed traps in capturing seed rain, sticky traps were tested at station S3 in addition to funnel traps. This enabled us to assess the performance of traps differing in their capture mode, height, shape, tilt, and surface area. Sticky traps consisted of a square plexiglass plate (15 cm × 15 cm) attached to the center of a wooden batten by a screw. The plexiglass plate was covered with a plastic film coated with sticky grease (originally used to protect cows’ udders during milking in the winter season) to trap the seeds falling onto the plate. To investigate the effects of the height of funnel traps on seed rain capture, three heights were tested: 0 cm, 25 cm, and 70 cm between the ground and the upper end of the funnel. Additionally, two heights were tested for the sticky plate traps: 25 cm and 70 cm between the ground and the end of the wooden batten. To evaluate the effect of the tilt of sticky plate traps, the two most common tilts were tested (45° and 90°) for the two heights of sticky square traps. No tilt was applied on funnel traps. A sticky surface in the shape of a cone or hemisphere would allow the capture of seeds from all directions. Thus, these two shapes were tested at a height of 25 cm using pieces of polystyrene covered, like the plates, with a plastic film and sticky grease. Finally, 25 cm high sticky plate traps with a tilt of 45° were tested with smaller plates (10 × 10 cm). The various experimental conditions are summarized in Table 1. At station S3, the traps were aligned perpendicular to the main wind. Each trap type was replicated 5 times. Traps were spaced 50 cm apart and their position order was randomized.
2.4. Data Collection
The seeds caught by traps were collected 6 times from June to September 2021, every two weeks to prevent germination. During the collections, the bags of the funnel traps were replaced. In the laboratory, seeds were identified using a binocular microscope. The funnel traps alone required a preliminary sorting phase for each sachet. Seed identification relied on photo libraries from GEVES I.D.SEED (https://www.geves.fr/outils/idseed/ accessed on 20 July 2023) and the pharmacy faculty’s graineterie du jardin botanique (http://seed.for.free.fr/pharmacie.php, accessed on 20 July 2023). Identification was performed to species level if possible and to genus level for some individuals. To identify the local effects of standing vegetation on the composition of captured seeds, two vegetation surveys were conducted in September 2021 and May 2022. The presence/absence of all the species present within a 5 m radius around traps was recorded. Plant species were identified using the nomenclature defined by Tison and De Foucault [31] and distinguishing between two groups of seeds: those of species locally present in the standing vegetation of the station (LocalSp) and those of species locally absent in the standing vegetation of the station (NonLocalSp).
2.5. Data Analysis
Seeds captured during the 6 sampling sessions were pooled. Using the Baseflor database [32], a seed dispersal strategy (see Appendix A) was assigned to each captured species. The seed species richness and seed density (i.e., number of seeds per cm2) of each trap were calculated by distinguishing (1) total species richness and total seed density (i.e., including all species found); (2) the richness and seed density of species locally absent in the station (i.e., all species not found in vegetation surveys); (3) species richness and seed density of anemochorous species only; (4) species richness and seed density of anemochorous species locally absent in the station. Note that densities were calculated excluding the seeds of Agrostis sp., over-represented in the seed pools.
To evaluate spatial variation in seed rain composition among the seven stations, two approaches were used. Correspondence analysis (CA) was used on two sets of seed data: (1) all species (except Agrostis sp.) observed in at least five traps; (2) only species locally absent in stations in order to evaluate the efficiency of seed straps to captured different composition among stations. A Multi Response Permutation Procedure (MRPP) was performed on these two datasets to test whether there was a significant difference in community composition between stations. Then, a Canonical Correspondence Analysis (CCA) was performed only on locally absent species to test if stations’ seed compositions were significantly organized along a landscape gradient. The strong correlation (0.79) between built-up and wooded areas led us to retain only built-up areas in the analysis. CCA was performed on CANOCO 5 using station as block factor. Differences in seed species richness and density among the seven stations were assessed by ANOVA, followed by Tukey post hoc tests, using station as explanatory variable. To fit normality, seed densities were log-transformed. Normality and variance homogeneity were checked using Shapiro–Wilk test and Bartlett test. Further, p-values were adjusted using Benjamini and Hochberg procedure [33].
To evaluate the effects of trap characteristics on seed species richness and density, three Kruskal–Wallis tests with Dunn test post hoc were performed on S3 data only to test (1) the effects of trap type (i.e., funnel or sticky), height, and tilt considering only the three funnel traps and two 45° and 90° sticky traps; (2) the effects of surfaces considering only 25 cm height with 45° tilt and small sticky traps; and (3) shape (hemispherical, conical, and square) of sticky traps. All densities were log-transformed. Further, p-values were adjusted using Benjamini and Hochberg procedure [33].
All analyses except CCA were conducted in R (version 4.3.0) with Vegan package (version 2.5-7) for the MRPP analysis.
3. Results
3.1. Effectiveness of Funnel Traps in Capturing Spatial Variation in Seed Rain
A total of 3279 seeds were found, corresponding to 57 taxa (23 genus and 24 species). The genus Agrostis accounted for a third of the seeds collected (Appendix A).
The results from ANOVA and post hoc tests are shown in Supplementary Material Table S1. All tested seed densities and species richness showed a significant difference between stations (Figure 2). S6 and S7 presented higher total seed density taking all species together compared to S3, S4, and S5, while S2 presented higher total density in anemochorous seeds. Considering only locally absent seeds, S1 had the highest total densities and densities of anemochorous seeds. Total species richness was higher in S1 compared to S3 and S5. Total anemochorous species richness was also higher in S1 compared to all stations except S2. However, anemochorous seeds from species locally absent in the standing vegetation showed no difference in species richness between S1 and S2, while the other stations had lower anemochorous species richness.
The distribution of plant species in the first factorial plane of the CA is shown in Figure 3. The first two axes accounted, respectively, for 17.3% and 14.2% of total variation. The first axis discriminated the stations with the highest proportions of impervious surfaces in their landscape contexts (S1 and S2) from the other stations. S1 and S2 were characterized by higher occurrences of anemochorous and autochorous species, whereas the other stations had higher occurrences of zoochorous species. Indeed, S1 and S2 were characterized by locally present species in the standing vegetation, either anemochorous (i.e., S1: Hypochaeris radicata L., S2: Helminthotheca echioides (L.) Holub, and an exogen species Erigeron sp.) or autochorous (e.g., S1: Prunella vulgaris L., Bellis perennis L., Geranium sp., and Festuca sp.; S2: Potentilla repens L., Medigo lupulina L., and Plantago lanceolata L.). S1 also contained a few locally absent anemochorous species such as Crepis sp. and Leotondon sp. The other stations, S3 to S7, were characterized by locally present species with zoochorous dispersal strategies (e.g., Phleum pratense L., Ranunculus sp., and Poa sp.) and by locally absent zoochorous species (e.g., Bromus hordeaceus L. Arrhenatherum elatius (L.) P.Beauv. ex J.Presl & C.Presl, Dactylis glomerata L., and Holcus sp.), as well as by locally absent species with other dispersal strategies (e.g., Anisantha sterilis (L.) Nevski, autochorous; Rumex sp., anomochorous). Furthermore, the second axis appeared to distinguish S6, characterized by three dominant Poaceae species (Holcus sp, Dactylis glomerata L., and Arrhenatherum elatius (L.) P.Beauv. ex J.Presl & C.Presl), from the other sites. According to the MRPP (p < 0.001), the species composition of seeds trapped by funnel differed more between stations than between replicates.
Focusing only on locally absent species (Figure 4), differences in seed communities were also detected between stations. The first axis (17.5% of explained variance) distinguished the stations with the highest proportion of vegetated surfaces (S6 and S7) in their landscape contexts. For anemochorous seeds, most species were related to S3, S4, and S7: for instance, Sonchus sp., Cirsium arvense (L.) Scop., Hypochaeris radicata L., Crepis sp., Betula sp., and Leotondon sp. As in the first CA, the second axis (15.66% of explained variance) distinguished S6 from the other stations. MRPP showed that the species composition of seeds caught by funnel traps differed more between stations than between replicates (p-value < 0.001). Furthermore, CCA shows a significant effect of built surfaces proportion in seed rain composition distribution (F = 5.6, p-value = 0.008).
3.2. Comparison of Seed Traps
3.2.1. Trap Types, Heights, and Tilt
A total of 5942 seeds belonging to 23 taxa were found in the 50 traps used to study seed trap characteristics, 5569 of which belonged to the genus Agrostis. Kruskal–Wallis and post hoc results are shown in Supplementary Material Table S2.
Funnel traps set 0 cm high showed twice the total seed density (all species included) of the other traps. These differences were mainly due to seeds of Agrostis sp.
After excluding Agrostis seeds, total seed density in funnel traps set at a height of 25 cm was found to be higher than all traps at 70 cm and funnel and sticky at 45° and 90° tilt. The funnel traps at 70 cm presented a lower total seed density than all traps except sticky traps at 25 cm and 45° tilt. No significant difference in total anemochorous seed density was measured between trap types and heights. However, the density of seeds from locally absent species in the standing vegetation was higher in 70 cm sticky traps with 45° tilt than in funnel traps at the same height. The density of anemochorous seeds from locally absent species was significantly higher in the 70 cm high sticky traps than in 25 cm funnel traps and 25 cm sticky traps with 90° tilt (Figure 5).
Lower total seed species richness was measured in funnel traps set at 70 cm than in 0 cm funnel traps and all sticky traps except those at 70 cm with 90° tilt. The total species richness of anemochorous seeds was higher in sticky traps at 70 cm with 45° tilt than in funnel at the same height.
The richness of seeds from locally absent species in the standing vegetation was higher in sticky traps at a height of 70 cm and 45° tilt than in funnel traps at the same height. The same difference is observed for sticky traps at a height of 25 cm and 45° tilt and funnel traps at the same height.
The species richness of anemochorous species from locally absent species in the standing vegetation was lower in funnel traps at 25 cm than in other funnel traps and was higher in 70 cm sticky traps with 90° tilt than in sticky traps with the same tilt at 25 cm. (Figure 5).
3.2.2. Trap Surface Area and Forms
No significant difference was observed for any density or richness when comparing classical and small sticky traps at 25 cm with 45° tilt (Figure 6, Supplementary Material Table S3).
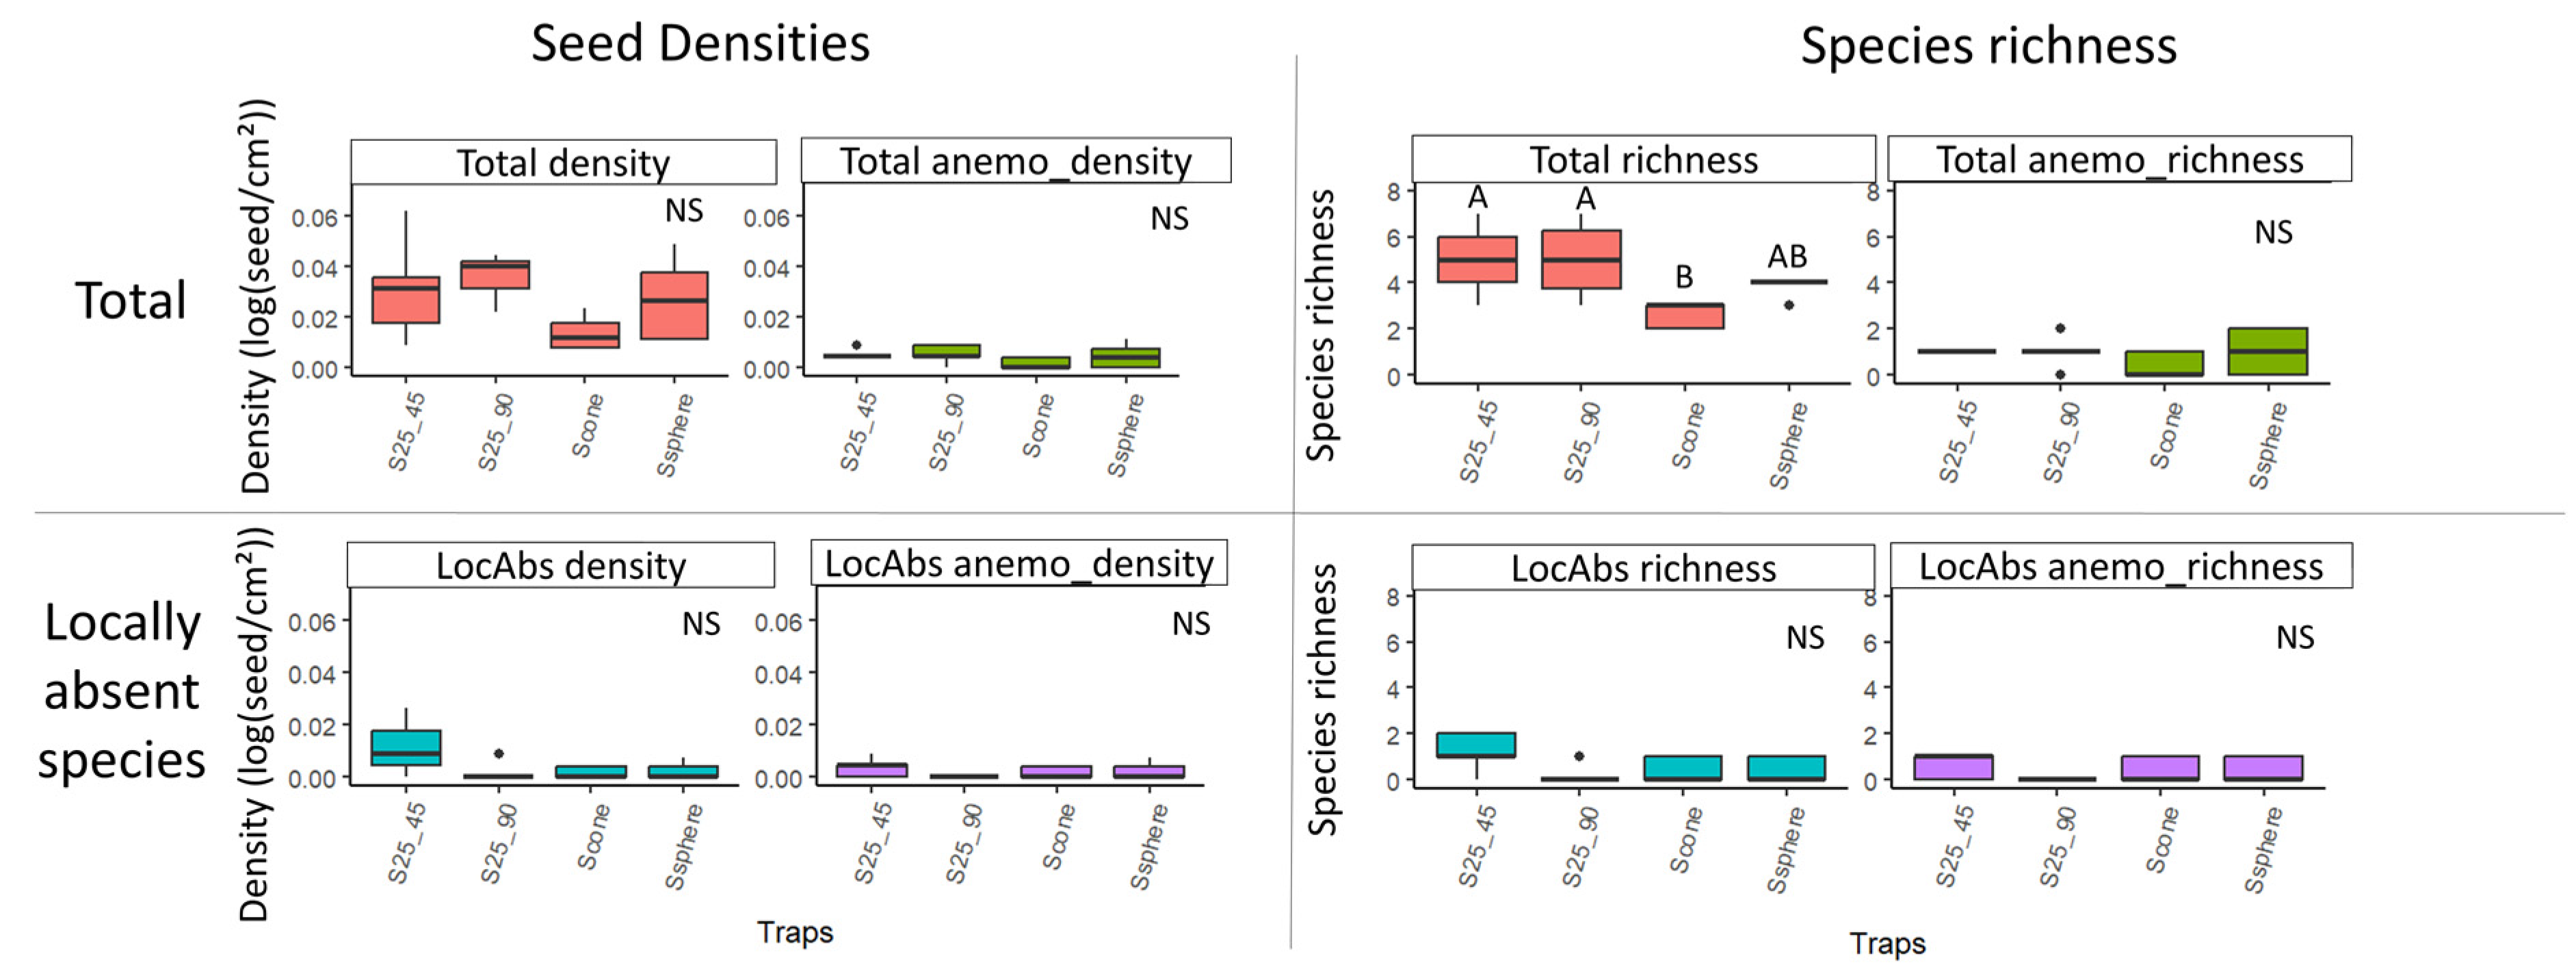
Total species richness was lower in cone sticky traps than in square sticky traps at both 45° and 90° tilt (Figure 7, Supplementary Material Table S4).
4. Discussion
4.1. Efficiency of Seed Traps in Spatial Variation Assessment
Landscape structure has been shown to select for certain dispersal strategies. For example, urbanization was found to increase the extinction rate of anemochorous species [34,35,36]. The factorial design used in this study revealed significant differences in seed densities or species richness among stations, suggesting that seed rain was an indicator of spatial variation related to station location. Contrary to the literature, we found that the most urbanized stations (S1 and S2) had the highest species richness in seeds either locally absent in the standing vegetation or anemochorous for S1 only. In addition, the CCA shows a strong effect of built surfaces on seed rain composition. This finding demonstrates the need to properly study urban landscape influence on seed rain at a larger scale. In addition, the influence of factors acting at the local scale, such as management practices regarding herbaceous cover or adjacent land cover, might also explain differences among stations. For instance, Chaudron et al. [25] measured the effect of the mowing period on the standing vegetation and seed rain in road berms, and the role of road berms as a source of weeds for field margins. Such local drivers might explain the difference in seed composition between S6 and the other stations observed in the correspondence analysis. Our results also show that seed rain composition differed more between stations than between trap replicates in a given station. Thus, funnel traps appear to effectively capture differences in seed rain arising from different landscape contexts.
Furthermore, this study demonstrates the importance of going beyond the total richness or density of the seeds captured in order to account for the dispersal strategies of plant species. Thus, focusing on anemochorous seeds or on seeds of locally absent species in the standing vegetation that reveal medium- to long-distance dispersal processes will allow a better understanding of the mechanisms underlying local seed rain composition.
However, it is not easy to identify the exact sources of diaspores (local or distant) of seed rain at a station if the species is present in the standing vegetation. Similarly, seed traps alone cannot be used to estimate the distance traveled by seeds that are not inventoried at the station. Nevertheless, the study of seed rain combined with inventories near the traps and the consideration of dispersal traits can provide a relatively reliable proxy for seed rain in urban grasslands. Indeed, in herbaceous areas, analyzing anemochorous seeds, especially those not identified in local floristic surveys, provides interesting information on the ability of plant species to colonize a given habitat. Thus, although which dispersal strategies are more frequent in urban contexts remains unclear [37], we were able to show that, in the more urban stations (those with a higher proportion of impervious surfaces within a 500 m radius), more anemochorous species were captured, including from species not present in the vegetation surveys. Expanding the setup across a broader gradient with a variety of trap types would provide a better understanding of seed rain composition and urban effects on plant dispersal.
4.2. Effectiveness of Seed Traps According to Their Characteristics
Very little information on how traps’ characteristics affect seed rain assessment are available, and none of it studied urban landscape. The seed trap characteristics that were most important in this study were trap type and height. Funnel traps, especially those on the ground (height of 0 cm), captured the highest seed densities. These results are consistent with those of Chabrerie and Allard [20], who also described funnel traps as catching the highest density of seeds in rural herbaceous habitats. However, looking specifically at anemochorous seeds and seeds not found in the surveys, we observed that sticky traps captured the highest density of seeds. This suggests that a large part of the seed density in funnel traps at 0 cm is attributable to the copious seeds from local vegetation within the sampled stations (seed shadow sensus [9]). Although they caught fewer seeds, sticky traps seemed to be more efficient at catching higher species richness than funnel traps, regardless of the seed pool analyzed (i.e., total richness, anemochorous richness, locally absent species richness, or locally absent anemochorous species richness).
The height of traps also played an important role in trap efficiency in this study. With increasing height, lower total species richness and total seed density were observed for funnel traps but not for sticky traps. Although there were no sticky traps at 0 cm, this suggests that sticky traps were more effective in capturing seed richness. In addition, the 70 cm high sticky traps captured the highest in seeds from outside the station and locally absent anemochorous seeds except with S25_90 and S25_45 and F0. Thus, despite the much lower number of seeds captured, the highest-set sticky traps appeared to be the most efficient at indicating seed dispersal, potentially over medium or long distances.
On the other hand, very little variation was observed according to tilt, shape, and surface area of traps. It has been demonstrated that surface area does not impact seed density [38]. We expected shape to facilitate the characterization of seed richness because conical and spherical traps are able to capture seeds oriented at 360°. One hypothesis could be that these shapes are not conducive to retaining the seeds stuck to them.
In terms of practicality, the additional sorting phase involved with funnel traps makes this a more time-consuming method. For funnel traps placed at 0 cm, the seeds are mixed with a great deal of debris (as described in Chabrerie and Allard [20]), making the sorting phase long and complex. In contrast, sticky traps are less time-consuming because identification can be performed directly; however, many insects stick to them.
5. Conclusions
This study establishes that seed traps are effective tools for assessing differences in seed rain composition between several herbaceous stations located in different landscape contexts. It is important to consider not only types of seed traps but parameters such as the height of the traps to ensure the most appropriate fit for the situation being studied. Sticky traps with a 45° tilt at a height of 70 cm were the most effective here in capturing both density and species richness, especially for locally absent species. Further studies of seed rain in urban contexts could usefully investigate the relationships between local plant communities and landscape structure over wider landscape gradients. This should help provide insights into the plant dispersal processes within urban contexts.
Supplementary Materials
The following supporting information can be downloaded at: https://www.mdpi.com/article/10.3390/d15091015/s1, Table S1: ANOVA and Tukey post hoc results on inter-station differences in seed density and richness (excluding Agrostis sp. seeds); Table S2: Kruskal–Wallis and Dunn post hoc results on differences in seed density and species richness (excluding Agrostis sp. seeds) according to trap type and height and tilt (p-value: 0.05 < * < 0.01; 0.01 < ** < 0.001; 0.001 < ***); Table S3: Kruskal–Wallis results on differences in seed density and species richness (excluding Agrostis sp. seeds) according to trap surface area (p-value: 0.05 < * < 0.01; 0.01 < ** < 0.001; 0.001 < ***); Table S4: Kruskal–Wallis and Dunn post hoc results on differences in seed density and species richness (excluding Agrostis sp. seeds) according to trap form (p-value: 0.05 < * < 0.01; 0.01 < ** < 0.001; 0.001 < ***).
Author Contributions
Conceptualization, C.G., A.B. and H.D.; Formal analysis, C.G., A.B., S.A. and H.D.; Funding acquisition, A.B. and H.D.; Investigation, C.G., A.B., F.B. and H.D.; Methodology, C.G., A.B. and H.D.; Project administration, A.B. and H.D.; Supervision, A.B., S.A. and H.D.; Writing—original draft, C.G.; Writing—review and editing, C.G., S.A. and H.D. All authors have read and agreed to the published version of the manuscript.
Funding
This study was financed by “L’institut Agro Rennes Angers” and the “Conseil Régional des Pays de la Loire”.
Institutional Review Board Statement
Not applicable.
Data Availability Statement
The dataset used in this study is available from corresponding authors on reasonable request.
Acknowledgments
We thank Marjorie Sweetko for proofreading the manuscript. We thank M. Durieu, P. Collignon, and F. Glodt for their help in collecting seed traps and for species determination. We also thank all stakeholders involved for their help in sampling the stations. We thank Véronique Beaujouan and Thomas Rodier for their help in landscape assessment.
Conflicts of Interest
The authors declare no conflict of interest.
Appendix A
List of species found in seed traps with their codes and their dispersal strategies.
| Species Code | Genus | Species | Family | Dispersal Strategies (Julve) |
| Ach.mil | Achillea | millefolium | ASTERACEAE | anemochorous |
| Agr.sp | Agrostis | sp. | POACEAE | autochorous |
| Arr.ela | Arrhenatherum | elatius | POACEAE | zoochorous |
| Ave.sp | Avena | sp. | POACEAE | zoochorous |
| Bel.per | Bellis | perennis | ASTERACEAE | autochorous |
| Bet.sp | Betula | sp. | BETULACEAE | anemochorous |
| Bro.hor | Bromus | hordeaceus | POACEAE | zoochorous |
| Bro.ste | Bromus | sterilis | POACEAE | autochorous |
| Cam.rap | Campanula | rapunculus | CAMPANULACEAE | autochorous |
| Cen.sp | Centaurea | sp. | ASTERACEAE | autochorous |
| Cir.arv | Circium | arvense | ASTERACEAE | anemochorous |
| Con.arv | Convolvulus | arvensis | CONVOLVULACEAE | autochorous |
| Con.sp | Convlovulus | sp. | CONVOLVULACEAE | autochorous |
| Cre.sp | Crepis | sp. | ASTERACEAE | anemochorous |
| Cyn.cri | Cynosurus | cristatus | POACEAE | zoochorous |
| Cyn.dac | Cynodon | dactylon | POACEAE | zoochorous |
| Dac.glo | Dactylis | glomerata | POACEAE | zoochorous |
| Dau.car | Daucus | carota | APIACEAE | zoochorous |
| Ech.vul | Echium | vulgare | BORAGINACEAE | autochorous |
| Eri.sp | Erigeron | sp. | ASTERACEAE | anemochorous |
| Fes.sp | Festuca | sp. | POACEAE | zoochorous |
| Gal.sp | Gallium | sp. | RUBIACEAE | autochorous |
| Ger.sp | Geranium | sp. | GERANIACEAE | autochorous |
| Hed.hel | Hedera | helix | ARALIACEAE | zoochorous |
| Hel.ech | Helminthotheca | echioides | ASTERACEAE | anemochorous |
| Hol.sp | Holcus | sp. | POACEAE | zoochorous |
| Hyp.per | Hypericum | perforatum | HYPERICACEAE | anemochorous |
| Hyp.rad | Hypochaeris | radicata | ASTERACEAE | anemochorous |
| Jac.vul | Jacobaea | vulgaris | ASTERACEAE | anemochorous |
| Lap.com | Lapsana | communis | ASTERACEAE | autochorous |
| Leo.sp | Leotodon | sp. | ASTERACEAE | anemochorous |
| Lep.cam | Lepidium | campestre | BRASSICACEAE | zoochorous |
| Leu.vul | Leucanthemum | vulgar | ASTERACEAE | autochorous |
| Lol.mul | Lolium | multiflorum | POACEAE | autochorous |
| Lol.spp | Lolium | sp. | POACEAE | autochorous |
| Mal.sp | Malva | sp. | MALVACEAE | anemochorous |
| Med.lup | Medicago | lupulina | FABACEAE | autochorous |
| Myo.sp | Myosotis | sp. | BORAGINACEAE | zoochorous |
| Ort.dio | Urtica | dioica | URTICACEAE | zoochorous |
| Phl.pra | Phleum | pratense | POACEAE | zoochorous |
| Pla.cor | Plantago | coronopus | PLANTAGINACEAE | autochorous |
| Pla.lan | Plantago | lanceolata | PLANTAGINACEAE | autochorous |
| Poa.spp | Poa | sp. | POACEAE | autochorous |
| Pol.avi | Polygonum | aviculare | POLYGONACEAE | autochorous |
| Pol.sp | Polygonum | sp. | POLYGONACEAE | autochorous |
| Pot.rep | Potentilla | reptans | ROSACEAE | autochorous |
| Pru.vul | Prunella | vulgaris | LAMIACEAE | autochorous |
| Que.sp | Quercus | sp. | FAGACEAE | zoochorous |
| Ran.sp | Ranunculus | sp. | RANUNCULACEAE | zoochorous |
| Rum.sp | Rumex | sp. | POLYGONACEAE | anemochorous |
| Sen.vul | Senecio | vulgare | ASTERACEAE | anemochorous |
| Son.sp | Sonchus | sp. | ASTERACEAE | anemochorous |
| Tar.sp | Taraxacum | sp. | ASTERACEAE | anemochorous |
| Tri.pra | Trifolium | pratense | FABACEAE | zoochorous |
| Ver.arv | Veronica | arvensis | PLANTAGINACEAE | autochorous |
| Vic.hir | Vicia | hirsuta | FABACEAE | autochorous |
| Vul.spp | Vulpia | sp. | POACEAE | zoochorous |
References
- De Blois, S.; Domon, G.; Bouchard, A. Landscape Issues in Plant Ecology. Ecography 2002, 25, 244–256. [Google Scholar] [CrossRef]
- Schupp, E.W.; Fuentes, M. Spatial Patterns of Seed Dispersal and the Unification of Plant Population Ecology. Écoscience 1995, 2, 267–275. [Google Scholar] [CrossRef]
- Lortie, C.J.; Brooker, R.W.; Choler, P.; Kikvidze, Z.; Michalet, R.; Pugnaire, F.I.; Callaway, R.M. Rethinking Plant Community Theory. Oikos 2004, 107, 433–438. [Google Scholar] [CrossRef]
- Trakhtenbrot, A.; Nathan, R.; Perry, G.; Richardson, D.M. The Importance of Long-Distance Dispersal in Biodiversity Conservation. Divers. Distrib. 2005, 11, 173–181. [Google Scholar] [CrossRef]
- Auffret, A.G.; Rico, Y.; Bullock, J.M.; Hooftman, D.A.P.; Pakeman, R.J.; Soons, M.B.; Suárez-Esteban, A.; Traveset, A.; Wagner, H.H.; Cousins, S.A.O. Plant Functional Connectivity—Integrating Landscape Structure and Effective Dispersal. J. Ecol. 2017, 105, 1648–1656. [Google Scholar] [CrossRef]
- Baskin, C.; Baskin, J.M. Seed Ecology, Biogeography, and Evolution of Dormancy and Germination; Elsevier: Amsterdam, The Netherlands, 2014. [Google Scholar]
- Schupp, E.W.; Jordano, P.; Gómez, J.M. Seed Dispersal Effectiveness Revisited: A Conceptual Review. New Phytol. 2010, 188, 333–353. [Google Scholar] [CrossRef]
- Uroy, L.; Ernoult, A.; Mony, C. Effect of Landscape Connectivity on Plant Communities: A Review of Response Patterns. Landsc. Ecol. 2019, 34, 203–225. [Google Scholar] [CrossRef]
- Janzen, D.H. Seed Predation by Animals. Annu. Rev. Ecol. Syst. 1971, 2, 465–492. [Google Scholar] [CrossRef]
- Urbanska, K.M.; Erdt, S.; Fattorini, M. Seed Rain in Natural Grassland and Adjacent Ski Run in the Swiss Alps: A Preliminary Report. Restor. Ecol. 1998, 6, 159–165. [Google Scholar] [CrossRef]
- Zeiter, M.; Schärrer, S.; Zweifel, R.; Newbery, D.M.; Stampfli, A. Timing of Extreme Drought Modifies Reproductive Output in Semi-Natural Grassland. J. Veg. Sci. 2016, 27, 238–248. [Google Scholar] [CrossRef]
- Williams, N.S.G.; Schwartz, M.W.; Vesk, P.A.; McCarthy, M.A.; Hahs, A.K.; Clemants, S.E.; Corlett, R.T.; Duncan, R.P.; Norton, B.A.; Thompson, K.; et al. A Conceptual Framework for Predicting the Effects of Urban Environments on Floras. J. Ecol. 2009, 97, 4–9. [Google Scholar] [CrossRef]
- Pickett, S.T.A.; Cadenasso, M. How Many Principles of Urban Ecology Are There? Landsc. Ecol. 2017, 32, 699–705. [Google Scholar] [CrossRef]
- Kowarik, I.; Lippe, M. von der Plant Population Success across Urban Ecosystems: A Framework to Inform Biodiversity Conservation in Cities. J. Appl. Ecol. 2018, 55, 2354–2361. [Google Scholar] [CrossRef]
- Schott, G.W. A Seed Trap for Monitoring the Seed Rain in Terrestrial Communities. Can. J. Bot. 1995, 73, 794–796. [Google Scholar] [CrossRef]
- Page, M.J.; Newlands, L.; Eales, J. Effectiveness of Three Seed-Trap Designs. Aust. J. Bot. 2002, 50, 587–594. [Google Scholar] [CrossRef]
- Arruda, A.; Buisson, E.; Poschlod, P.; Silveira, F.A.O. How Have We Studied Seed Rain in Grasslands and What Do We Need to Improve for Better Restoration? Restor. Ecol. 2018, 26, S84–S91. [Google Scholar] [CrossRef]
- Arruda, A.J.; Silveira, F.A.O.; Buisson, E. A Simple Standardized Protocol to Evaluate the Reliability of Seed Rain Estimates. Seed Sci. Res. 2020, 30, 304–309. [Google Scholar] [CrossRef]
- Bakker, J.P.; Poschlod, P.; Strykstra, R.J.; Bekker, R.M.; Thompson, K. Seed Banks and Seed Dispersal: Important Topics in Restoration Ecology. Acta Bot. Neerl. 1996, 45, 461–490. [Google Scholar] [CrossRef]
- Chabrerie, O.; Alard, D. Comparison of Three Seed Trap Types in a Chalk Grassland: Toward a Standardised Protocol. Plant Ecol. 2005, 176, 101–112. [Google Scholar] [CrossRef]
- Freund, L.; Eichberg, C.; Retta, I.; Schwabe, A. Seed Addition via Epizoochorous Dispersal in Restoration: An Experimental Approach Mimicking the Colonization of Bare Soil Patches. Appl. Veg. Sci. 2014, 17, 74–85. [Google Scholar] [CrossRef]
- Freund, L.; Carrillo, J.; Storm, C.; Schwabe, A. Restoration of a Newly Created Inland-Dune Complex as a Model in Practice: Impact of Substrate, Minimized Inoculation and Grazing. Tuexenia 2015, 35, 221–248. [Google Scholar] [CrossRef]
- Diacon-Bolli, J.C.; Edwards, P.J.; Bugmann, H.; Scheidegger, C.; Wagner, H.H. Quantification of Plant Dispersal Ability within and beyond a Calcareous Grassland. J. Veg. Sci. 2013, 24, 1010–1019. [Google Scholar] [CrossRef]
- Kollmann, J.; Goetze, D. Notes on Seed Traps in Terrestrial Plant Communities. Flora 1998, 193, 31–40. [Google Scholar] [CrossRef]
- Chaudron, C.; Chauvel, B.; Isselin-Nondedeu, F. Effects of Late Mowing on Plant Species Richness and Seed Rain in Road Verges and Adjacent Arable Fields. Agric. Ecosyst. Environ. 2016, 232, 218–226. [Google Scholar] [CrossRef]
- Martinkova, Z.; Honek, A. The Establishment of Taraxacum Officinale Plants in Grassland. Weed Res. 2014, 54, 501–510. [Google Scholar] [CrossRef]
- Lucero, J.E.; Allen, P.S.; McMillan, B.R. Increased Primary Production from an Exotic Invader Does Not Subsidize Native Rodents. PLoS ONE 2015, 10, e0131564. [Google Scholar] [CrossRef]
- Auffret, A.G.; Cousins, S.A.O. Past and Present Management Influences the Seed Bank and Seed Rain in a Rural Landscape Mosaic. J. Appl. Ecol. 2011, 48, 1278–1285. [Google Scholar] [CrossRef]
- Kirmer, A.; Mahn, E.-G. Spontaneous and Initiated Succession on Unvegetated Slopes in the Abandoned Lignite-Mining Area of Goitsche, Germany. Appl. Veg. Sci. 2001, 4, 19–27. [Google Scholar] [CrossRef]
- Larios, L.; Aicher, R.J.; Suding, K.N. Effect of Propagule Pressure on Recovery of a California Grassland after an Extreme Disturbance. J. Veg. Sci. 2013, 24, 1043–1052. [Google Scholar] [CrossRef]
- Tison, J.-M.; de Foucault, B. Flora Gallica: Flore de France; Biotope Editions: Mèze, France, 2014; ISBN 978-2-36662-012-2. [Google Scholar]
- Julve Baseflor. Index Botanique, Écologique et Chorologique de La Flore de France, Version 2015. Available online: http://philippe.julve.pagesperso-orange.fr/baseflor.xlsx (accessed on 24 July 2023).
- Benjamini, Y.; Hochberg, Y. Controlling the False Discovery Rate: A Practical and Powerful Approach to Multiple Testing. J. R. Stat. Soc. Ser. B Methodol. 1995, 57, 289–300. [Google Scholar] [CrossRef]
- Knapp, S.; Kühn, I.; Stolle, J.; Klotz, S. Changes in the Functional Composition of a Central European Urban Flora over Three Centuries. Perspect. Plant Ecol. Evol. Syst. 2010, 12, 235–244. [Google Scholar] [CrossRef]
- Sodhi, N.S.; Koh, L.P.; Peh, K.S.-H.; Tan, H.T.W.; Chazdon, R.L.; Corlett, R.T.; Lee, T.M.; Colwell, R.K.; Brook, B.W.; Sekercioglu, C.H.; et al. Correlates of Extinction Proneness in Tropical Angiosperms. Divers. Distrib. 2008, 14, 1–10. [Google Scholar] [CrossRef]
- Williams, N.S.G.; Morgan, J.W.; Mcdonnell, M.J.; Mccarthy, M.A. Plant Traits and Local Extinctions in Natural Grasslands along an Urban-Rural Gradient: Plant Extinctions along an Urban-Rural Gradient. J. Ecol. 2005, 93, 1203–1213. [Google Scholar] [CrossRef]
- Williams, N.S.G.; Hahs, A.K.; Vesk, P.A. Urbanisation, Plant Traits and the Composition of Urban Floras. Perspect. Plant Ecol. Evol. Syst. 2015, 17, 78–86. [Google Scholar] [CrossRef]
- Jackel, A.-K.; Poschlod, P. Diaspore Production and the Influence of the Size of Diaspore Traps on the Quantitive Result of Seasonal Diaspore Rain in Two Calcareous Grassland Sites. Berichte Inst. Landsch.-Pflanzenökol. Univ. Hohenh. 1994, 3, 123–132. [Google Scholar]
Figure 1.
Geographical location of the Angers conurbation in western France (A), spatial representation of the proportions of impervious surfaces in 500 m buffers in the conurbation (B), location of the seven stations in the study area (C), and the land cover proportions in the landscape context (500 m radius buffer) of the seven sampling stations (D).
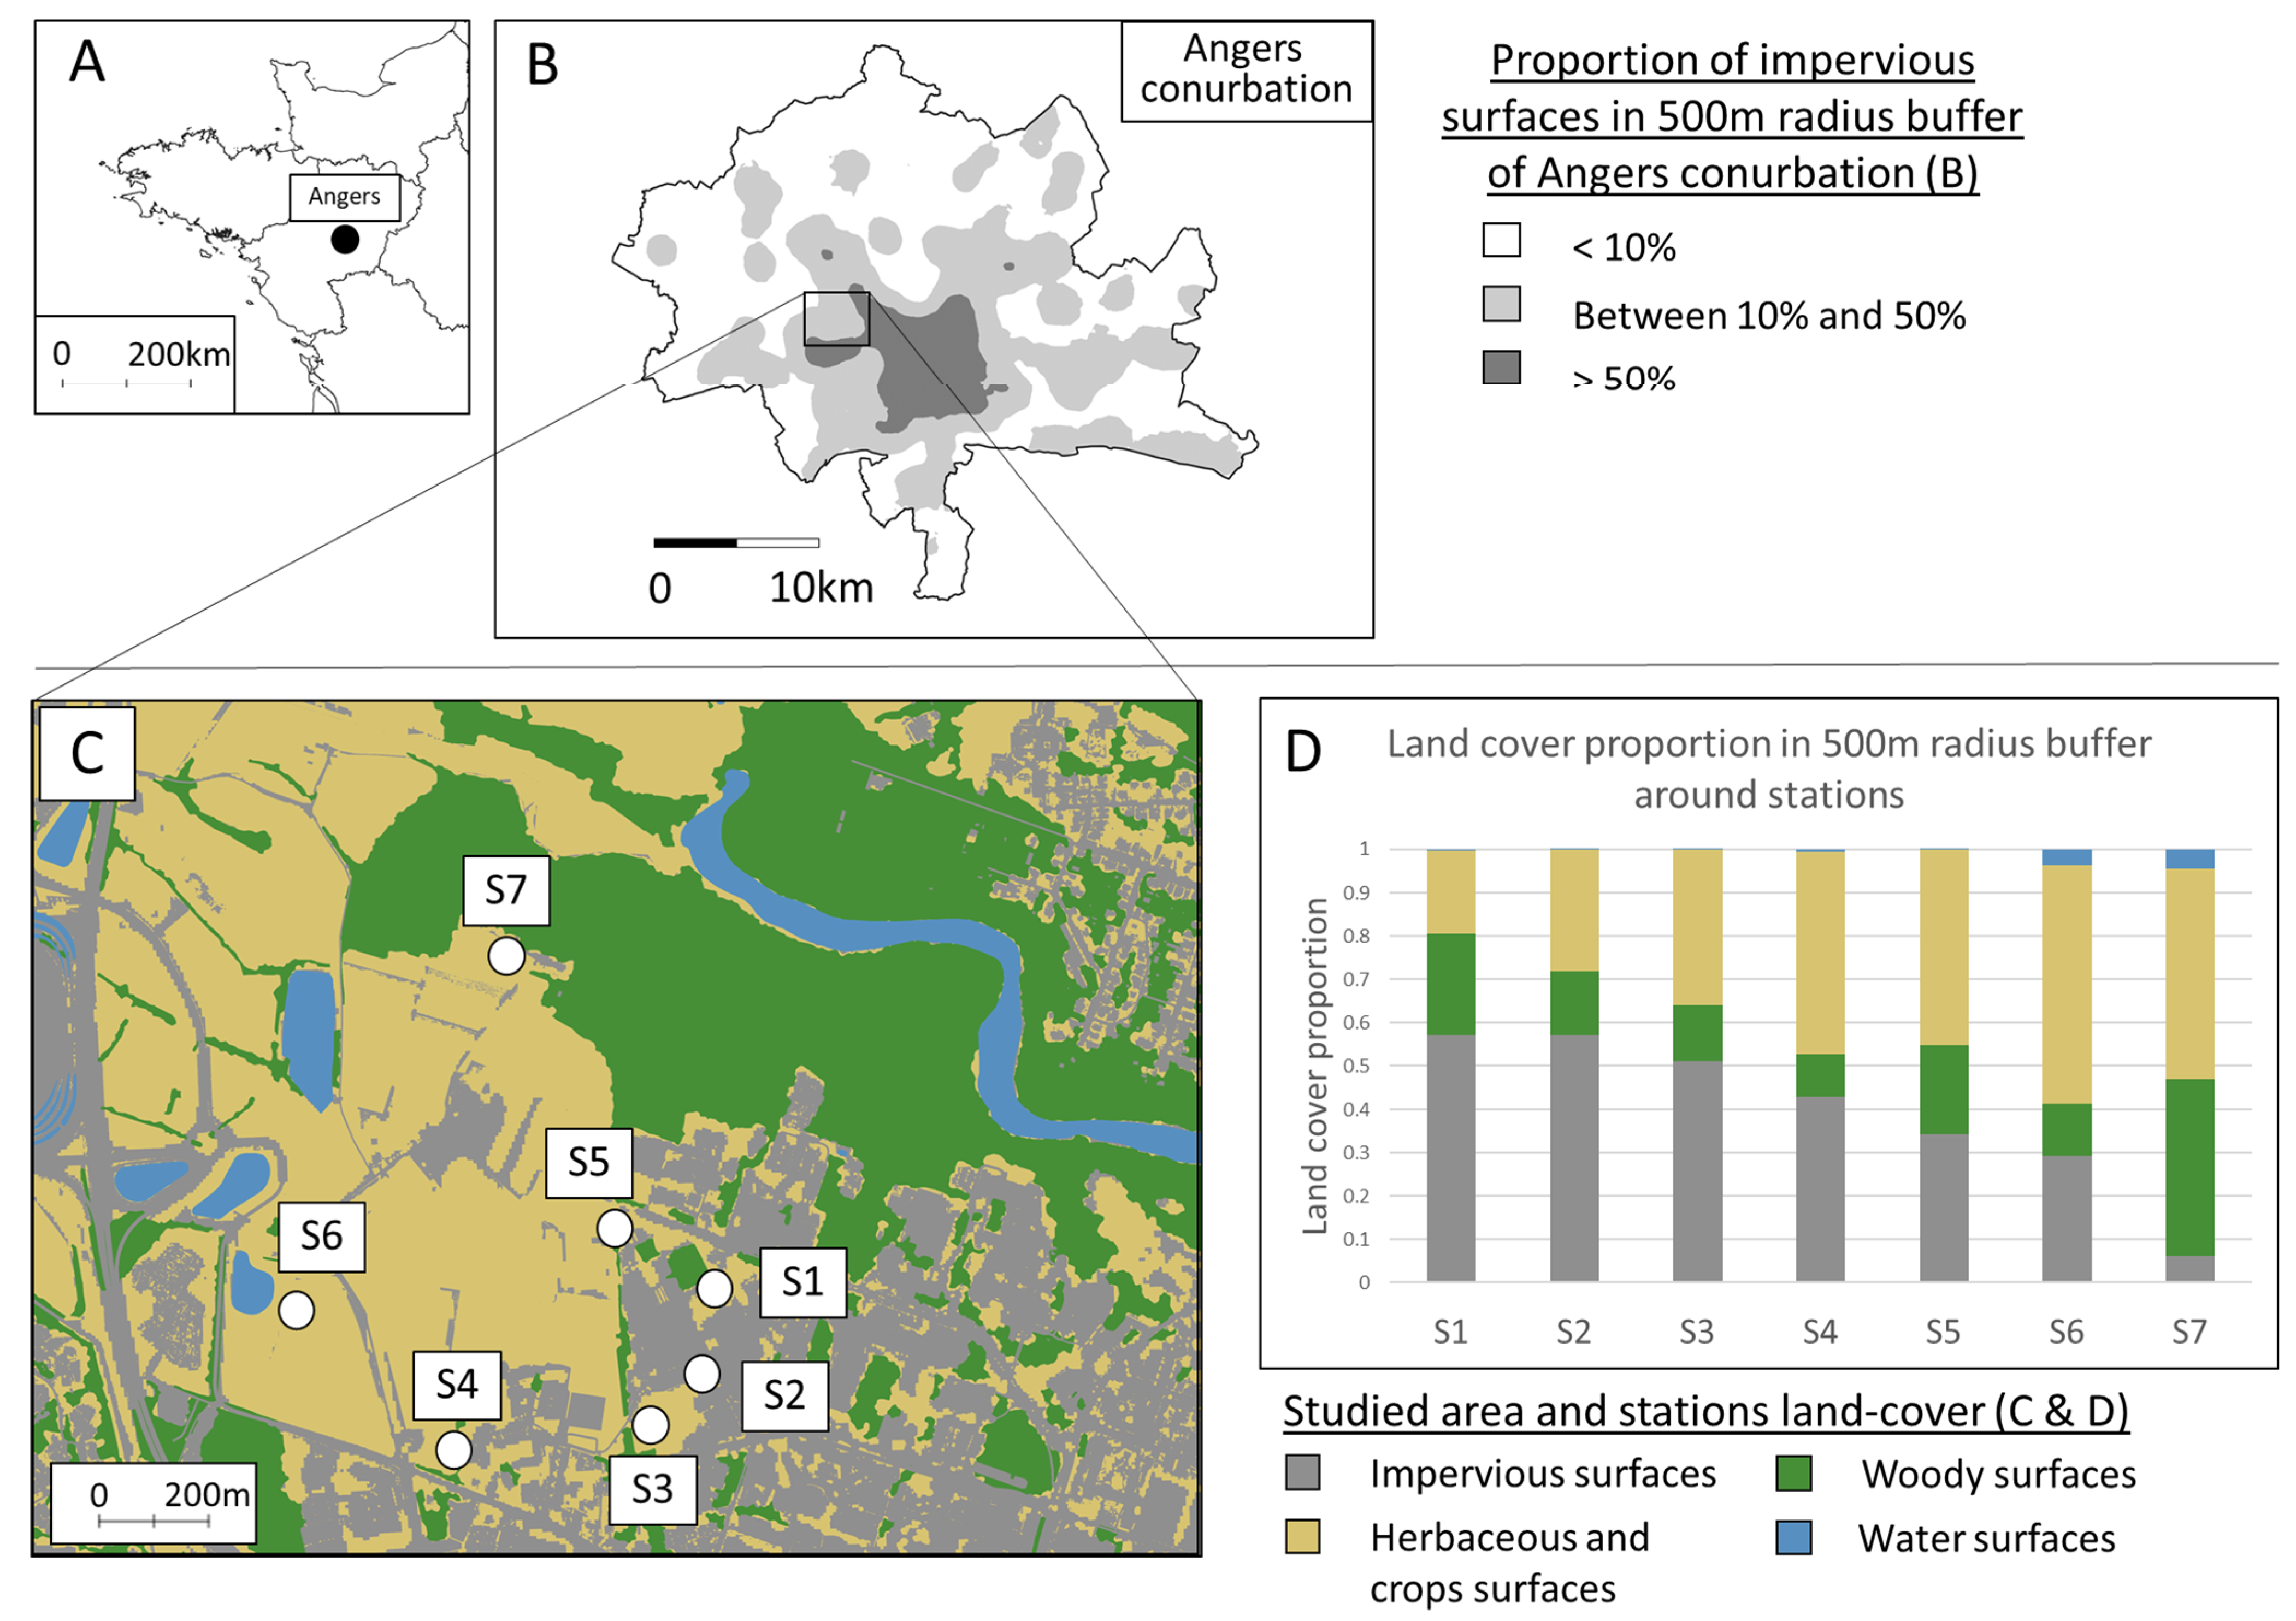
Figure 2.
Boxplots of seed densities (without Agrostis sp.) and species richness variation among stations, considering all species (first line) and only locally absent (LocAbs) species (second line). The two variables were tested, both considering all dispersal strategies and focusing on anemochorous seeds alone (anemo). Densities were log-transformed and are represented in square root scale. Different letters indicate significant differences between stations according to ANOVA and Tukey post hoc results with Benjamini–Hochberg p-value adjustment.
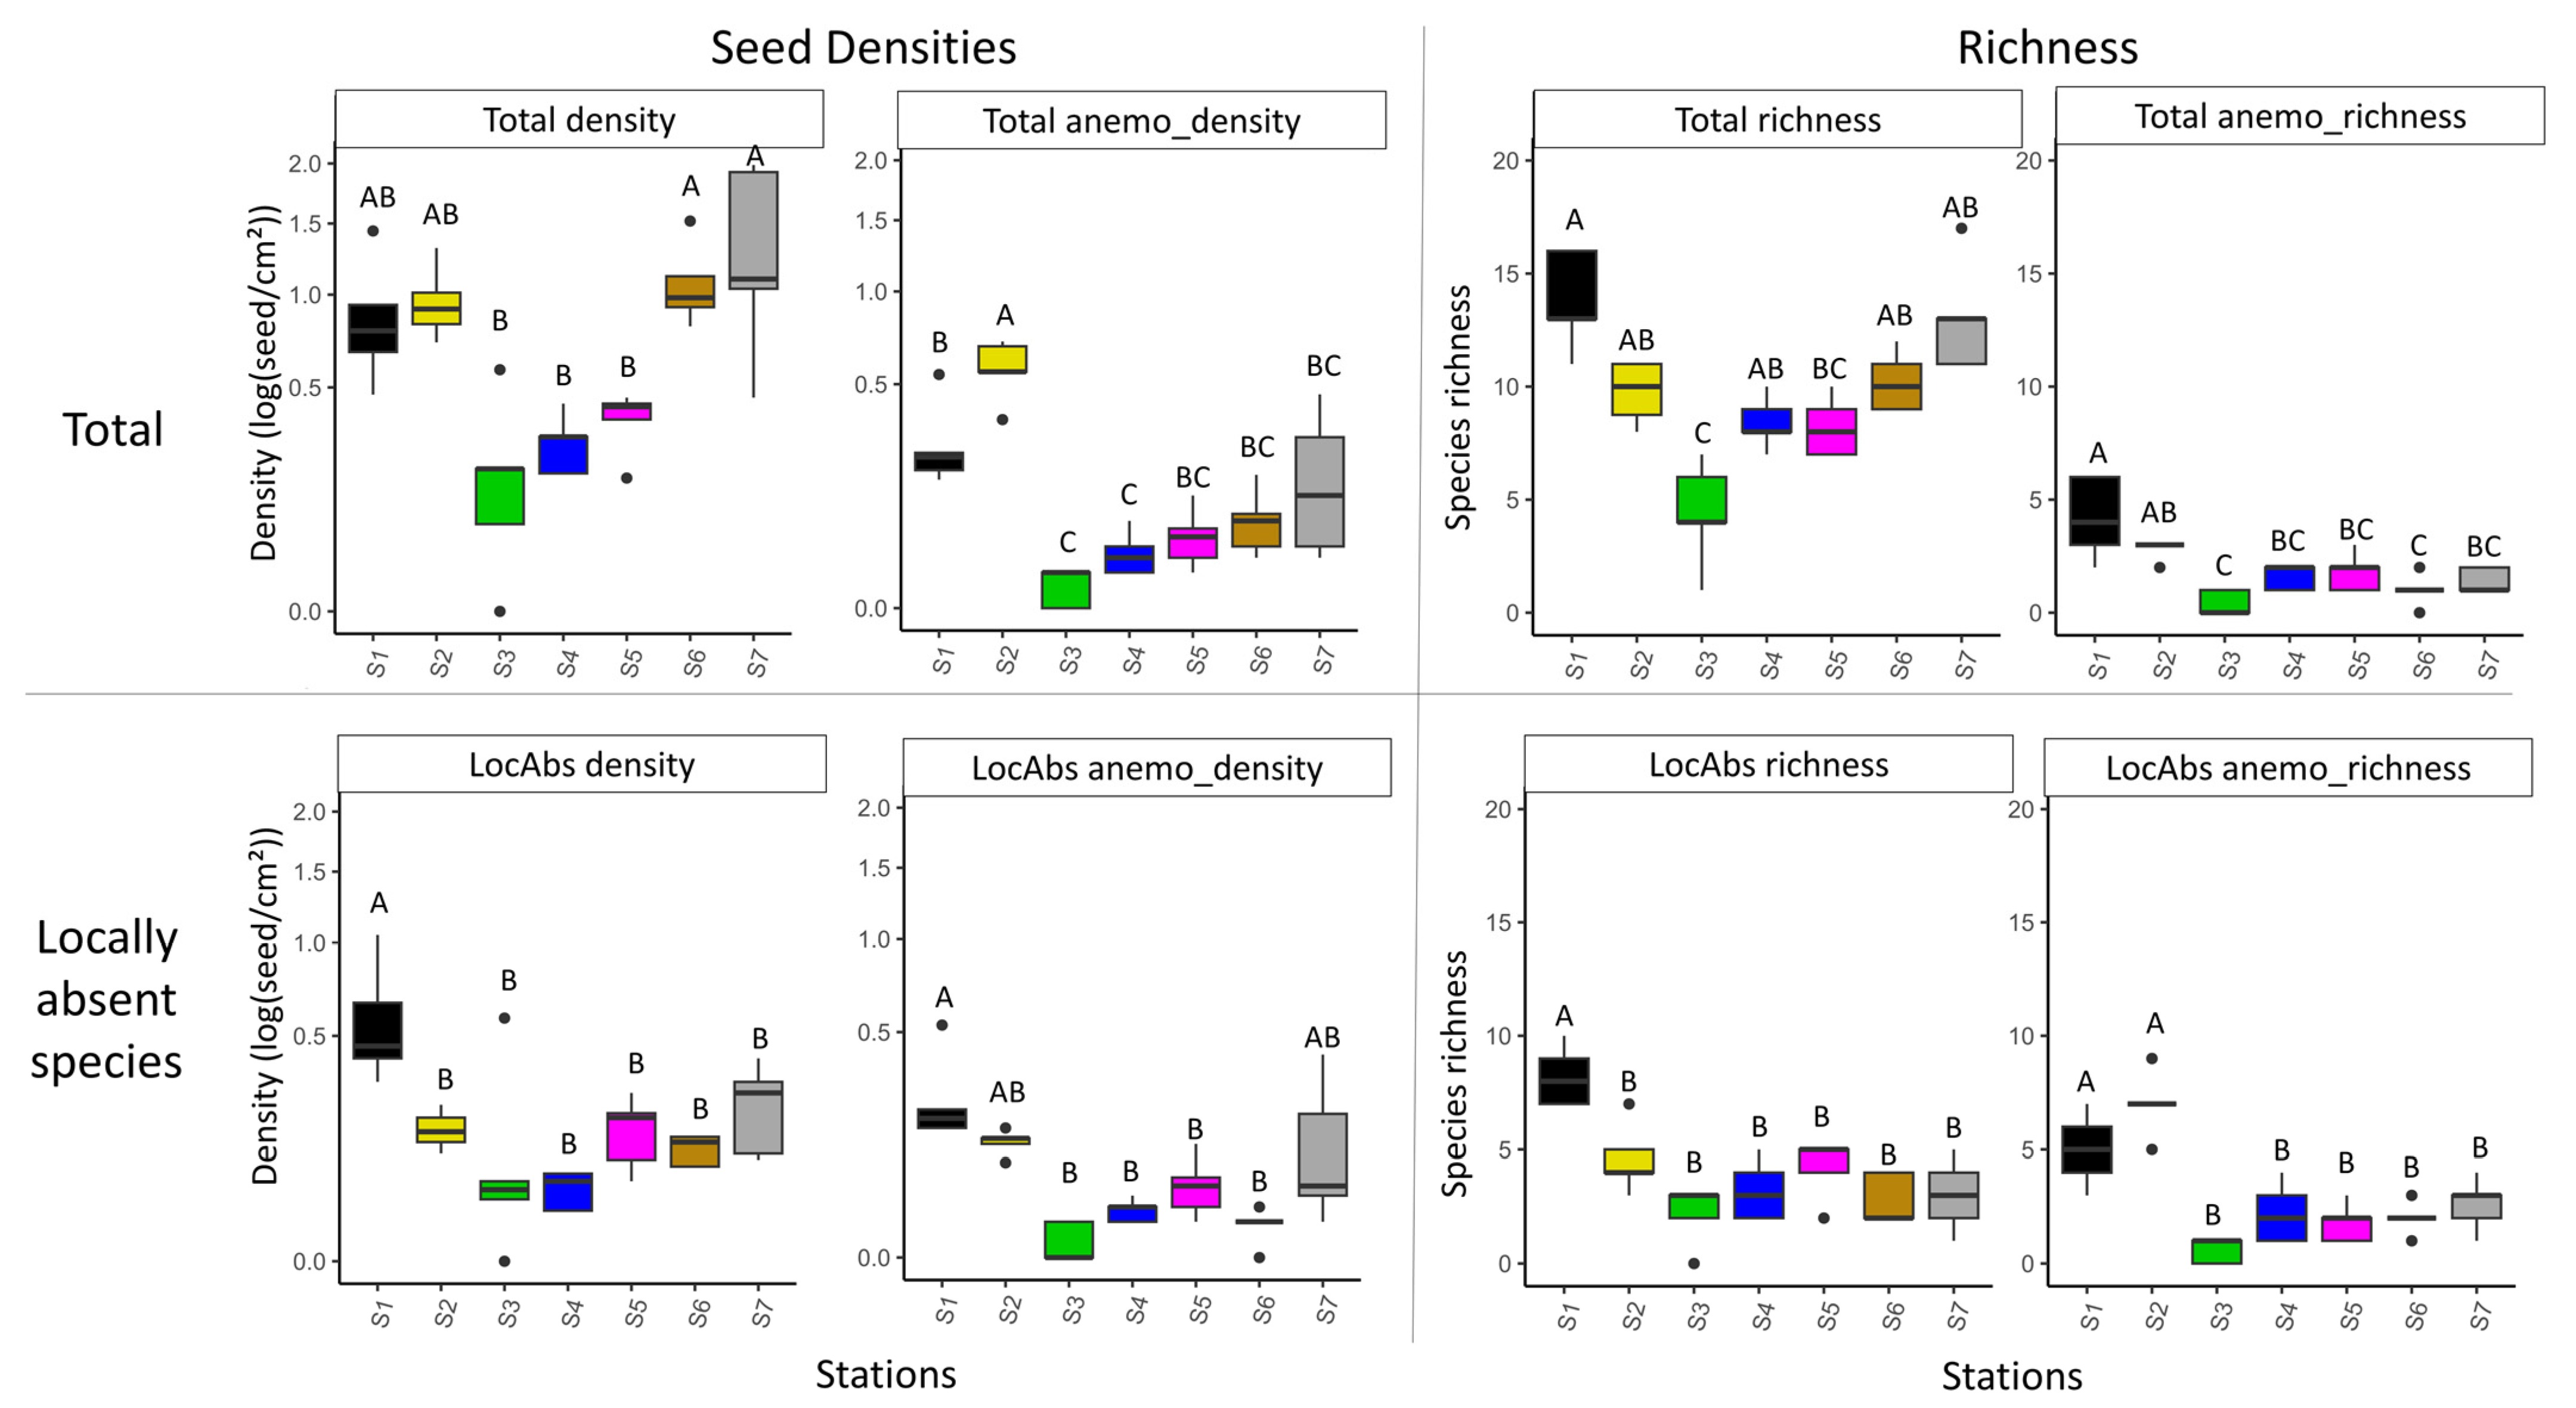
Figure 3.
Species ordination according to correspondence analysis based on all seeds (without Agrostis sp.) trapped, at least in five traps, in the seven stations. Species codes and dispersal strategies are provided in Appendix A. Station colors refer to those used in Figure 2.
Figure 3.
Species ordination according to correspondence analysis based on all seeds (without Agrostis sp.) trapped, at least in five traps, in the seven stations. Species codes and dispersal strategies are provided in Appendix A. Station colors refer to those used in Figure 2.
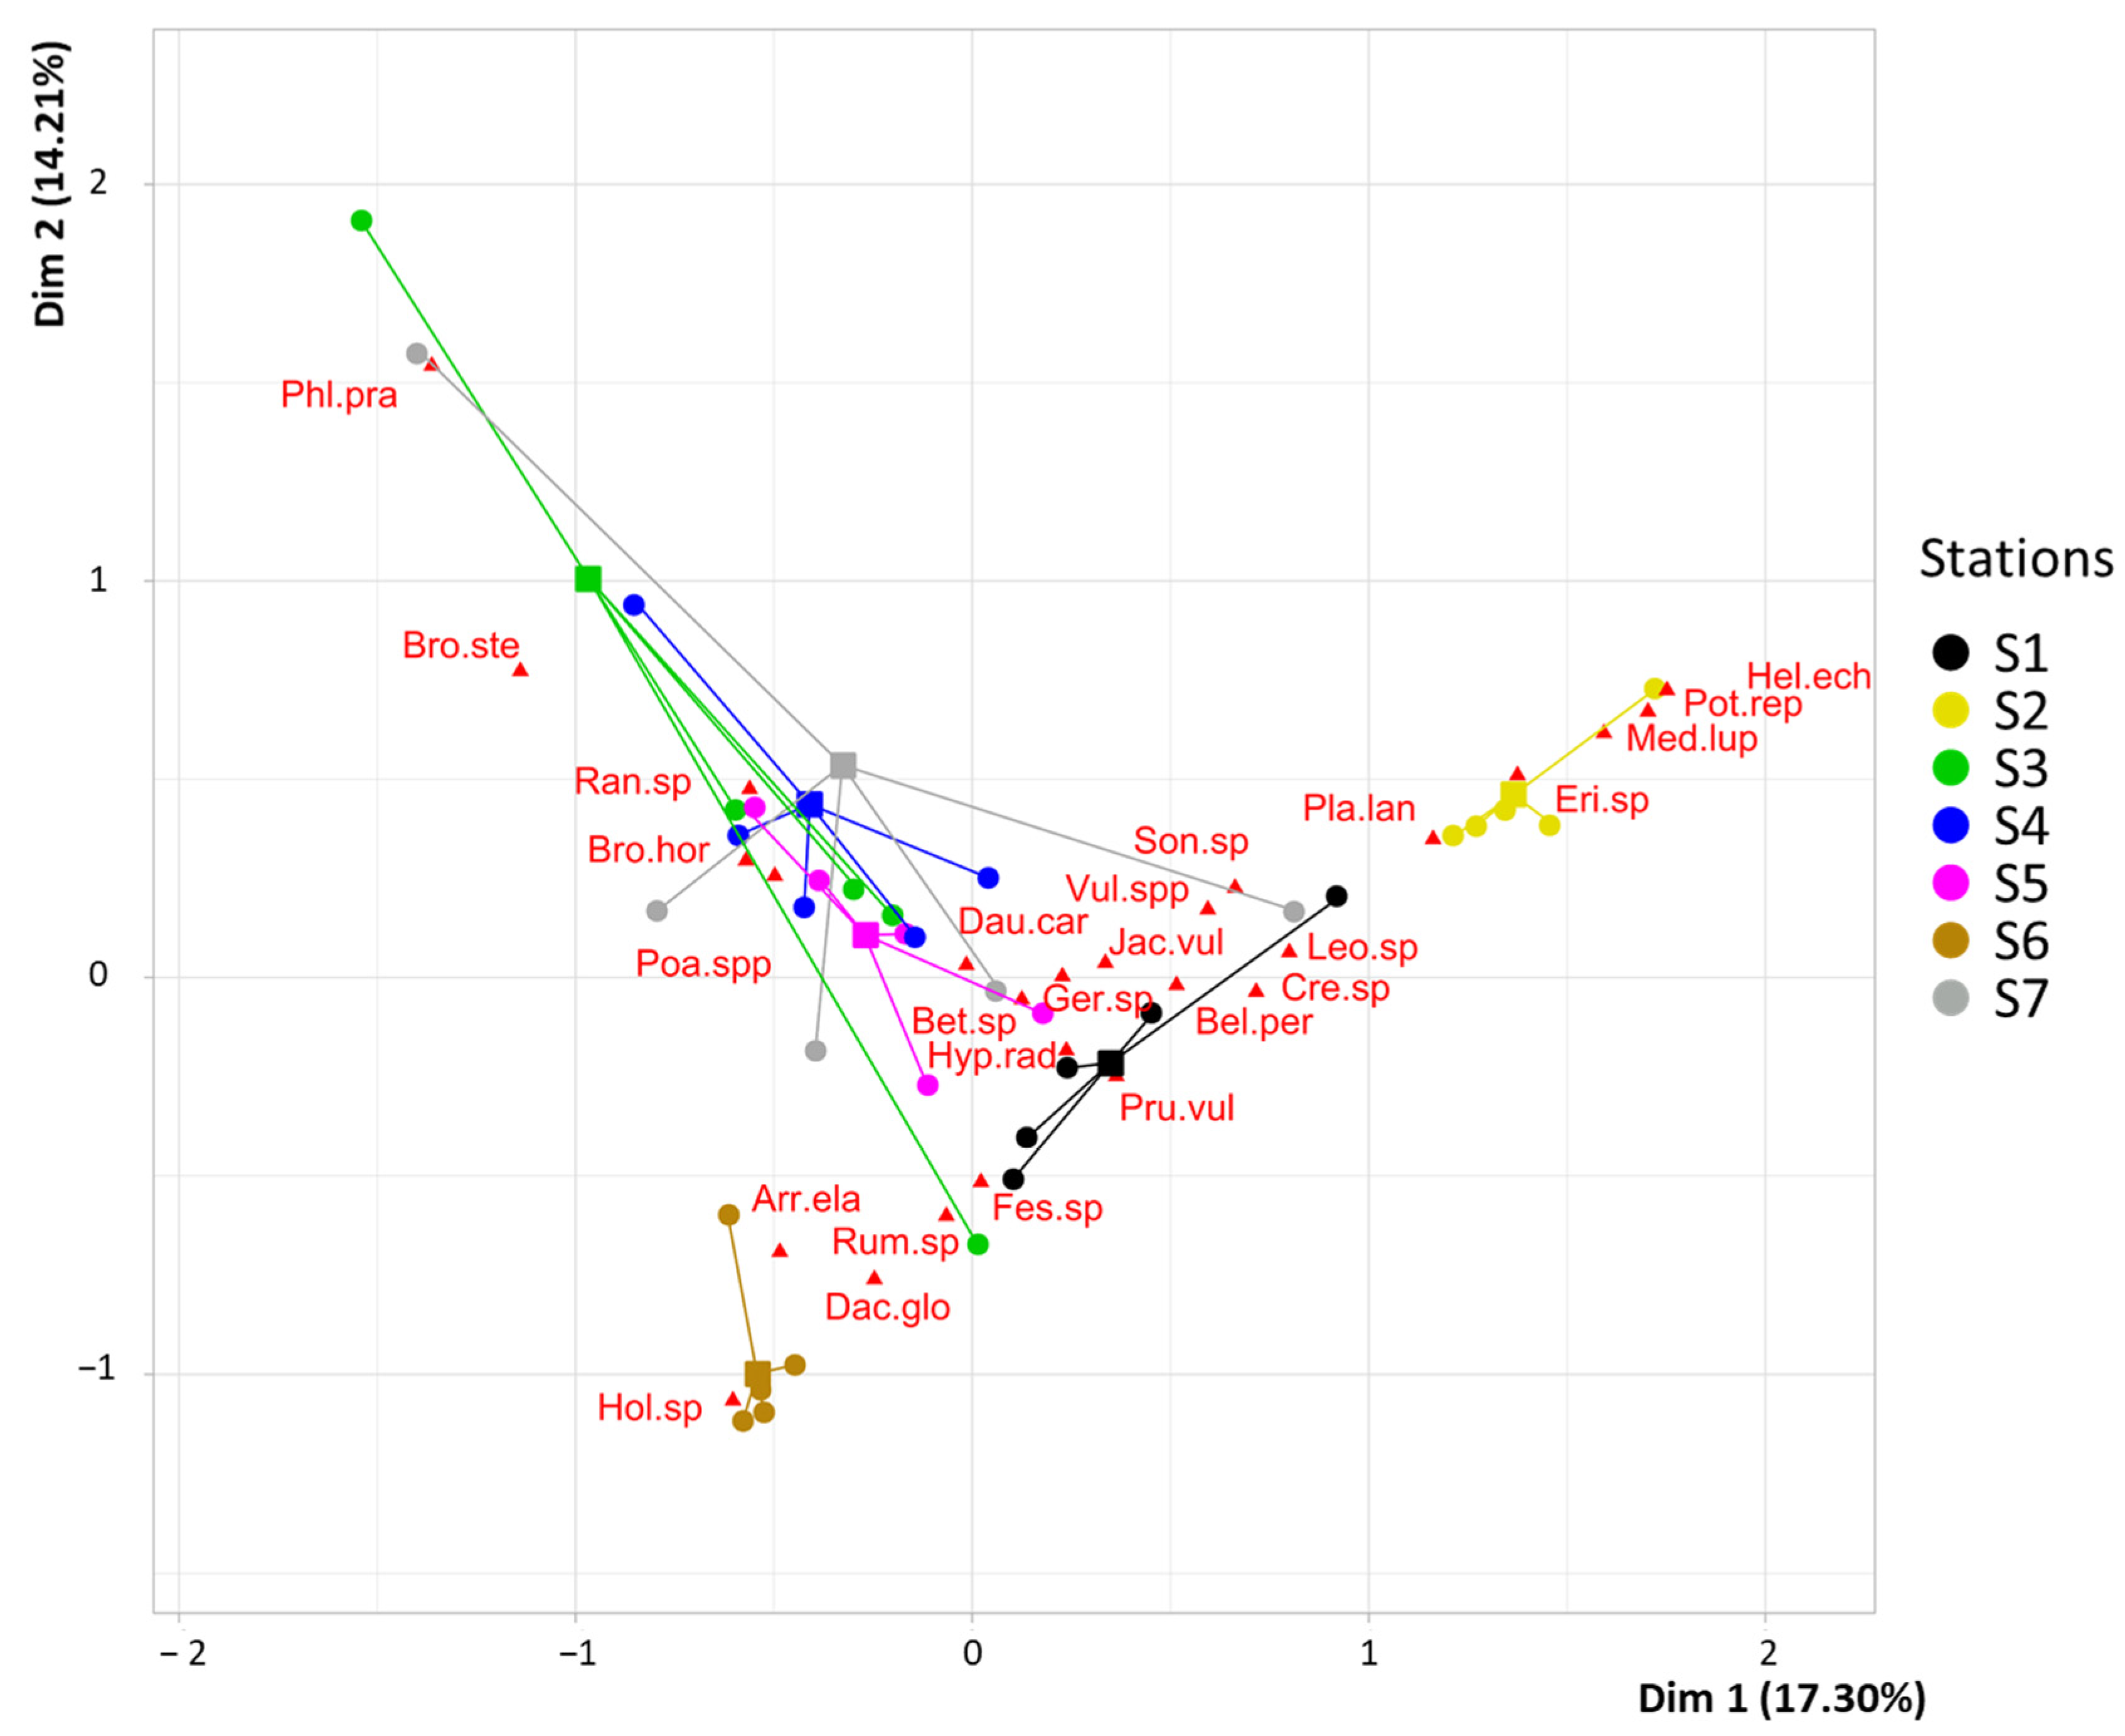
Figure 4.
Species ordination according to correspondence analysis based on seeds of locally absent species alone, trapped in the seven stations. For species codes and dispersal strategies, see Appendix A. Station colors refer to those used in Figure 2.
Figure 4.
Species ordination according to correspondence analysis based on seeds of locally absent species alone, trapped in the seven stations. For species codes and dispersal strategies, see Appendix A. Station colors refer to those used in Figure 2.
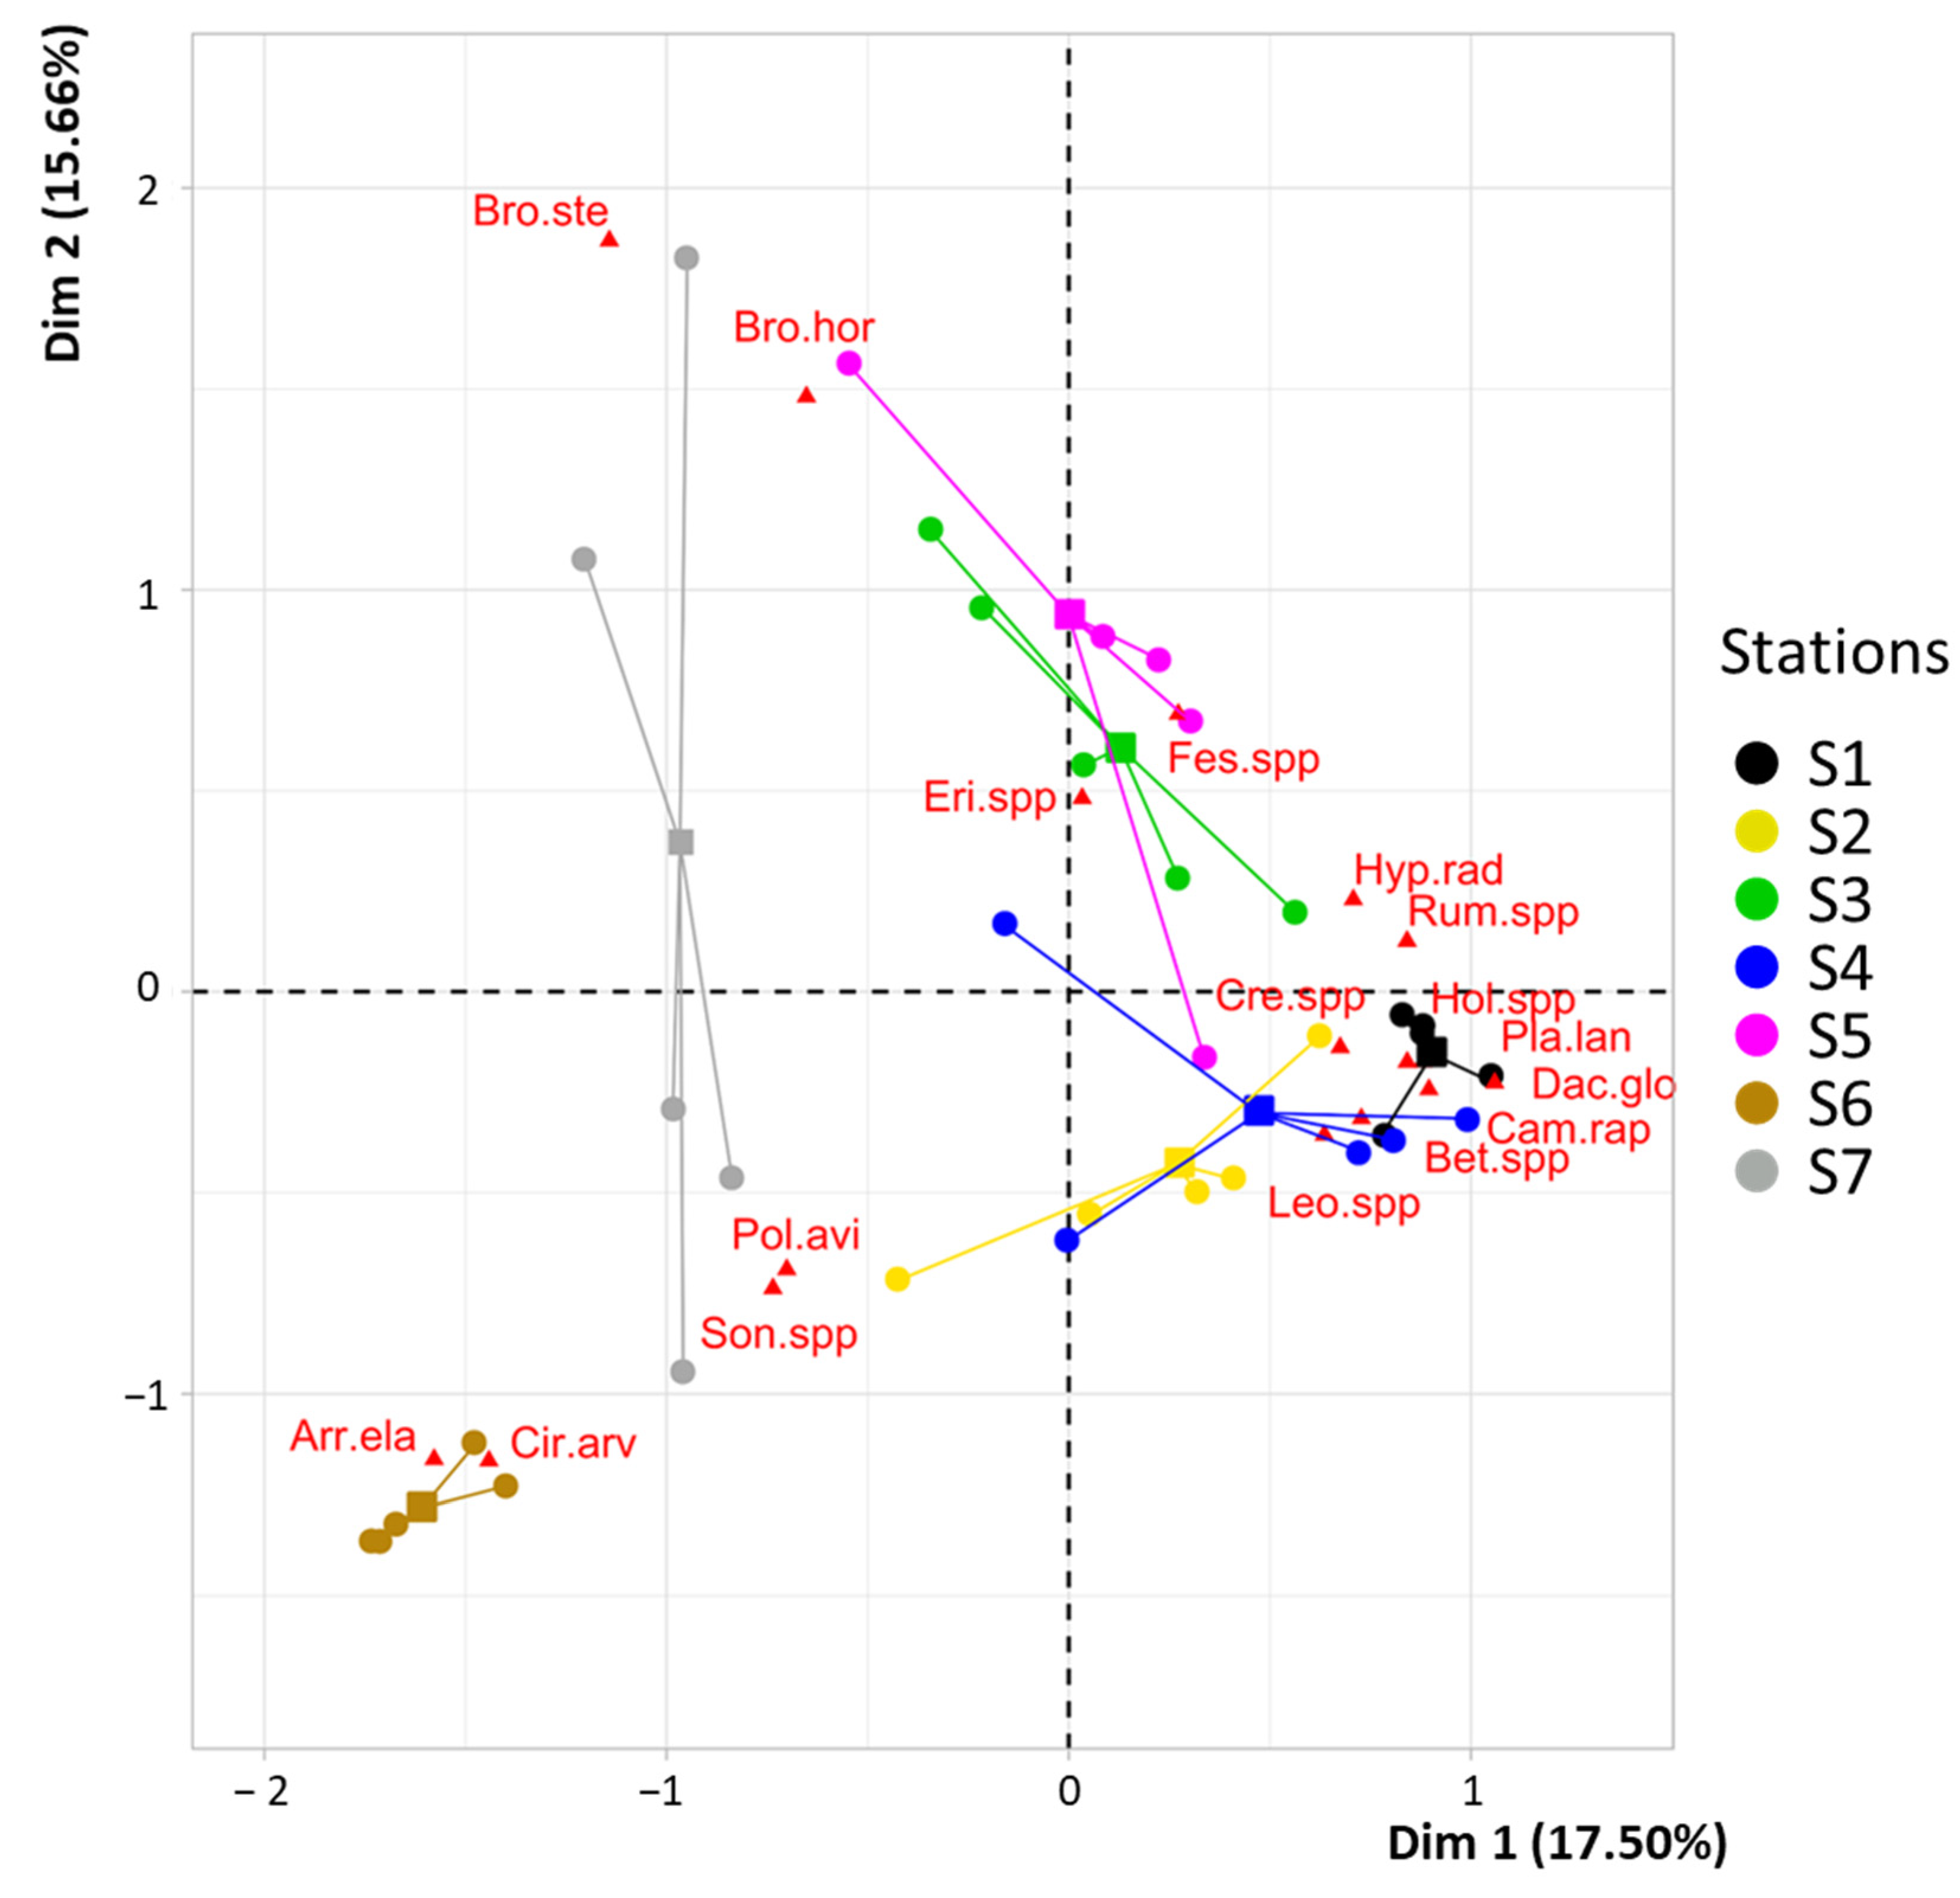
Figure 5.
Boxplots of variation in seed densities (without Agrostis sp.) and richness according to trap type and height, considering all species (first line) and only locally absent (LocAbs) species (second line). The two variables were tested, both considering all dispersal strategies and focusing on anemochorous seeds alone (anemo). Densities were log-transformed and are represented in square root scale to allow comparison among densities. Different letters indicate significant differences among trap types and heights (according to Kruskal–Wallis and Dunn post hoc results with Benjamini–Hochberg p-value adjustment).
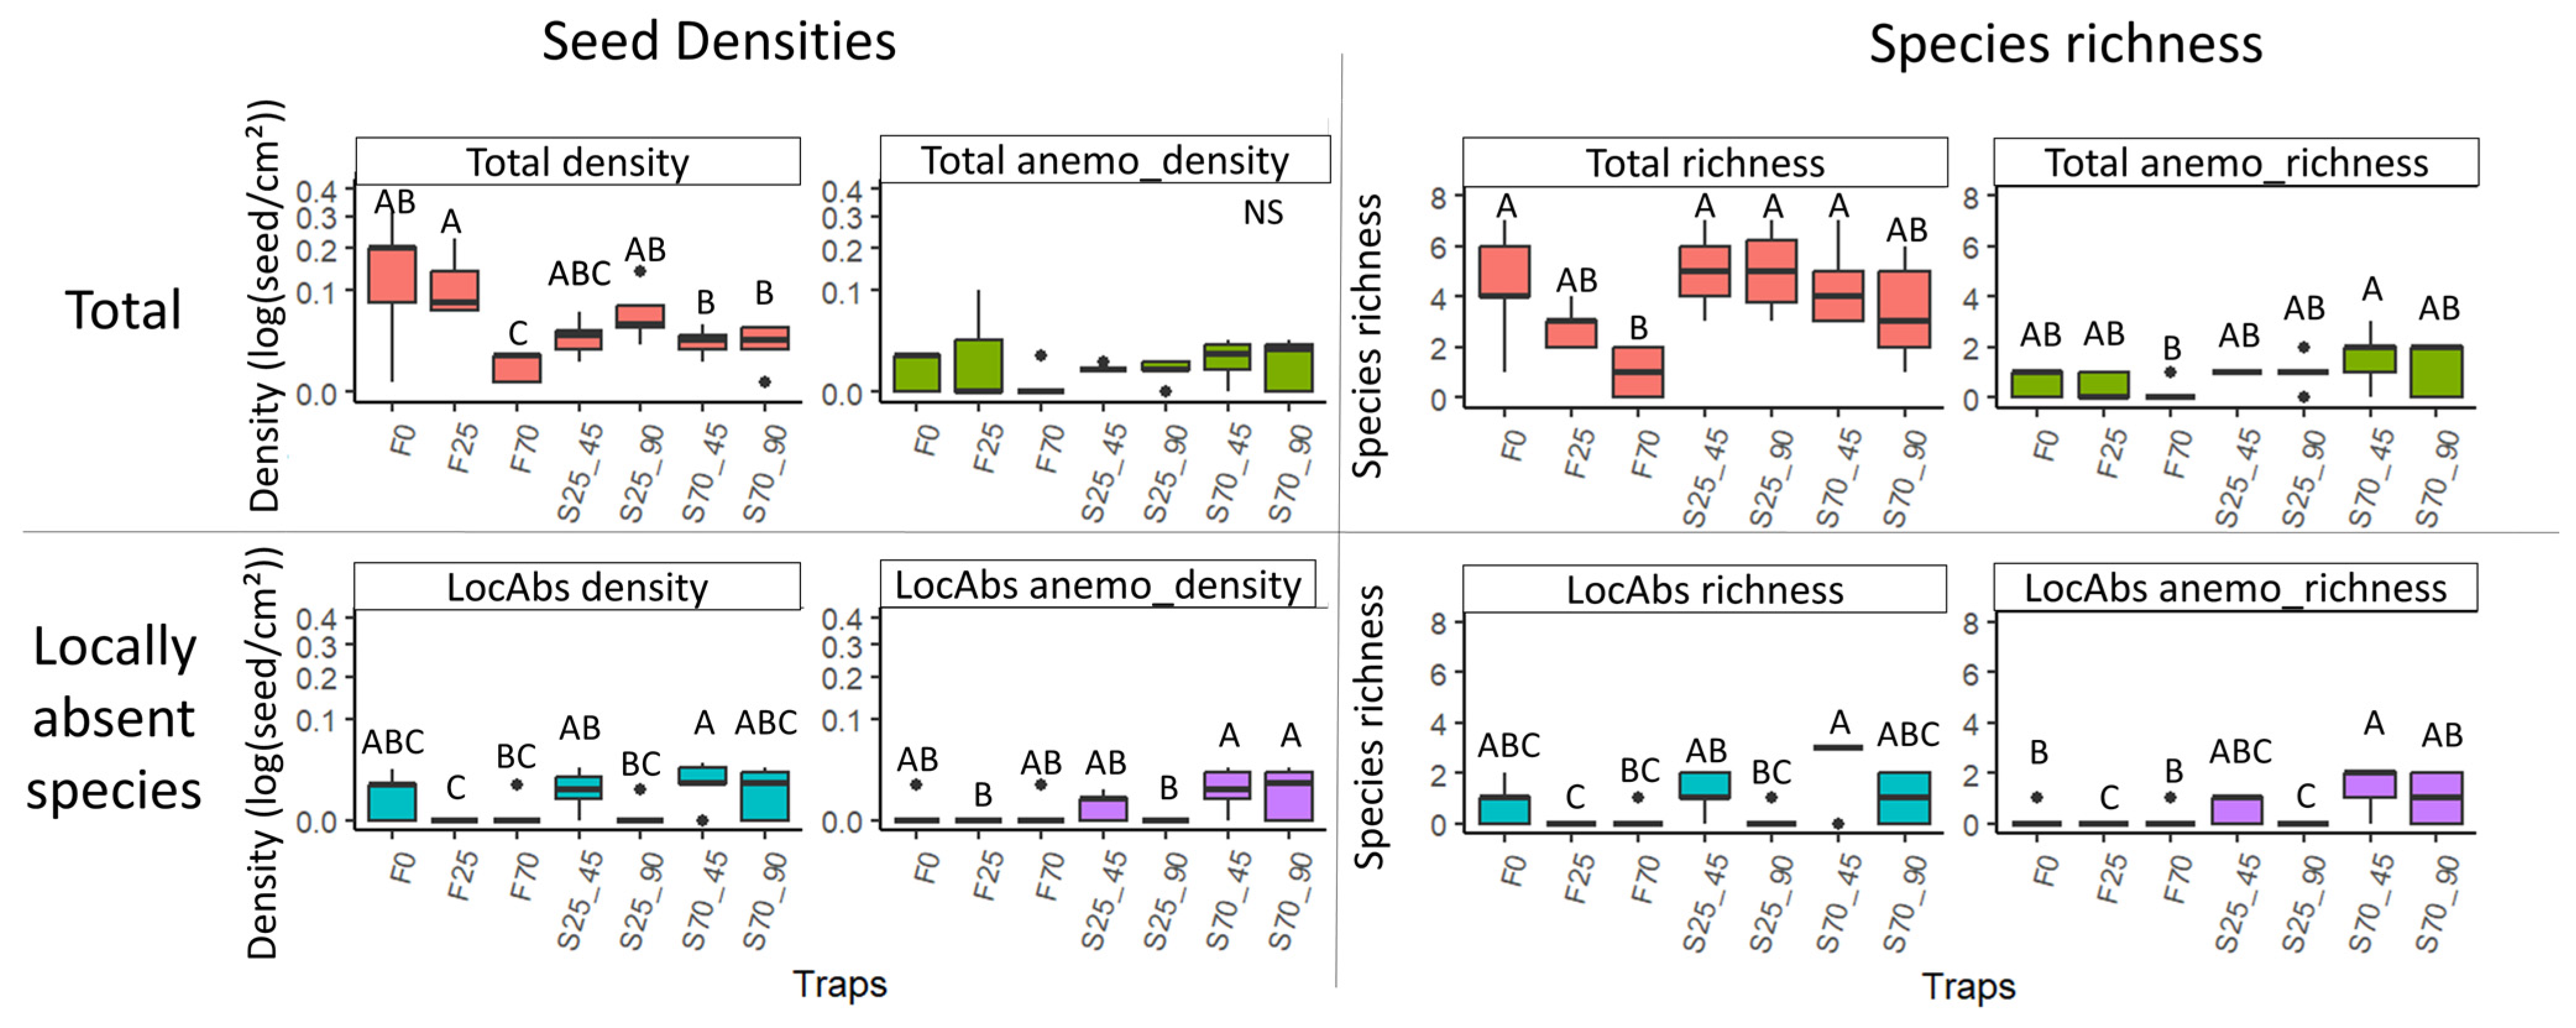
Figure 6.
Boxplots of seed densities (without Agrostis sp.) and species richness variability according to trap surface area, considering all species (first line) and only locally absent (LocAbs) species (second line). The two variables were tested, both considering all dispersal strategies and focusing on anemochorous seeds alone (anemo). Densities were log-transformed and are represented in square root scale. NS: not significant (according to Kruskal–Wallis results with Benjamini–Hochberg p-value adjustment).
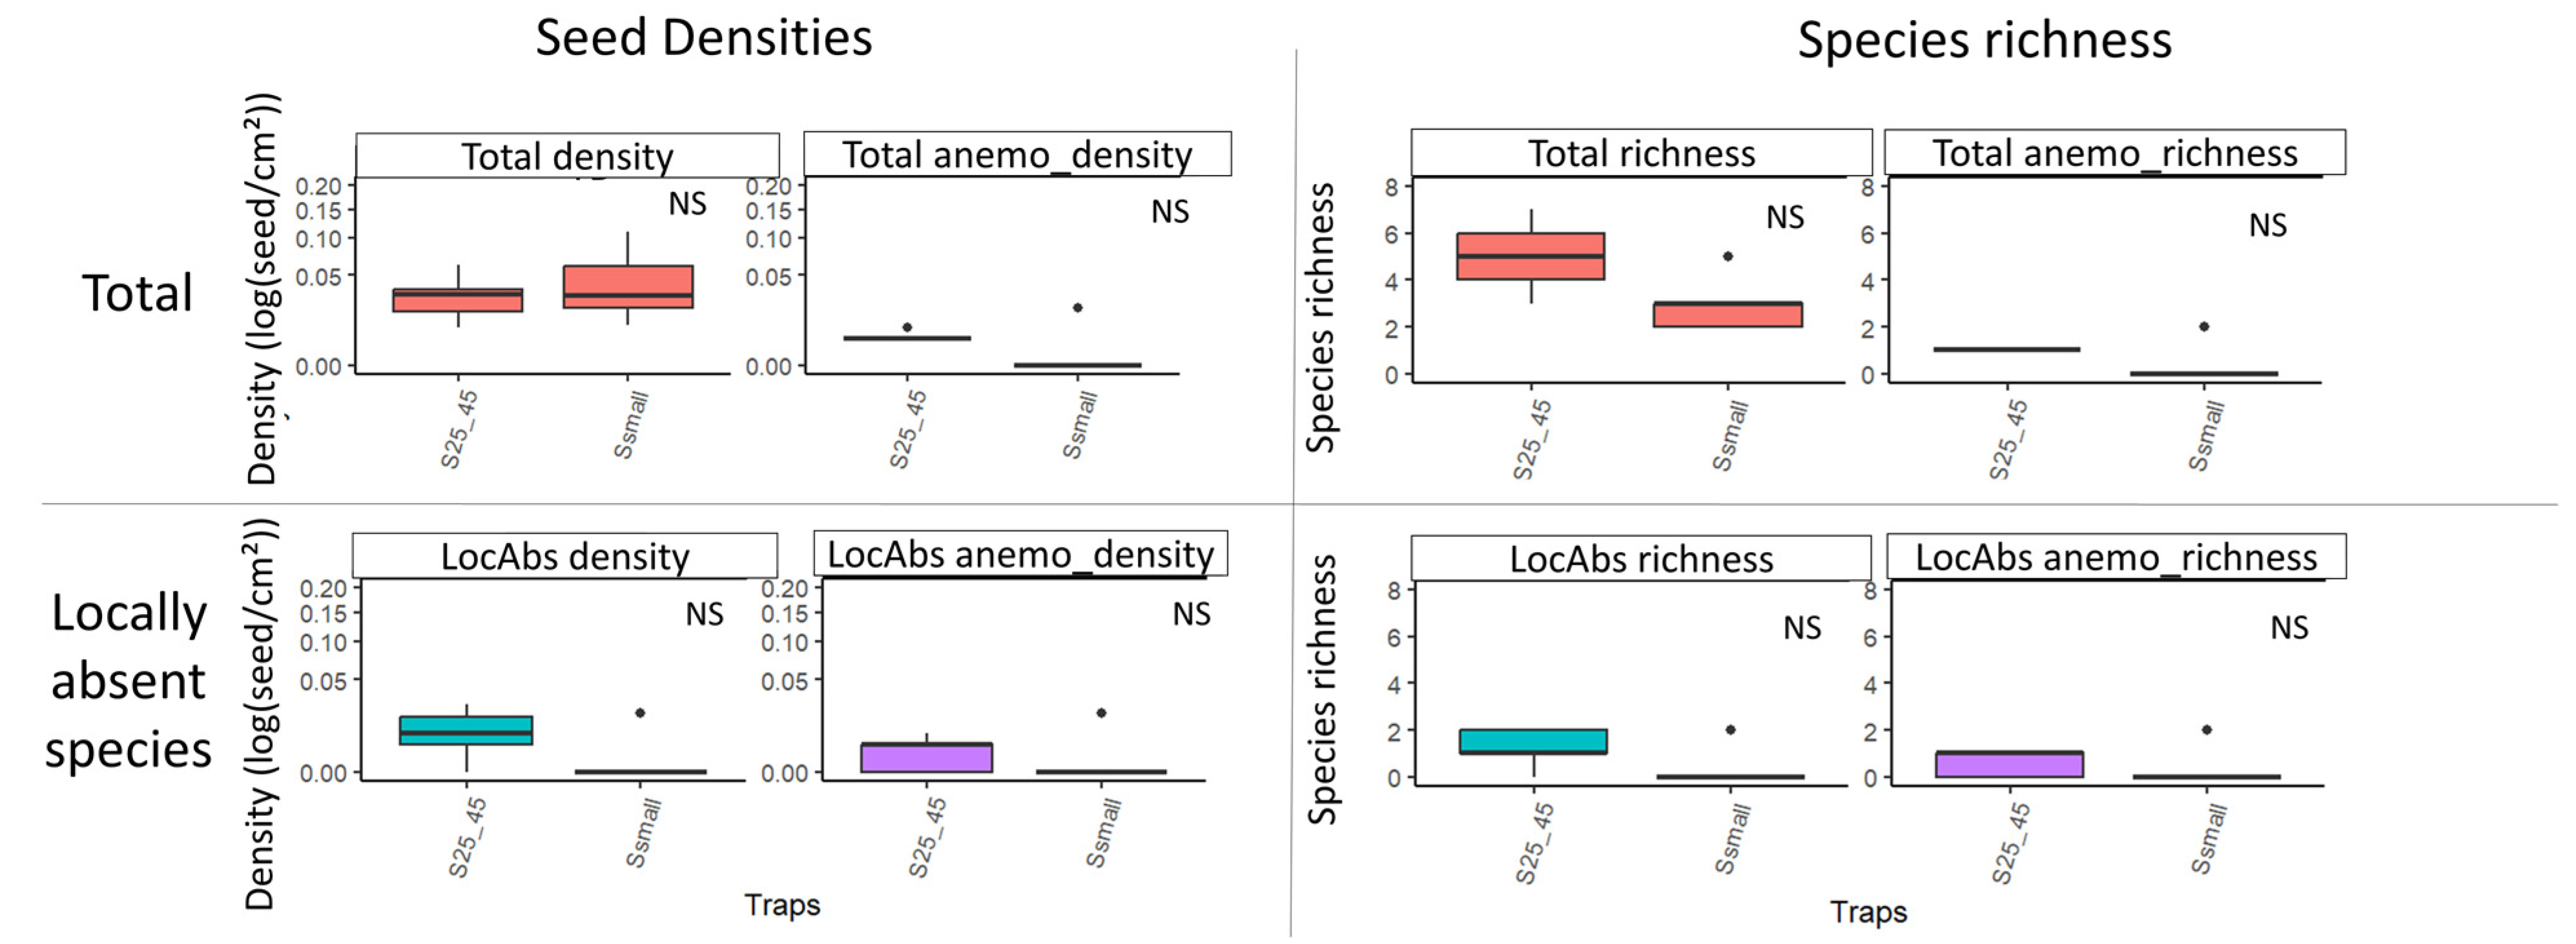
Figure 7.
Boxplots of seed densities (without Agrostis sp.) and species richness variability according to trap form, considering all species (first line) and only locally absent (LocAbs) species (second line). The two variables were tested, both considering all dispersal strategies and focusing on anemochorous seeds alone (anemo). Densities were log-transformed and are represented in square root scale. Different letters indicate significant differences. NS: not significant (according to Kruskal–Wallis results with Benjamini–Hochberg p-value adjustment).

Table 1.
Summary of seed trap characteristics tested at sampling station S3.
| Type of Trap | Height (cm) | Tilt | Area (cm2) | ID | |
|---|---|---|---|---|---|
| Funnel | 70 | - | 79 | F70 | |
| 25 | - | 79 | F25 | ||
| 0 | - | 79 | F0 | ||
| Sticky plate | 70 | 45° | 225 | S70_45 | |
| 90° | 225 | S70_90 | |||
| 25 | 45° | 225 | S25_45 | ||
| 90° | 225 | S25_90 | |||
| Other shapes of sticky traps | Small plate (10 × 10 cm) | 25 | 45° | 100 | Ssmall |
| Cone | 25 | - | 257 | Scone | |
| Hemisphere | 25 | - | 266 | Ssphere | |
Disclaimer/Publisher’s Note: The statements, opinions and data contained in all publications are solely those of the individual author(s) and contributor(s) and not of MDPI and/or the editor(s). MDPI and/or the editor(s) disclaim responsibility for any injury to people or property resulting from any ideas, methods, instructions or products referred to in the content. |
© 2023 by the authors. Licensee MDPI, Basel, Switzerland. This article is an open access article distributed under the terms and conditions of the Creative Commons Attribution (CC BY) license (https://creativecommons.org/licenses/by/4.0/).
Share and Cite
MDPI and ACS Style
Gros, C.; Bulot, A.; Braud, F.; Aviron, S.; Daniel, H. Effectiveness of Seed Traps for Assessing Seed Rain in Periurban Grasslands. Diversity 2023, 15, 1015. https://doi.org/10.3390/d15091015
AMA Style
Gros C, Bulot A, Braud F, Aviron S, Daniel H. Effectiveness of Seed Traps for Assessing Seed Rain in Periurban Grasslands. Diversity. 2023; 15(9):1015. https://doi.org/10.3390/d15091015
Chicago/Turabian StyleGros, Clément, Adeline Bulot, Ferréol Braud, Stéphanie Aviron, and Hervé Daniel. 2023. "Effectiveness of Seed Traps for Assessing Seed Rain in Periurban Grasslands" Diversity 15, no. 9: 1015. https://doi.org/10.3390/d15091015
Note that from the first issue of 2016, this journal uses article numbers instead of page numbers. See further details here.