Article

Diversity and Structure of Soil Fungal Communities across Experimental Everglades Tree Islands

1
Biology Department, University of Miami, Coral Gables, FL 33146, USA
2
Department of Earth and Environment, Florida International University, Miami, FL 33199, USA
3
Institute of Environment, Florida International University, Miami, FL 33199, USA
4
South Florida Water Management District, West Palm Beach, FL 33406, USA
*
Author to whom correspondence should be addressed.
Diversity 2020, 12(9), 324; https://doi.org/10.3390/d12090324
Submission received: 29 June 2020 / Revised: 6 August 2020 / Accepted: 19 August 2020 / Published: 25 August 2020
(This article belongs to the Special Issue Fungal Diversity)

Abstract

:
Fungi play prominent roles in ecosystem services (e.g., nutrient cycling, decomposition) and thus have increasingly garnered attention in restoration ecology. However, it is unclear how most management decisions impact fungal communities, making it difficult to protect fungal diversity and utilize fungi to improve restoration success. To understand the effects of restoration decisions and environmental variation on fungal communities, we sequenced soil fungal microbiomes from 96 sites across eight experimental Everglades tree islands approximately 15 years after restoration occurred. We found that early restoration decisions can have enduring consequences for fungal communities. Factors experimentally manipulated in 2003–2007 (e.g., type of island core) had significant legacy effects on fungal community composition. Our results also emphasized the role of water regime in fungal diversity, composition, and function. As the relative water level decreased, so did fungal diversity, with an approximately 25% decline in the driest sites. Further, as the water level decreased, the abundance of the plant pathogen–saprotroph guild increased, suggesting that low water may increase plant-pathogen interactions. Our results indicate that early restoration decisions can have long-term consequences for fungal community composition and function and suggest that a drier future in the Everglades could reduce fungal diversity on imperiled tree islands.

1. Introduction

Fungi play important roles in many ecosystem functions and services, especially those that involve soil [1,2], where they make up an estimated 55–85% of the microbial biomass [3,4]. These fungi are crucial for the decomposition of organic carbon, cycling of nitrogen and phosphorus, and belowground carbon sequestration [1,5,6,7]. Soil fungi also indirectly contribute to ecosystem function through their interactions with primary producers. For instance, they affect plant growth and community composition through pathogenic attacks on particular plant taxa, changes to plant–plant competition, and beneficial interactions that ameliorate environmental stress [8,9,10,11,12]. Given the important ecological roles of fungi and their interactions with primary producers, soil fungal communities can be a valuable tool for improving terrestrial restoration but are often overlooked in both restoration planning and the assessment of success [13]. Research has shown that fungal amendment can improve the fertility and water availability of soil [14] and the establishment, growth, and survival of seedlings in restored habitats [15]. However, the value of fungal communities for improving restoration success likely depends on their composition and diversity, as these properties can influence both their direct and indirect effects on ecosystems. For example, a greater diversity of mycorrhizal fungi often results in a more efficient exploitation of phosphorus and therefore greater plant growth [16,17]. Similarly, a recent study showed that as microbial diversity increased, so did the simultaneous maintenance of diverse ecosystem functions and services [18]. Previous restoration studies have demonstrated how important the origin of fungal inocula can be for the overall productivity and plant community composition of degraded lands [19,20]. Further, inoculating with more complex and field-acquired soil microbial communities often results in greater plant growth than commercially available fungi (usually single-strain mycorrhizal inocula) [21,22], suggesting that the diversity and composition of the fungal community added is important for restoration success. While it is possible to use fungi in restoration without detailed knowledge of their communities, understanding the environmental factors that affect these assemblages can help steer management decisions to increase the benefit of fungal amendments and improve the conservation of fungal diversity in threatened ecosystems.
One imperiled habitat for which understanding soil fungal communities could help achieve meaningful restoration goals are the tree islands of the Florida Everglades. The Greater Everglades Ecosystem, which originally spanned over 10,000 km2 of South Florida, is the largest designated wilderness in the Eastern United States, a Natural World Heritage Site, a Ramsar Wetland of International Importance, and home to 103 threatened or endangered plants and animals [23]. Unfortunately, this unique ecosystem is highly threatened by habitat destruction and the hydrologic changes required for urbanization and agriculture as well as by invasive species, climate change, and pollution [24,25,26]. These changes have negatively impacted both the aquatic and terrestrial biodiversity of this system (e.g., estimated declines of up to 90% in some wading bird populations and 90–98% declines in small mammal populations within Everglades National Park; [25,27]). While much of the Everglades landscape is a freshwater wetland characterized by sawgrass marsh and persistently flooded sloughs, tree islands—aggregations of woody vegetation on elevated peat or limestone—are important features of this ecosystem [28]. In addition to being critical habitats for resting and foraging wading birds, American alligators, white-tailed deer, and other animals [29], tree islands are biogeochemical hotspots within an otherwise nutrient-poor ecosystem. Despite making up a relatively small portion of the landscape (e.g., approximately 4% historically in the central Everglades), tree islands are estimated to sequester approximately 67% of the phosphorus in the Everglades (up to 100 times more phosphorus than the surrounding wetlands) and promote the retention of nitrogen by the landscape [28,30,31]. Urbanization since the 1950s in South Florida has led to anthropogenically driven changes to Everglades hydrology, which is believed to be the main driver of tree island loss (up to 87% in some areas) [32]. As tree mortality increases, the transition from a “healthy” tree island into a treeless “ghost” island is accompanied by a release of sequestered nutrients into the surrounding wetland habitats [30]. This nutrient release is thought to have cascading effects on ecosystem and species dynamics in these impacted landscapes (e.g., invasive cattails outcompete native sawgrass in high-phosphorus areas; [33]).
As a result of the importance of tree islands in the Everglades and their substantial decline, the restoration of ghost islands and creation of constructed tree islands is an important piece of the Comprehensive Everglades Restoration Plan [34]. There are several reasons that soil fungi may be especially integral to the success of tree island restoration. First, as the primary decomposers, soil fungi are likely to play a central role in regulating soil formation [35,36], which is a goal for the restoration of both degraded tree islands and self-perpetuating, fully-functioning constructed tree islands. Second, soil fungi can be important in nutrient immobilization (e.g., fungi are responsible for the immobilization of approximately 20–30% of global phosphorus pools; [1,5]), which could help sequester phosphorus and nitrogen within islands and reduce leaching into the surrounding wetlands. Third, fungal mutualists (e.g., mycorrhizal fungi) may increase tree island stability by increasing tree resilience to natural and anthropogenic stress [9], and fungal pathogens may be crucial for restoring a natural tree community composition by regulating the abundance of dominant plant species [37]. While fungal communities in the peat and periphyton of the Everglades wetlands have been investigated in a few cases [38,39,40], the terrestrial fungal communities of Everglades tree islands are unexplored. In fact, we are aware of no studies of the diversity or composition of soil fungal communities on Everglades tree islands. To improve the protection, and even utilization, of fungal diversity in the restoration of tree islands, studies of the factors that structure these fungal communities are needed. Here, we use a set of eight experimental Everglades tree islands, in which abiotic and biotic factors have been manipulated to understand tree island formation, to better identify how microhabitat environmental variation and experimental restoration decisions may influence fungal diversity, composition, and functional guilds.

2. Materials and Methods

2.1. Study Site and Environmental Data Collection

We studied tree island soil fungal communities at the approximately 32-ha Loxahatchee Impoundment Landscape Assessment (LILA) facility in Loxahatchee National Wildlife Refuge in Palm Beach County, Florida, USA (26.489° N, 80.219° W). LILA contains eight approximately 2500 m2 experimental tree islands that were constructed in 2003 through a collaboration between the South Florida Water Management District and the Army Corps of Engineers. LILA is especially suitable for investigating how the soil microbiome responds to different restoration decisions, because the construction of tree islands allowed landscape-level experimental manipulations of tree island characteristics. For instance, the islands’ cores (i.e., bases of the islands) were manipulated to represent two common island types in the Everglades: peat core and limestone core islands [41]. Using locally sourced peat and limestone derived from the habitat adjacent to the current LILA facility, half of the experimental islands were constructed with peat cores and half were constructed with limestone cores (Figure S1); then, all the islands were covered with a top layer of peat substrate [42]. Similarly, each of the eight experimental islands was split into quadrants in which a mixture of 10 tree species were planted at four different densities (1 m, 1.67 m, 2.33 m, and 3 m spacing) in 2006 and 2007 (Figures S1 and S2). Given the importance of plant-fungal interactions, tree planting density may be a biotic factor that strongly affects fungal community composition. In addition, LILA has other readily available data on microhabitat variation within and among islands that can help inform our understanding of the soil microbiome. For example, because the water level is continuously monitored within the macrocosms and the topography of each island is well mapped, it is possible to track the hydrology of microhabitats using the DBHydro project from the South Florida Water Management District [42]. Using surface water-level data and the elevation of each site, we calculated the average site-specific ‘relative water level’ for all plots in 2018 (the year fungi were sampled) following the methods in [43]. Further, understory plant communities that recruited to these experimental tree islands have been monitored since 2009 [42], allowing for consideration of the understory plant community in structuring soil microbiomes. For these understory plant communities, we calculated Shannon diversity, Pielou’s evenness, and plant richness for use in our analyses. During the monitoring of each site, understory plant biomass was estimated (by applying allometric equations developed from separate biomass collection plots to estimates of plant cover). To gain insight into the light environment (another abiotic feature of interest), hemispherical canopy photographs were also taken using a digital camera (Nikon Coolpix 995; Nikon, Tokyo, Japan) equipped with a hemispherical lens (Nikon Fisheye Converter FC-E8 0.21×, Tokyo, Japan) at each site, and canopy openness was determined using the software Gap Light Analyzer (GLA), version 2.0, Burnaby, BC, Canada [44].

2.2. Soil Collection

In June 2018, we collected soil microbiomes from 96 sites. We colocated our fungal community sampling with 96 understory plant community plots established in 2009. These plots were evenly distributed among islands (12 per island) and among experimental treatments, i.e., island core type treatments (48 plots on peat core versus 48 plots on limestone core island) and tree planting density treatments (24 plots per density). On each island, the three plots were randomly assigned to locations within each tree density quadrant (e.g., Figure S2). For each sampling point, we used a soil corer to aseptically collect approximately 50 mL of soil at 15–25 cm below the soil surface and approximately 0.25 m from the center of the 1 m2 plot (indicated by permanent PVC site marker). Soil samples were placed in sterile conical tubes and transported on ice to University of Miami’s campus where they were kept at −80 °C.

2.3. DNA Sequencing and Data Processing

We extracted DNA from 0.25 g of each soil sample using the E.Z.N.A. Soil DNA kit (Omega, D5625-01, Norcross, GA, USA). We removed PCR inhibitors from DNA samples with agarose gel electrophoresis and extracted genomic bands (i.e., >15 kilobases; E.Z.N.A Gel Extraction kit, Omega, D2500-01, Norcross, GA, USA). We performed quality control by endpoint PCR of the fungal ribosomal ITS1 region to confirm that enough PCR inhibitors were removed to obtain DNA of sufficient quality for amplification. The ITS1 region was amplified via PCR using two-step dual-indexing [45], and amplicon libraries were sequenced at the University of Minnesota Genomics Center (UMGC) using the Illumina MiSeq platform (v3, 300 bp paired-end, San Diego, CA, USA). We also sequenced three negative controls in which ultrapure water (G-Biosciences, St. Louis, MO, USA; 786–293) was used in place of soil during extractions to confirm that samples were not contaminated during the DNA extraction process. UMGC demultiplexed reads using bcl2fastq. We denoised reads, joined paired ends, and grouped reads into exact sequence variants (ESVs; i.e., operational taxonomic units at 100% sequence similarity) with the QIIME2 pipeline (v2019.1, [46]). We rarefied sequences to 4000 reads per sample to account for unequal sequencing depths and excluded samples with less than 4000 reads (12 of 96 samples). We classified ESVs into fungal “species” if they shared at least 97% sequence similarity to reference sequences in the UNITE database (version v7_01.12.2017, [47]). For the fungal community at each site, richness was determined based on the number of rarefied ESVs, and Shannon diversity was calculated using sequence reads of ESVs as estimates of abundance. Note that using ESVs, compared to OTUs (Operational Taxonomic Units) with 97% sequence similarity, may result in higher absolute fungal richness, but ESVs and 97% OTUs are often highly correlated, such that comparisons among treatments are robust to sequence binning choices [48].

2.4. Data Analyses

To understand which abiotic and biotic factors explain fungal community diversity and richness, we performed model selection with the abiotic and biotic factors in Table 1 as explanatory variables and identified the best model based on AIC using dredge (R package MuMin; [49]). We also included tree island identity as a random effect in the model selection to account for understory plant community variation between islands. We confirmed that model variables were not highly correlated with each other before performing model selection (all correlation coefficient <0.7; Figure 2). To investigate the possible causes of variation in fungal community composition, we performed a distance-based redundancy analysis (dbRDA, Bray-Curtis) with the same abiotic and biotic factors as explanatory variables using capscale (R package vegan; [50]). Indicator taxa analysis was used to identify which of the 500 most common fungal taxa were associated with differences in community composition between treatments for significant categorical variables (e.g., limestone versus peat core). We calculated ‘indicator values’ of the fungal taxa based on the relative abundance and consistency in each treatment and determined the significance of these values with permutation tests (R package indicspecies [51,52]), which were FDR (False Discovery Rate) corrected for multiple comparisons. We also conducted a Mantel test between fungal and plant community distance matrices using mantel (R package vegan, [50]) to examine whether the variation in fungal community composition can be explained by variation in understory plant community composition.
To investigate the distribution of functional guilds of fungi, we used the FUNGuild database (version v1.1; [53]), which assigned each taxa identified at the species level via UNITE to a functional guild (e.g., leaf saprotroph or fungal parasite) and a trophic mode (e.g., symbiotrophic, pathotrophic) (Figure S3A,B). ESVs that were not identified to the species level were not included in this analysis. We also filtered to include only taxa that had guild and trophic mode assignments with the confidence rankings “Highly Probable” and identified the three most common guilds based on their normalized ESV counts. For our analyses, we focused on functional guild assignments using model selection to determine which biotic and abiotic variables explained variation in the number of different guilds present at a site (guild richness) and the relative abundances of the top three most common functional guilds. As above, our model selection used linear mixed effects models with abiotic and biotic factors as explanatory variables and tree island identity as a random effect. All statistical analyses were performed in R ver 3.6.0.

3. Results

3.1. Sequencing and ESV Taxonomic Assignments Statistics

After quality control filtering, 84 of the 96 samples had sufficient read counts to reach our saturation cutoff (≥4000 reads) required to be included in analyses. Across these samples, there were over 9000 ESVs, with an average of 243 ± 11 ESVs per sample. Using the UNITE database, we identified approximately 35% of all ESVs and an average of 100 ± 5 taxa per sample (mean ± s.e) to at least the order level. Approximately 20% of all ESVs were identified in UNITE to the species level, allowing them to be included in our functional analyses using FUNGuild. Fusarium keratoplasticum was most common across sites, occurring in 71 of the 84 sites, followed by Penicillium sp. (69 of 84 sites) and Retroconis fusiformis (69 of 84 sites). An unidentified fungal taxa had the greatest number of reads on average (1149) followed in abundance by an ESV from the order Tremellales (614) and Inocybe curvipes (597). Demultiplexed sequence data, the ESV table, and the taxonomy table have been submitted to NCBI (BioProject: PRJNA639837).

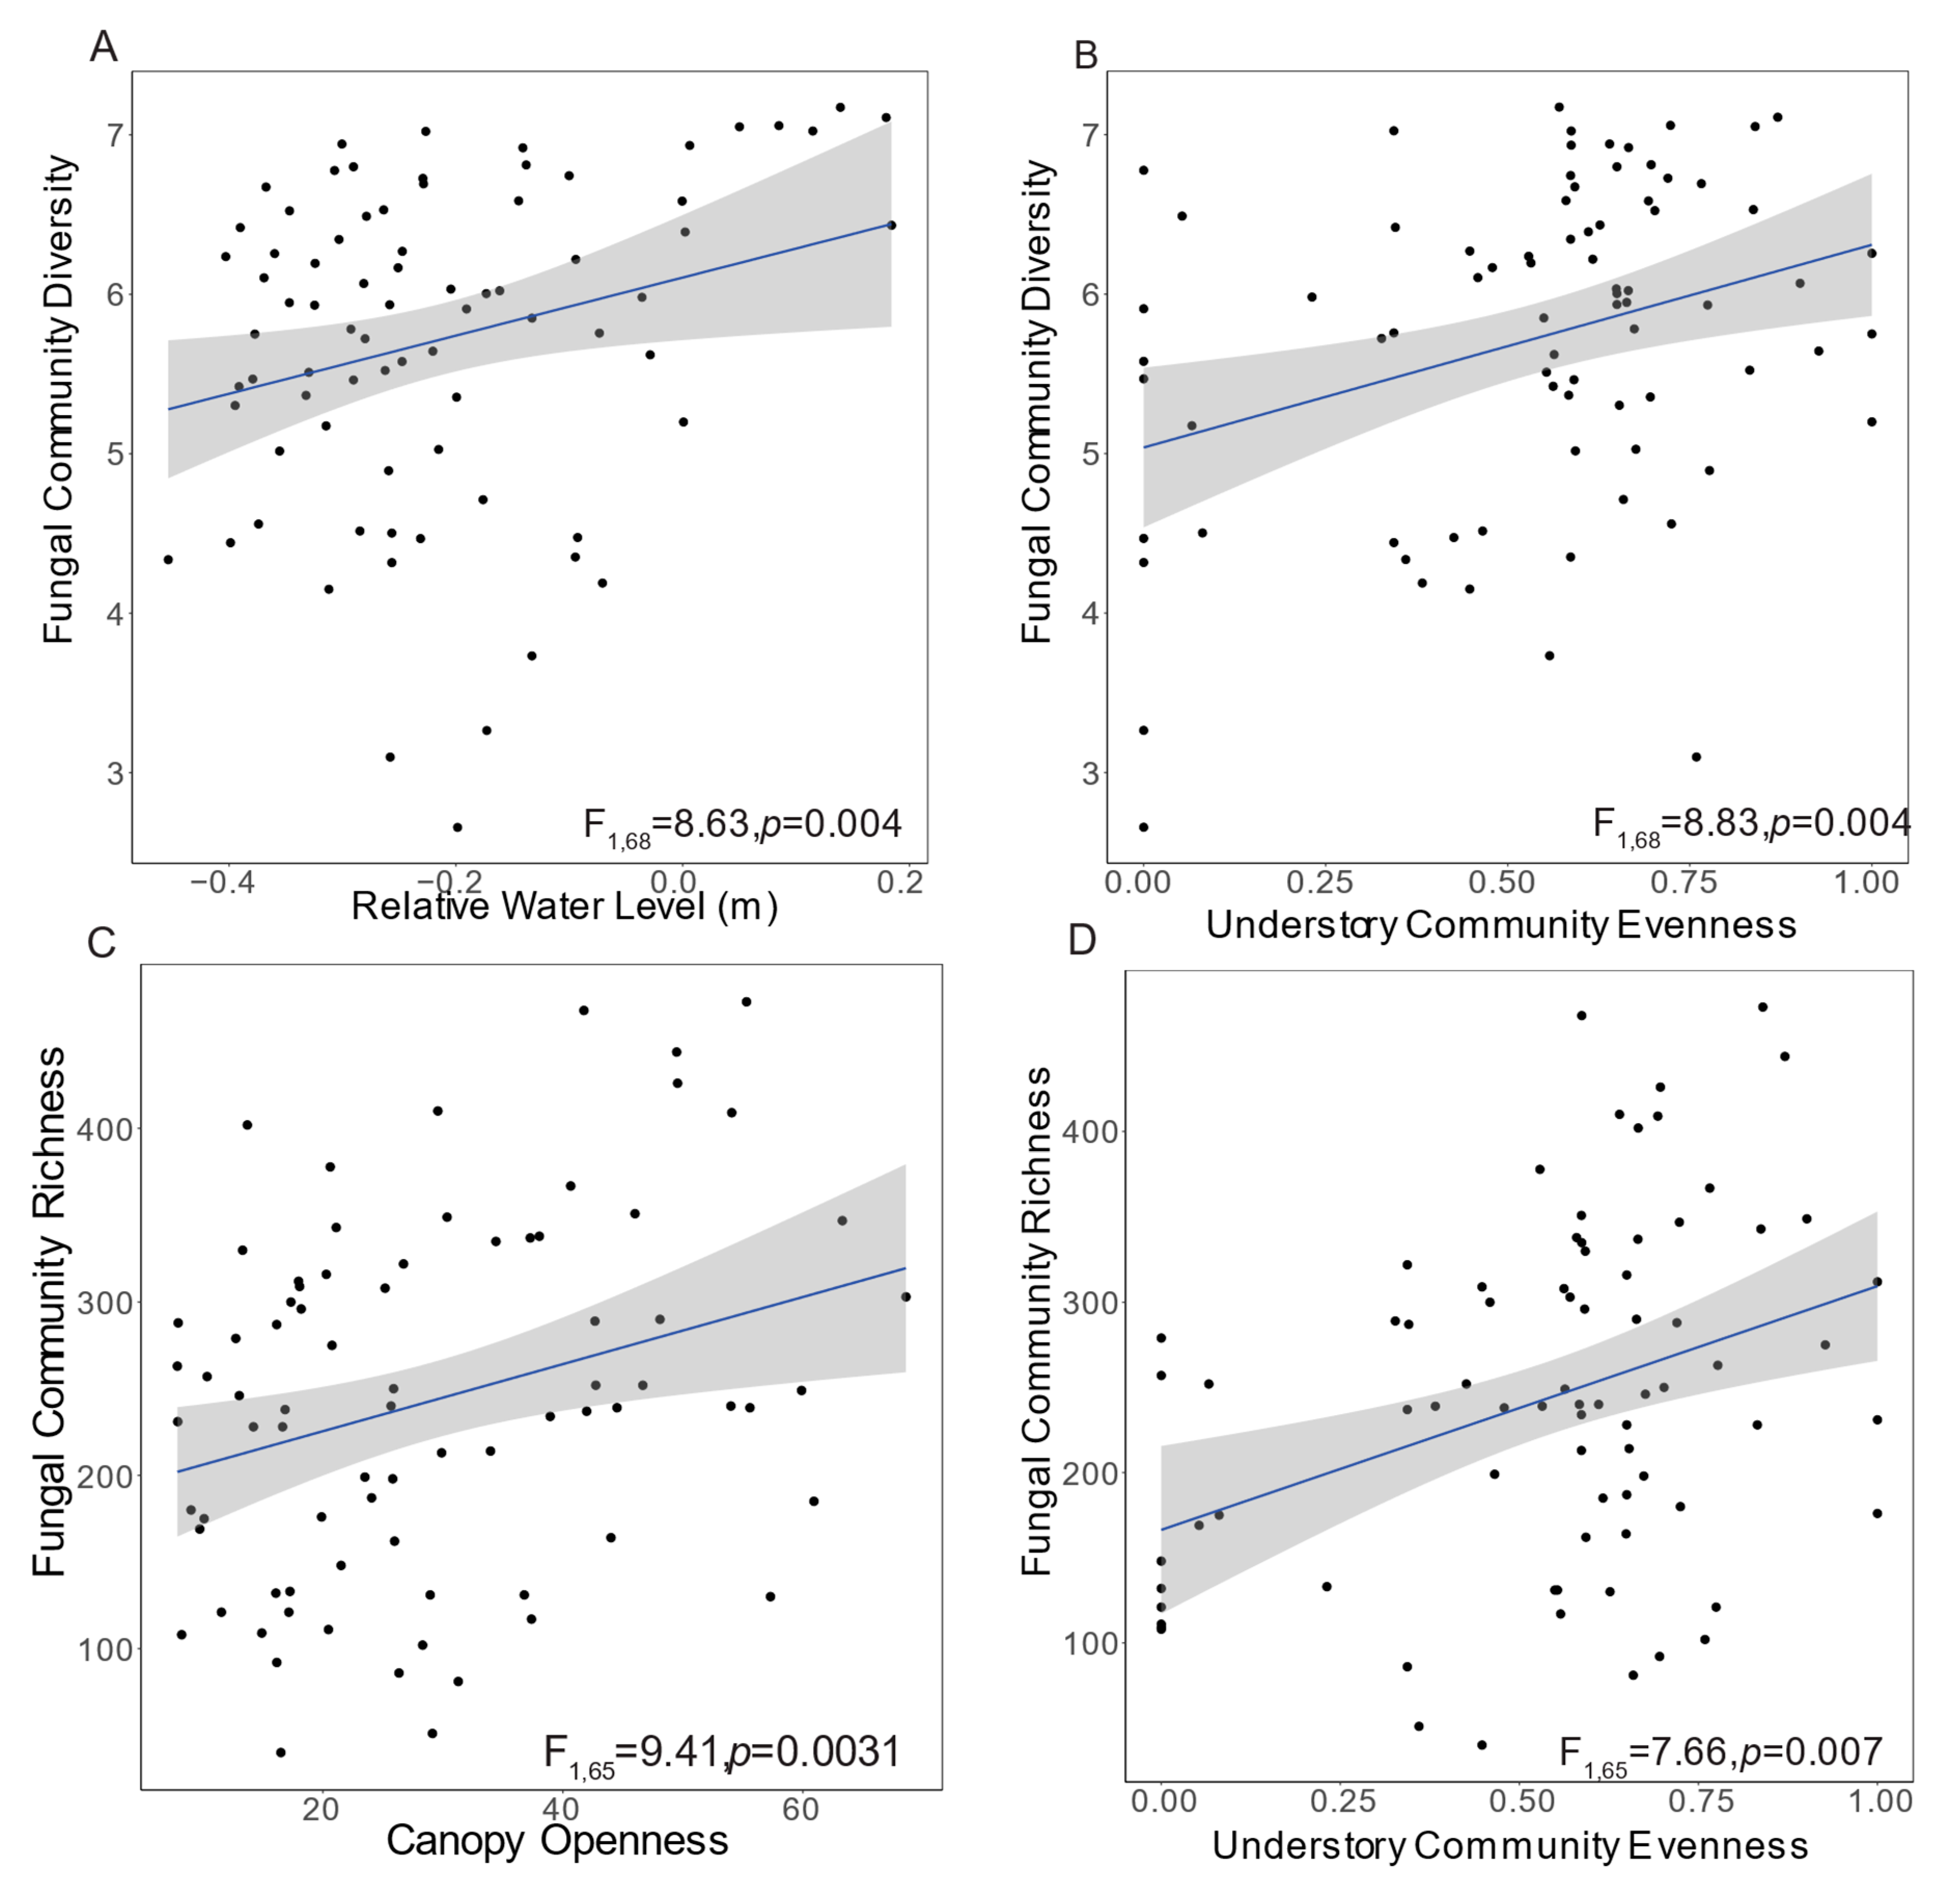
3.2. Fungal Community Diversity and Richness

The relative water level and evenness of the understory plant community were identified by model selection as key environmental characteristics explaining variation in fungal diversity (Table 1). Relative water level and understory plant community evenness as well as canopy openness, understory plant richness, core type, and tree density were also included in the best model for fungal richness (Table 1). Further investigation of the significant explanatory variables in the best fit models revealed a positive relationship with several environmental factors for both diversity and richness. For example, fungal diversity increased with increasing relative water level (F1,68 = 8.63, p = 0.004; Figure 1A) and with increasing understory plant community evenness (F1,68 = 8.83, p = 0.004; Figure 1B), suggesting the maintenance of higher water levels and even plant understories on tree islands could improve fungal diversity and therefore the variety of ecosystem services they provide (as supported by the functional guild analysis below). Fungal community richness also increased with increasing canopy openness (F1,65= 9.41, p = 0.003; Figure 1C) as well as with increasing understory evenness (F1,65 = 7.66, p = 0.007; Figure 1D).

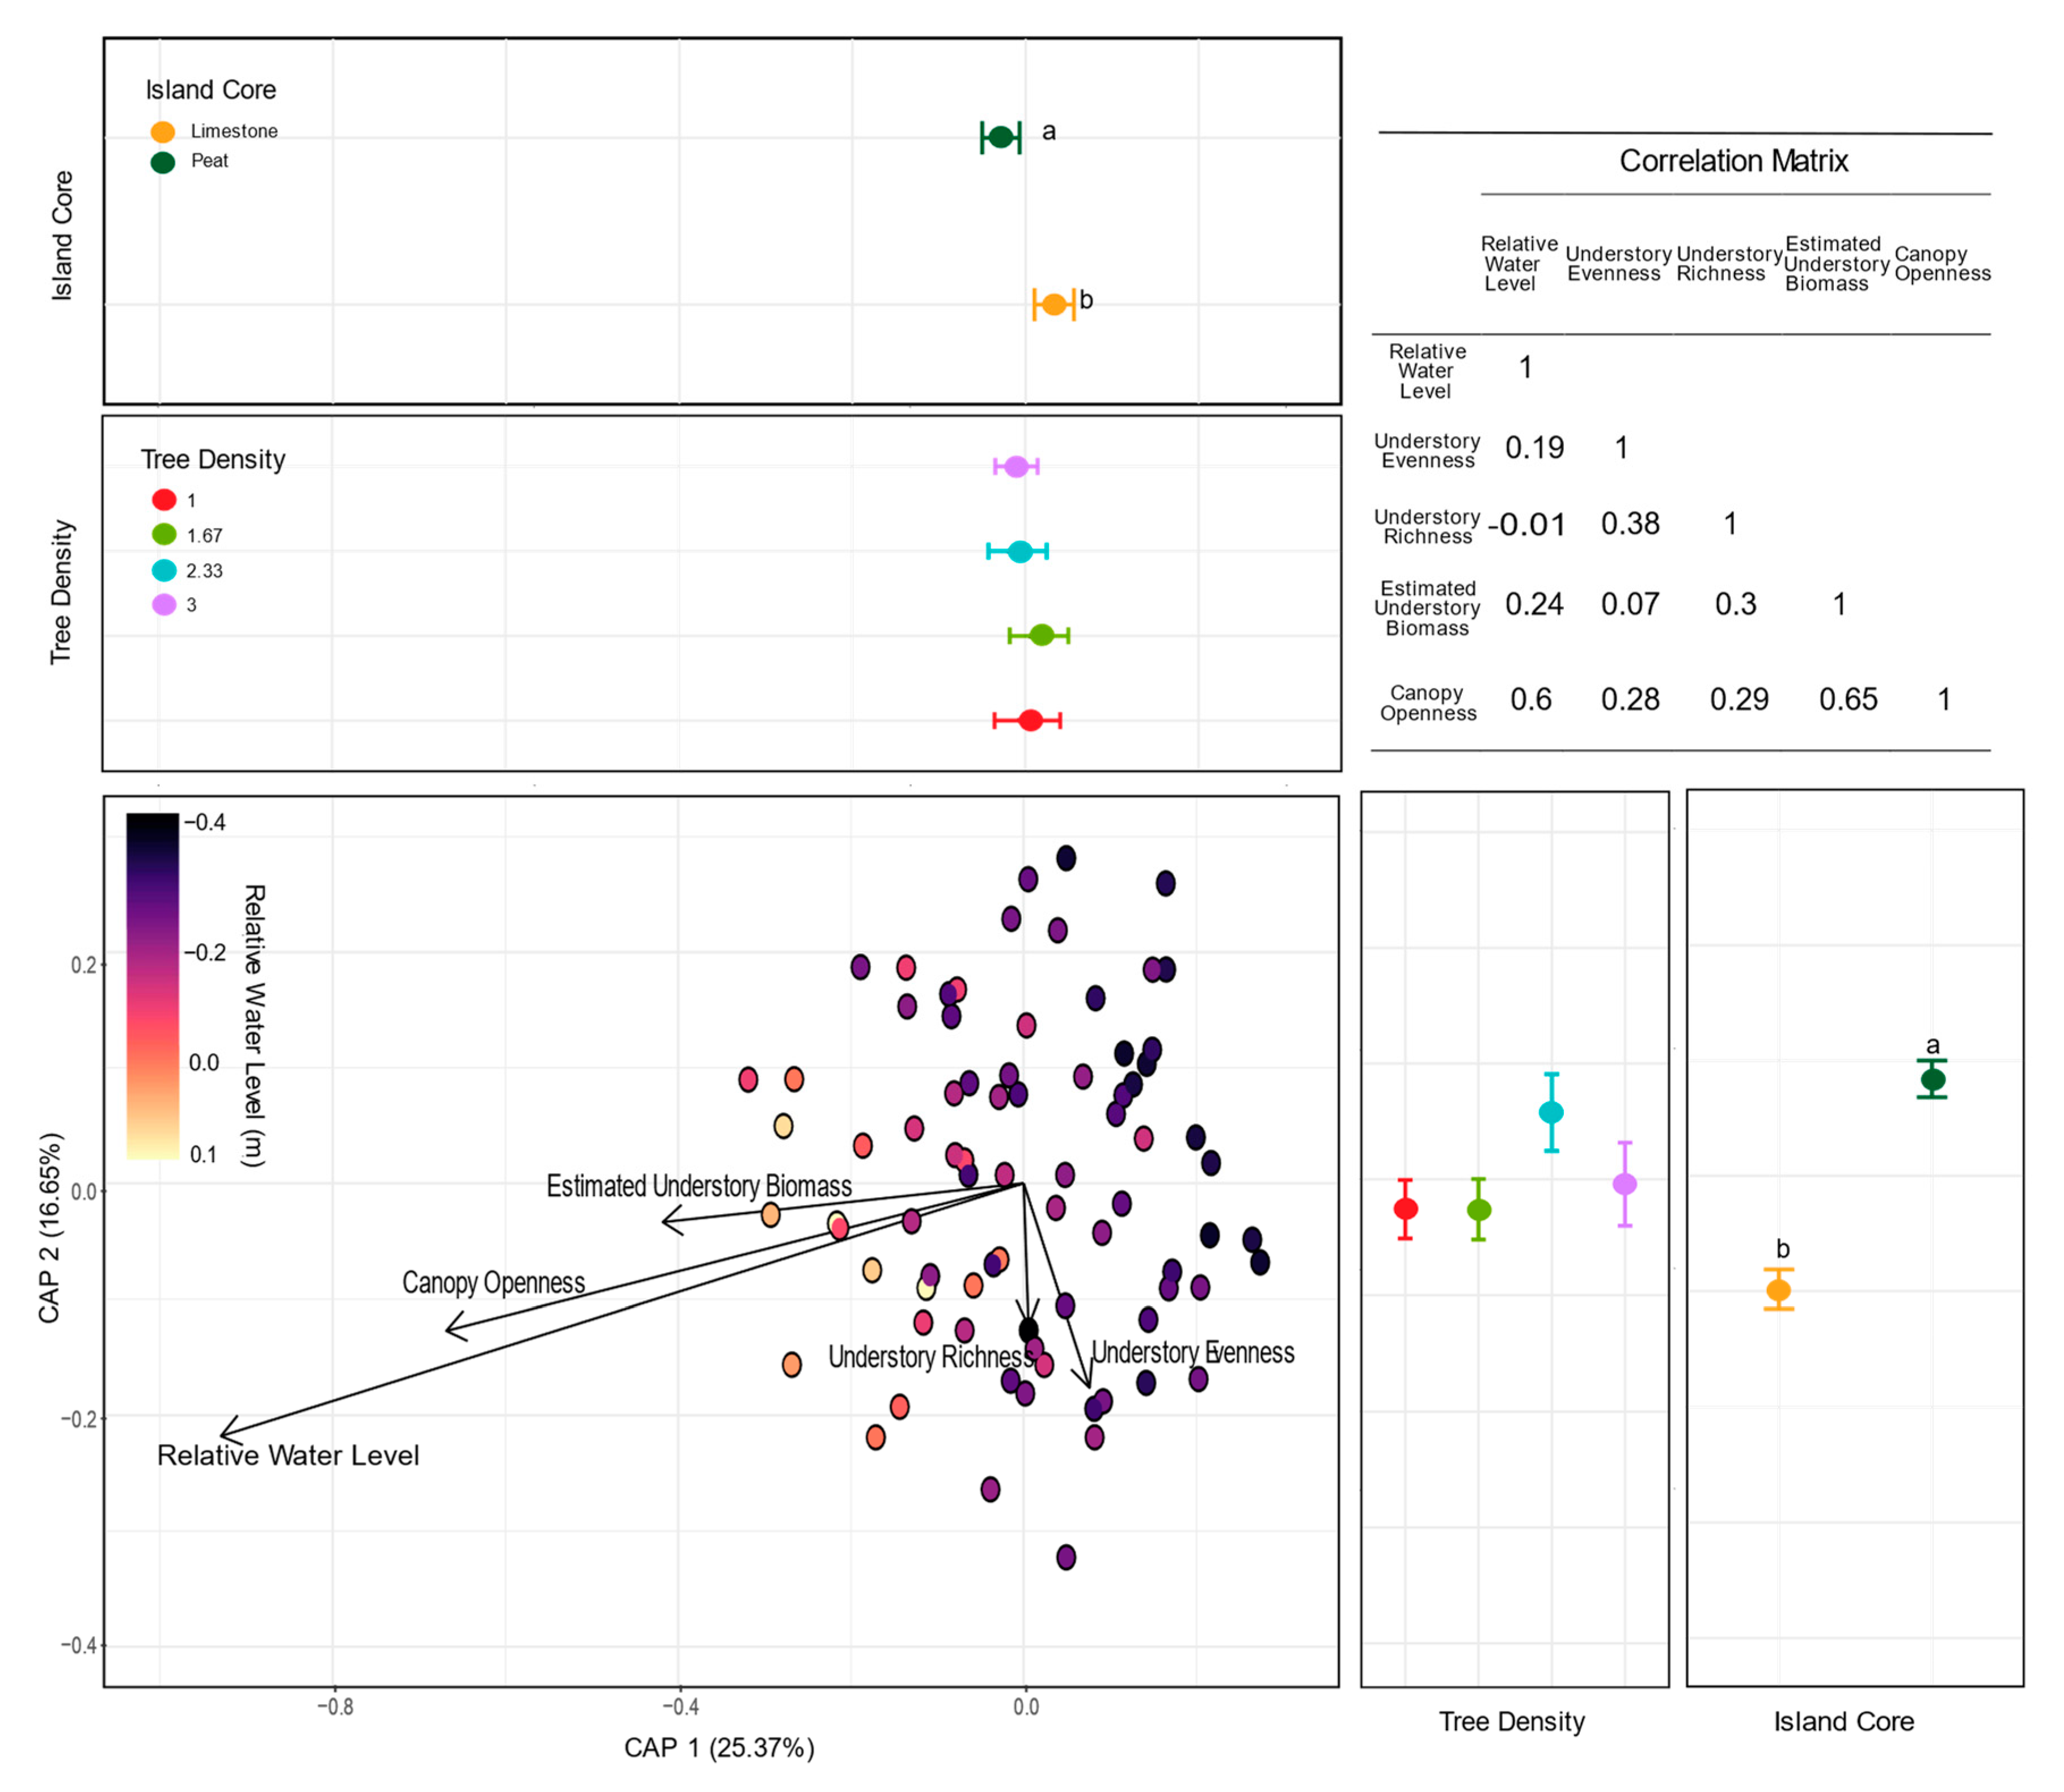
3.3. Fungal Community Composition

In addition to its importance in fungal diversity, relative water level also explained a significant amount of variation in fungal community composition (db-RDA, F1,68 = 2.95, p = 0.001; Figure 2). The core type, one of the manipulative restoration treatments implemented during the construction of the experimental tree islands, affected fungal community composition as well (F1,68 = 1.87, p = 0.002). We found that limestone cores resulted in a significantly different community composition than peat cores on both of the first two axes of fungal community composition (CAPs 1 and 2; Figure 2), with a 218% higher value on CAP 1 (F1,76 = 3.83, p = 0.054) and a 185% smaller value on CAP2 (F1,76 = 61.55, p = 2.17 × 10⁻¹¹) for limestone compared to peat core islands. To gain insight into the difference between the communities in peat and limestone core islands, we performed an indicator taxa analysis. After correcting for multiple comparisons, we determined that Thelephoraceae, Eurotiomycetes, and Inocybe curvipes were indicative of peat communities, while Agaricomycetes and Archaeorhizomyces were indicative of limestone communities (Table S1). We also found that there was a significant relationship between the inter-site variations in the fungal and understory plant community composition (Mantel test: R = 0.11, p = 0.003).

3.4. Distribution of Fungal Functional Guilds

In total, we found 15 fungal functional guilds in our dataset with each of the eight islands hosting an average of approximately 5 guilds (±0.22) (Figure S3A). The most common functional guilds were ectomycorrhizal fungi, dung-wood saprotroph, and plant pathogen-wood saprotroph, which occurred in 63%, 77%, and 67% of the sites (respectively) and on all islands (Figure S3A). When examining factors that influence guild richness, we found that the number of functional guilds among fungi increased in sites that had a more even understory plant community (F1,63 = 10.12, p = 0.0023; Figure 3A) with an approximately 70% increase in guilds in the most even compared to the least even five sites. Core type and relative water level were also included in the best model for the number of functional guilds (core type: F1,63 = 2.92, p = 0.1378; relative water level: F1,63 = 0.87, p = 0.3521), with an 18% greater number of guilds in peat compared to limestone core islands and an approximately 8% decrease in the driest compared to wettest sites. When we examined the factors that influence abundances of the three most common guilds from our dataset, the abundance of only one—plant pathogen-wood saprotroph—could be explained by any of our measured variables. As the relative water level decreased, the abundance of the plant pathogen–wood saprotroph guild increased (F1,68 = 5.47, p = 0.022; Figure 3B).

4. Discussion

To better incorporate fungal communities into restoration planning in terms of both protecting their diversity and utilizing these hidden players to improve restoration success, a more complete understanding of which environmental factors and management decisions affect soil fungal communities is required. Our study contributes to this goal by showing that (1) fungal diversity and composition were affected by restoration decision factors that were manipulated on experimental tree islands during their construction, and (2) variation in several important aspects of fungal communities was explained by microhabitat differences in other environmental variables of interest for management, including hydrology and properties of the naturally recruiting plant understory community. Below, we address these results in more detail by first examining possible mechanisms through which abiotic factors, and then biotic factors, can contribute to fungal community composition and diversity. We conclude by briefly discussing directions for future research and the implications for the Everglades.

4.1. Abiotic Factors: The Role of Hydrology, Island Core Type, and Light Environment in Fungal Diversity and Composition

Abiotic stressors play important roles in limiting organismal niches [54], and thus abiotic contexts often contribute substantially to the diversity and composition of communities in nature [55]. Previous work in the Everglades has identified abiotic features that affect communities of macro-organisms on tree islands [56,57]. For instance, the tree island plant community structure is largely driven by water level, nutrient availability, and disturbance (e.g., fire, windstorms, and drought) [30]. Our study found that the fungal community composition and/or diversity on tree islands also appear to respond strongly to all three of the abiotic factors investigated—relative water level, light environment, and core type. In particular, hydrology was important for the composition and diversity of the soil fungal community, with greater fungal diversity at sites with higher water levels. We saw a 34% increase in fungal diversity when comparing the five wettest sites to the five driest sites. This shift in fungal diversity and composition is likely due to the sensitivity of some species of fungi to dry conditions [58,59] or the increased dispersal of spores to wetter sites [38,60]. Hydrology is one of the most anthropogenically altered aspects of the Everglades, with much of the historic sheet flow from central to southern Florida now diverted through approximately 1800 miles of levees and canals [61]. This change has generally led to a change of inundation periods for tree islands [62]. Given the substantial decrease in fungal diversity we found at dry sites in our study, it is likely that these major alterations to tree island inundation are also having extensive consequences for the fungal communities affected by water diversions. As a result of the importance of fungi in ecosystem functions [1], a loss of fungal diversity on unnaturally dry tree islands may underpin mechanisms causing tree island loss (e.g., reduced availability of the beneficial symbionts on which trees depend, or a loss of high-quality decomposers required for nutrient recycling). These shifts in diversity and composition also suggest the importance of hydrologic restoration targets that consider fungal ecology, and tree island restoration and creation success may be assisted by a more careful consideration of these important constituents of soil biota.
In addition, our investigation of abiotic factors demonstrated that early restoration decisions can have abiding effects on fungal communities years later. In 2003, the experimental islands at LILA were constructed with two core types—peat and limestone—to represent the natural variation in Everglades tree islands. We found that differences in the choice of core type affected the overall fungal community composition, including a significant difference between limestone core and peat core communities along both axes of variation in community composition. Further research into the indicator taxa identified for limestone versus peat core islands revealed functional differences among these taxa. Indicator taxa of peat communities included ectomycorrhizal fungi [63,64], while those in limestone communities included taxa described as putative wood-decayers and saprotrophs [65,66,67]. The distinctions in fungal communities on the two core types are presumably the result of the different soil environments they provide [68]. For instance, previous studies of the tree islands at LILA have suggested increased water retention on peat islands compared to limestone [69,70]. The presence of limestone may also change the mineral content of soils through inputs of calcium carbonate, which has been associated with significant shifts in soil microbial communities in other systems [71]. In addition, the difference in some of these indicator taxa could also be the result of the presence of the tree Morella cerifera, which is the only surveyed species on the islands that has been reported to associate with ectomycorrhizal fungi (in addition to its association with arbuscular mycorrhizal fungi) [72]. Morella cerifera had a somewhat lower survival rate on peat core islands, indicating they are more stressed on these islands, which may result in an increased reliance on ectomycorrhizal fungi to ameliorate stress [42]. Therefore, we examined whether the presence of M. cerifera was predictive of the estimated abundance (total number of reads) of the ectomycorrhizal indicator taxa. While we did not find support for a clear relationship between M. cerifera presence and these ectomycorrhizal fungi (p > 0.05 in a distribution-free randomization test with the presence of M. cerifera and island identity in the model), additional studies that investigate unmeasured aspects of M. cerifera biology, such as tree size, and the root colonization of this tree may help elucidate if and how it influences ectomycorrhizal abundance. More generally, the effect of core type in our study indicates that initial decisions in tree island construction have cascading effects on the fungal community, even 15 years later.
We also found that as light availability increased (as indicated by canopy openness), fungal richness also increased. While light environments can have consequences for the soil microbiome through effects on soil temperature and moisture [73], light may act indirectly through its effects on the understory plant community [74]. Further investigation of this possibility using an RDA (Redundancy Analysis) with plant understory community composition data as the response and the same explanatory abiotic and biotic factors used in the fungal analyses showed that canopy openness did not explain variation in understory composition (F1,68 = 1.24, p = 0.251). While not conclusive, this result suggests that the light environment’s effects on the soil microbiome is unlikely to be driven by changes in the plant understory composition.

4.2. Biotic Factors: The Role of Understory Plant Communities and Tree Density in Fungal Community Diversity and Composition

Our study showed that biotic factors may also have consequences for the Everglades tree islands soil fungi. We found that the characteristics of the understory plant community explained variation in fungal community diversity, richness, and composition. For instance, as understory plant community evenness increased, so did both fungal diversity and richness. This relationship may stem from differences among plant species in their priming of soil microbial communities [75] and/or their contributions to the leaf litter [76]. Plants can actively manipulate the soil microbial community through the release of root exudates [77] and allelochemicals [78], and this priming can be species-specific. Similarly, plants can have species-specific differences in their leaf litter, and the composition of leaf litter can influence fungal communities [79]. Soil priming and litter deposition by a more even understory plant community may promote a more even distribution of soil microhabitats for fungal taxa to use, thereby fostering the greater fungal diversity we found. We also demonstrated that differences in plant community composition among sites are significantly related to differences in fungal community composition. Unlike the effects of manipulated variables such as core type and tree density, we cannot determine the direction of interaction (i.e., plant understory community composition is driving fungal community composition, the reverse, or both are responding to an external pressure). However, it is well known that fungal and plant communities are interlinked [80]. Understory plant communities may change fungal communities through their root exudates [77], leaf litter [81,82], or by acting as hosts for pathogenic or mutualistic fungi [83]. Furthermore, a thriving understory community may provide shade, thus changing the microhabitat conditions of soil moisture. On the other hand, fungal composition may alter plant composition through nutrient availability [84], decomposition [85], water availability [9], pathogen load [86], or mutualistic interactions [87]. Most likely, both the fungal and plant communities are affecting one another via plant-soil feedbacks [88] and are also mutually responding to major abiotic factors such as hydrology. Future work that manipulates these components (i.e., abiotic factors, microbial and plant community characteristics) using factorial mesocosm experiments is needed to fully determine the strength and direction in which these communities are affecting one another, and how much outside habitat characteristics contribute to this relationship. In addition, the initial tree planting density was identified by model selection as part of the best model for fungal community richness. While its effect was not significant within the best model (nor was tree density as commonly implicated as the understory plant community in our analyses), tree density’s inclusion in the best model hints at a role for this experimentally manipulated factor in influencing fungal communities. Future studies investigating the effects of tree composition on fungal communities could provide additional insights into consequences for fungi that investigating tree density alone may miss.

4.3. Fungal Functional Guilds on Tree Islands

In addition to characterizing fungal diversity and composition, our study provided initial insight into fungal contributions to ecosystem services by characterizing the distribution of fungal functional guilds on tree islands. While not all fungal taxa could be characterized into functional groups by FUNGuild and functions sometimes differ between ecosystems [89], this approach represents a first step in understanding how different restoration decisions and environmental variation may impact fungal roles within Everglades tree islands. For example, we found that the number of guilds was significantly greater in sites with a more even plant understory community, which is in line with the greater fungal taxa diversity at these sites. The arbuscular mycorrhizal fungal guild (fungal mutualists that associate with plant roots and trade water/nutrients acquired through hyphal networks for photosynthetic carbon) was present at all five of the sites with the highest plant understory evenness, while the five sites with the lowest plant evenness shared the ‘tri-guild’ of dung saprotroph-wood saprotroph-undefined saprotroph in common. More broadly, we found that some guilds were often missing from the sites with the low functional richness. In particular, we noted that 5 of the 9 saprotroph guilds (i.e., dung, leaf, soil, wood, undefined, and undefined-wood saprotroph guilds) were present in none of the 15 most guild-poor sites. While two of these guilds—leaf and undefined-wood saprotroph—were also commonly absent in guild-rich sites, this general loss of saprotroph guilds in guild-poor sites suggests that functional losses may first affect decomposition services.
When we examined the top three most common individual guilds of fungi, only pathogen–wood saprotrophs were affected by any abiotic or biotic factors. Specifically, as the relative water level increased, pathogen-wood saprotrophs’ relative abundance decreased, which indicates that changes in water management may have cascading effects on pathogen-wood saprotroph abundance. In addition to the possible direct effects of water on pathogens, increases in tree stress caused by low water levels may make trees more susceptible to pathogens, increasing the abundance of this guild. While some tree island plants prefer lower water levels, flood-tolerant trees are often more stressed when water levels drop (stress indicated by leaf loss; Sah, unpublished observation), which could increase the pathogen load in drier sites. The relationship between water level and pathogen abundance detected in this study is important to consider when managing tree islands, as lower water levels could possibly result in more fungal pathogens and lower overall fungal diversity. Due to the possible dual function of the species in this guild, future studies are needed to determine if plant pathogen-wood saprotrophs taxa are acting more as pathogens or decomposers across tree islands. This additional information on fungal function could help inform management decisions, since plant pathogens could be detrimental to tree island stability, while wood saprotrophs may be important for soil formation [36,90]. Alternatively, members of this dual-function guild may be plant pathogens that decompose the woody vegetation of their host once it declines and/or dies. A more nuanced understanding of the function and life histories of taxa within this guild may be especially important, as manipulations of Everglades hydrology as well as increases in hydroperiod have led to the loss of soil on tree islands [41,91].
While these results provide a crucial first look at the consequences of management decisions and environmental variation for the fungal community function, substantial gaps still remain to be filled. For example, we found that many taxa were not identifiable at the species level, making it difficult to use the FUNGuild database to characterize the functions of these diverse taxa (likely including taxa unique to the imperiled Everglades). Further, using amplicon sequencing alone makes it difficult to gain a full perspective into community function [92]. We suggest that future work investigate function through complementary approaches, such as functional assays, metatranscriptomics, and the direct assessment of fungal structures. For example, growth under different resource conditions and functional gene assays could inform our understanding of the primary mode of nutrition and assess some functional effects (e.g., [93,94]). Metatranscriptomic studies could further help elucidate functional responses by determining which functional genes have expression that is actively being up- and down-regulated within communities experiencing different management decisions [95]. In addition, studies of fungal structures would provide more insight into fungal diversity and how environmental variables influence the distribution of life history stages (i.e., hyphae, spores, fruiting bodies) of taxa.

5. Conclusions and Future Work

This study demonstrates that soil fungal communities on Everglades tree islands can be driven by abiotic and biotic factors, some of which are determined by management decisions. Our results indicate that early restoration decisions can have long-term consequences for fungal communities and suggest that a drier future in the Everglades could reduce fungal diversity on imperiled tree islands. In addition to hydrology and tree establishment, future restoration projects may want to consider the understory plant community, as our study shows a relationship between the understory community and fungal diversity and function. In our opinion, there are at least two general types of studies that are likely to be profitable going forward. First, additional manipulative experiments at macrocosm and mesocosm levels are required to tease out specific fungal functions and directly test the causality of important management decisions and environmental variables not manipulated here (e.g., understory composition). Second, field studies characterizing fungal communities on natural healthy tree islands and ghost islands would determine if fungal diversity on constructed islands closely reflects natural communities and help identify pathogens or other taxa involved in reduced ecosystem function. Collectively, the results of the work presented here and those of the suggested studies will help inform management that increases the benefit of fungal communities for the restoration and conservation of fungal diversity in this threatened ecosystem.

Supplementary Materials

The following are available online at https://www.mdpi.com/1424-2818/12/9/324/s1: Figure S1: The layout of LILA includes eight tree islands, half of which were constructed with peat cores and half of which were constructed with limestone cores. Limestone core islands are indicated with hashed lines. Each island was divided into four quadrants in 2006 and randomly assigned to one of four tree planting density treatments. Initial tree planting density is indicated by the color of quadrants on each island; red: 1 m, green:1.67 m, blue:2.33 m, purple: 3 m spacing (i.e., distance between trees), Figure S2: An example map of one tree island within LILA. Each colored point represents one of 8 different tree species, initially planted in four density treatments. Each white plus indicates locations where soil samples were collected. The following tree species were planted in 2006 and are included in the tree species legend above: AG = Annona glabra; AR = Acer rubrum; BS = Bursera simaruba; CI = Chrysobolanus icaco; FA = Ficus aurea; IC = Ilex cassine; MC = Morella cerifera; PP = Persea palustris. In 2007, Eugenia axillaris and Myrsine floridana were added to replace trees that did not survive initial plantings, Figure S3: Distribution of fungal functional guilds (A) and trophic modes (B) across the eight experimental tree islands. (A) Each color represents the relative abundance of one of the 15 guilds to which FUNGuild assigned fungal taxa. (B) Each color represents the relative abundance of one of the four trophic modes that fungal taxa were assigned by FUNGuild. In both graphs, each vertical bar represents an individual site, and sites are grouped based on tree island (represented by numbers 1–8, island numbers 1, 4, 6, and 7 were limestone core islands and 2, 3, 5 and 8 were peat core islands), Table S1: Indicator taxa for limestone (L) and peat (P) core island communities identified by the indicator taxa analysis. A is the probability that a site belongs to a core type, given the taxa has been found at that site. B is the probability of finding that taxa in sites with that core type. The indicator values are between 0 and 1 with greater indicator values demonstrating greater specificity of a taxa to that core type.

Author Contributions

Conceptualization, B.K.A. and M.E.A. with advice from E.C., F.S., M.S.R., and S.L.S.; methodology, all authors; experimental facility management, E.C. and F.S. formal analysis, B.K.A.; investigation, B.K.A. and M.E.A.; data curation, B.K.A., M.S.R., J.P.S., and S.L.S.; writing—original draft preparation, B.K.A. and M.E.A.; writing—review and editing, all authors; visualization, B.K.A.; supervision, M.E.A.; funding acquisition, M.E.A. All authors have read and agreed to the published version of the manuscript.

Funding

This study has been supported primarily by funding from the South Florida Water Management District to M.E.A. with additional support from NSF DEB-1922521 to M.E.A. and the NSF Graduate Research Fellowship Program to B.K.A.

Acknowledgments

We thank D. Hernandez, K. Kiesewetter, D. Revillini, C. Searcy, C. Mothes, H. Howell, and S. Clements for feedback on this manuscript and J. Richards, J. Orias, K. Maravillas and K. Nguyen for assistance with field sample and data collections. We also acknowledge the South Florida Water Management District for access to DBHydro.

Conflicts of Interest

The authors declare no conflict of interest.

References

  1. Treseder, K.K.; Lennon, J.T. Fungal traits that drive ecosystem dynamics on land. Microbiol. Mol. Biol. Rev. 2015, 79, 243–262. [Google Scholar] [CrossRef] [PubMed] [Green Version]
  2. Dighton, J. Fungi in Ecosystem Processes; CRC Press: Boca Raton, FL, USA, 2016. [Google Scholar]
  3. Waring, B.G.; Averill, C.; Hawkes, C.V. Differences in fungal and bacterial physiology alter soil carbon and nitrogen cycling: Insights from meta-analysis and theoretical models. Ecol. Lett. 2013, 16, 887–894. [Google Scholar] [CrossRef] [PubMed]
  4. Joergensen, R.G.; Emmerling, C. Methods for evaluating human impact on soil microorganisms based on their activity, biomass, and diversity in agricultural soils. J. Plant Nutr. Soil Sci. 2006, 169, 295–309. [Google Scholar] [CrossRef]
  5. Gougoulias, C.; Clark, J.M.; Shaw, L.J. The role of soil microbes in the global carbon cycle: Tracking the below-ground microbial processing of plant-derived carbon for manipulating carbon dynamics in agricultural systems. J. Sci. Food Agric. 2014, 94, 2362–2371. [Google Scholar] [CrossRef] [PubMed]
  6. Heilmann-Clausen, J.; Barron, E.S.; Boddy, L.; Dahlberg, A.; Griffith, G.W.; Nordén, J.; Ovaskainen, O.; Perini, C.; Senn-Irlet, B.; Halme, P. A fungal perspective on conservation biology. Conserv. Biol. 2015, 29, 61–68. [Google Scholar] [CrossRef] [Green Version]
  7. Ritz, K.; Young, I.M. Interactions between soil structure and fungi. Mycologist 2004, 18, 52–59. [Google Scholar] [CrossRef] [Green Version]
  8. Begum, N.; Qin, C.; Ahanger, M.A.; Raza, S.; Khan, M.I.; Ashraf, M.; Ahmed, N.; Zhang, L. Role of Arbuscular Mycorrhizal Fungi in Plant Growth Regulation: Implications in Abiotic Stress Tolerance. Front. Plant Sci. 2019, 10, 1068. [Google Scholar] [CrossRef] [Green Version]
  9. Latef, A.A.H.A.; Hashem, A.; Rasool, S.; Abd_Allah, E.F.; Alqarawi, A.A.; Egamberdieva, D.; Jan, S.; Anjum, N.A.; Ahmad, P. Arbuscular mycorrhizal symbiosis and abiotic stress in plants: A review. J. Plant Biol. 2016, 59, 407–426. [Google Scholar] [CrossRef]
  10. Ferrol, N.; Azcón-Aguilar, C.; Pérez-Tienda, J. Review: Arbuscular mycorrhizas as key players in sustainable plant phosphorus acquisition: An overview on the mechanisms involved. Plant Sci. 2019, 280, 441–447. [Google Scholar] [CrossRef] [Green Version]
  11. Frąc, M.; Hannula, S.E.; Bełka, M.; Jędryczka, M. Fungal Biodiversity and Their Role in Soil Health. Front. Microbiol. 2018, 9, 707. [Google Scholar] [CrossRef] [Green Version]
  12. Powell, J.R.; Rillig, M.C. Biodiversity of arbuscular mycorrhizal fungi and ecosystem function. New Phytol. 2018, 220, 1059–1075. [Google Scholar] [CrossRef] [PubMed] [Green Version]
  13. Avis, P.G.; Gaswick, W.C.; Tonkovich, G.S.; Leacock, P.R. Monitoring fungi in ecological restorations of coastal Indiana, U.S.A. Restor. Ecol. 2017, 25, 92–100. [Google Scholar] [CrossRef]
  14. Barea, J.M.; Palenzuela, J.; Cornejo, P.; Sánchez-Castro, I.; Navarro-Fernández, C.; Lopéz-García, A.; Estrada, B.; Azcón, R.; Ferrol, N.; Azcón-Aguilar, C. Ecological and functional roles of mycorrhizas in semi-arid ecosystems of Southeast Spain. J. Arid Environ. 2011, 75, 1292–1301. [Google Scholar] [CrossRef]
  15. Asmelash, F.; Bekele, T.; Birhane, E. The Potential Role of Arbuscular Mycorrhizal Fungi in the Restoration of Degraded Lands. Front. Microbiol. 2016, 7, 1095. [Google Scholar] [CrossRef] [Green Version]
  16. Van der Heijden, M.G.A.; Streitwolf-Engel, R.; Riedl, R.; Siegrist, S.; Neudecker, A.; Ineichen, K.; Boller, T.; Wiemken, A.; Sanders, I.R. The mycorrhizal contribution to plant productivity, plant nutrition and soil structure in experimental grassland. New Phytol. 2006, 172, 739–752. [Google Scholar] [CrossRef]
  17. Van der Heijden, M.G.A.; Klironomos, J.N.; Ursic, M.; Moutoglis, P.; Streitwolf-Engel, R.; Boller, T.; Wiemken, A.; Sanders, I.R. Mycorrhizal fungal diversity determines plant biodiversity, ecosystem variability and productivity. Nature 1998, 396, 69–72. [Google Scholar] [CrossRef]
  18. Delgado-Baquerizo, M.; Maestre, F.T.; Reich, P.B.; Jeffries, T.C.; Gaitan, J.J.; Encinar, D.; Berdugo, M.; Campbell, C.D.; Singh, B.K. Microbial diversity drives multifunctionality in terrestrial ecosystems. Nat. Commun. 2016, 7, 10541. [Google Scholar] [CrossRef] [PubMed] [Green Version]
  19. Maltz, M.R.; Treseder, K.K. Sources of inocula influence mycorrhizal colonization of plants in restoration projects: A meta-analysis. Restor. Ecol. 2015, 23, 625–634. [Google Scholar] [CrossRef]
  20. Wubs, E.R.J.; van der Putten, W.H.; Bosch, M.; Bezemer, T.M. Soil inoculation steers restoration of terrestrial ecosystems. Nat Plants 2016, 2, 16107. [Google Scholar] [CrossRef] [PubMed] [Green Version]
  21. Emam, T. Local soil, but not commercial AMF inoculum, increases native and non-native grass growth at a mine restoration site. Restor. Ecol. 2016, 24, 35–44. [Google Scholar] [CrossRef]
  22. Rowe, H.I.; Brown, C.S.; Claassen, V.P. Comparisons of Mycorrhizal Responsiveness with Field Soil and Commercial Inoculum for Six Native Montane Species and Bromus tectorum. Restor. Ecol. 2007, 15, 44–52. [Google Scholar] [CrossRef]
  23. Brown, M.T.; Cohen, M.J.; Bardi, E.; Ingwersen, W.W. Species diversity in the Florida Everglades, USA: A systems approach to calculating biodiversity. Aquat. Sci. 2006, 68, 254–277. [Google Scholar] [CrossRef]
  24. Sklar, F.H.; Chimney, M.J.; Newman, S.; McCormick, P.; Gawlik, D.; Miao, S.; McVoy, C.; Said, W.; Newman, J.; Coronado, C.; et al. The ecological–societal underpinnings of Everglades restoration. Front. Ecol. Environ. 2005, 3, 161–169. [Google Scholar]
  25. Dorcas, M.E.; Willson, J.D.; Reed, R.N.; Snow, R.W.; Rochford, M.R.; Miller, M.A.; Meshaka, W.E., Jr.; Andreadis, P.T.; Mazzotti, F.J.; Romagosa, C.M.; et al. Severe mammal declines coincide with proliferation of invasive Burmese pythons in Everglades National Park. Proc. Natl. Acad. Sci. USA 2012, 109, 2418–2422. [Google Scholar] [CrossRef] [PubMed] [Green Version]
  26. Van der Valk, A.; Volin, J.; Labisky, R. Ecological effects of extreme hydrological events on the Greater Everglades. In Independent Scientific Review Panel Report to RECOVER; Bepress: Berkeley, CA, USA, 2012. [Google Scholar]
  27. Frohring, P.C.; Voorhees, D.P.; Kushlan, J.A. History of Wading Bird Populations in the Florida Everglades: A Lesson in the Use of Historical Information. Colon. Waterbirds 1988, 11, 328. [Google Scholar] [CrossRef]
  28. Wetzel, P.R.; van der Valk, A.G.; Newman, S.; Gawlik, D.E.; Gann, T.T.; Coronado-Molina, C.A.; Childers, D.L.; Sklar, F.H. Maintaining tree islands in the Florida Everglades: Nutrient redistribution is the key. Front. Ecol. Environ. 2005, 3, 370–376. [Google Scholar] [CrossRef]
  29. Meshaka, W.E.; Snow, R.; Bass, O.L.; Robertson, W.B. Occurrence of Wildlife on Tree Islands in the Southern Everglades. In Tree Islands of the Everglades; Springer: Berlin/Heidelberg, Germany, 2002; pp. 391–427. [Google Scholar]
  30. Wetzel, P.R.; Sah, J.P.; Ross, M.S. Tree islands: The bellwether of Everglades ecosystem function and restoration success. Restor. Ecol. 2017, 25, S71–S85. [Google Scholar] [CrossRef]
  31. Wetzel, P.R.; van der Valk, A.G.; Newman, S.; Coronado, C.A.; Troxler-Gann, T.G.; Childers, D.L.; Orem, W.H.; Sklar, F.H. Heterogeneity of phosphorus distribution in a patterned landscape, the Florida Everglades. Plant Ecol. 2009, 200, 83–90. [Google Scholar] [CrossRef] [Green Version]
  32. Sklar, F.H.; van der Valk, A. Tree Islands of the Everglades: An Overview. In Tree Islands of the Everglades; Springer: Berlin/Heidelberg, Germany, 2002; pp. 1–18. [Google Scholar]
  33. Doren, R.F.; Armentano, T.V.; Whiteaker, L.D.; Jones, R.D. Marsh vegetation patterns and soil phosphorus gradients in the Everglades ecosystem. Aquat. Bot. 1997, 56, 145–163. [Google Scholar] [CrossRef]
  34. Jones, D.T.; Sah, J.P.; Ross, M.S.; Oberbauer, S.F.; Hwang, B.; Jayachandran, K. Responses of twelve tree species common in Everglades tree islands to simulated hydrologic regimes. Wetlands 2006, 26, 830–844. [Google Scholar] [CrossRef]
  35. Leifheit, E.F.; Veresoglou, S.D.; Lehmann, A.; Kathryn Morris, E.; Rillig, M.C. Multiple factors influence the role of arbuscular mycorrhizal fungi in soil aggregation—A meta-analysis. Plant Soil 2014, 374, 523–537. [Google Scholar] [CrossRef]
  36. Grinhut, T.; Hadar, Y.; Chen, Y. Degradation and transformation of humic substances by saprotrophic fungi: Processes and mechanisms. Fungal Biol. Rev. 2007, 21, 179–189. [Google Scholar] [CrossRef]
  37. Dobson, A.; Crawley, M. Pathogens and the structure of plant communities. Trends Ecol. Evol. 1994, 9, 393–398. [Google Scholar] [CrossRef]
  38. Gottlieb, A.D.; Richards, J.H.; Gaiser, E.E. Comparative study of periphyton community structure in long and short-hydroperiod Everglades marshes. Hydrobiologia 2006, 569, 195–207. [Google Scholar] [CrossRef]
  39. Pisani, O.; Gao, M.; Maie, N.; Miyoshi, T.; Childers, D.L.; Jaffé, R. Compositional aspects of herbaceous litter decomposition in the freshwater marshes of the Florida Everglades. Plant Soil 2018, 423, 87–98. [Google Scholar] [CrossRef]
  40. Wallace, B.; Dickinson, C.H. Peat Microfungi in Three Habitats in the Florida Everglades. Mycologia 1978, 70, 1151. [Google Scholar] [CrossRef]
  41. Aich, S.; Ewe, S.M.L.; Gu, B.; Dreschel, T.W. An evaluation of peat loss from an Everglades tree island, Florida, USA. Mires Peat 2014, 14, 1–15. [Google Scholar]
  42. Stoffella, S.L.; Ross, M.S.; Sah, J.P.; Price, R.M.; Sullivan, P.L.; Cline, E.A.; Scinto, L.J. Survival and growth responses of eight Everglades tree species along an experimental hydrological gradient on two tree island types. Appl. Veg. Sci. 2010, 13, 439–449. [Google Scholar] [CrossRef] [Green Version]
  43. Sah, P.J.; Richards, J.H.; Ross, M.S.; Stoffella, S.L.; Cline, E.; Dreschel, T.W.; Sklar, F.H. Understory Vegetation Composition and Biomass on the Tree Islands in the Loxahatchee Impoundment Landscape Assessment (LILA) Experimental Site. in preparation.
  44. Frazer, G.W.; Canham, C.D.; Lertzman, K.P. Gap Light Analyzer (Gla), Version 2.0: Imaging Software to Extract Canopy Structure and Gap Light Transmission Indices from True-Colour Fisheye Photographs, Users Manual and Program Documentation; Simon Fraser University: Burnaby, BC, Canada; Institute of Ecosystem Studies: New York, NY, USA, 1999; 36p. [Google Scholar]
  45. Gohl, D.M.; Vangay, P.; Garbe, J.; MacLean, A.; Hauge, A.; Becker, A.; Gould, T.J.; Clayton, J.B.; Johnson, T.J.; Hunter, R.; et al. Systematic improvement of amplicon marker gene methods for increased accuracy in microbiome studies. Nat. Biotechnol. 2016, 34, 942–949. [Google Scholar] [CrossRef] [Green Version]
  46. Bolyen, E.; Rideout, J.R.; Dillon, M.R.; Bokulich, N.A.; Abnet, C.C.; Al-Ghalith, G.A.; Alexander, H.; Alm, E.J.; Arumugam, M.; Asnicar, F.; et al. Reproducible, interactive, scalable and extensible microbiome data science using QIIME 2. Nat. Biotechnol. 2019, 37, 852–857. [Google Scholar] [CrossRef]
  47. Nilsson, R.H.; Larsson, K.-H.; Taylor, A.F.S.; Bengtsson-Palme, J.; Jeppesen, T.S.; Schigel, D.; Kennedy, P.; Picard, K.; Glöckner, F.O.; Tedersoo, L.; et al. The UNITE database for molecular identification of fungi: Handling dark taxa and parallel taxonomic classifications. Nucleic Acids Res. 2019, 47, D259–D264. [Google Scholar] [CrossRef] [PubMed]
  48. Glassman, S.I.; Martiny, J.B.H. Broadscale Ecological Patterns Are Robust to Use of Exact Sequence Variants versus Operational Taxonomic Units. mSphere 2018, 3. [Google Scholar] [CrossRef] [PubMed] [Green Version]
  49. Barton, K. MuMIn: Multi-Model Inference, R Package Version 0.12.0. Available online: http://r-forge.r-project.org/projects/mumin/ (accessed on 29 June 2020).
  50. Oksanen, J.; Blanchet, F.G.; Kindt, R.; Legendre, P.; O’hara, R.B.; Simpson, G.L.; Wagner, H. Vegan: Community Ecology Package. R Package Version 1.17-4. Available online: http://CRAN.R-project.org/package=vegan (accessed on 29 June 2020).
  51. De Caceres, M.; Jansen, F.; Dell, N. Indicspecies: Studying the Statistical Relationship between Species and Groups of Sites. R Package Version 1. Available online: https://cran.r-project.org/web/packages/indicspecies/index.html (accessed on 29 June 2020).
  52. Dufrene, M.; Legendre, P. Species Assemblages and Indicator Species: The Need for a Flexible Asymmetrical Approach. Ecol. Monogr. 1997, 67, 345. [Google Scholar] [CrossRef]
  53. Nguyen, N.H.; Song, Z.; Bates, S.T.; Branco, S.; Tedersoo, L.; Menke, J.; Schilling, J.S.; Kennedy, P.G. FUNGuild: An open annotation tool for parsing fungal community datasets by ecological guild. Fungal Ecol. 2016, 20, 241–248. [Google Scholar] [CrossRef]
  54. Prinzing, A.; Durka, W.; Klotz, S.; Brandl, R. Geographic variability of ecological niches of plant species: Are competition and stress relevant? Ecography 2002, 25, 721–729. [Google Scholar] [CrossRef] [Green Version]
  55. Agrawal, A.A.; Ackerly, D.D.; Adler, F.; Elizabeth Arnold, A.; Cáceres, C.; Doak, D.F.; Post, E.; Hudson, P.J.; Maron, J.; Mooney, K.A.; et al. Filling key gaps in population and community ecology. Front. Ecol. Environ. 2007, 5, 145–152. [Google Scholar] [CrossRef] [Green Version]
  56. Brandt, L.A.; Ecker, D.; Rivera, I.G.; Traut, A.; Mazzotti, F.J. Wildlife and vegetation of bayhead islands in the A.R.M. Loxahatchee National Wildlife Refuge. Southeast. Nat. 2003, 2, 179–194. [Google Scholar] [CrossRef]
  57. Gann, T.T.; Childers, D.L. Relationships between Hydrology and Soils Describe Vegetation Patterns in Seasonally Flooded Tree Islands of the Southern Everglades, Florida. Plant Soil 2006, 279, 271–286. [Google Scholar] [CrossRef]
  58. Wang, Y.; Huang, Y.; Qiu, Q.; Xin, G.; Yang, Z.; Shi, S. Flooding greatly affects the diversity of arbuscular mycorrhizal fungi communities in the roots of wetland plants. PLoS ONE 2011, 6, e24512. [Google Scholar] [CrossRef]
  59. Yang, H.; Koide, R.T.; Zhang, Q. Short-term waterlogging increases arbuscular mycorrhizal fungal species richness and shifts community composition. Plant Soil 2016, 404, 373–384. [Google Scholar] [CrossRef]
  60. Dobbs, C.G. On the primary dispersal and isolation of fungal spores. New Phytol. 1942, 41, 63–69. [Google Scholar] [CrossRef]
  61. Light, S.S.; Dineen, J.W. Water control in the Everglades: A historical perspective. In The Ecosystem and Its Restoration; St. Lucie Press: Boca Raton, FL, USA, 1994; Volume 5, pp. 47–84. [Google Scholar]
  62. Willard, D.A.; Bernhardt, C.E.; Holmes, C.W.; Landacre, B.; Marot, M. Response of Everglades tree islands to environmental change. Ecol. Monogr. 2006, 76, 565–583. [Google Scholar] [CrossRef]
  63. Van Nuland, M.E.; Peay, K.G. Symbiotic niche mapping reveals functional specialization by two ectomycorrhizal fungi that expands the host plant niche. Fungal Ecol. 2020, 46, 100960. [Google Scholar] [CrossRef]
  64. Bougher, N.L.; Matheny, P.B. Two species of Inocybe (fungi) introduced into Western Australia. Nuytsia 2011, 3, 139–148. [Google Scholar]
  65. Rosling, A.; Cox, F.; Cruz-Martinez, K.; Ihrmark, K.; Grelet, G.-A.; Lindahl, B.D.; Menkis, A.; James, T.Y. Archaeorhizomycetes: Unearthing an ancient class of ubiquitous soil fungi. Science 2011, 333, 876–879. [Google Scholar] [CrossRef]
  66. Morgenstern, I.; Klopman, S.; Hibbett, D.S. Molecular evolution and diversity of lignin degrading heme peroxidases in the Agaricomycetes. J. Mol. Evol. 2008, 66, 243–257. [Google Scholar] [CrossRef]
  67. Schadt, C.W.; Martin, A.P.; Lipson, D.A.; Schmidt, S.K. Seasonal dynamics of previously unknown fungal lineages in tundra soils. Science 2003, 301, 1359–1361. [Google Scholar] [CrossRef] [Green Version]
  68. Morón-Ríos, A.; Gómez-Cornelio, S.; Ortega-Morales, B.O.; De la Rosa-García, S.; Partida-Martínez, L.P.; Quintana, P.; Alayón-Gamboa, J.A.; Cappello-García, S.; González-Gómez, S. Interactions between abundant fungal species influence the fungal community assemblage on limestone. PLoS ONE 2017, 12, e0188443. [Google Scholar] [CrossRef] [Green Version]
  69. Subedi, S.C.; Ross, M.S.; Scinto, L.J. Nutrient Limitation in Two Everglades Tree Species Planted on Constructed Tree Islands. Wetlands 2012, 32, 1163–1173. [Google Scholar] [CrossRef]
  70. Sullivan, P.L.; Price, R.M.; Ross, M.S.; Scinto, L.J.; Stoffella, S.L.; Cline, E.; Dreschel, T.W.; Sklar, F.H. Hydrologic processes on tree islands in the Everglades (Florida, USA): Tracking the effects of tree establishment and growth. Hydrogeol. J. 2011, 19, 367–378. [Google Scholar] [CrossRef]
  71. Estrada-Medina, H.; Canto-Canché, B.B.; De Los Santos-Briones, C.; O’Connor-Sánchez, A. Yucatán in black and red: Linking edaphic analysis and pyrosequencing-based assessment of bacterial and fungal community structures in the two main kinds of soil of Yucatán State. Microbiol. Res. 2016, 188, 23–33. [Google Scholar] [CrossRef] [PubMed]
  72. Rose, S.L. Mycorrhizal associations of some actinomycete nodulated nitrogen-fixing plants. Can. J. Bot. 1980, 58, 1449–1454. [Google Scholar] [CrossRef]
  73. Ma, S.; Verheyen, K.; Props, R.; Wasof, S.; Vanhellemont, M.; Boeckx, P.; Boon, N.; De Frenne, P. Plant and soil microbe responses to light, warming and nitrogen addition in a temperate forest. Funct. Ecol. 2018, 32, 1293–1303. [Google Scholar] [CrossRef]
  74. Bartemucci, P.; Messier, C.; Canham, C.D. Overstory influences on light attenuation patterns and understory plant community diversity and composition in southern boreal forests of Quebec. Can. J. For. Res. 2006, 36, 2065–2079. [Google Scholar] [CrossRef] [Green Version]
  75. Kulmatiski, A.; Beard, K.H. Long-term plant growth legacies overwhelm short-term plant growth effects on soil microbial community structure. Soil Biol. Biochem. 2011, 43, 823–830. [Google Scholar] [CrossRef]
  76. McGuire, K.L.; Fierer, N.; Bateman, C.; Treseder, K.K.; Turner, B.L. Fungal community composition in neotropical rain forests: The influence of tree diversity and precipitation. Microb. Ecol. 2012, 63, 804–812. [Google Scholar] [CrossRef] [Green Version]
  77. Broeckling, C.D.; Broz, A.K.; Bergelson, J.; Manter, D.K.; Vivanco, J.M. Root exudates regulate soil fungal community composition and diversity. Appl. Environ. Microbiol. 2008, 74, 738–744. [Google Scholar] [CrossRef] [Green Version]
  78. Kong, C.H.; Wang, P.; Zhao, H.; Xu, X.H.; Zhu, Y.D. Impact of allelochemical exuded from allelopathic rice on soil microbial community. Soil Biol. Biochem. 2008, 40, 1862–1869. [Google Scholar] [CrossRef]
  79. Chapman, S.K.; Newman, G.S. Biodiversity at the plant–soil interface: Microbial abundance and community structure respond to litter mixing. Oecologia 2010, 162, 763–769. [Google Scholar] [CrossRef]
  80. Wang, J.; Chen, C.; Ye, Z.; Li, J.; Feng, Y.; Lu, Q. Relationships Between Fungal and Plant Communities Differ Between Desert and Grassland in a Typical Dryland Region of Northwest China. Front. Microbiol. 2018, 9, 2327. [Google Scholar] [CrossRef]
  81. Voříšková, J.; Baldrian, P. Fungal community on decomposing leaf litter undergoes rapid successional changes. ISME J. 2013, 7, 477–486. [Google Scholar] [CrossRef] [PubMed]
  82. Sheldrake, M.; Rosenstock, N.P.; Revillini, D.; Olsson, P.A.; Mangan, S.; Sayer, E.J.; Wallander, H.; Turner, B.L.; Tanner, E.V.J. Arbuscular mycorrhizal fungal community composition is altered by long-term litter removal but not litter addition in a lowland tropical forest. New Phytol. 2017, 214, 455–467. [Google Scholar] [CrossRef] [PubMed] [Green Version]
  83. Bittebiere, A.; Vandenkoornhuyse, P.; Maluenda, E.; Gareil, A.; Dheilly, A.; Coudouel, S.; Bahin, M.; Mony, C. Past spatial structure of plant communities determines arbuscular mycorrhizal fungal community assembly. J. Ecol. 2020, 108, 546–560. [Google Scholar] [CrossRef]
  84. Rashid, M.I.; Mujawar, L.H.; Shahzad, T.; Almeelbi, T.; Ismail, I.M.I.; Oves, M. Bacteria and fungi can contribute to nutrients bioavailability and aggregate formation in degraded soils. Microbiol. Res. 2016, 183, 26–41. [Google Scholar] [CrossRef]
  85. Matulich, K.L.; Martiny, J.B.H. Microbial composition alters the response of litter decomposition to environmental change. Ecology 2015, 96, 154–163. [Google Scholar] [CrossRef]
  86. Maron, J.L.; Marler, M.; Klironomos, J.N.; Cleveland, C.C. Soil fungal pathogens and the relationship between plant diversity and productivity. Ecol. Lett. 2011, 14, 36–41. [Google Scholar] [CrossRef]
  87. Van der Heijden, M.G.A.; Boller, T.; Wiemken, A.; Sanders, I.R. Different arbsucular mycorrhizal fungal species are potential determinants of plant community structure. Ecology 1998, 79, 2082–2091. [Google Scholar] [CrossRef]
  88. Bartelt-Ryser, J.; Joshi, J.; Schmid, B.; Brandl, H.; Balser, T. Soil feedbacks of plant diversity on soil microbial communities and subsequent plant growth. Perspect. Plant Ecol. Evol. Syst. 2005, 7, 27–49. [Google Scholar] [CrossRef]
  89. Arnold, A.E.; Elizabeth Arnold, A. Understanding the diversity of foliar endophytic fungi: Progress, challenges, and frontiers. Fungal Biol. Rev. 2007, 21, 51–66. [Google Scholar] [CrossRef]
  90. Crowther, T.W.; Boddy, L.; Hefin Jones, T. Functional and ecological consequences of saprotrophic fungus–grazer interactions. ISME J. 2012, 6, 1992–2001. [Google Scholar] [CrossRef] [Green Version]
  91. Dreschel, T.W.; Cline, E.A.; Hill, S.D. Everglades tree island restoration: Testing a simple tree planting technique patterned after a natural process. Restor. Ecol. 2017, 25, 696–704. [Google Scholar] [CrossRef]
  92. Amend, A.S.; Seifert, K.A.; Bruns, T.D. Quantifying microbial communities with 454 pyrosequencing: Does read abundance count? Mol. Ecol. 2010, 19, 5555–5565. [Google Scholar] [CrossRef] [PubMed]
  93. Troskie, A.M.; Vlok, N.M.; Rautenbach, M. A novel 96-well gel-based assay for determining antifungal activity against filamentous fungi. J. Microbiol. Methods 2012, 91, 551–558. [Google Scholar] [CrossRef] [PubMed]
  94. Lee, Y.-J.; van Nostrand, J.D.; Tu, Q.; Lu, Z.; Cheng, L.; Yuan, T.; Deng, Y.; Carter, M.Q.; He, Z.; Wu, L.; et al. The PathoChip, a functional gene array for assessing pathogenic properties of diverse microbial communities. ISME J. 2013, 7, 1974–1984. [Google Scholar] [CrossRef] [Green Version]
  95. Carvalhais, L.C.; Dennis, P.G.; Tyson, G.W.; Schenk, P.M. Application of metatranscriptomics to soil environments. J. Microbiol. Methods 2012, 91, 246–251. [Google Scholar] [CrossRef]
Figure 1. Factors explaining fungal community diversity (A,B) and richness (C,D). The results from the model selection that indicated fungal Shannon diversity were explained by the relative water level (A; F1,68 = 8.63, p = 0.004) and plant evenness (B; F1,68 = 8.83, p = 0.004), and fungal richness was explained by canopy openness (C; F1,65 = 9.41, p = 0.003) and understory plant evenness (D; F1,65 = 7.66, p = 0.007). In all panels, each point represents a site in the experimental tree islands, and lines are based on a linear model relationship between these variables with the shaded area indicating the 95% confidence intervals around the line. In (A), note that relative water level values equal to zero represent sites where the water level was on average at the soil surface. Values greater than zero represent the sites that were on average inundated, and values less than zero represent sites that on average had water below the soil surface.
Diversity 12 00324 g001
Figure 2. Ordination demonstrating the relationship between fungal community composition and environmental variables. Each point represents the fungal community composition at a site on the experimental tree islands. Points are colored by relative water level (in meters) from high water (light colors) to low water (dark colors). The graphs on either side of the ordination indicate the mean and standard error of tree density and island core type along the first two axes of community composition (CAP1 and CAP2). Different lowercase letters denote significant differences. The table (in upper right corner) details correlations between continuous environmental variables.
Diversity 12 00324 g002
Figure 3. Factors involved in the distribution of fungal functional guilds. The number of functional guilds was positively associated with understory plant community evenness (A; F1,61 = 10.12, p = 0.002). As the relative water level decreased, the abundance of the plant pathogen-wood saprotroph guild increased (B; F1,61 = 10.12, p = 0.002). The lines are based on a linear model between variables with the shaded area indicating the 95% confidence interval and each point representing a site on the tree islands. Note that functional guild analyses are based on the approximately 20% exact sequence variants (ESVs) that could be identified at the species level using UNITE.
Diversity 12 00324 g003
Table 1. Best models for the response of fungal diversity and richness to abiotic and biotic tree island factors.
Island FactorsFungal DiversityFungal Richness
Relative Water LevelF1,68 = 8.63, p = 0.0045F1,65 = 2.40, p = 0.1255
Island Core--F1,6 = 1.18, p = 0.3188
Canopy Openness--F1,65 = 9.41, p = 0.0031
Tree Density--F1,65 = 1.99, p = 0.1626
Understory EvennessF1,68 = 8.83, p = 0.0041F1,65 = 7.66, p = 0.0073
Understory Richness--F1,65 = 1.78, p = 0.1864
Estimated Understory Biomass----
NOTE: All environmental factors with statistical results listed in the table were part of the model selection’s best fit model, and significant terms are bolded. Double dashes indicate those environmental variables that were not included in the best model. ‘Understory’ metrics refer to characteristics of the understory plant community.

