Activity Patterns of Cave-Dwelling Bat Species during Pre-Hibernation Swarming and Post-Hibernation Emergence in the Central Appalachians

Abstract
:1. Introduction
2. Methods
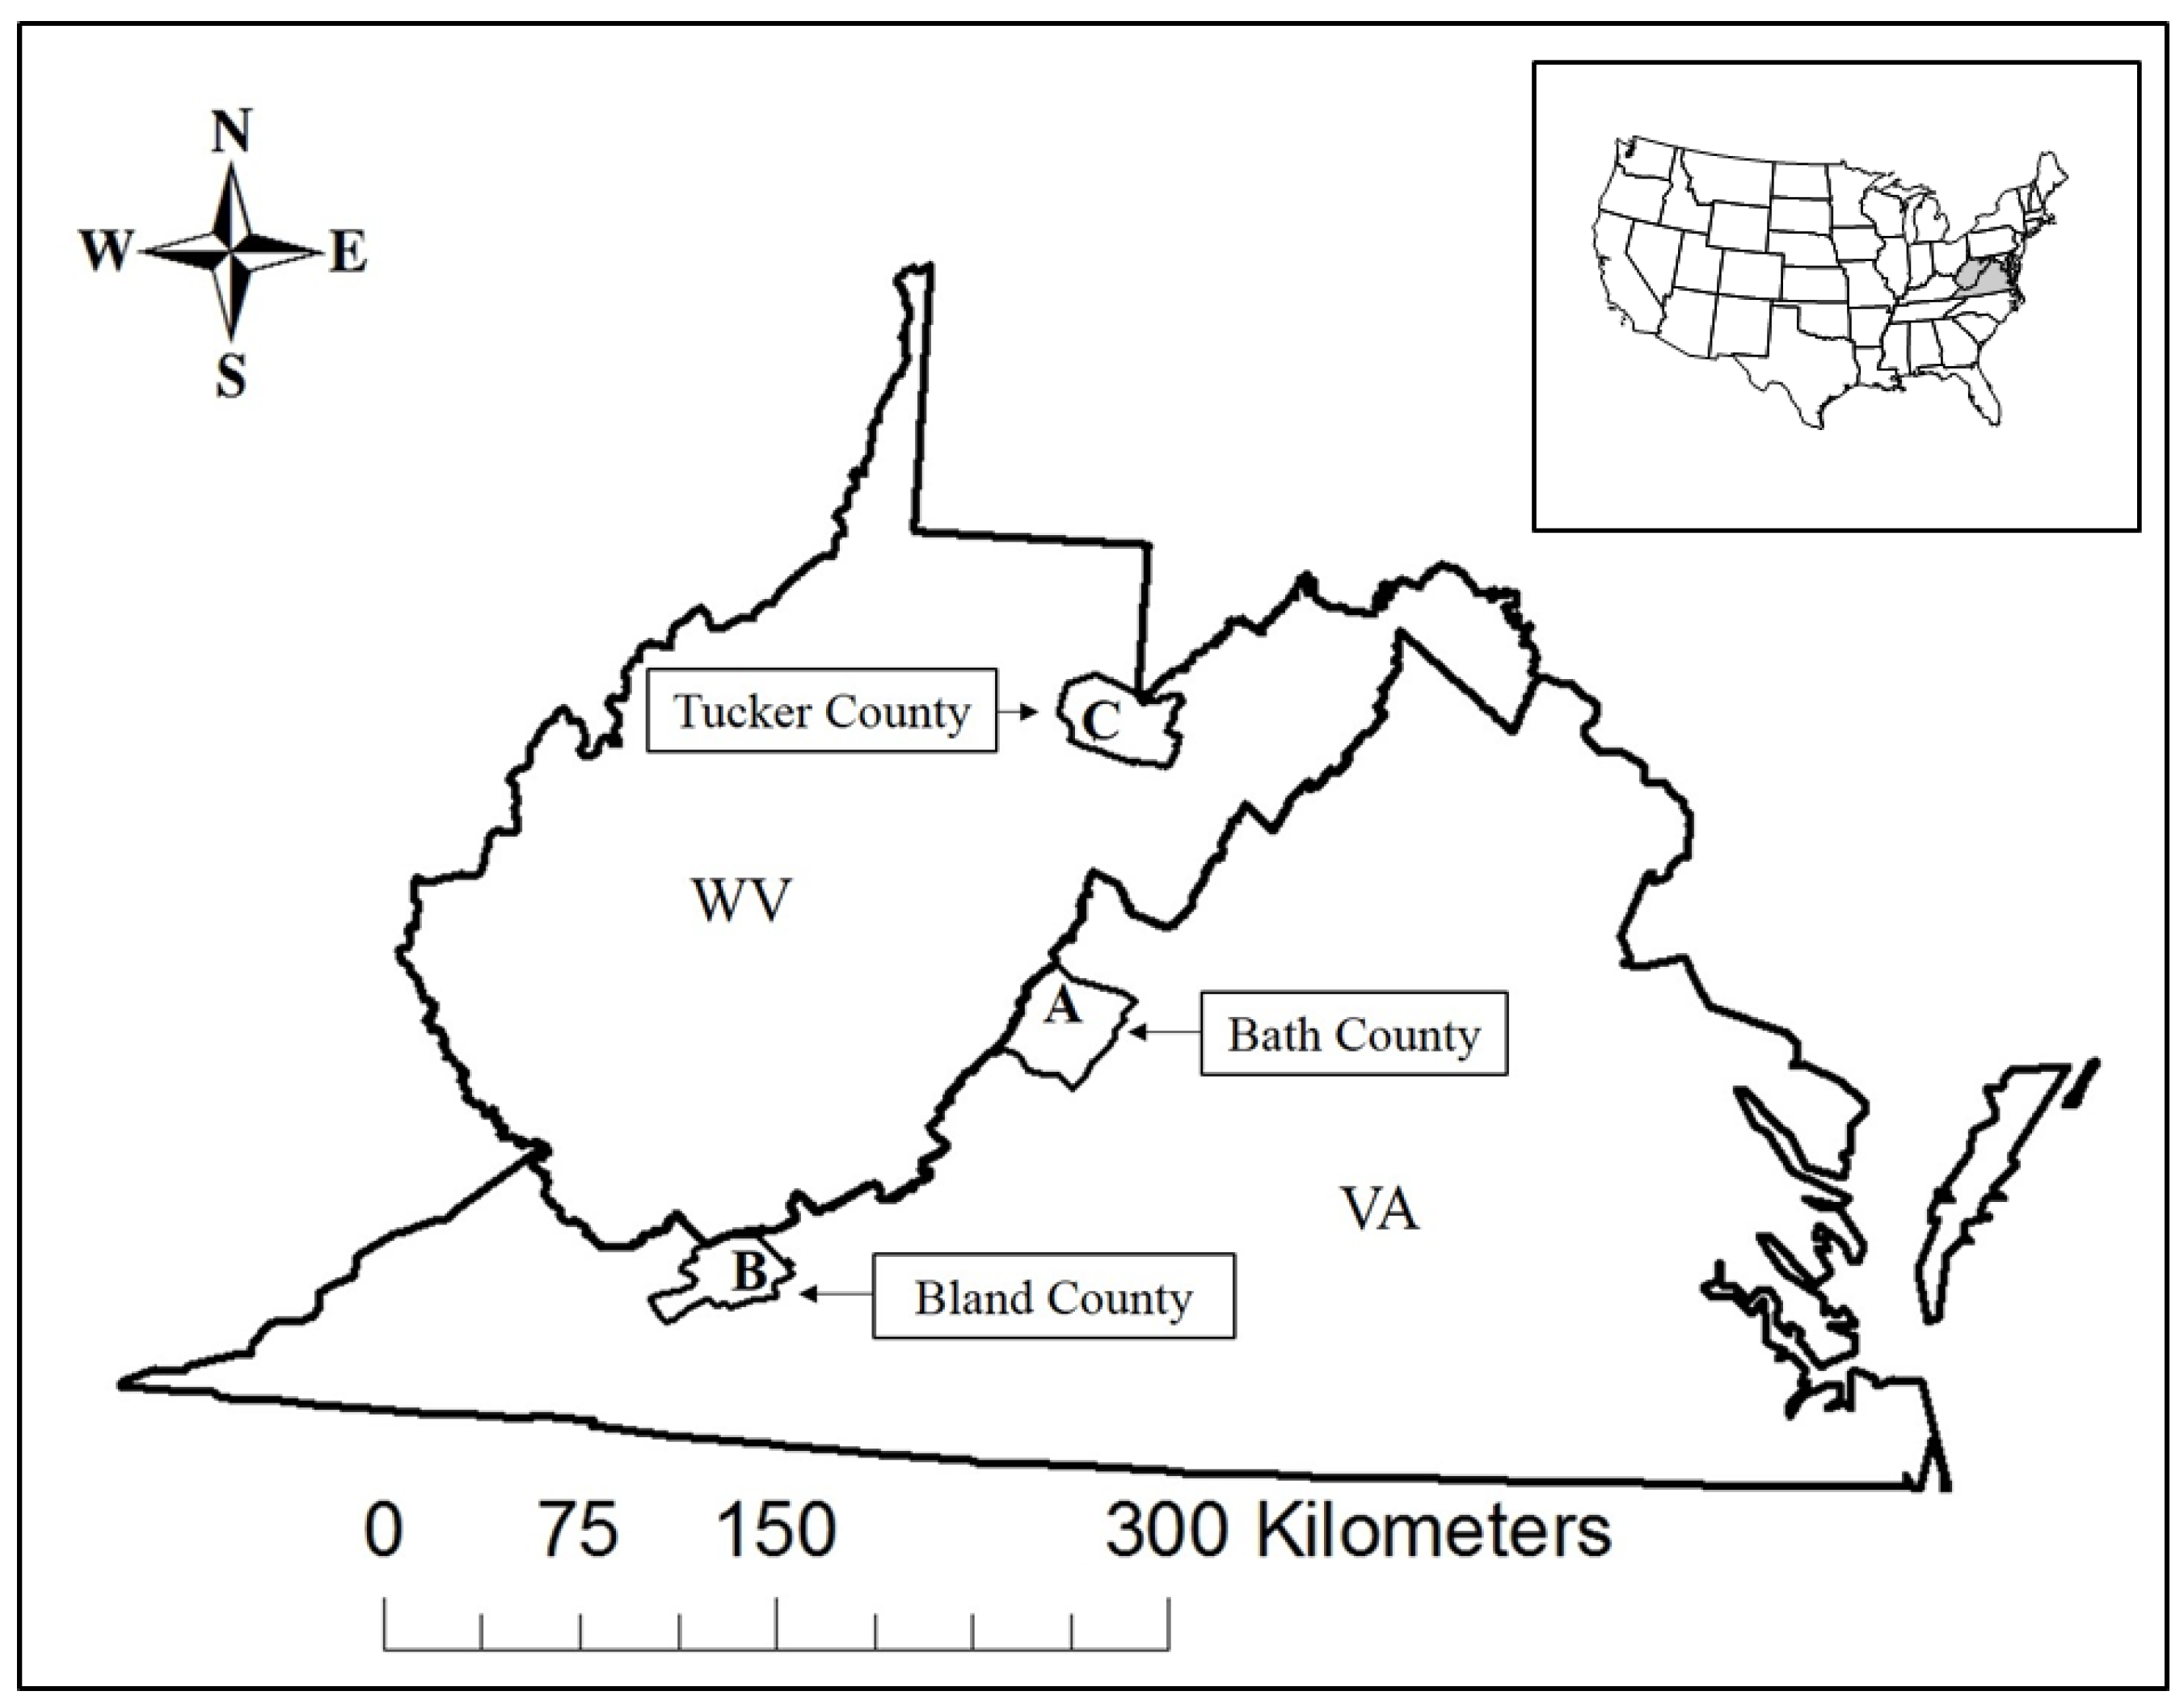
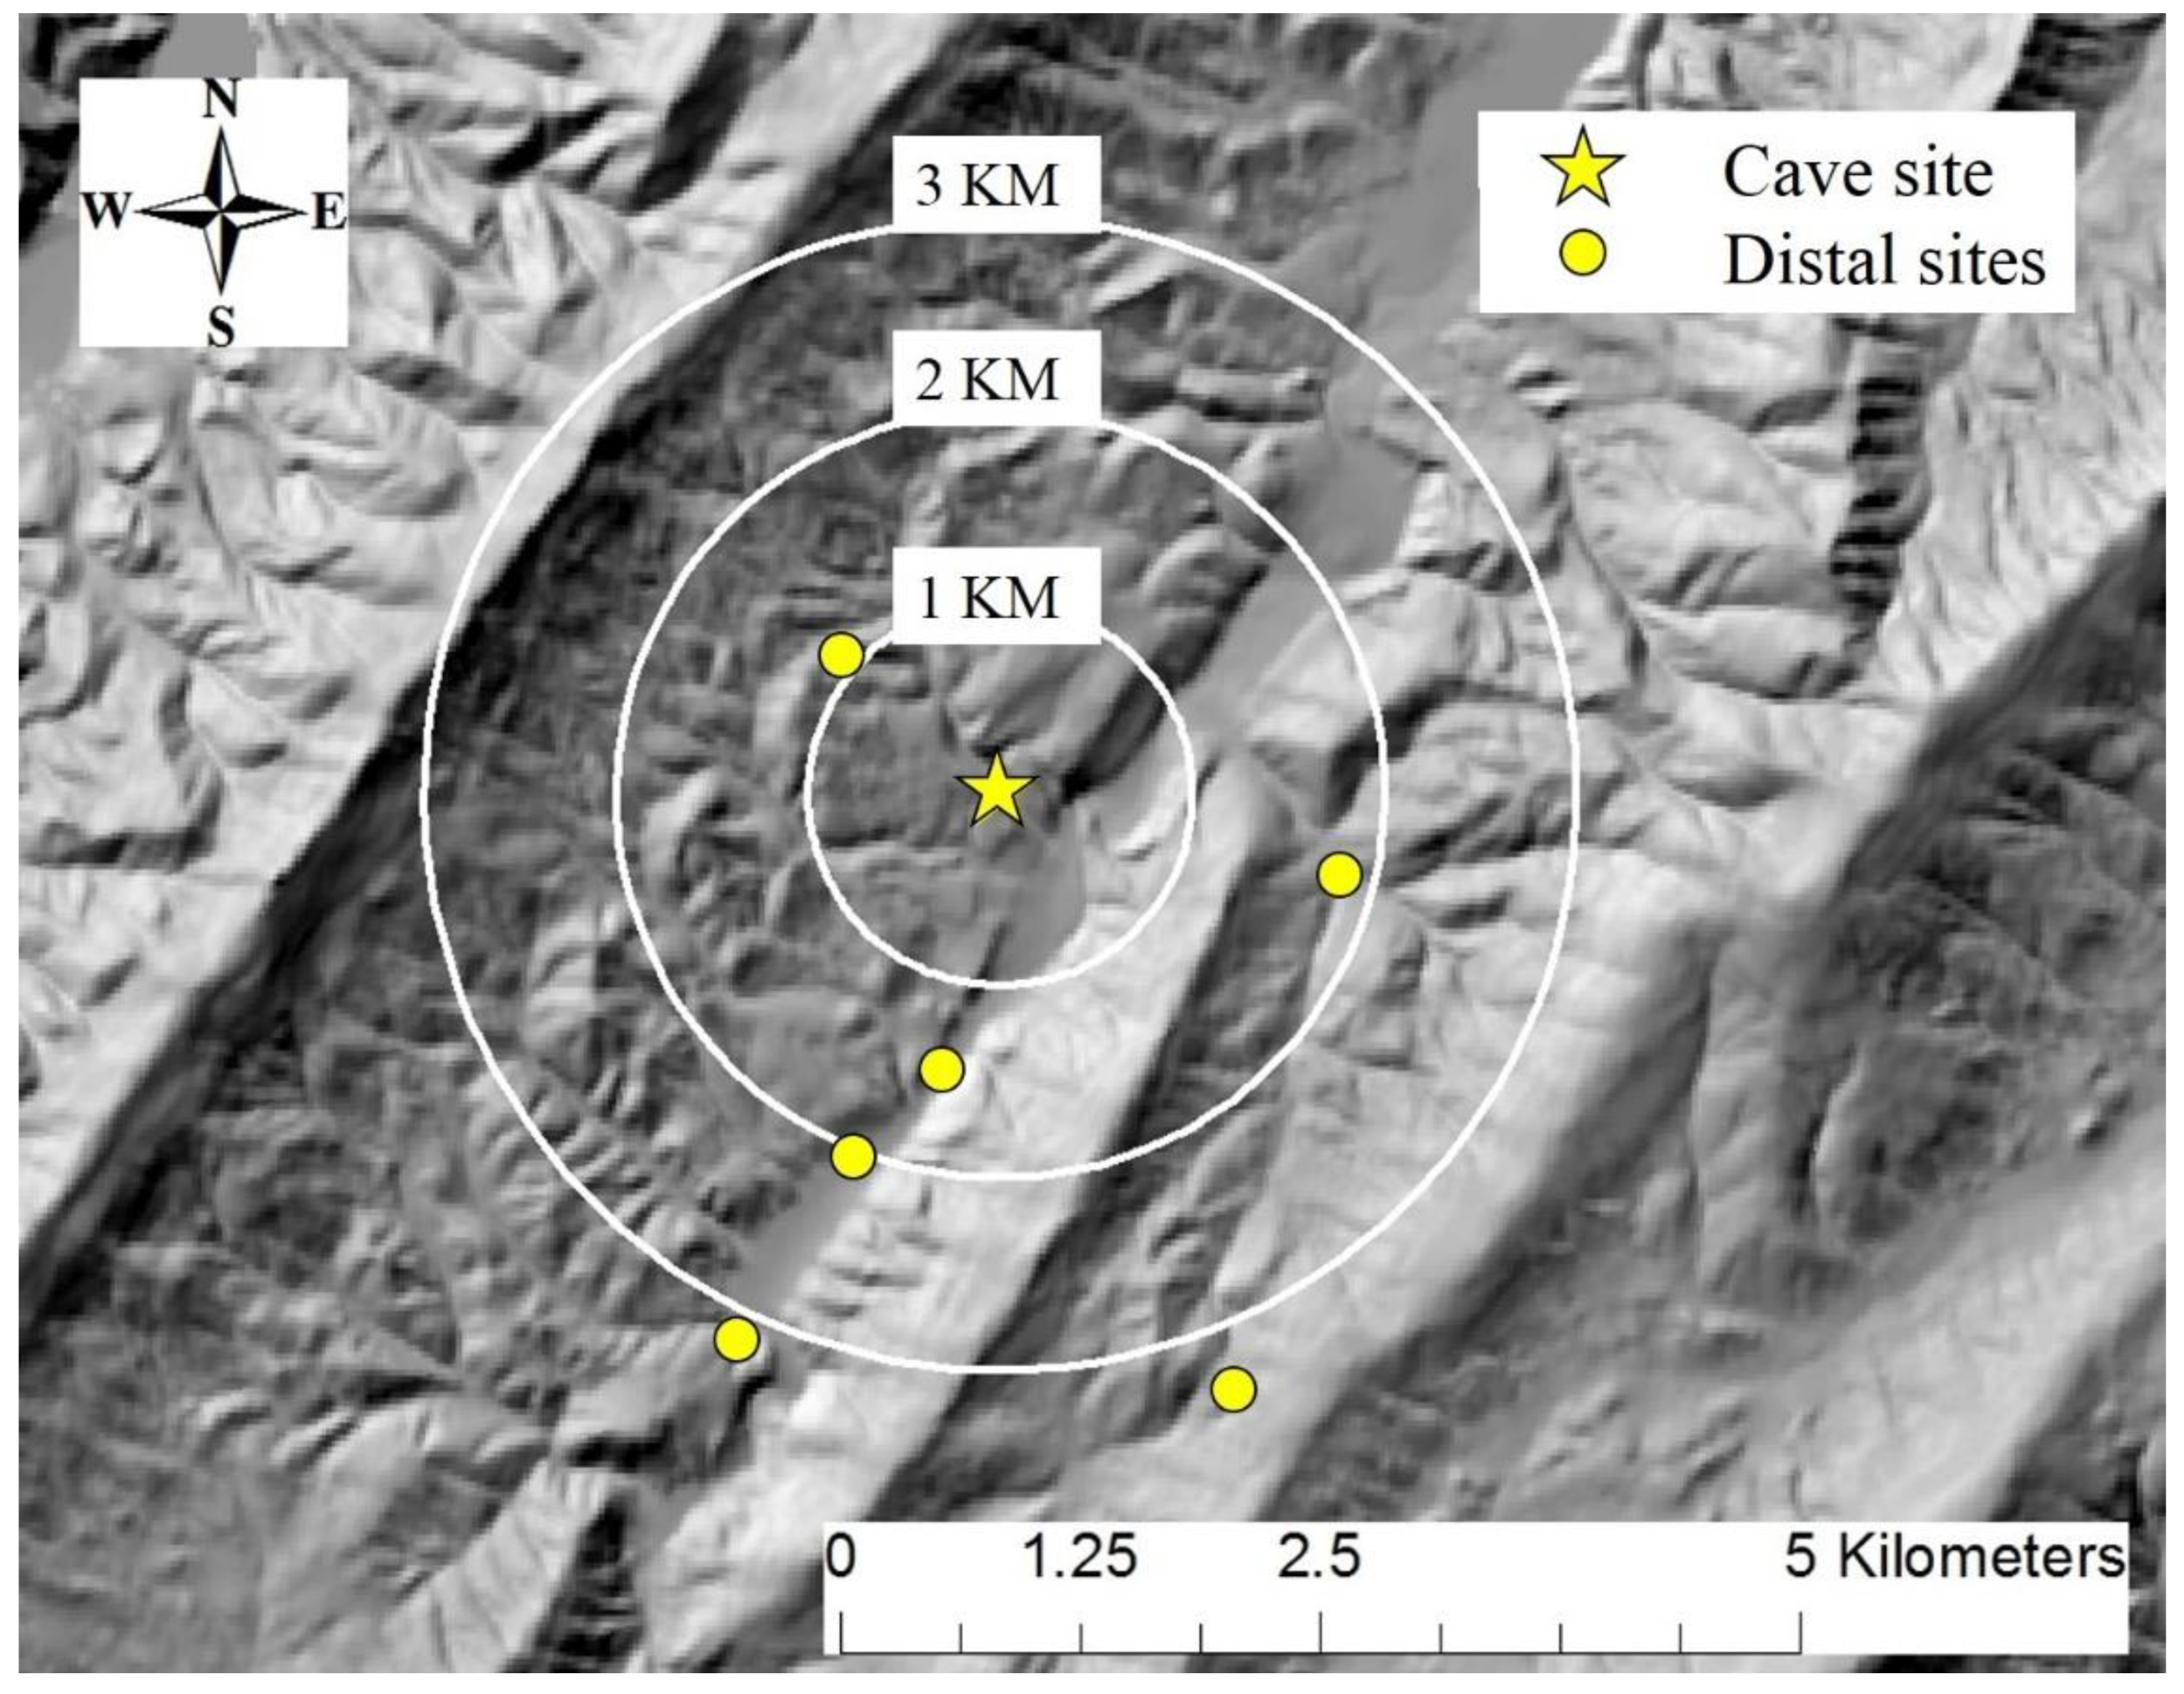
2.1. Study Area
2.2. Data Collection
2.3. Statistical Analyses
3. Results
3.1. Total Activity
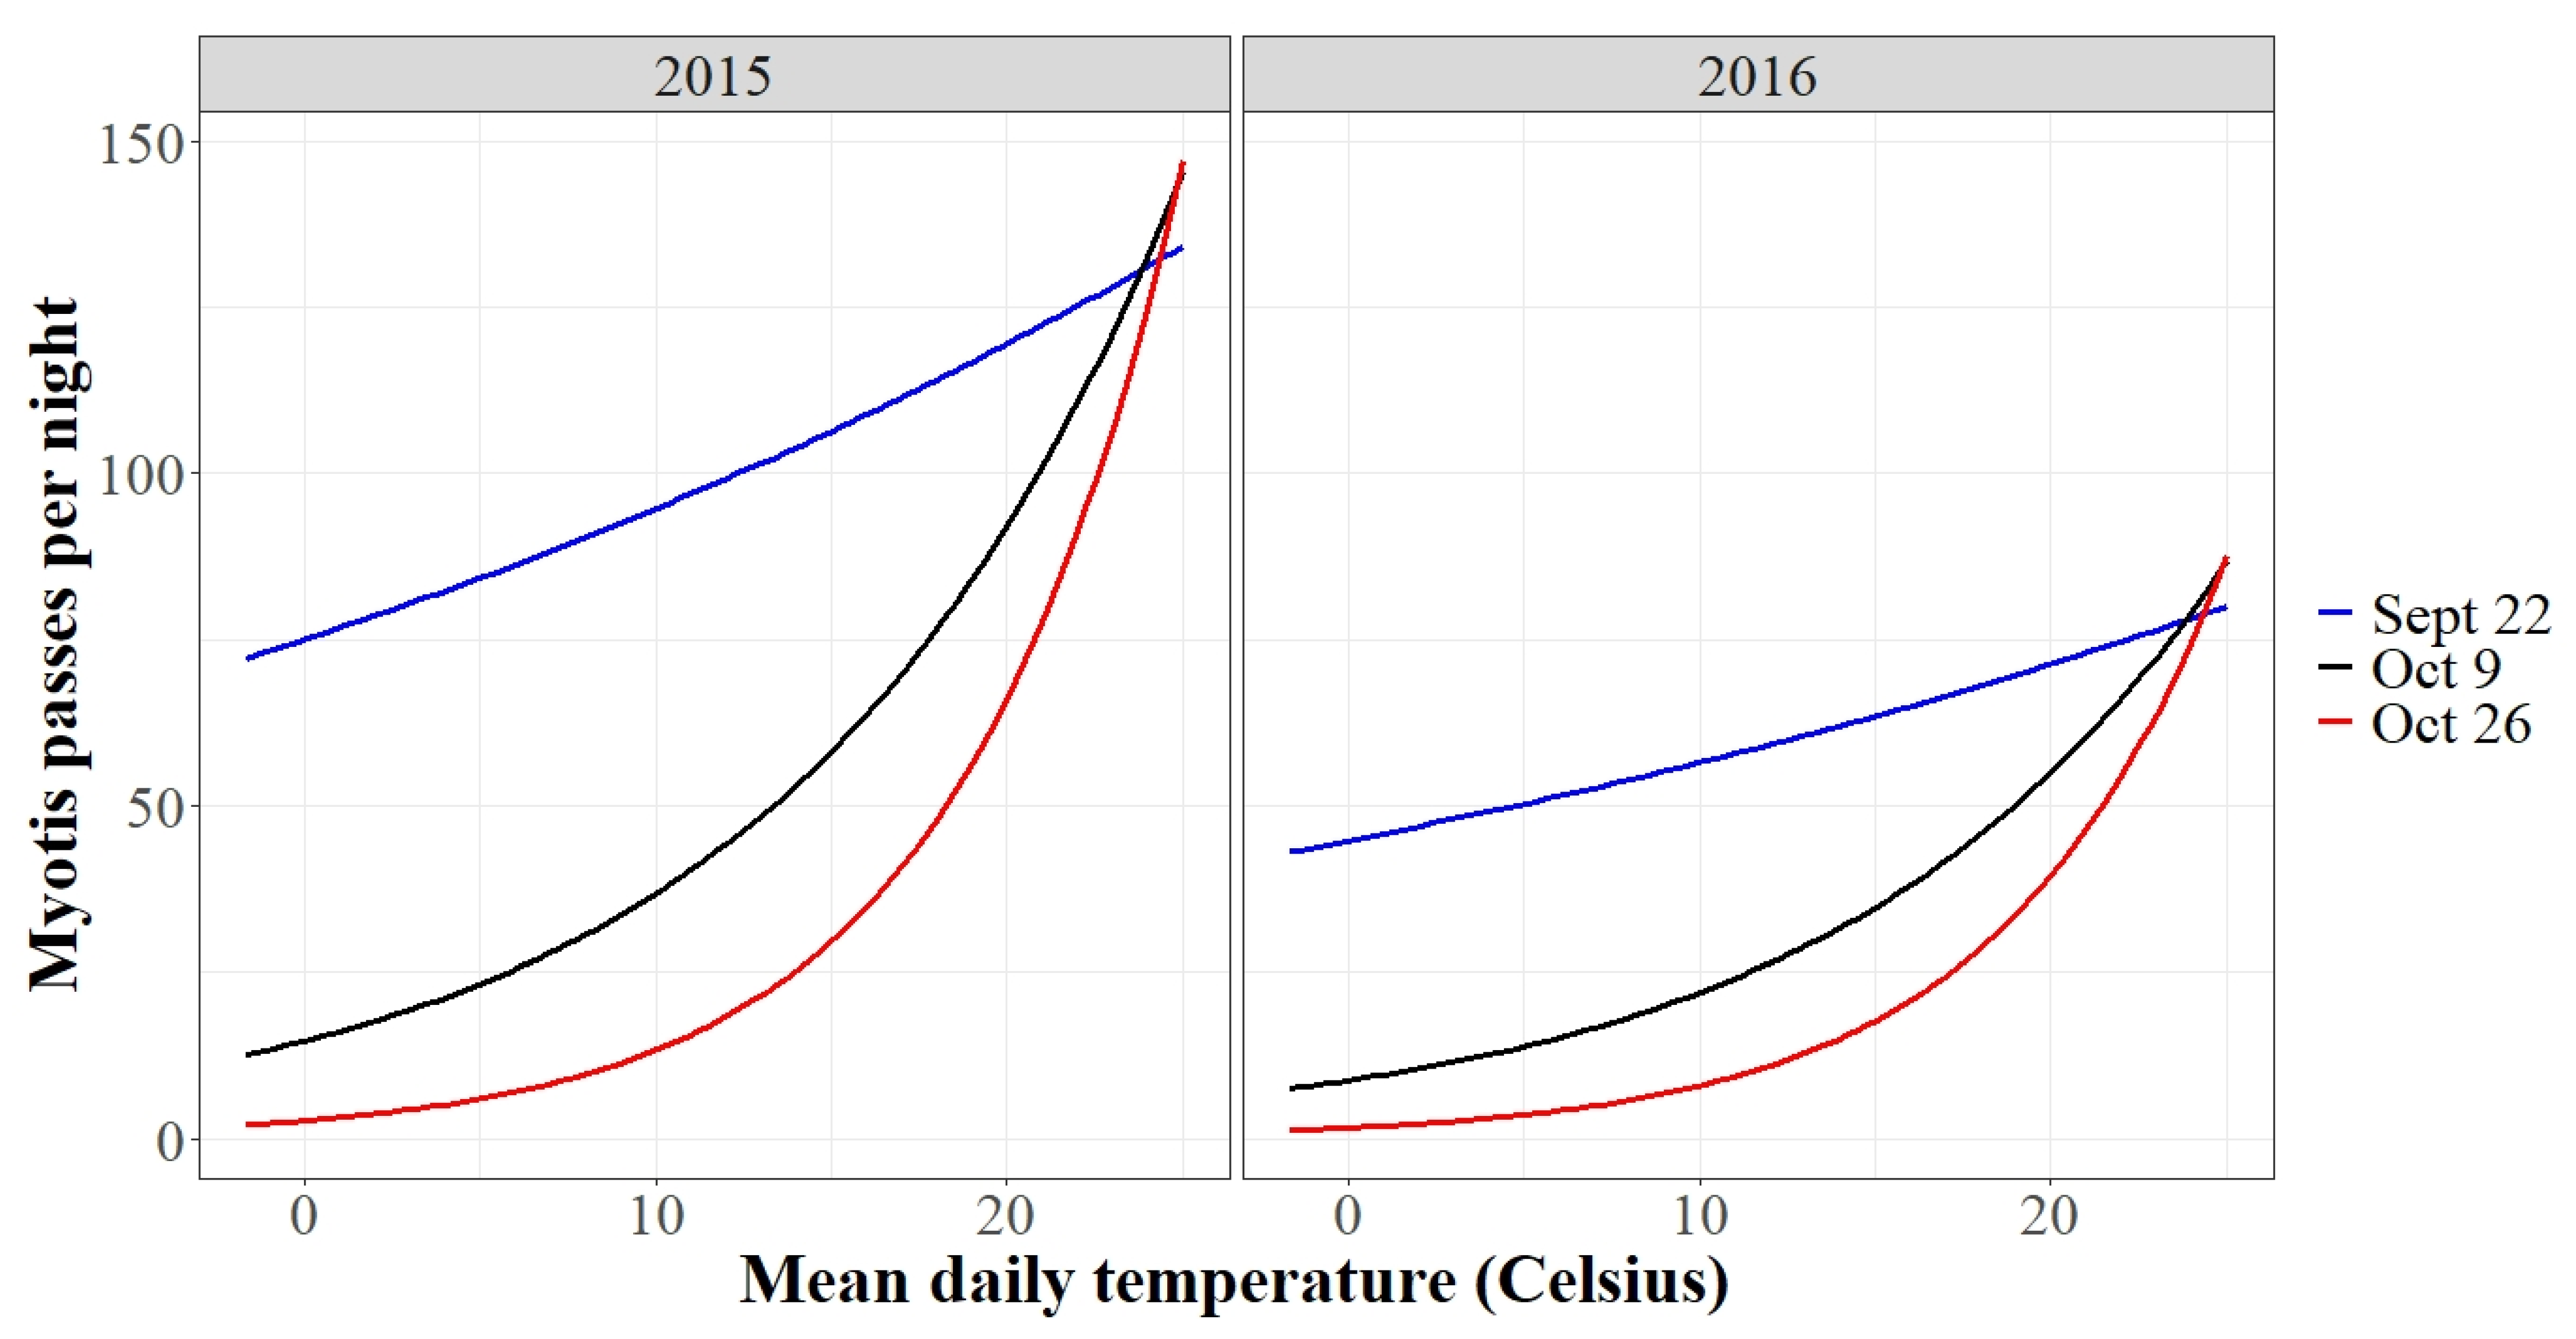
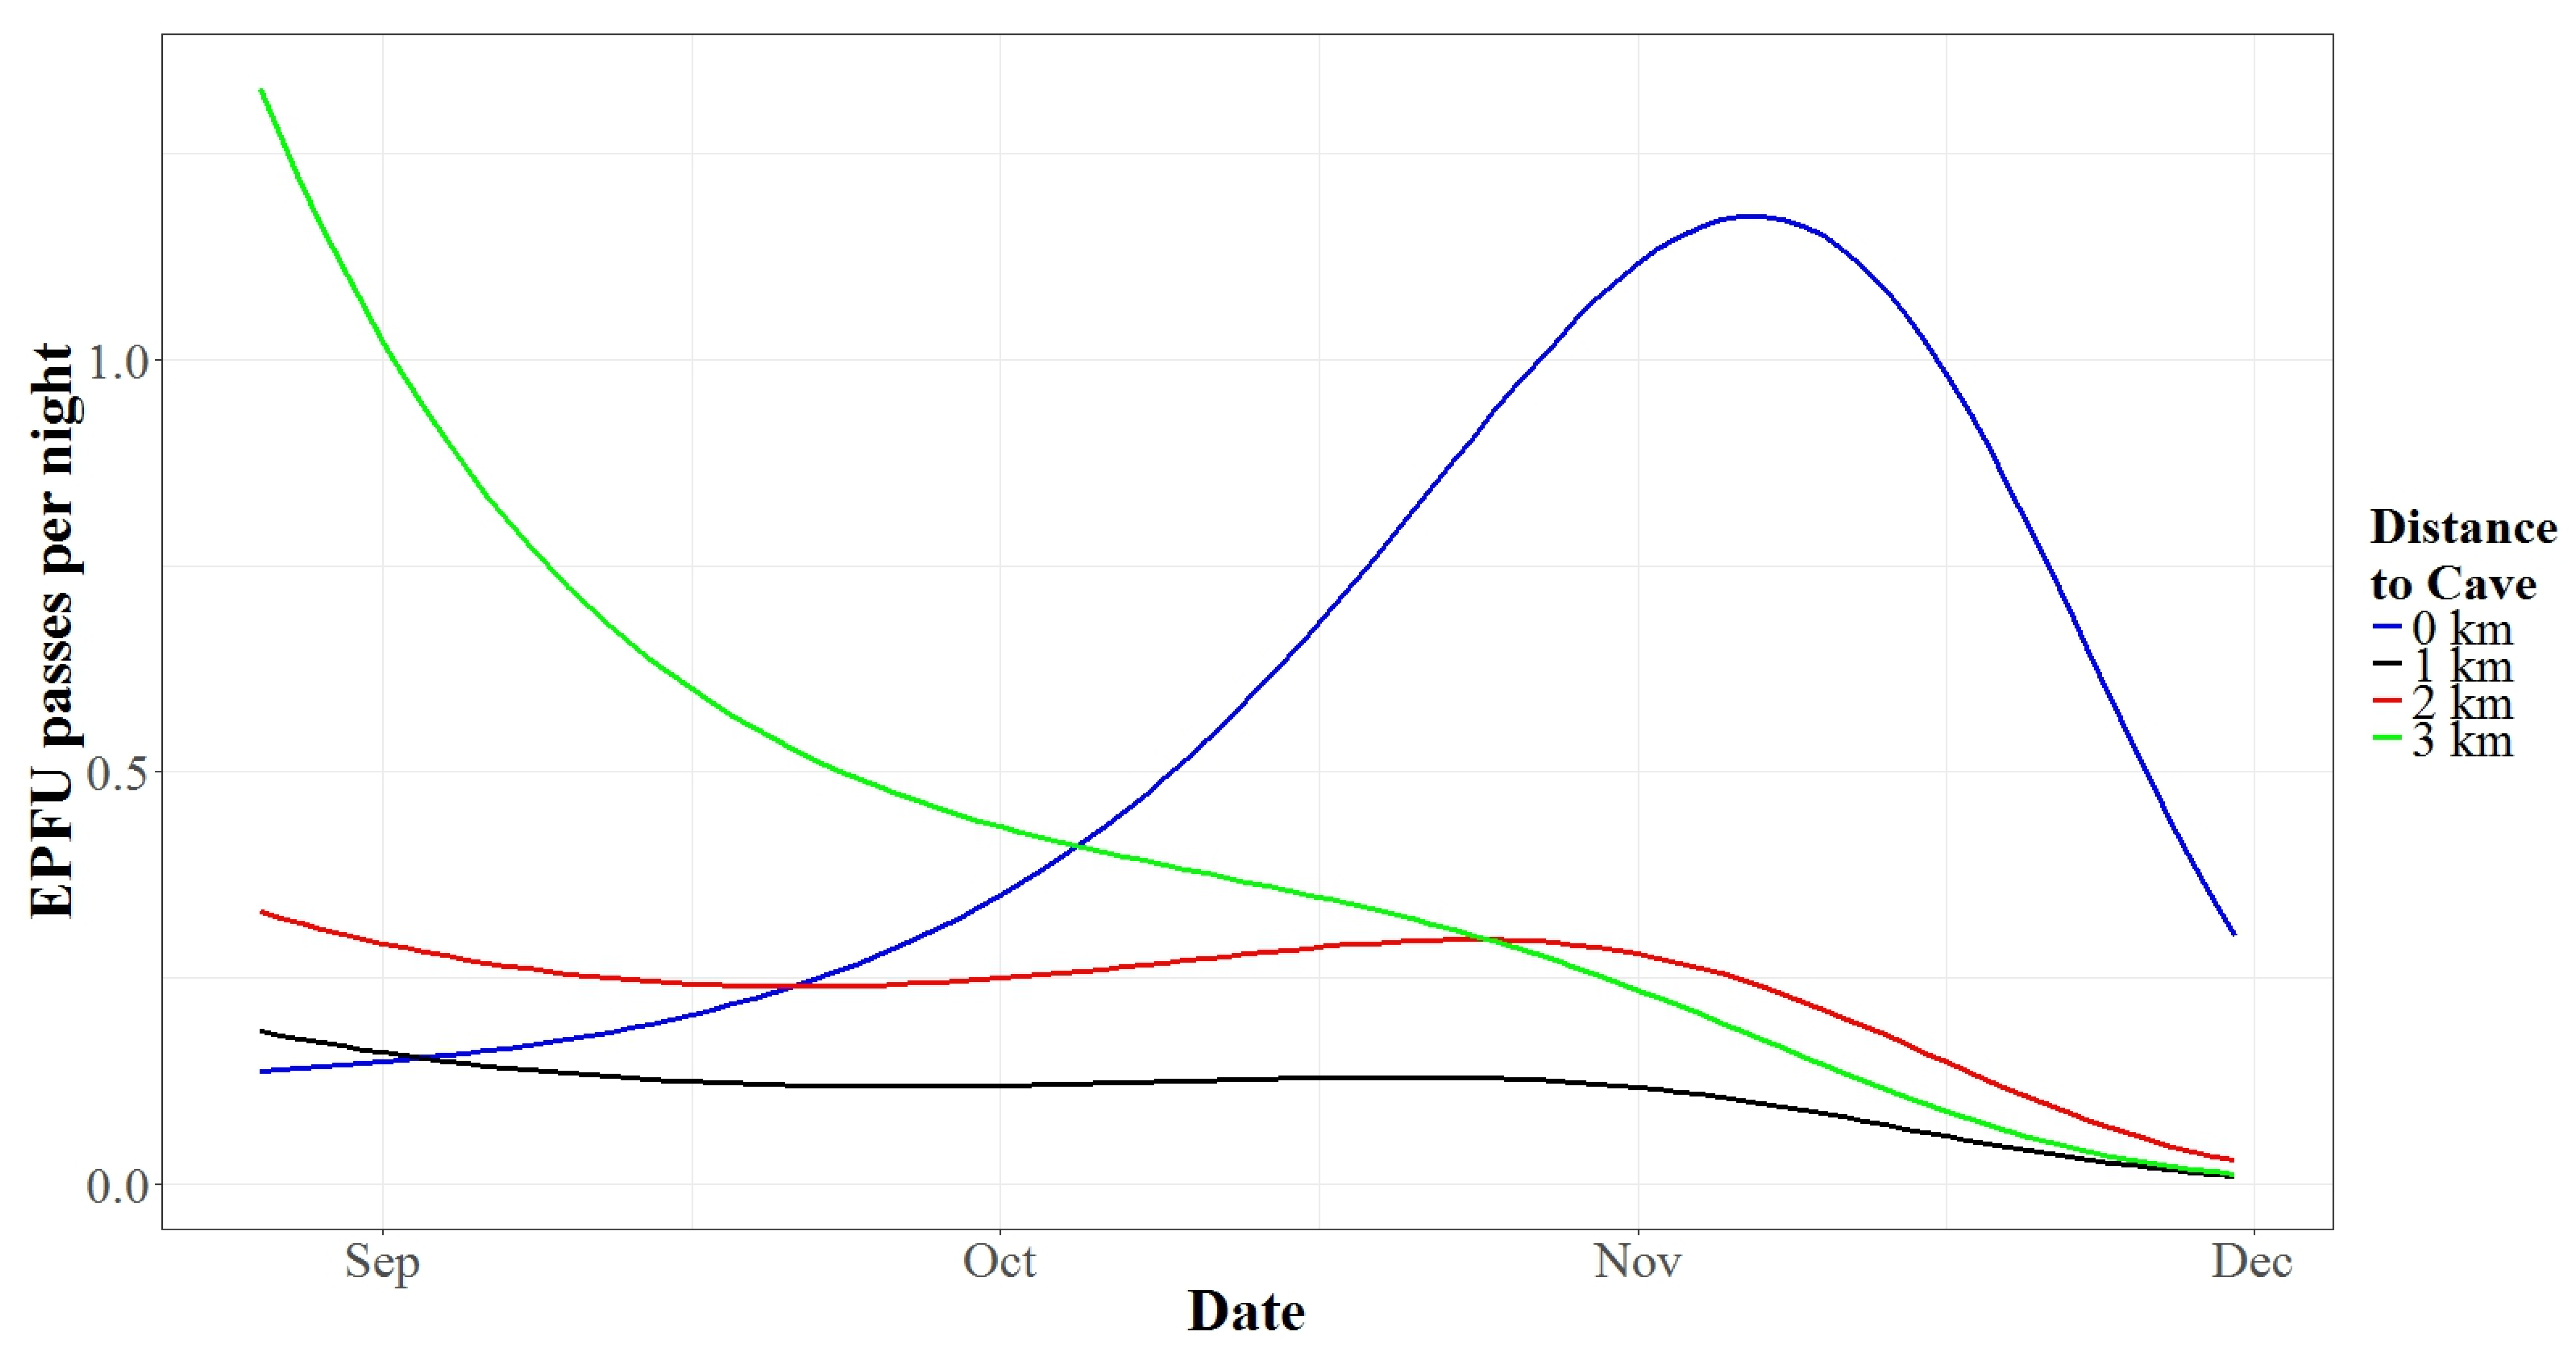
3.2. Autumn Activity Patterns
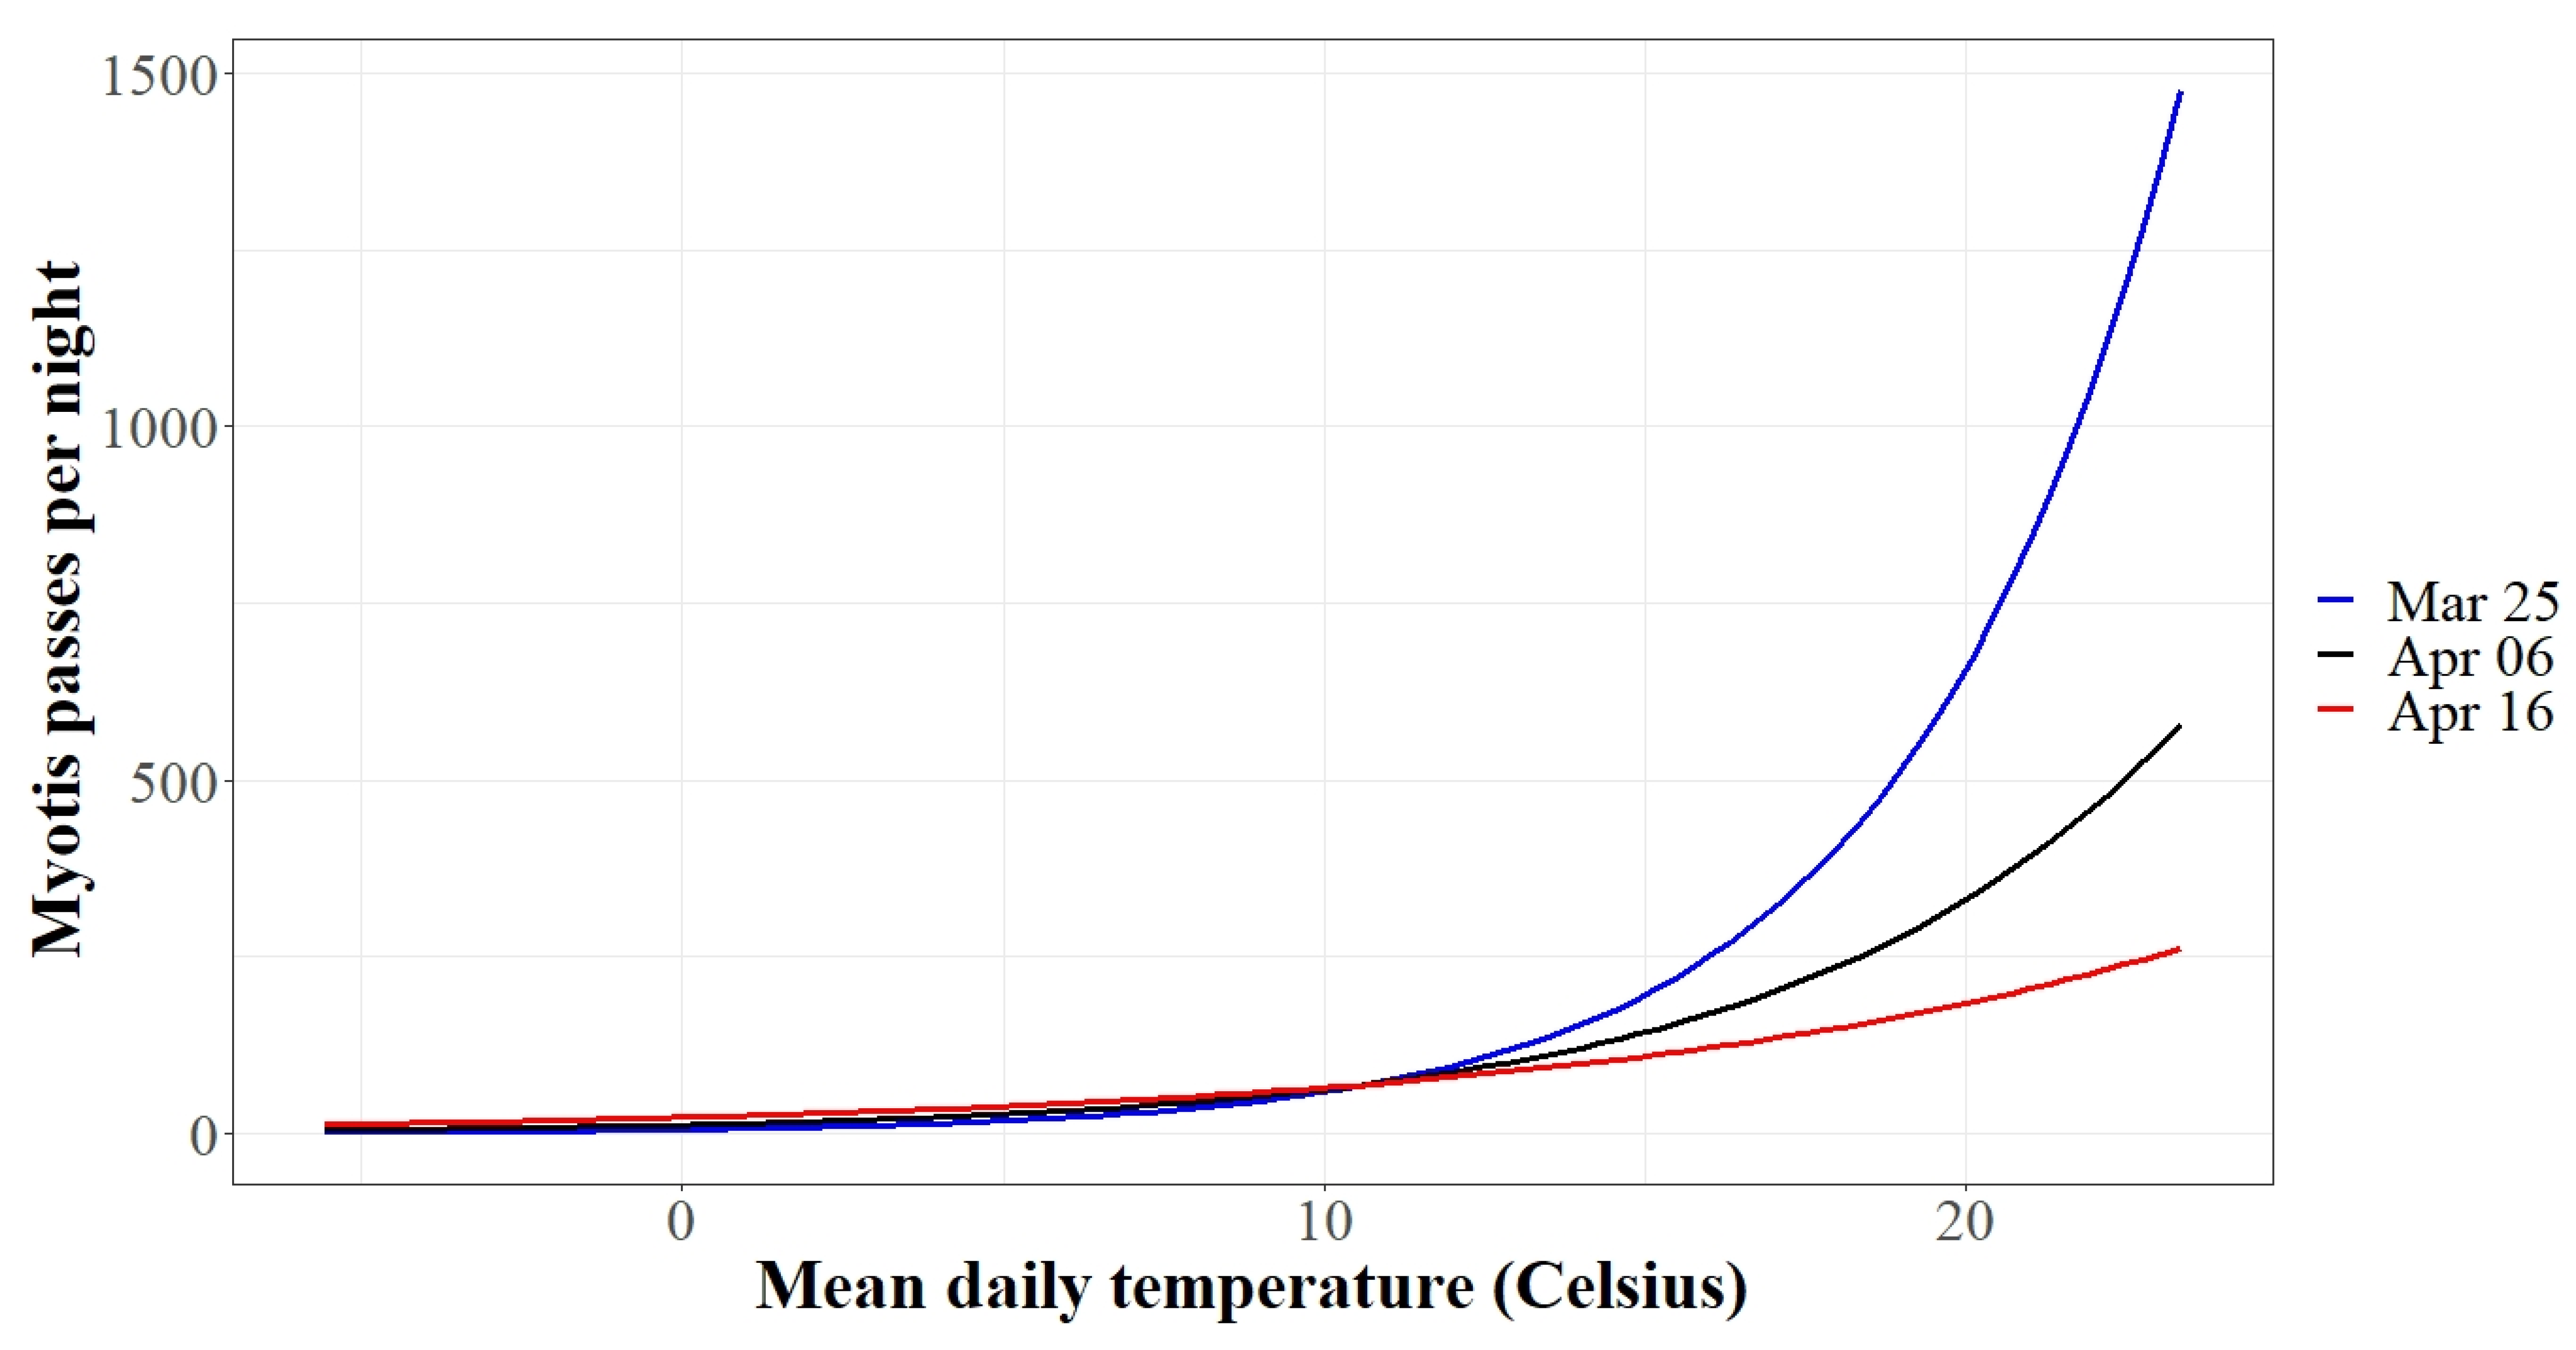
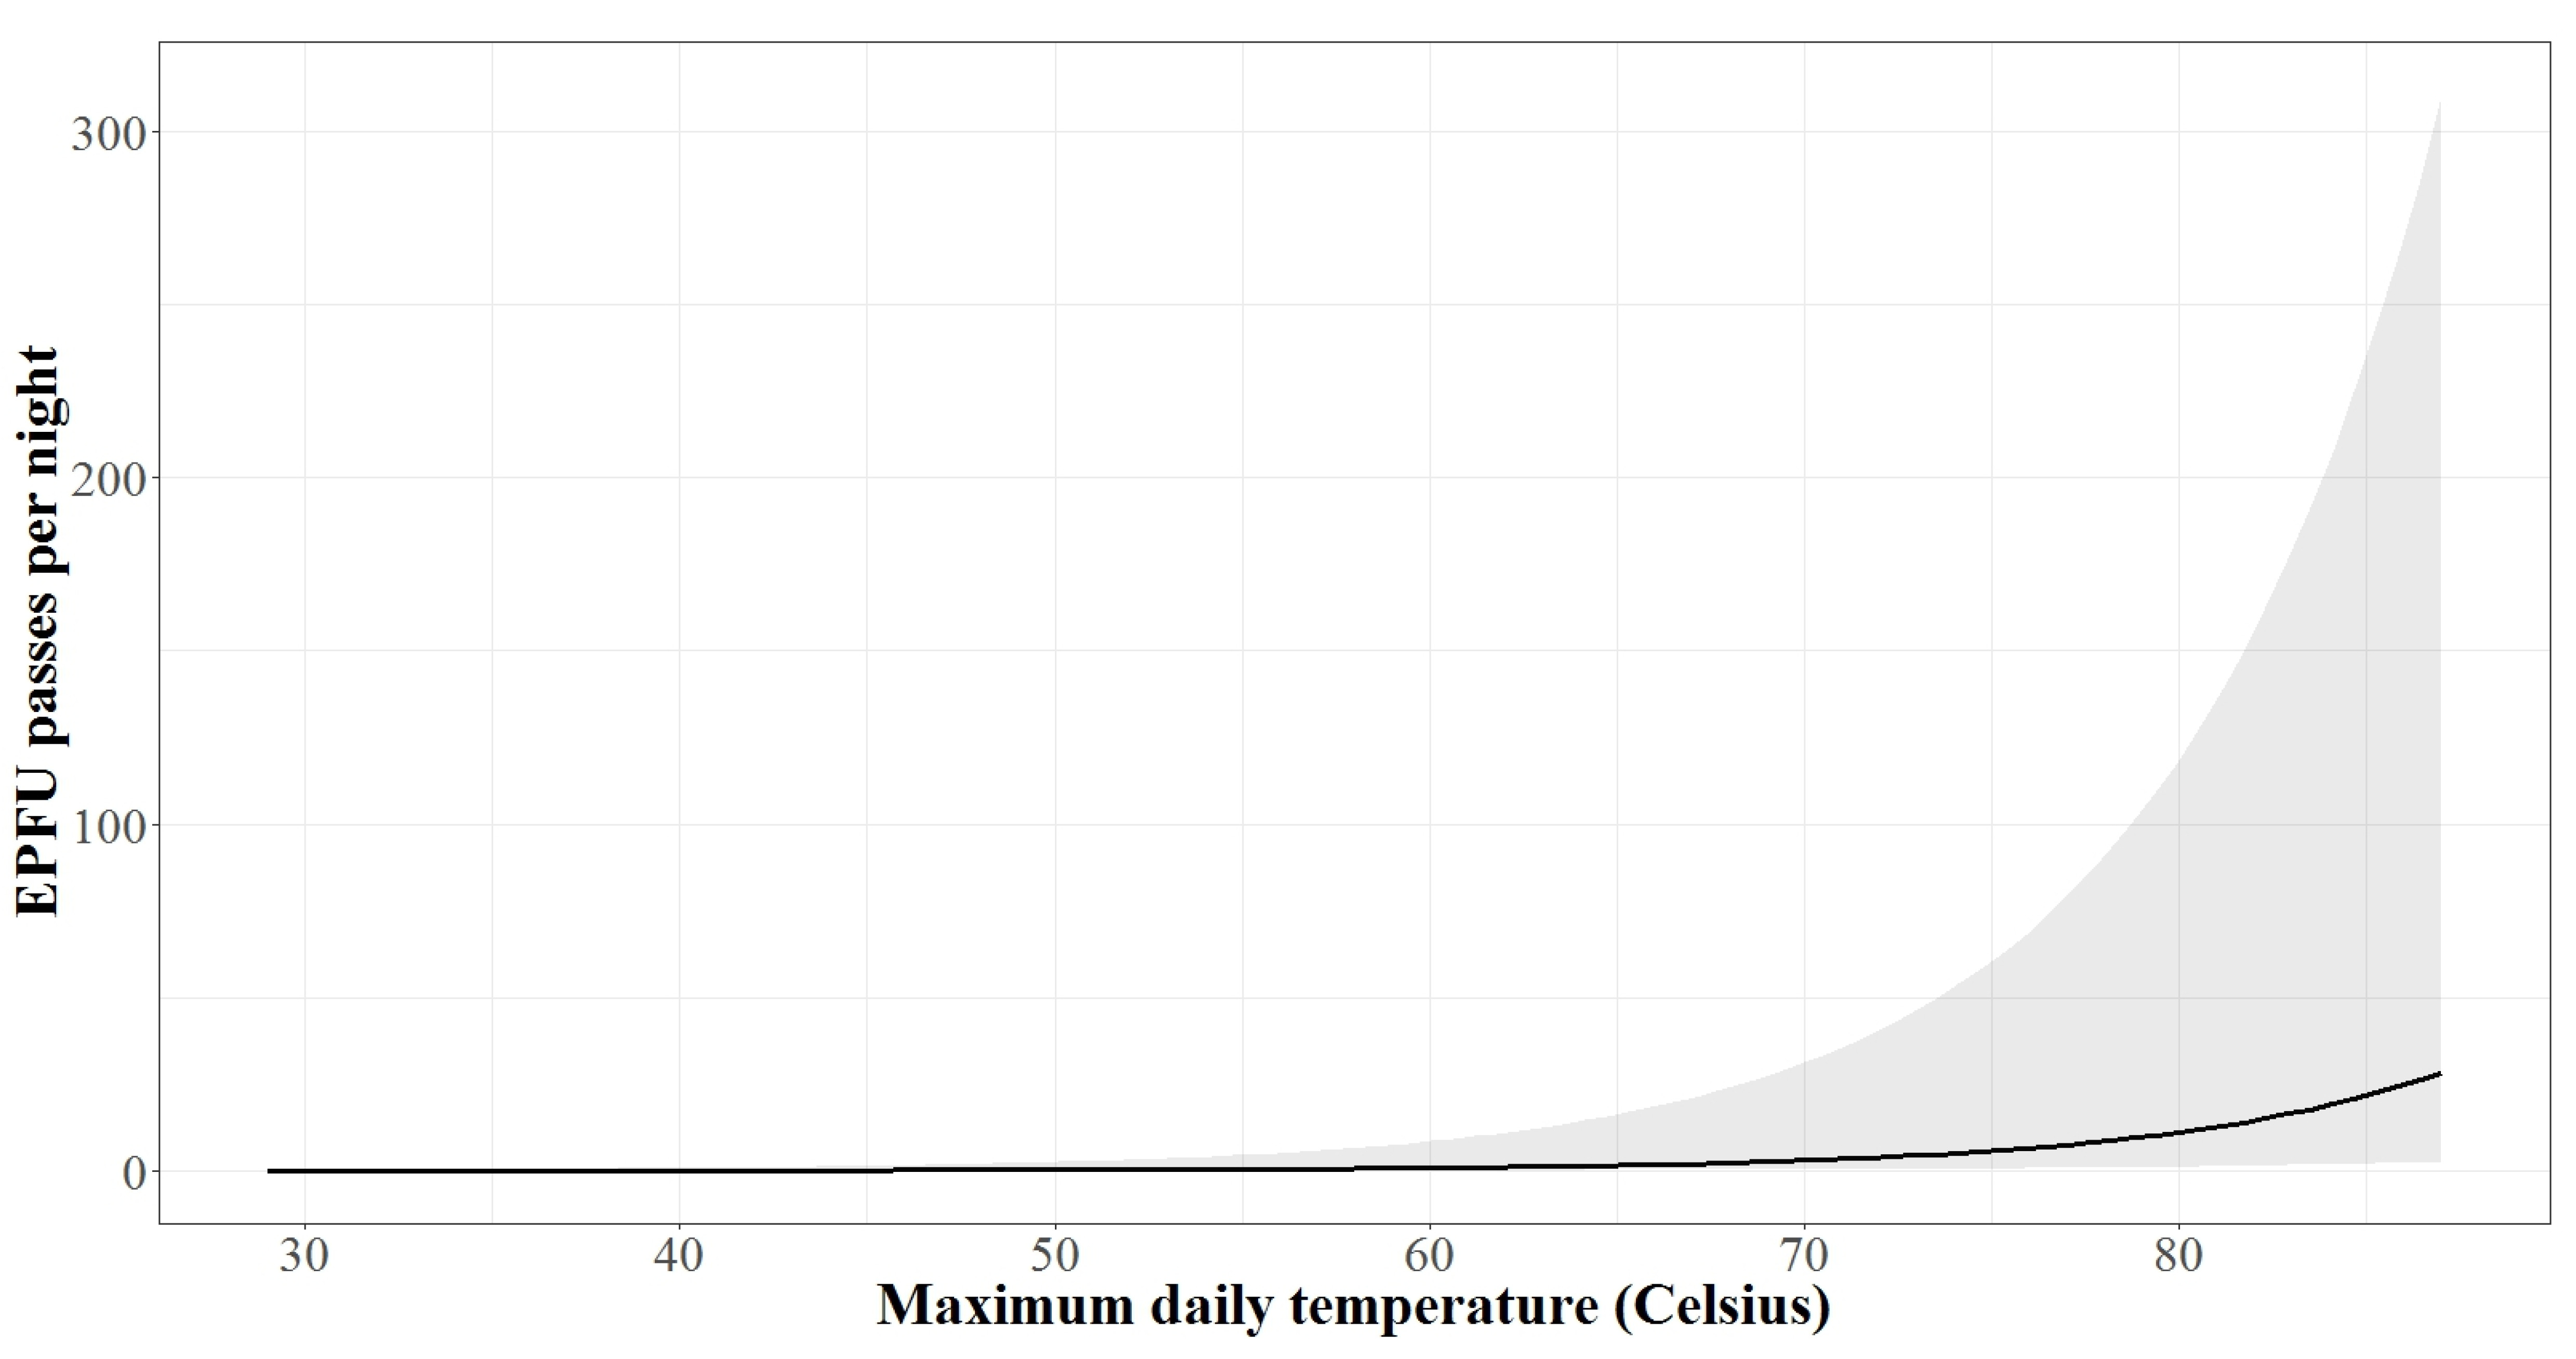
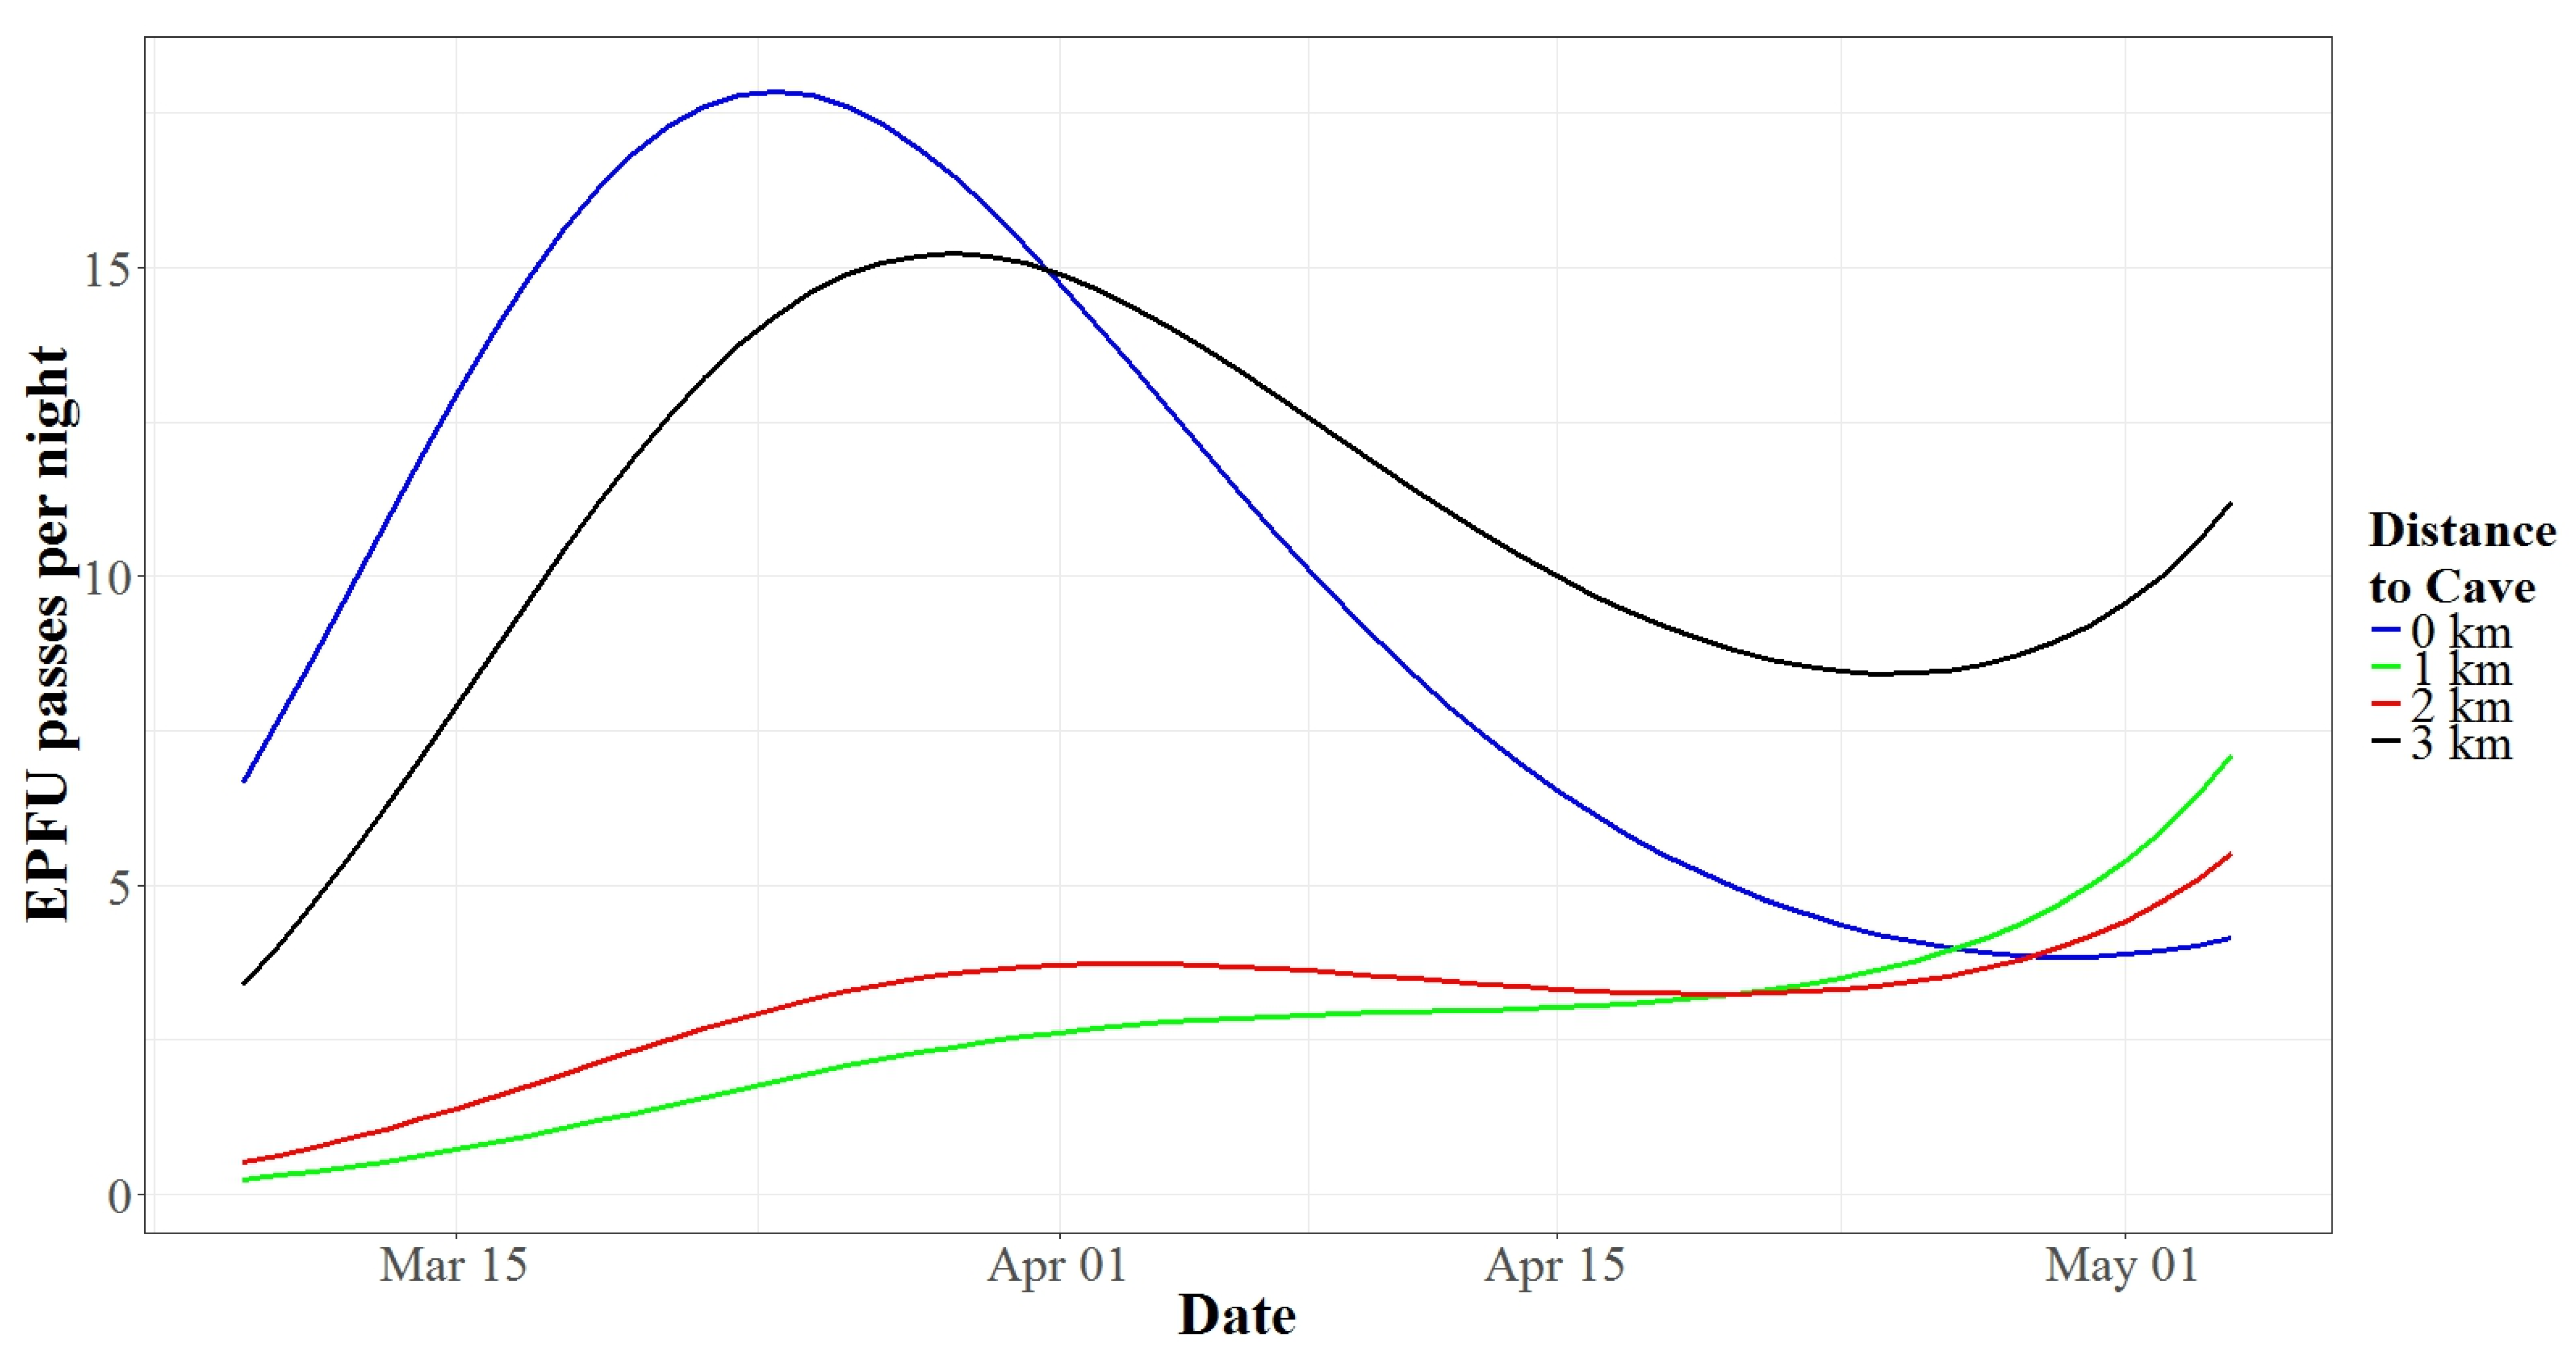
3.3. Spring Activity Patterns
4. Discussion
5. Conclusions
Supplementary Materials
Author Contributions
Funding
Acknowledgments
Conflicts of Interest
References
- Davis, W.H.; Hitchcock, H.B. Biology and migration of the bat, Myotis lucifugus, in New England. J. Mammal. 1965, 46, 296–313. [Google Scholar] [CrossRef]
- Barclay, R.M.R.; Fenton, M.B.; Thomas, D.W. Social behavior of the little brown bat, Myotis lucifugus: II. Vocal communication. Behav. Ecol. Sociobiol. 1979, 6, 137–146. [Google Scholar] [CrossRef]
- Van Schaik, J.; Janssen, R.; Bosch, T.; Haarsma, A.-J.; Dekker, J.J.A.; Kranstauber, B. Bats swarm where they hibernate: Compositional similarity between autumn swarming and winter hibernation assemblages at five underground sites. PLoS ONE 2015, 10, e0130850. [Google Scholar] [CrossRef]
- Ewing, W.G.; Studier, E.H.; O’Farrell, M.J. Autumn fat deposition and gross body composition in three species of Myotis. Comp. Biochem. Physiol. 1970, 36, 119–129. [Google Scholar] [CrossRef]
- Kunz, T.H.; Wrazen, J.A.; Burnet, C.D. Changes in body mass and fat reserves in pre-hibernating little brown bats (Myotis lucifugus). Ecoscience 1998, 5, 8–17. [Google Scholar] [CrossRef]
- Jonasson, K.A.; Willis, C.K.R. Changes in body condition of hibernating bats support the thrifty female hypothesis and predict consequences for populations with White-Nose Syndrome. PLoS ONE 2011, 6, e21061. [Google Scholar] [CrossRef]
- Reeder, D.M.; Frank, C.L.; Turner, G.G.; Meteyer, C.U.; Kurta, A.; Britzke, E.R.; Vodzak, M.E.; Darling, S.R.; Stihler, C.W.; Hicks, A.C.; et al. Frequent arousal from hibernation linked to severity of infection and mortality in bats with White-Nose Syndrome. PLoS ONE 2012, 7, e38920. [Google Scholar] [CrossRef]
- Blehert, D.S.; Hicks, A.C.; Behr, M.; Meteyer, C.U.; Berlowski-Zier, B.M.; Buckles, E.L.; Coleman, J.T.H.; Darling, S.R.; Gargas, A.; Niver, R.; et al. Bat white-nose syndrome: An emerging fungal pathogen? Science 2009, 323, 227. [Google Scholar] [CrossRef]
- Frick, W.F.; Puechmaille, S.J.; Willis, C.K.R. White-Nose Syndrome in bats. In Bats in the Anthropocene: Conservation of Bats in a Changing World; Voigt, C.C., Kingston, T., Eds.; Springer International AG: Cham, Switzerland, 2016; pp. 245–259. [Google Scholar]
- Rivers, N.M.; Butlin, R.K.; Altringham, J.D. Genetic population structure of Natterer’s bats explained by mating at swarming sites and philopatry. Mol. Ecol. 2005, 14, 4299–4312. [Google Scholar] [CrossRef]
- Schowalter, D.B. Swarming, reproduction, and early hibernation of Myotis lucifugus and M. volans in Alberta, Canada. J. Mammal. 1980, 61, 350–354. [Google Scholar] [CrossRef]
- Lowe, A.J. Swarming Behaviour and Fall Roost-Use of Little Brown (Myotis lucifugus), and Northern Long-Eared Bats (Myotis septentrionalis) in Nova Scotia, Canada. Master’s Thesis, Saint Mary’s University, Halifax, NS, Canada, 2012. [Google Scholar]
- Burns, L.E.; Broders, H.G. Maximizing mating opportunities: Higher autumn swarming activity in male versus female Myotis bats. J. Mammal. 2015, 96, 1326–1336. [Google Scholar] [CrossRef]
- Brack, V. Autumn activity of Myotis sodalis (Indiana Bat) in Bland County, Virginia. Northeast. Nat. 2006, 13, 421–434. [Google Scholar] [CrossRef]
- Endangered Species Act of 1973, Pub. L. No. 93-205, 87 Stat. 884. Available online: https://www.fws.gov/endangered/esa-library/pdf/ESAall.pdf (accessed on 10 May 2018).
- Caire, W.; LaVal, R.K.; LaVal, M.L.; Clawson, R. Notes on the ecology of Myotis keenii (Chiroptera, Vespertilionidae) in eastern Missouri. Am. Midl. Nat. 1979, 102, 404–407. [Google Scholar] [CrossRef]
- Whitaker, J.O.; Hamilton, W.J. Mammals of the Eastern United States; Cornell University Press: Ithaca, NY, USA, 1998; p. 585. [Google Scholar]
- Britzke, E.R.; Hicks, A.C.; Von Oettingen, S.L.; Darling, S.R. Description of spring roost trees used by female Indiana bats (Myotis sodalis) in the Lake Champlain Valley of Vermont and New York. Am. Midl. Nat. 2006, 155, 181–187. [Google Scholar] [CrossRef]
- Meyer, G.A.; Senulis, J.A.; Reinartz, J.A. Effects of temperature and availability of insect prey on bat emergence from hibernation in spring. J. Mammal. 2016, 97, 1623–1633. [Google Scholar] [CrossRef] [Green Version]
- Kurta, A.; Murray, S.W. Philopatry and migration of banded Indiana bats (Myotis sodalis) and effects of radio transmitters. J. Mammal. 2002, 83, 585–589. [Google Scholar] [CrossRef]
- Pettit, J.L.; O’Keefe, J.M. Day of year, temperature, wind, and precipitation predict timing of bat migration. J. Mammal. 2017, 98, 1236–1248. [Google Scholar] [CrossRef]
- USFWS. Indiana Bat (Myotis sodalis) Draft Recovery Plan: First Revision; Final Report of the U.S. Fish and Wildlife Service: Fort Snelling, MN, USA, 2007.
- Williams, C.B. An analysis of four years captures of insects in a light trap. Part II. The effect of weather conditions on insect activity; and the estimation and forecasting of changes in the insect population. Trans. R. Entomol. Soc. Lond. 1940, 90, 227–306. [Google Scholar] [CrossRef]
- Czenze, Z.J.; Willis, C.K.R. Warming up and shipping out: Arousal and emergence timing in hibernating little brown bats (Myotis lucifugus). J. Comp. Physiol. B 2015, 185, 575–586. [Google Scholar] [CrossRef]
- Norquay, K.J.O.; Willis, C.K.R. Hibernation phenology of Myotis lucifugus. J. Zool. 2014, 294, 85–92. [Google Scholar] [CrossRef]
- Francl, K.E.; Ford, W.M.; Sparks, D.W.; Brack, V. Capture and reproductive trends in summer bat communities in West Virginia: Assessing the impact of White-Nose Syndrome. J. Fish. Wildl. Manag. 2012, 3, 33–42. [Google Scholar] [CrossRef]
- USFWS. Range-Wide Indiana Bat Protection and Enhancement Plan Guidelines; Final Report to the U.S. Fish and Wildlife Service: Fort Snelling, MN, USA, 2009.
- Bernard, R.F.; McCracken, G.F. Winter behavior of bats and the progression of white-nose syndrome in the southeastern United States. Ecol. Evol. 2017, 7, 1487–1496. [Google Scholar] [CrossRef]
- Powers, K.E.; Richard, J.R.; Orndorff, W.; Ford, W.M.; Hobson, C.S. Post-White-nose Syndrome trends in Virginias cave bats, 2008–2013. J. Ecol. Nat. Environ. 2015, 7, 113–123. [Google Scholar]
- Reynolds, R.J.; Powers, K.E.; Orndorff, W.; Ford, W.M.; Hobson, C.S. Changes in rates of capture and demographics of Myotis septentrionalis (Northern Long-eared Bat) in Western Virginia before and after onset of White-nose Syndrome. Northeast. Nat. 2016, 23, 195–204. [Google Scholar] [CrossRef]
- Ford, W.M.; Menzel, M.A.; Rodrigue, J.L.; Menzel, J.M.; Johnson, J.B. Relating bat species presence to simple habitat measures in a central Appalachian forest. Biol. Conserv. 2005, 126, 528–539. [Google Scholar] [CrossRef]
- Caceres, M.C.; Barclay, R.M.R. Myotis septentrionalis. Mamm. Species 2000, 2000, 1–4. [Google Scholar] [CrossRef]
- Nocera, T. Assessing the Long-Term Impacts of White-Nose Syndrome on Bat Communities Using Acoustic Surveys at Fort Drum Military Installation. Master’s Thesis, Virginia Polytechnic Institute and State University, Blacksburg, VA, USA, 2018; p. 150. [Google Scholar]
- Niver, R.A.; King, R.A.; Armstrong, M.P.; Ford, W.M. Methods to evaluate and develop minimum recommended summer survey effort for Indiana bats: White Paper. U.S. Fish Wildl. Serv. White Pap. 2014, 13. [Google Scholar] [CrossRef]
- Johnson, J.B.; Rodrigue, J.L.; Ford, W.M. Nightly and yearly bat activity before and after white-nose syndrome on the Fernow Experimental Forest in West Virginia, Tucker County, USA. USDA For. Serv. North. Res. Stn. Res. Pap. NRS-Res. Pap. 2012, 24, 1–17. [Google Scholar]
- Wei, T.; Simko, V. Corrplot: Visualization of a Correlation Matrix. 2016. Available online: https://cran.r-project.org/web/packages/corrplot/index.html (accessed on 24 August 2017).
- R Core Team. R: A Language and Environment for Statistical Computing; R Foundation for Statistical Computing: Vienna, Austria, 2017. [Google Scholar]
- Pinheiro, J.; Bates, D.; DebRoy, S.; Sarkar, D.; Heisterkamp, S. nlme: Linear and Nonlinear Mixed Effects Models. 2017. Available online: https://cran.r-project.org/web/packages/nlme/index.html (accessed on 26 September 2017).
- Fournier, D.A.; Skaug, H.J.; Ancheta, J.; Ianelli, J.; Magnusson, A.; Maunder, M.N.; Nielsen, A.; Sibert, J. AD Model Builder: Using automatic differentiation for statistical inference of highly parameterized complex nonlinear models. Optim. Methods Softw. 2012, 27, 233–249. [Google Scholar] [CrossRef]
- Bartoń, K.A. Package “MuMIn”|Multi-Model Inference. 2015. Available online: https://www.rdocumentation.org/packages/MuMIn/versions/1.15.6/topics/MuMIn-package (accessed on 12 September 2017).
- Burnham, K.P.; Anderson, D.R. Model Selection and Multimodel Inference: A Practical Information-Theoretic Approach; Springer: New York, NY, USA, 2002; p. 488. [Google Scholar]
- Schielzeth, H. Simple means to improve the interpretability of regression coefficients. Methods Ecol. Evol. 2010, 1, 103–113. [Google Scholar] [CrossRef]
- Kunz, T.H. Ecology of Bats; Springer Science and Business Media: Boston, MA, USA, 2013; p. 450. [Google Scholar]
- Frank, C.L.; Michalski, A.; McDonough, A.A.; Rahimian, M.; Rudd, R.J.; Herzog, C. The resistance of a North American bat species (Eptesicus fuscus) to White-Nose Syndrome (WNS). PLoS ONE 2014, 9, e113958. [Google Scholar] [CrossRef]
- Aldridge, H.D.J.N.; Rautenbach, I.L. Morphology, echolocation and resource partitioning in insectivorous bats. J. Anim. Ecol. 1987, 56, 763–778. [Google Scholar] [CrossRef]
- Bergeson, S.M.; Carter, T.C.; Whitby, M.D. Partitioning of foraging resources between sympatric Indiana and little brown bats. J. Mammal. 2013, 94, 1311–1320. [Google Scholar] [CrossRef] [Green Version]
- Jachowski, D.S.; Dobony, C.A.; Coleman, L.S.; Ford, W.M.; Britzke, E.R.; Rodrigue, J.L. Disease and community structure: White-nose syndrome alters spatial and temporal niche partitioning in sympatric bat species. Divers. Distrib. 2014, 20, 1002–1015. [Google Scholar] [CrossRef]
- Parsons, K.N.; Jones, G.; Greenaway, F. Swarming activity of temperate zone micro-chiropteran bats: Effects of season, time of night and weather conditions. J. Zool. 2003, 261, 257–264. [Google Scholar] [CrossRef]
- Bender, M.J.; Hartman, G.D. Bat activity increases with barometric pressure and temperature during autumn in central Georgia. Southeast. Nat. 2015, 14, 231–242. [Google Scholar] [CrossRef]
- Klüg-Baerwald, B.J.; Gower, L.E.; Lausen, C.; Brigham, R.M. Environmental correlates and energetics of winter flight by bats in Southern Alberta, Canada. Can. J. Zool. 2016, 94, 829–836. [Google Scholar] [CrossRef]
- Whitaker, J.O., Jr.; Gummer, S.L. Hibernation of the big brown bat, Eptesicus fuscus, in buildings. J. Mammal. 1992, 73, 312–316. [Google Scholar] [CrossRef]
- Brigham, R.M. Flexibility in foraging and roosting behaviour by the big brown bat (Eptesicus fuscus). Can. J. Zool. 1991, 69, 117–121. [Google Scholar] [CrossRef]
- Silvis, A.; Perr, R.W.; Ford, W.M. Relationships of three species of White-nose Syndrome-impacted bats to forest condition and management. USDA For. Serv. Southern Res. Stn. Gen. Tech. Rep. 2016, 214, 1–57. [Google Scholar]
- Brack, V.; Reynolds, R.; Orndorff, W.; Zokaites, J.; Zokaites, C. Bats of Skydusky Hollow, Bland County, Virginia. Va. J. Sci. 2005, 56, 93–106. [Google Scholar]
- Weishampel, J.; Hightower, J.; Chase, A.; Chase, D.; Patrick, R. Detection and morphologic analysis of potential below-canopy cave openings in the karst landscape around the Maya polity of Caracol using airborne Lidar. J. Cave Karst Stud. 2011, 73, 187–196. [Google Scholar] [CrossRef]
- Hall, J.S. A life history and taxonomic study of the Indiana bat, Myotis sodalis. Read. Pub. Mus. Art Gallery Sci. Pub. 1962, 12, 1–68. [Google Scholar]
- Langwig, K.E.; Frick, W.F.; Reynolds, R.; Parise, K.L.; Drees, K.P.; Hoyt, J.R.; Cheng, T.L.; Kunz, T.H.; Foster, J.T.; Kilpatrick, A.M. Host and pathogen ecology drive the seasonal dynamics of a fungal disease, white-nose syndrome. Proc. R. Soc. B Biol. Sci. 2015, 282, 20142335. [Google Scholar] [CrossRef]
- Frick, W.F.; Stepanian, P.M.; Kelly, J.F.; Howard, K.W.; Kuster, C.M.; Kunz, T.H.; Chilson, P.B. Climate and weather impact timing of emergence of bats. PLoS ONE 2012, 7, e42737. [Google Scholar] [CrossRef]
- Speakman, J.R.; Rowland, A. Preparing for inactivity: How insectivorous bats deposit a fat store for hibernation. Proc. Nutrit. Soc. 1999, 58, 123–131. [Google Scholar] [CrossRef]
- LaVal, R.K.; Clawson, R.L.; LaVal, M.L.; Caire, W. Foraging behavior and nocturnal activity patterns of Missouri bats, with emphasis on the endangered species Myotis grisescens and Myotis sodalis. J. Mammal. 1977, 58, 592–599. [Google Scholar] [CrossRef]
- Cope, J.B.; Humphrey, S.R. Spring and autumn swarming behavior in the Indiana Bat, Myotis sodalis. J. Mammal. 1977, 58, 93–95. [Google Scholar] [CrossRef]
- Hamilton, I.M.; Barclay, R.M.R. Patterns of daily torpor and day-roost selection by male and female big brown bats (Eptesicus fuscus). Can. J. Zool. 1994, 72, 744–749. [Google Scholar] [CrossRef]
- Callahan, E.V.; Drobney, R.D.; Clawson, R.L. Selection of summer roosting sites by Indiana bats (Myotis sodalis) in Missouri. J. Mammal. 1997, 78, 818–825. [Google Scholar] [CrossRef]
- Ford, W.M.; Chapman, B.R. Indiana Myotis, Myotis sodalis. In The Land Managers Guide to Mammals of the South; Trani-Griep, M., Ford, W.M., Chapman, B.R., Eds.; The Nature Conservancy: Durham, NC, USA, 2007; pp. 205–211. [Google Scholar]
- USFWS. Indiana Bat Range Map and Recovery Units; U.S. Fish and Wildlife Service: Fort Snelling, MN, USA, 2015.
- USFWS. Northern Long-Eared Bat Range Maps; U.S. Fish and Wildlife Service: Fort Snelling, MN, USA, 2017.


| Variable | Explanation |
|---|---|
| Date | date |
| Year | sampling year |
| Avg. Temp | mean daily temperature |
| Max. Temp | maximum daily temperature |
| Min. Temp | minimum daily temperature |
| Δ Avg. Temp | change in mean daily temperature from previous day |
| Δ Max. Temp | change in maximum daily temperature from previous day |
| Δ Min. Temp | change in minimum daily temperature from previous day |
| Max Wind | maximum daily wind speed |
| Avg. Wind | mean daily wind speed |
| Δ Max. Wind | change in maximum daily wind speed from previous day |
| Δ Mean. Wind | change in mean daily wind speed from previous day |
| Binary Precipitation | binary precipitation |
| Δ Binary Precipitation | change in binary precipitation from previous day |
| Cave Proximity | at cave or distance from cave along radii |
| Variable | β | Lower CI | Upper CI |
|---|---|---|---|
| (Intercept) | 3.848 | 2.046 | 5.651 |
| Date | −0.810 | −0.958 | −0.661 |
| Date2 | −0.057 | −0.186 | 0.072 |
| Year 2016 | −0.516 | −0.717 | −0.316 |
| Avg. Temp | 0.493 | 0.336 | 0.650 |
| Δ Avg. Temp | −0.204 | −0.300 | −0.107 |
| Avg. Wind | −0.143 | −0.305 | 0.020 |
| Δ Mean. Wind | −0.143 | −0.265 | −0.022 |
| Δ Binary Precipitation | −0.302 | −0.489 | −0.116 |
| Distal Sites | −3.095 | −4.609 | −1.582 |
| Date*Avg. Temp | 0.466 | 0.315 | 0.616 |
| Variable | β | Lower CI | Upper CI |
|---|---|---|---|
| (Intercept) | 3.881 | 2.068 | 5.694 |
| Date | −0.661 | −0.927 | −0.394 |
| Date2 | −0.061 | −0.190 | 0.068 |
| Year 2016 | −0.519 | −0.720 | −0.318 |
| Avg. Temp | 0.499 | 0.341 | 0.657 |
| Δ Avg. Temp | −0.205 | −0.302 | −0.107 |
| Avg. Wind | −0.144 | −0.306 | 0.019 |
| Δ Mean. Wind | −0.141 | −0.263 | −0.020 |
| Δ Binary Precipitation | −0.303 | −0.490 | −0.117 |
| Distal Sites | −3.129 | −4.647 | −1.610 |
| Date*Avg. Temp | 0.477 | 0.325 | 0.630 |
| Date*Cave Proximity | −0.181 | −0.451 | 0.088 |
| Variable | k | AIC | AICc | ΔAICc | wi | ERi |
|---|---|---|---|---|---|---|
| Date + Date2 + Date3 + Date4 + year + Max. Temp + Δ Max. Temp + Max Wind + Δ Max. Wind + Binary Precipitation + Δ Binary Precipitation | 12.0 | 3699.4 | 3699.6 | 0.0 | 0.5 | 1.0 |
| Date + Date2 + Date3 + Date4 + year +Date*Max. Temp + Min. Temp + Δ Max. Temp + Δ Min. Temp + Max Wind + Δ Max. Wind + Binary Precipitation + Δ Binary Precipitation + Cave Proximity | 16.0 | 3700.5 | 3700.9 | 1.3 | 0.2 | 1.9 |
| Date + Date2 + Date3 + Date4 + year + Max. Temp + Δ Max. Temp + Max Wind + Δ Max. Wind + Binary Precipitation + Δ Binary Precipitation + Cave Proximity | 13.0 | 3701.0 | 3701.2 | 1.6 | 0.2 | 2.3 |
| Variable | β | Lower CI | Upper CI |
|---|---|---|---|
| (Intercept) | −1.298 | −2.049 | −0.547 |
| Date | 0.071 | −0.222 | 0.364 |
| Date2 | 0.139 | −0.257 | 0.534 |
| Date3 | −0.114 | −0.243 | 0.016 |
| Date4 | −0.056 | −0.182 | 0.070 |
| Year 2016 | −0.038 | −0.340 | 0.264 |
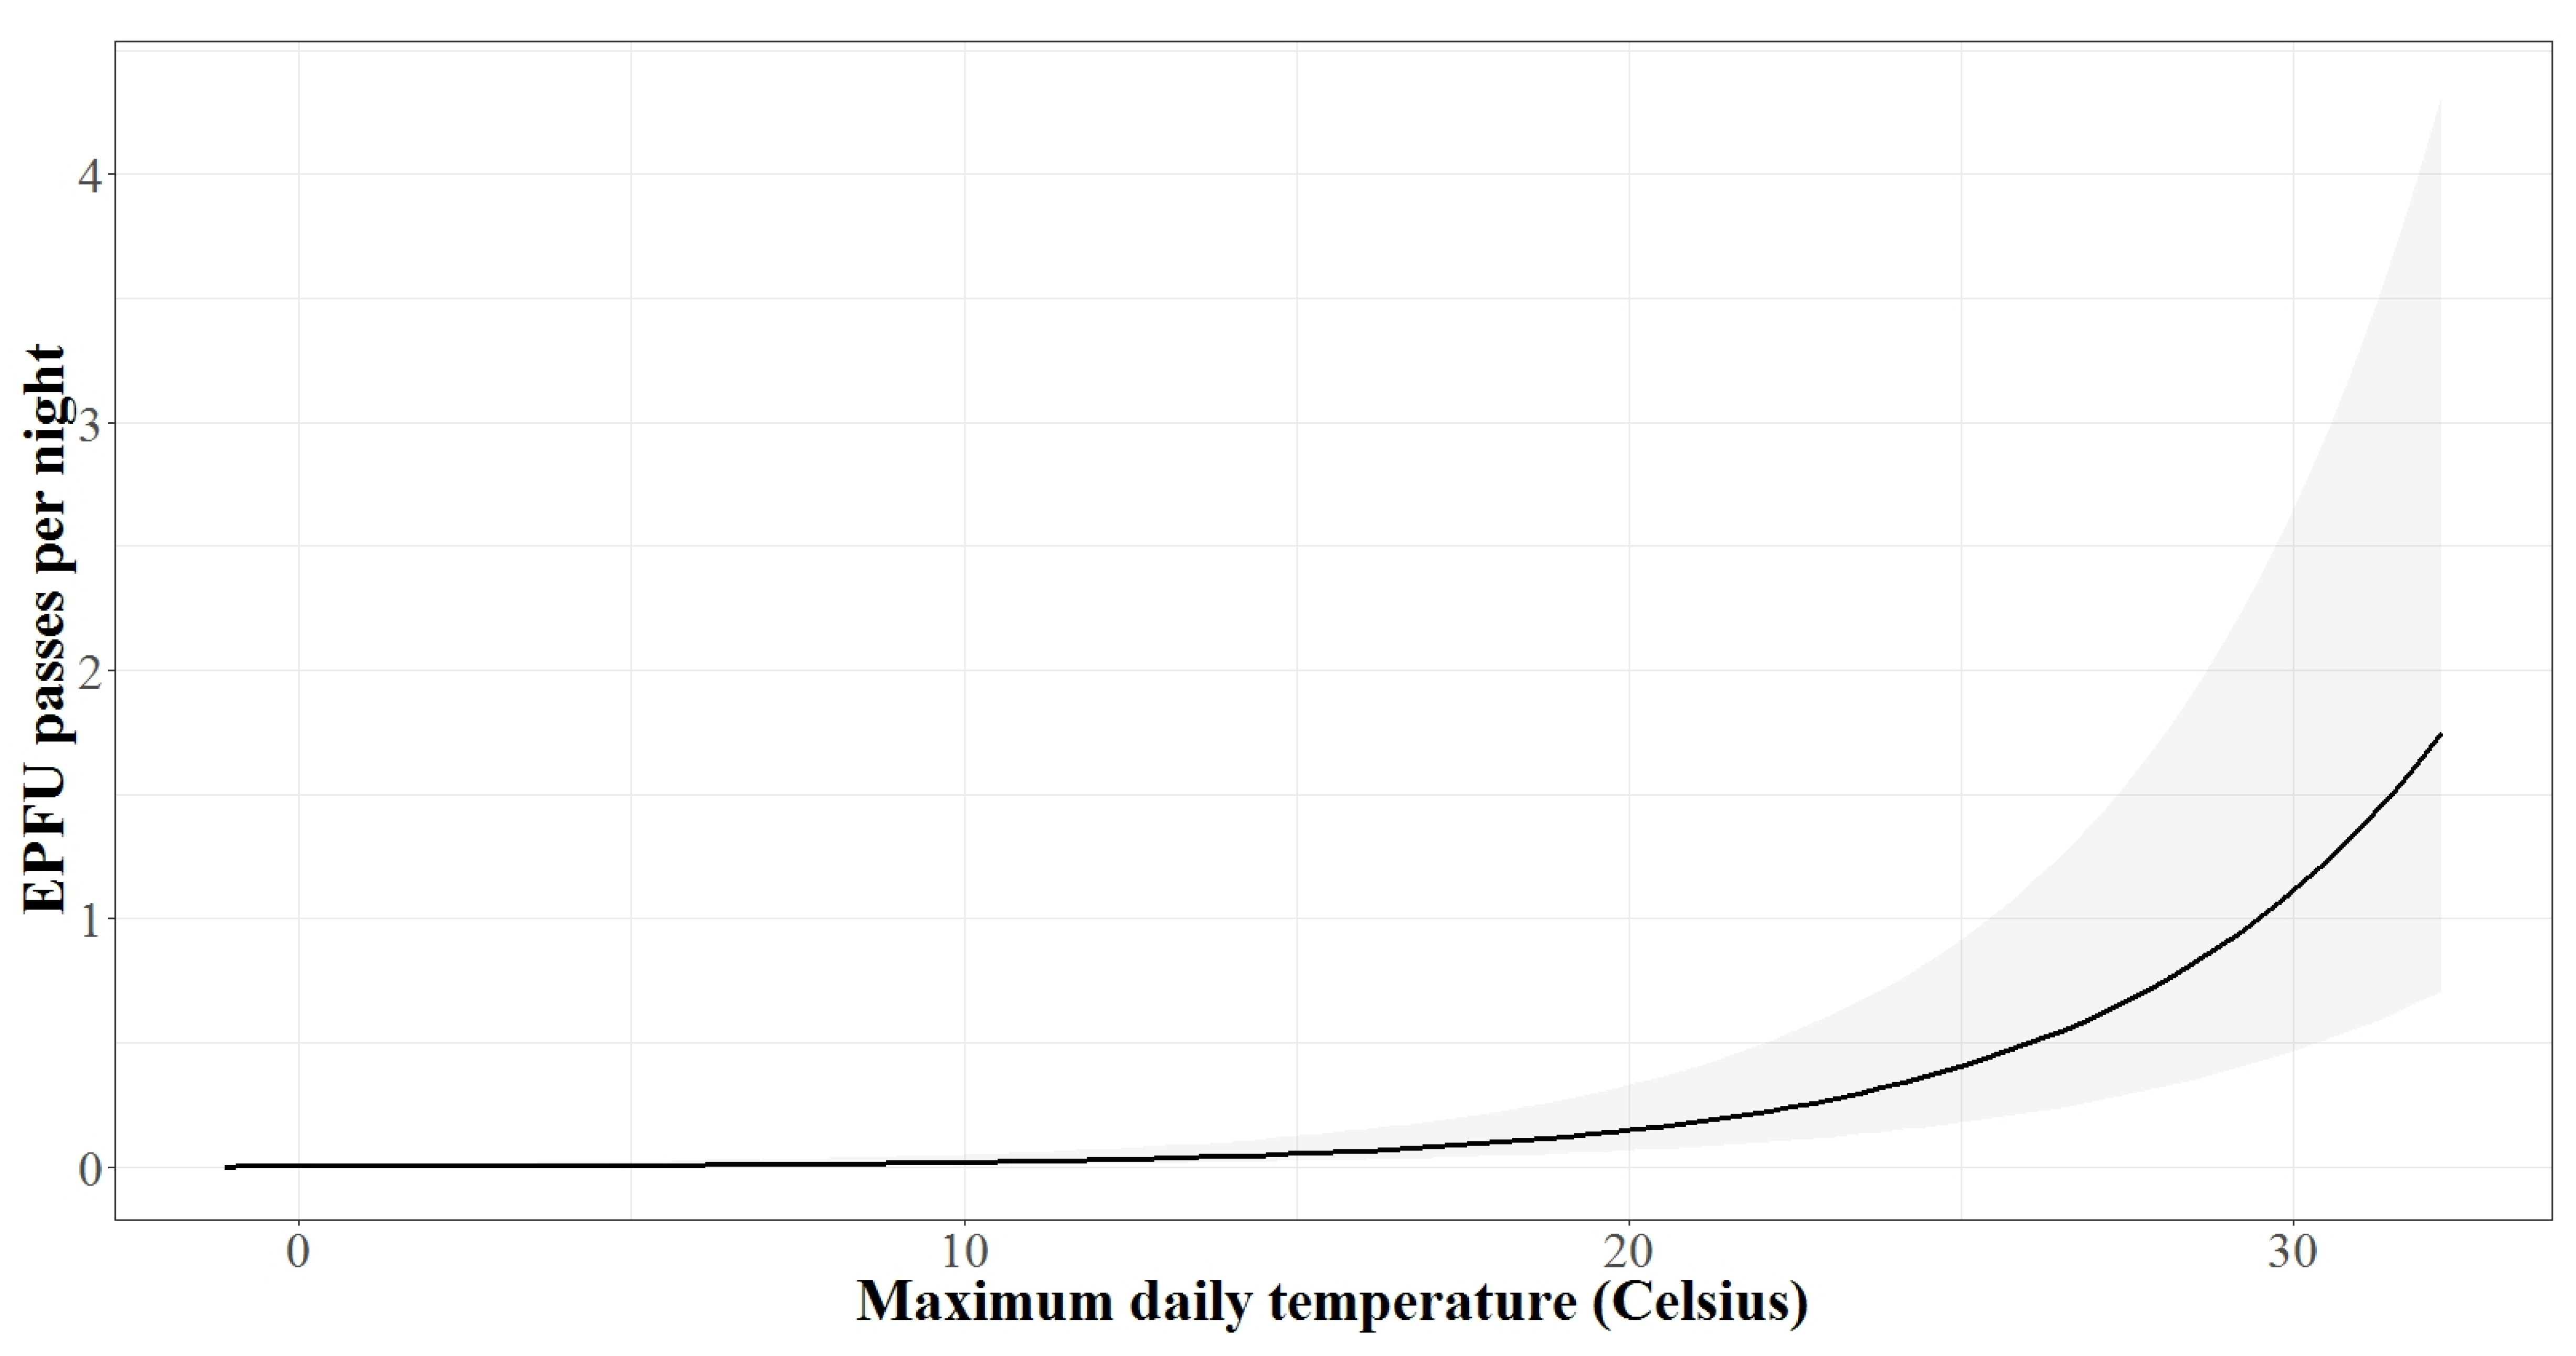
| Max. Temp | 1.222 | 0.983 | 1.462 |
| Δ Max. Temp | 0.165 | 0.012 | 0.318 |
| Max Wind | 0.296 | 0.109 | 0.483 |
| Δ Max. Wind | −0.068 | −0.240 | 0.104 |
| Binary Precipitation | −0.201 | −0.509 | 0.108 |
| Δ Binary Precipitation | −0.230 | −0.549 | 0.089 |
| Variable | β | Lower CI | Upper CI |
|---|---|---|---|
| (Intercept) | −0.704 | −2.541 | 1.132 |
| Date | 0.941 | 0.509 | 1.373 |
| Date2 | 0.006 | −0.378 | 0.390 |
| Date3 | −0.131 | −0.262 | 0.000 |
| Date4 | −0.028 | −0.151 | 0.094 |
| Year 2016 | 0.010 | −0.283 | 0.303 |
| Max. Temp | 1.213 | 0.977 | 1.449 |
| Δ Max. Temp | 0.140 | −0.009 | 0.290 |
| Max Wind | 0.202 | 0.018 | 0.386 |
| Δ Max. Wind | −0.094 | −0.263 | 0.075 |
| Binary Precipitation | −0.197 | −0.500 | 0.106 |
| Δ Binary Precipitation | −0.247 | −0.561 | 0.067 |
| Distance to Cave1km | −1.380 | −3.609 | 0.849 |
| Distance to Cave2km | −0.611 | −2.825 | 1.604 |
| Distance to Cave3km | −0.245 | −2.384 | 1.894 |
| Date*Distance to Cave1km | −0.821 | −1.245 | −0.397 |
| Date*Distance to Cave2km | −0.728 | −1.108 | −0.348 |
| Date*Distance to Cave3km | −1.230 | −1.610 | −0.850 |
| Variable | β | Lower CI | Upper CI |
|---|---|---|---|
| (Intercept) | 3.624 | 1.746 | 5.501 |
| Date | −0.216 | −0.442 | 0.010 |
| Date2 | −0.003 | −0.104 | 0.099 |
| Date3 | 0.243 | 0.141 | 0.345 |
| Year 2017 | −0.010 | −0.239 | 0.219 |
| Avg. Temp | 0.904 | 0.761 | 1.047 |
| Δ Avg. Temp | −0.266 | −0.373 | −0.158 |
| Avg. Wind | −0.507 | −0.670 | −0.343 |
| Δ Mean. Wind | 0.068 | −0.064 | 0.201 |
| Δ Binary Precipitation | −0.125 | −0.331 | 0.080 |
| Distal Sites | −3.384 | −5.391 | −1.377 |
| Date*Avg. Temp | −0.471 | −0.591 | −0.351 |
| Variable | β | Lower CI | Upper CI |
|---|---|---|---|
| (Intercept) | 3.629 | 1.708 | 5.549 |
| Date | −0.195 | −0.635 | 0.245 |
| Date2 | −0.194 | −0.384 | −0.005 |
| Date3 | 0.110 | −0.067 | 0.287 |
| Year 2017 | −0.070 | −0.307 | 0.168 |
| Avg. Temp | 0.891 | 0.743 | 1.039 |
| Δ Avg. Temp | −0.275 | −0.387 | -0.163 |
| Avg. Wind | −0.458 | −0.629 | -0.288 |
| Δ Mean. Wind | 0.075 | −0.061 | 0.212 |
| Δ Binary Precipitation | −0.059 | −0.269 | 0.152 |
| Distance to Cave1km | −3.462 | −5.804 | −1.120 |
| Distance to Cave2km | −4.251 | −6.620 | −1.881 |
| Distance to Cave3km | −2.754 | −5.001 | −0.507 |
| Date*Distance to Cave1km | 0.129 | −0.486 | 0.743 |
| Date*Distance to Cave2km | −0.082 | −0.735 | 0.570 |
| Date*Distance to Cave3km | 0.153 | −0.460 | 0.765 |
| Date2*Distance to Cave1km | 0.293 | 0.034 | 0.552 |
| Date2*Distance to Cave2km | 0.187 | -0.080 | 0.454 |
| Date2*Distance to Cave3km | 0.003 | -0.259 | 0.264 |
| Date3*Distance to Cave1km | −0.030 | −0.287 | 0.227 |
| Date3*Distance to Cave2km | 0.170 | −0.099 | 0.440 |
| Date3*Distance to Cave3km | −0.120 | −0.381 | 0.140 |
| Variable | β | Lower CI | Upper CI |
|---|---|---|---|
| (Intercept) | 0.040 | −2.346 | 2.427 |
| Date | −0.087 | −0.404 | 0.231 |
| Date2 | −0.213 | −0.336 | −0.089 |
| Date3 | 0.160 | 0.033 | 0.287 |
| Year 2017 | −0.440 | −0.767 | −0.114 |
| Max. Temp | 1.501 | 1.155 | 1.847 |
| Min. Temp | 0.381 | 0.104 | 0.657 |
| Δ Max. Temp | 0.008 | −0.201 | 0.217 |
| Δ Min. Temp | −0.072 | −0.223 | 0.080 |
| Max Wind | −0.122 | −0.305 | 0.062 |
| Δ Max. Wind | 0.119 | −0.068 | 0.305 |
| Binary Precipitation | −0.516 | −0.819 | −0.214 |
| Δ Binary Precipitation | −0.079 | −0.383 | 0.225 |
| Distal Sites | −0.654 | −3.184 | 1.876 |
| Date*Max. Temp | −0.077 | −0.269 | 0.115 |
| Variable | β | Lower CI | Upper CI |
|---|---|---|---|
| (Intercept) | 0.048 | −2.212 | 2.308 |
| Date | −0.633 | −1.016 | −0.249 |
| Date2 | −0.220 | −0.343 | −0.098 |
| Date3 | 0.185 | 0.060 | 0.311 |
| Year 2017 | −0.447 | −0.773 | −0.122 |
| Max. Temp | 1.535 | 1.191 | 1.878 |
| Min. Temp | 0.398 | 0.116 | 0.679 |
| Δ Min. Temp | −0.058 | −0.212 | 0.095 |
| Δ Max. Temp | 0.001 | −0.209 | 0.211 |
| Max Wind | −0.075 | −0.259 | 0.110 |
| Δ Max. Wind | 0.150 | −0.033 | 0.334 |
| Binary Precipitation | −0.536 | −0.837 | −0.236 |
| Δ Binary Precipitation | −0.104 | −0.406 | 0.198 |
| Distance to Cave1km | −1.418 | −4.138 | 1.302 |
| Distance to Cave2km | −1.152 | −3.874 | 1.570 |
| Distance to Cave3km | 0.143 | −2.459 | 2.746 |
| Date*Distance to Cave1km | 0.979 | 0.597 | 1.361 |
| Date*Distance to Cave2km | 0.718 | 0.358 | 1.079 |
| Date*Distance to Cave3km | 0.424 | 0.079 | 0.770 |
| Date*Max. Temp | −0.122 | −0.312 | 0.068 |
© 2019 by the authors. Licensee MDPI, Basel, Switzerland. This article is an open access article distributed under the terms and conditions of the Creative Commons Attribution (CC BY) license (http://creativecommons.org/licenses/by/4.0/).
Share and Cite
Muthersbaugh, M.S.; Ford, W.M.; Silvis, A.; Powers, K.E. Activity Patterns of Cave-Dwelling Bat Species during Pre-Hibernation Swarming and Post-Hibernation Emergence in the Central Appalachians. Diversity 2019, 11, 159. https://doi.org/10.3390/d11090159
Muthersbaugh MS, Ford WM, Silvis A, Powers KE. Activity Patterns of Cave-Dwelling Bat Species during Pre-Hibernation Swarming and Post-Hibernation Emergence in the Central Appalachians. Diversity. 2019; 11(9):159. https://doi.org/10.3390/d11090159
Chicago/Turabian StyleMuthersbaugh, Michael S., W. Mark Ford, Alexander Silvis, and Karen E. Powers. 2019. "Activity Patterns of Cave-Dwelling Bat Species during Pre-Hibernation Swarming and Post-Hibernation Emergence in the Central Appalachians" Diversity 11, no. 9: 159. https://doi.org/10.3390/d11090159
APA StyleMuthersbaugh, M. S., Ford, W. M., Silvis, A., & Powers, K. E. (2019). Activity Patterns of Cave-Dwelling Bat Species during Pre-Hibernation Swarming and Post-Hibernation Emergence in the Central Appalachians. Diversity, 11(9), 159. https://doi.org/10.3390/d11090159