Article

Effects of Land Cover Pattern Along Urban-Rural Gradient on Bird Diversity in Wetlands

1
School of Ecology and Environmental Sciences & Yunnan Key Laboratory for Plateau Mountain Ecology and Restoration of Degraded Environments, Yunnan University, Kunming 650500, China
2
Faculty of Art and Communication, Kunming University of Science and Technology, Kunming 650500, China
3
College of Agriculture and Biotechnology, Hunan University of Humanities, Science and Technology, Loudi 417000, China
4
Faculty of Electric Power Engineering, Kunming University of Science and Technology, Kunming 650500, China
*
Author to whom correspondence should be addressed.
Diversity 2019, 11(6), 86; https://doi.org/10.3390/d11060086
Submission received: 29 April 2019 / Revised: 28 May 2019 / Accepted: 29 May 2019 / Published: 31 May 2019

Abstract

:
Wetlands play an important role in the feeding, breeding, and lives of birds. However, available habitats for bird species are changing due to intensifying human activity, especially in the context of China’s mass urbanization. Urban sprawl has taken over the wetlands along the lakes in the past decades, which places tremendous pressure on wetland ecosystems and, therefore, on bird communities. However, the ways urban land cover pattern along the urban-rural gradient affects bird communities is still unclear. To investigate the influence of land cover pattern on the α and β diversity of birds in the urban-rural gradient we chose 31 sites distributed within the wetlands around the Dianchi Lake in Yunnan, China. We calculated the species richness to indicate α diversity and used the Morisita–Horn index to indicate β diversity. Meanwhile, we assessed the land cover pattern of each site by measuring the proportion of emergent plants, floating plants, submerged plants, ponds, forests, lawns, roads, agricultural lands and built lands in a quadrat of 1 square kilometer. Simple linear regressions, model selection, and an averaging approach based on corrected Akaike information criterion (AICc) were used to test the effects of land cover pattern on bird diversity. Using one-way ANOVA and Tukey’s HSD (honestly significant difference) test, we compared the difference between α and β diversity, respectively, along the urban-rural gradient. Based on our analyses, urban and suburban wetland birds were significantly homogeneous. The community structure in rural wetlands, however, was significantly different from that of the suburban and urban areas. According to our research, the land cover patterns that influenced bird species richness were the built lands acreage, submerged plants acreage, ponds acreage, and the edge density of emergent plants. Meanwhile, of these variables, the built lands acreage, ponds acreage and edge density of emergent plants were significantly different in urban, suburban, and rural wetlands. Therefore, to maintain high biodiversity in wetlands affected by urbanization, we must pay more attention to the land cover patterns.

1. Introduction

Wetlands play a crucial role in maintaining bird communities by supplying abundant resources. Unfortunately, global wetlands continue to disappear at an alarming rate, and one of the main drivers of this process is urbanization [1,2]. Natural marshes and agricultural ponds are replaced by impervious surfaces. In human-made urban parks and residual habitats in the metropolitan area, the high-intensity of human disturbances surrounding the wetlands is changing the air, soil, water quality and land cover pattern, which has a significant effect on the animals [3,4,5,6]. As a result of increasing urbanization, many ecologically sensitive species, especially those that depend on particular habitats, experience habitat loss and degradation, which leads to population declines and local extinctions [7,8,9,10,11]. Meanwhile, the increase in the number of species that can adapt to the urban environment has led to the homogenization of species [12,13,14]. As urbanization intensifies, birds living in wetlands face enormous environmental challenges [15]. It is essential to understand the response of bird communities in the wetlands to urbanization to effectively develop biodiversity conservation strategies.
The viewpoint that urbanization has an impact on the homogenization of wildlife in urban areas is widely documented [14,16,17]. Some studies have demonstrated that biotic homogenization goes along with increasing urbanization [18,19]. Species richness tended to be higher in areas with low to moderate levels of human development (such as suburban areas) than in natural rural areas, in accordance with the intermediate disturbance hypothesis [20,21]. Meanwhile, other studies showed that suburban areas had lower species diversity than rural habitats [22,23]. Therefore, the first question for us to test is whether bird species diversity is different among the urban-rural gradient.
Meanwhile, what is the primary cause of difference along the urban-rural gradient? A central focus of landscape ecology is to identify conditions under which local and landscape factors strongly influence ecological patterns and processes [24,25]. This paper attempts to reveal the influencing factors of land cover pattern on wetland diversity.
Land cover pattern is a major factor that may affect bird diversity. For example, shorebirds prefer wetland areas that are shallow, sparsely vegetated, and contain considerable mudflats [26]. Some studies suggest that temperature and water depth affects the abundance of waterfowls [27], while other studies indicate that herbivorous waterfowl abundance is related to lake connectivity [28]. We should also pay attention to the terrestrial birds that have a history of wetland habitat preference. A survey of the Midwestern metropolitan area of America showed that bird species richness and diversity within wetlands correlated positively with the percentage of trees in the area plus the non-tree vegetation near the wetlands [29]. Another study showed that water birds prefer large wetlands with extensive emergent vegetation [30]. Furthermore, noise levels and vegetation appear to be critical predictors of bird diversity in urban areas [31]. Connectivity and road density are essential indexes for predicting bird combinations in agro-ecological zones [32]. The abundance of birds in Latin American cities is negatively affected by the amount of impervious surfaces and municipal green spaces [33]. Albanese (2015) found that wetland habitats acreage significantly affected the density and abundance of shorebirds [34].
Land cover patterns may change along the urban-rural gradient as the intensity of human activities changes. In urban areas, lightly managed wetlands with diverse land cover can retain a large number of sub-natural habitats and can serve as significant contributors to the conservation of local biodiversity in large urban metropolitan areas [35]. However, humans may also have a strong impact on the vegetation composition, which impacts the species richness [36]. A study in Singapore showed that the bird diversity in natural vegetation cover and cultivated greenery are significantly different [37].
The land cover pattern of wetlands has a significant impact on bird diversity [26]. However, the role of land cover pattern in wetland bird diversity in the urban-rural gradient is still unclear. In this paper, we investigated the bird communities of 31 wetland sites in Dianchi Lake, Yunnan, China. We attempted to explain the response, in terms of species diversity, of wetland birds to land cover pattern in the urban-rural gradient. We expected this study to aid the management of wetland biodiversity conversation in urbanized areas.

2. Materials and Methods

2.1. Study Area

Dianchi Lake (24°53′ N, 102°42′ E) is the largest inland lake on the Yunnan-Guizhou Plateau in Southwestern China. Its maximum water depth is 10.0 m, and the average water depth is 4.4 m. Kunming, one of the largest cities in Southwest China, is located in the northern part of Dianchi Lake. In the past, there were large areas of farmland to the east and south of Dianchi Lake. Nevertheless, the city has gradually expanded southward and surrounded Dianchi Lake. At the same time the government built several parks around Dianchi Lake. Via a systematic review of the lakeside zone, we chose 31 typical wetlands in the urban, suburban, and rural areas around Dianchi Lake as sample sites (Figure 1). We ordered the urban gradient based on the degree of urbanization around the 31 sample sites.

2.2. Bird Survey and Diversity Indices

We conducted the bird survey from 8:00 to 12:00 and from 14:00 to 18:00 on sunny days. The survey transect length of each site was 200–400 m. We counted all bird species detected with the naked eye or with binoculars along transects. We counted all waterfowls in the lake that could be detected using a monocular telescope (20–60 times). We surveyed once a month in summer and winter, from June 2018 to September 2018 and from December 2018 to February 2019. Therefore, we conducted three rounds per season, and there were a total of six rounds. The six sets of surveys were then combined to form the community composition of each site [37]. All bird species were used to calculate the α and β diversity indices of all birds. A subset of water birds was used to calculate the α and β diversity indices of water birds (including waterfowls and shorebirds). Water birds are more sensitive to changes in the wetlands and therefore had to be analyzed separately.
The α diversity index was formed using species richness. We also analyzed the Shannon-Wiener index (see Appendix A for the results). The β diversity index was measured by the Morisita–Horn index, which emphasized composition and abundance and was sensitive to abundant species [38]:
D j k = 1 2 i ( x i j x i k ) ( lambda j + lambda k ) i x i j i x i k ,
with lambda j = i x i j 2 ( i x i j ) 2 and lambda k = i x i j 2 ( i x i k ) 2 , where x i j is the ith species found in jth community and x i k is the ith species found in kth community. The Morisita–Horn index was calculated using the function “vegdist” in the package “vegan” in R [39].

2.3. Land Cover and Plant Community Survey

We set a 1000 m × 1000 m quadrat at each site and measured the percentage of built land acreage (denoted as Pbuil), agricultural land acreage (Pagri), road acreage (Proad), lawn acreage (Plawn), forest acreage (Pfore), emergent plants acreage (Pemer), floating plants acreage (Pfloa), submerged plants acreage (Psubm), pond acreage (Ppond), and edge density of emergent plants (EDemer). EDemer equals the sum of the lengths (m) of all edge segments involving emergent plants, divided by the total landscape area (m2), multiplied by 10,000 (to convert to hectares).
To accurately measure these variables, we used a drone to capture images in the sample sites and used Agisoft PhotoScan 1.2 [40] to obtain high-resolution orthophotos. The classification of images was done using eCognition Developer 8.7 [41] and ArcGIS 10 [42] based on an object-oriented classification method. We carefully verified the classifications with physical inspections. Furthermore, we used FRAGSTATS v. 4.2 [43] to calculate the landscape indices.

2.4. Statistical Analysis

All statistical analyses in this study were conducted using R 3.5.3 [44]. We firstly conducted a one-way analysis of variance (ANOVA) and Tukey’s HSD (honestly significant difference) post hoc test to compare the difference of α diversity (i.e., richness) of the three groups (rural, suburban, and urban) of wetlands along the urban-rural gradient. The functions we used were “anova” and “TukeyHSD”.
Then, to test the significance of the difference in β diversity (i.e., community dispersion) of the three groups along urban-rural gradient, we used a distance-based test of homogeneity of multivariate dispersions for a one-way ANOVA design [45,46], and the function “betadisper” in package “vegan” [39]. For visualization, we plotted bar plots of the distances to centroid for each group.
To detect the influential factors of land cover pattern on richness, we used the model section method in linear regression based on the information-theoretic approach [47]. Before model selection we tested the data sets for normality using the Shapiro-Wilk test. We checked the variance inflation factors (VIFs) to assess multicollinearity. Furthermore, we drew partial residual plots to refute severe nonlinearity, plotted the residual QQ (quantile-quantile) plots to refute severe heteroscedasticity, and checked the Bonferonni p-value to ensure there was no severe outlier.
Since our sample size was small, to avoid over-fitting the model, we limited the number of predictors in the candidate models to one-tenth of the sample size [37,48], i.e., up to three variables. We calculated the corrected Akaike information criterion (AICc), difference in AICc between the model and the model with the smallest AICc (ΔAICc), and the weight of all the models. The AICc is corrected from the AIC for the bias of small sample sizes [49] and Δ AICc i = AICc i min ( AICc ) . Since the model of ΔAICc < 2.0 is considered to have a large amount of support [47], we chose models with an ΔAICc less than 2.0 and independent variables ≤ 3 as top model subset candidates.
The coefficient weight ( w i ), i.e., “Akaike weight” [47,50] is calculated as:
w i = exp ( Δ i / 2 ) r = 1 m exp ( Δ r 2 ) ,
where on the set of m models, w i is the weight of evidence of model i, and Δ means ΔAICc.
Since top-ranked models had similar weights (i.e., each of the models considered was relatively likely given the dataset), we averaged the models in the top model set [51]. Using the zero method, a parameter estimate and error of zero was substituted into those models where the given parameter was absent, and the parameter estimate was calculated by averaging all the models in the top model set [47]. We evaluated the p-values of the model parameters, the confidence interval, unconditional SE, and the relative importance of the predictors [51]. Model selection was conducted using the function “dredge”, and model averaging and relative importance were calculated using the function “model.ave” in package “MumIn” [52]. Confidence intervals for the model averaging parameters and unconditional SE were calculated in the "AICcmodavg" package in R [53].
The selected influential factors of land cover pattern were then tested by MANCOVA (multivariate analysis of covariance) and the difference in the urban, suburban and rural wetlands was tested to check if different degrees of urbanization have different influential land cover patterns.
For the all bird dataset and the water bird dataset, we used non-metric multi-dimensional scaling (NMDS) based on Morisita–Horn distance to analyze dissimilarities of the birds between sample sites. To detect the variation in species of the environmental gradients we added land cover variables, chosen in model averaging, to the NMDS ordination plots as vectors. The regression coefficients of each axis weighted the direction of the environmental vectors, and the R² value weighted the vector length.

3. Result

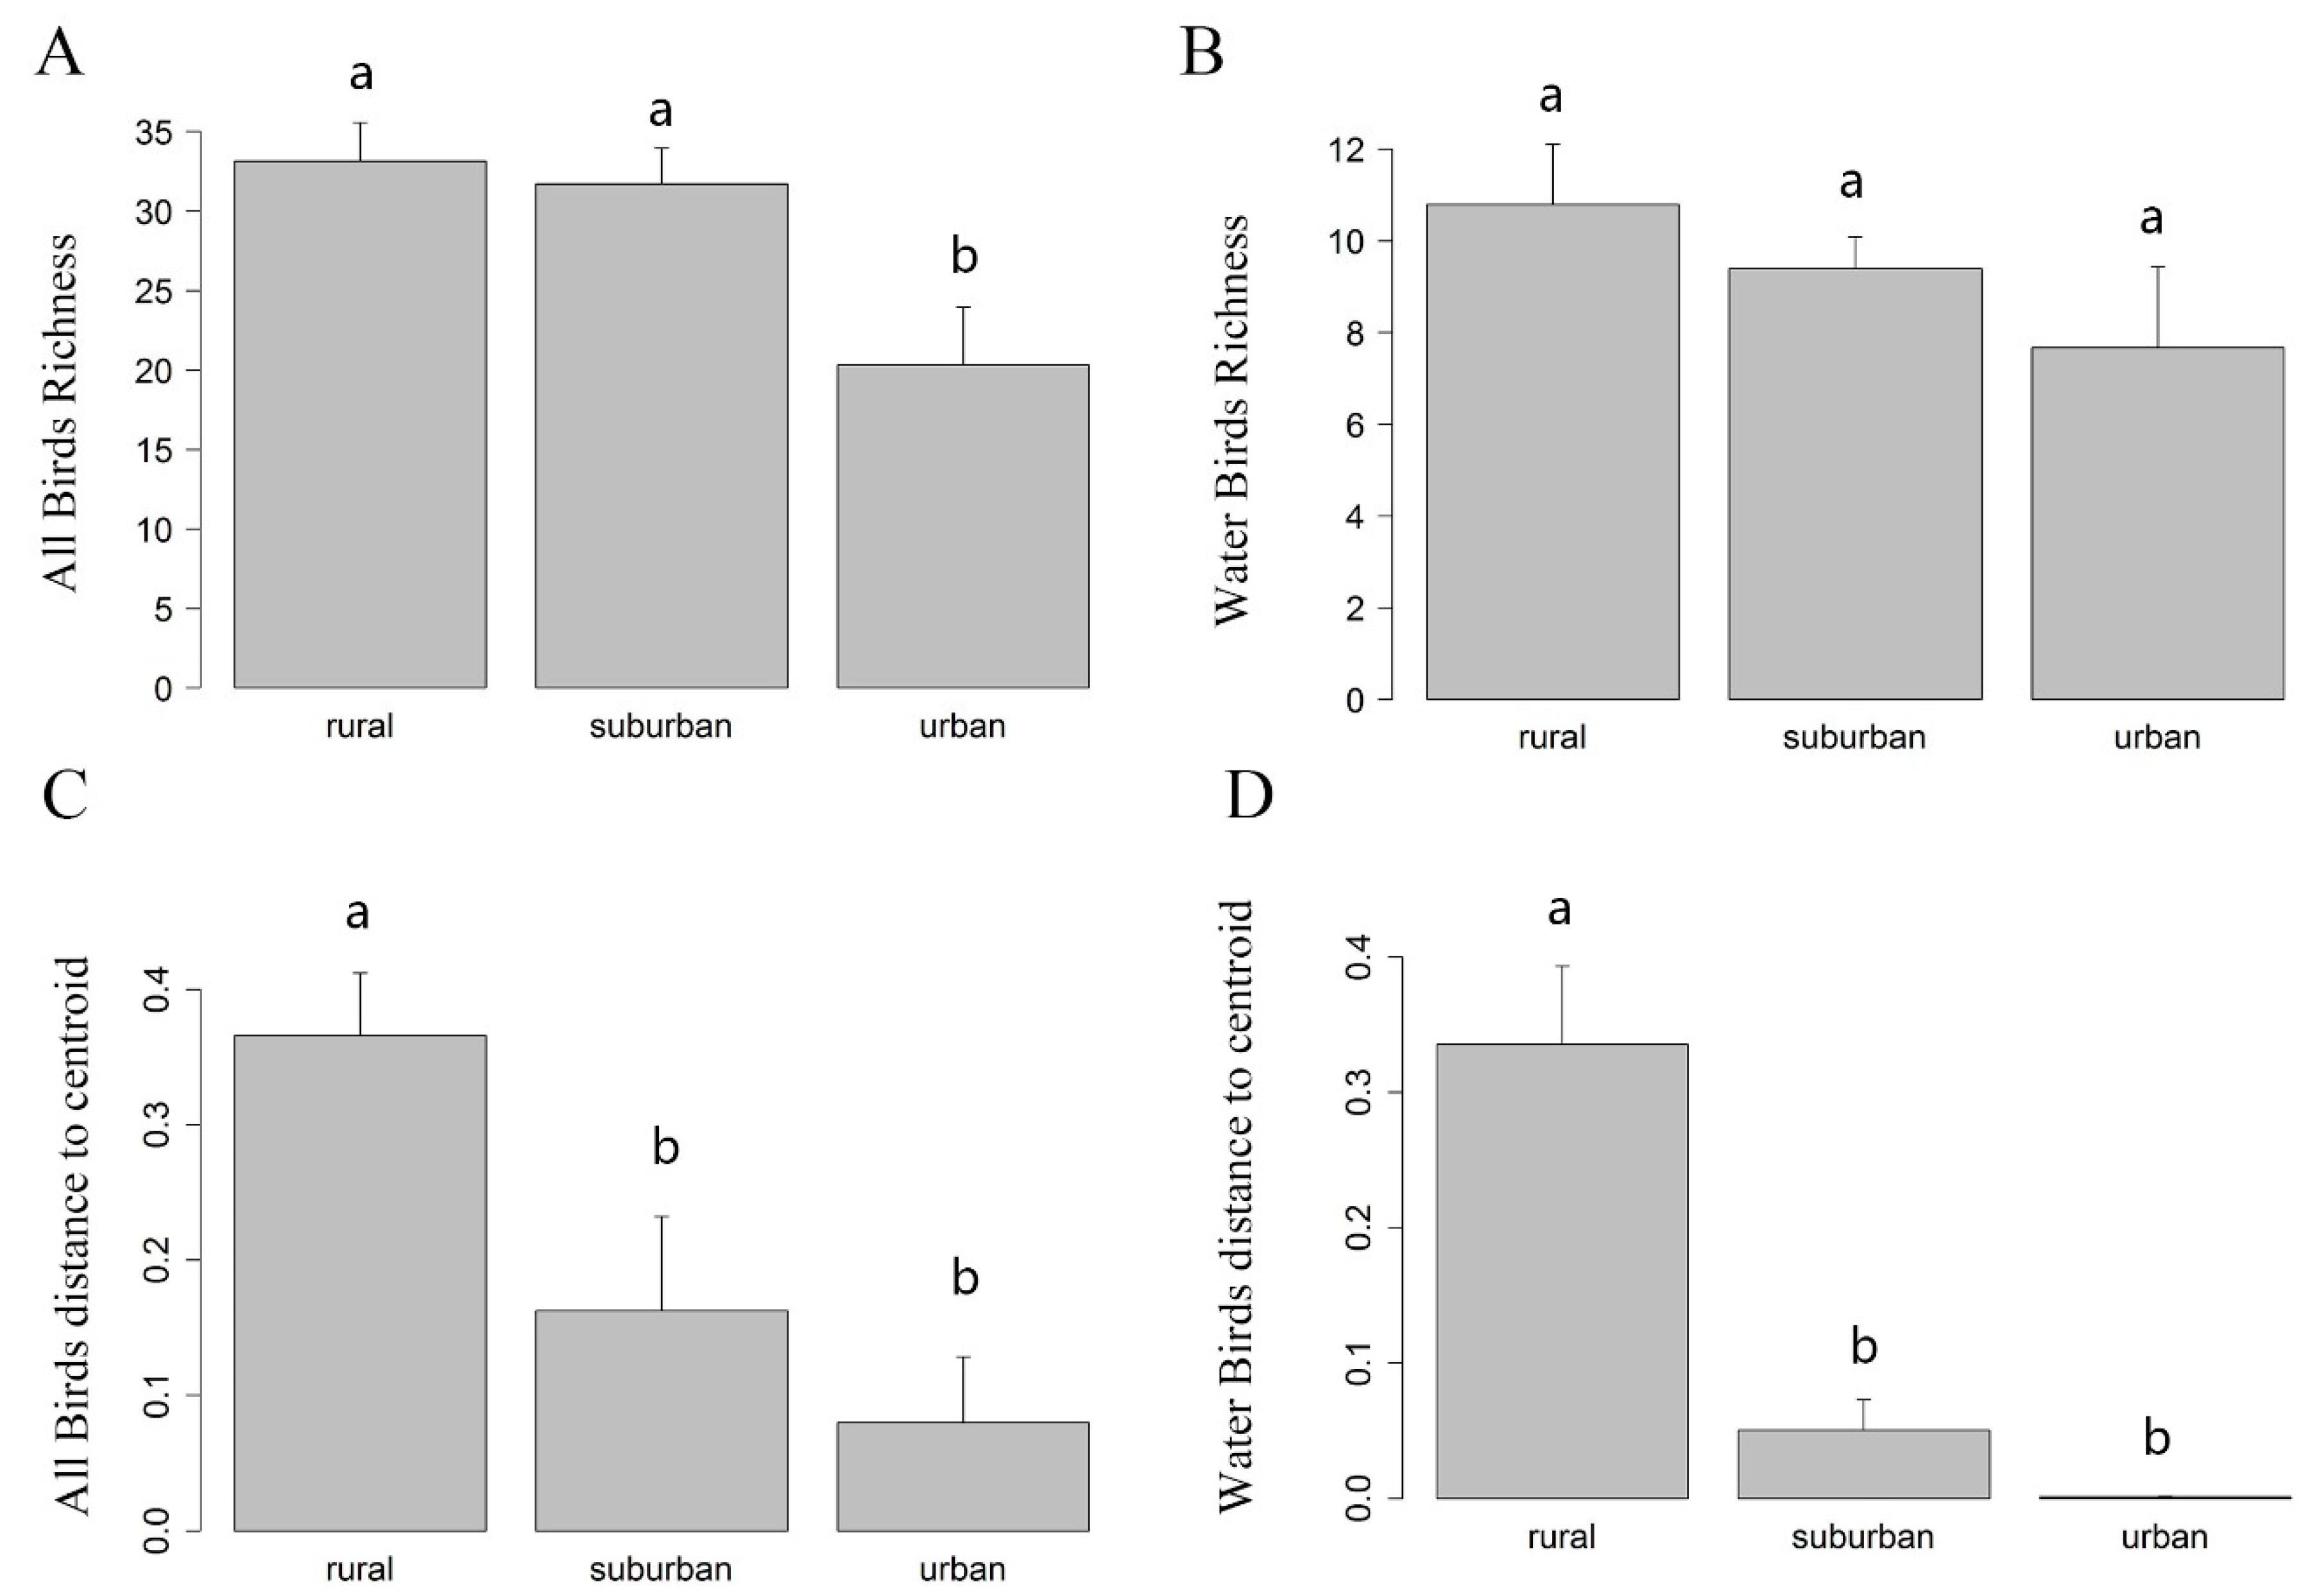
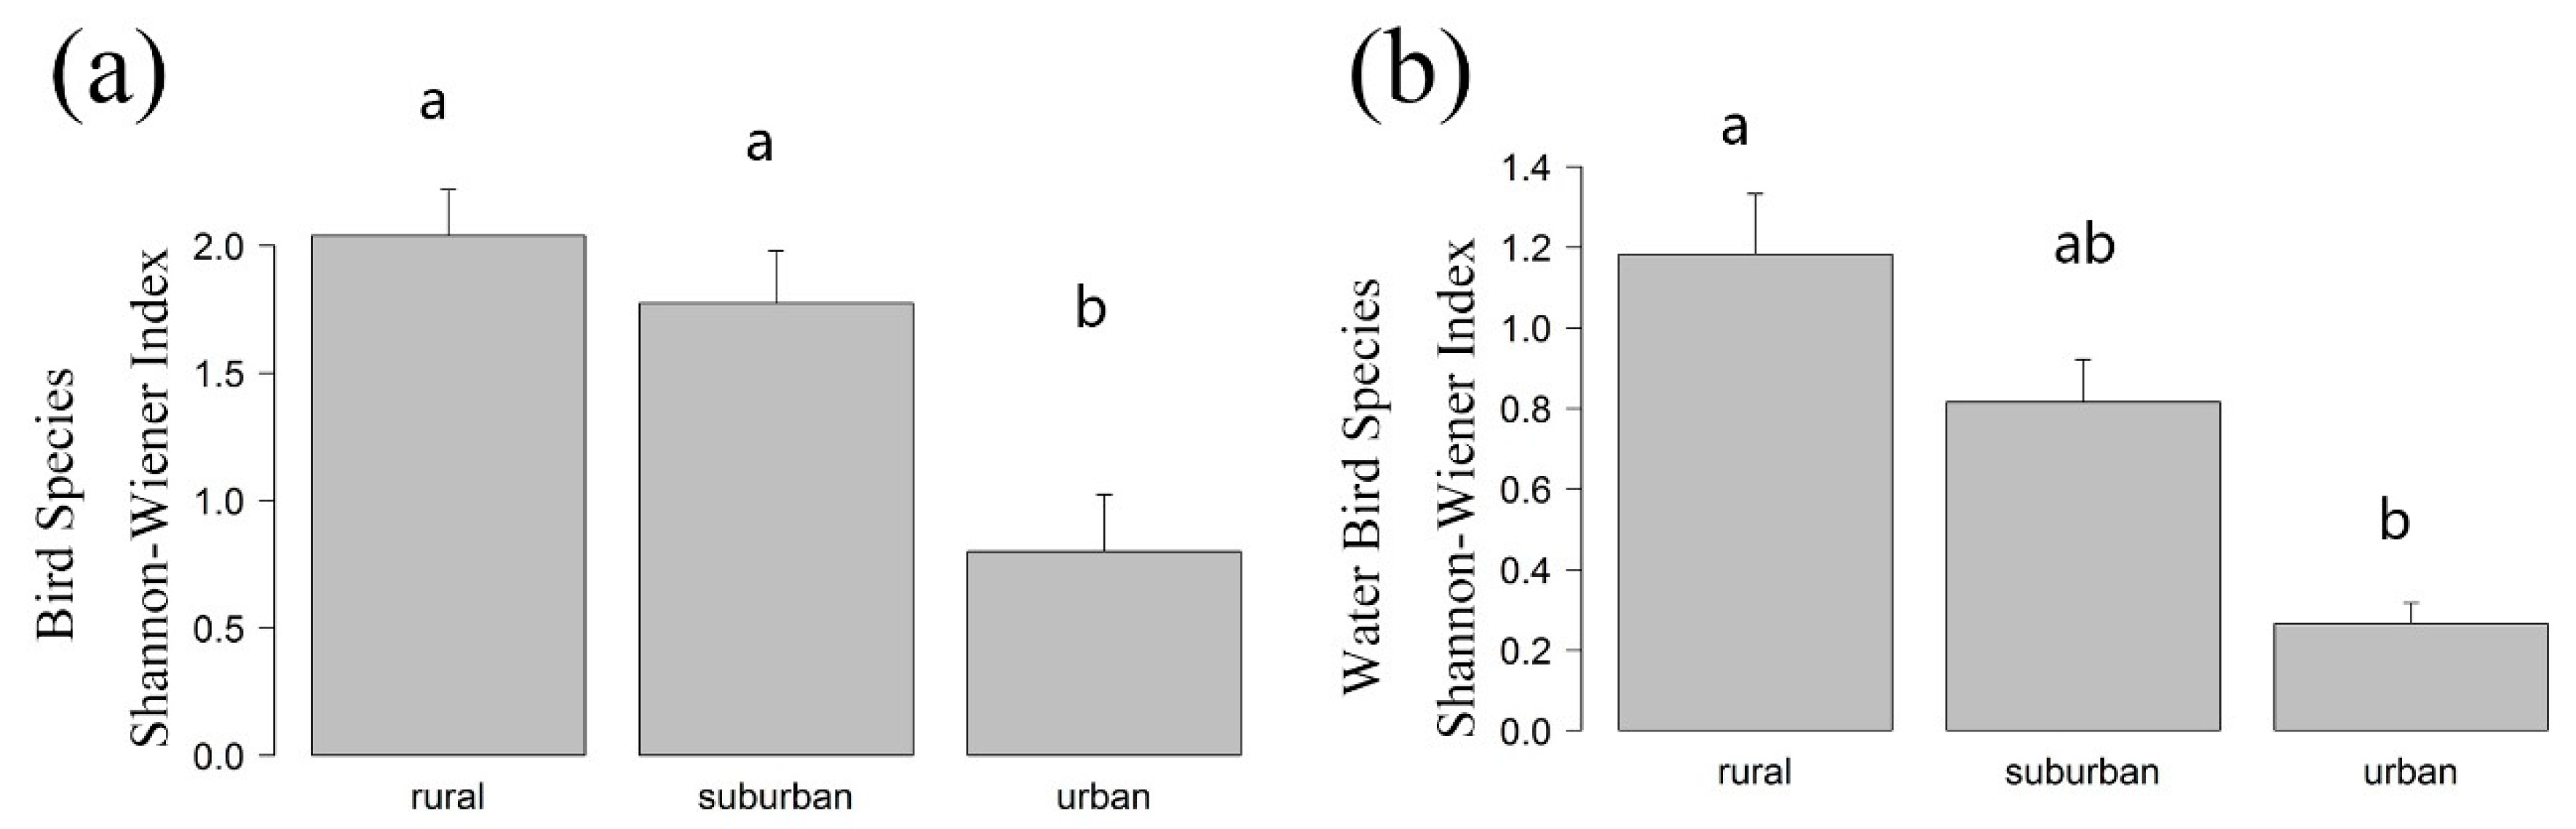
3.1. Differences of α Diversity in Urban-Rural Gradient

In six replicated surveys covering 31 sample sites, we recorded 117 species of birds for 48,800 counts. Bird species richness ranged from 7 to 50 (mean ± s.e. (standard error) = 31.19 ± 1.74) for the different sites (see Appendix A Table A1 for different seasons). We recorded 38 water bird species for 42,269 counts, and water bird species richness ranged from 2 to 21 (mean ± s.e. = 9.74 ±0.76). Meanwhile, Moran’s I Index (see Appendix B for the definition) from spatial correlation examination was not significant (all birds, p-value = 0.244; water birds, p-value= 0.090), indicating that the species richness between the plots was spatially independent.
One-way ANOVA analysis showed that the degree of urbanization had a significant effect on the richness of the all bird group (Figure 2A; F2,28 = 4.968, p = 0.014). Tukey’s HSD post hoc test showed that the all bird richness in the urban wetlands was significantly different from that of the rural (p = 0.012) and suburban (p = 0.042) wetlands, and richness of the suburban wetlands was not significantly different from the rural wetlands (Figure 2A). Regarding water bird richness, there was no significant difference within the three types of wetlands (Figure 2B; F2,28 = 1.236, p = 0.306).

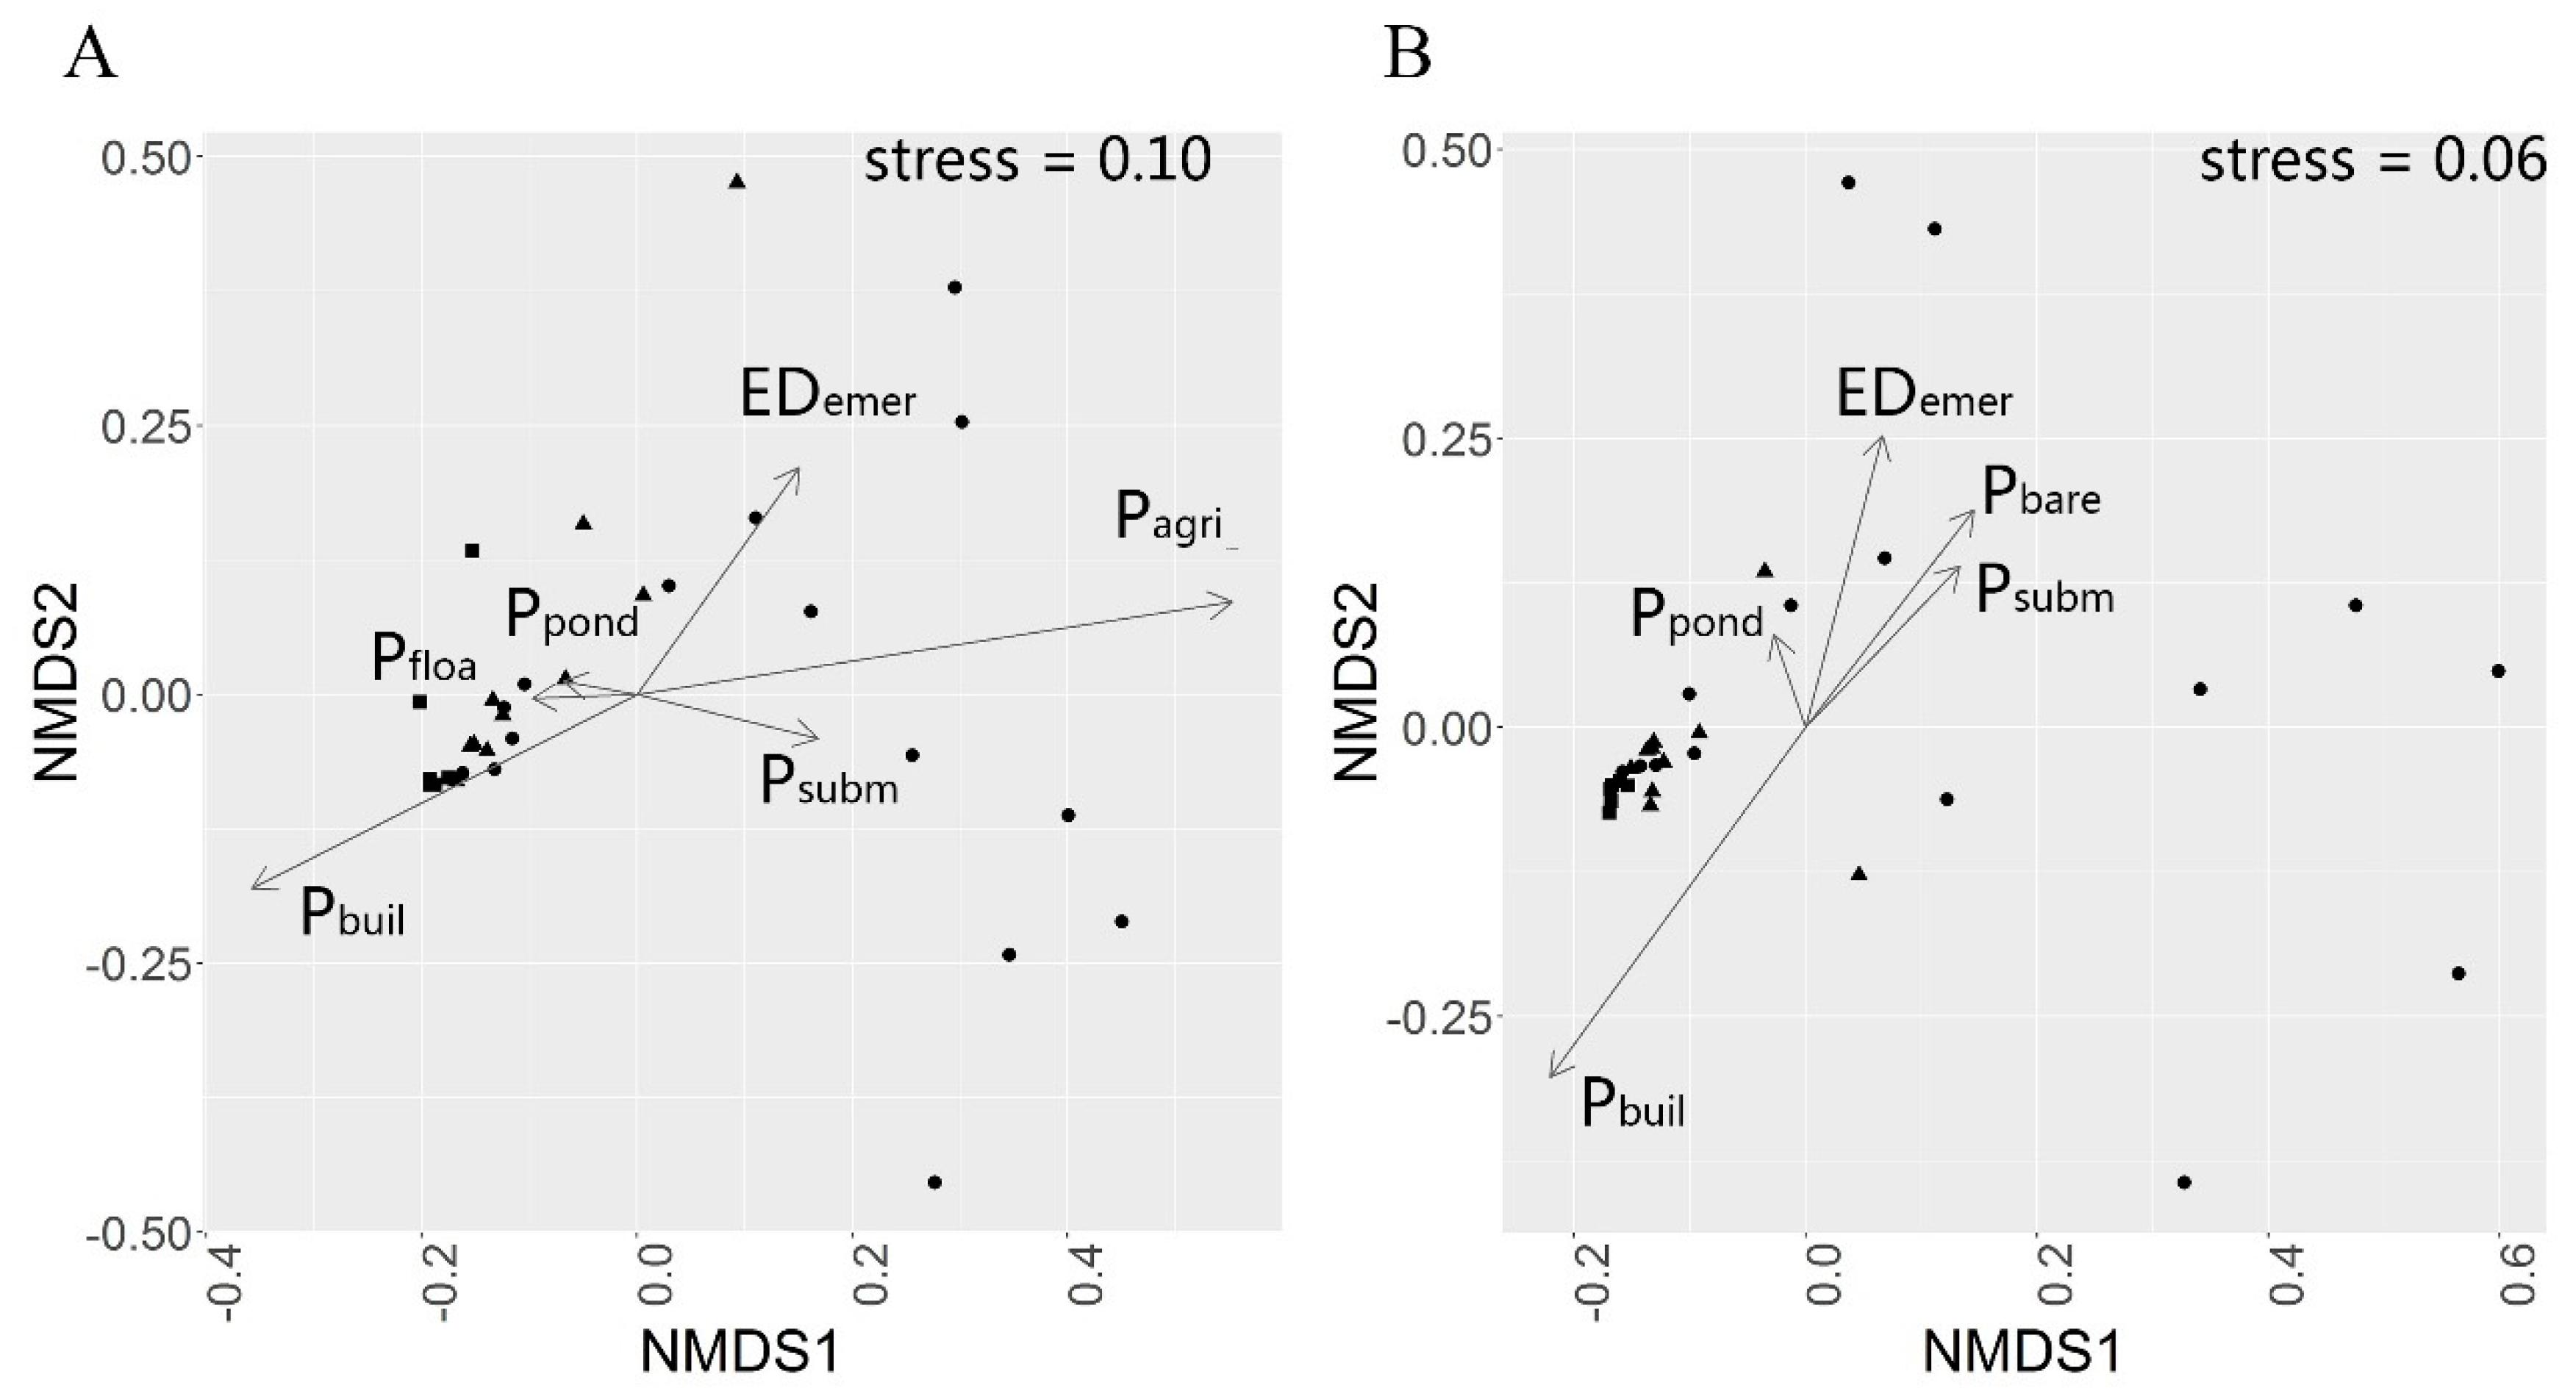
3.2. The Differences of β Diversities in Urban-Rural Gradient

One-way ANOVA showed that the bird community dispersion measured with Morisita–Horn distances was significantly different for different groups (Figure 2C; F2,28 = 6.627, p = 0.004). The values of the rural wetlands were significantly different from those of the suburban wetlands (Tukey HSD post hoc test: p = 0.030) and the urban wetlands (p = 0.009). The urban and suburban wetlands showed no significant difference (p = 0.665). Meanwhile, the water bird community dispersion measured with Morisita–Horn distances were also significantly different in different groups (Figure 2D; F2,28 = 13.564, p < 0.001). The values of the rural wetlands were significantly different from those of the suburban (p < 0.001) and urban wetlands (p < 0.001). Urban and suburban wetlands again showed no significant difference (p = 0.829).

3.3. Effects of Land Cover Patterns on Bird Species α Diversities

The diversity variables conformed to normality and there was no severe multicollinearity, nonlinearity, heteroscedasticity, or outlier. After model selection, we obtained six candidate models for the all bird richness (Table 1), and the proportion of built area seemed to be the most important predictor for all candidate models. We obtained eight candidate models for water bird richness (Table 2), and the proportion of submerged plant area seemed to be the most important predictor for all eight models.
After applying model averaging to the top model set for all birds, it was apparent that three predictors had significant effects on the all bird richness (Table 3). Among these predictors, the proportion of built area (Pbuil) was the most important predictor, followed by the edge density of emergent plants (EDemer), and the proportion of pond area (Ppond). Of these three predictors, Pbuil exerted negative effects and the other two variables showed positive effects. Regarding the water bird richness, only one predictor, Psubm, showed significant effects (Table 4), and the effect was positive.
Based on the results of MANCOVA, the percentages of the area of built land (Pbuil), edge density of emergent plants (EDemer), and the proportion of pond area (Ppond) were significantly different between urban, suburban and rural wetlands (Table 5).

3.4. Effects of Land Cover Patterns on Bird Community Dispersion in Urban-Rural Gradient

The results of NMDS on the Morisita–Horn distance of both the all bird and water bird group showed that the bird communities in the three types of sites (urban, suburban and rural) formed different clusters in the two-dimensional space (Figure 3A,B). The clusters within the suburban spaces were generally located between the clusters in the urban and rural spaces. It is clear that the rural clusters were located far from the other two types.
For all birds, Pagri, Psubm, and EDemer positively correlated with NMDS Axis 1, while Pbuil, Pfloa, and Ppond correlated with the same axis in another direction (Figure 3A). Meanwhile EDemer contributed positively to Axis 2 and Pbuil contributed negatively to the same axis. For water birds, EDemer, Psubm, and Pbare positively correlated with NMDS Axis 1, while Pbuil and Ppond correlated with the same axis in another direction (Figure 3B). Meanwhile, Ppond, EDemer, Pbare and Psubm positively correlated with Axis 2 and Pbuil negatively correlated with NMDS Axis 2 (Figure 3B).

4. Discussion

In our study, urbanization decreased both α diversity (richness) and β diversity significantly, though we did not detect a significant difference in α diversity when comparing suburban and rural areas. However, we did detect a significant difference in the β diversity of suburban and rural areas. The reason could be that α-diversity reflects a relatively small proportion of biodiversity compared to β-diversity [54,55]. We suggested that suburban wetlands have lower species diversity than rural wetlands. Another research showed that the average abundance of omnivores, granivores, and habitat generalists was higher in urban areas, while insectivores and open habitat species were more abundant in periurban areas [56]. The difference in the food preference of birds may lead to different community composition in urban and rural areas, which may result in significantly different biodiversity between the areas, as we found in this study.
For birds living in wetlands around the city, larger ponds and more extensive areas of aquatic plants may provide more spaces for nesting, shelters, and foods. Water birds need aquatic plants not only as a food source but also for shelter, especially those very sensitive to human disturbances such as Anatidae, some Scolopacidae, and Charadriidae birds. They rely on a more substantial buffer area of emergent plants as a shelter. The area of submerged plants has a significant, positive impact on water bird richness, as submerged plants are essential for herbivorous waterfowls. Ducks like to eat the aquatic plants in the water bay where the wind and waves are less intense, far from human disturbance. In the Caohai Dam of Dianchi Lake, although it is close to the road and construction land, there are still several kinds of ducks due to the abundance of submerge plants. Urban parks with high crowd density are more likely to have birds that rely on humans for food sources, such as Chroicocephalus ridibundus, which results in simpler community structure. Compared with our team’s survey in 2012 [57], we found that because of the disappearance of some mire (temporary mire appeared during construction period), the richness and abundance of Charadriidae and Scolopacidae birds declined. In wetland restoration and design, it is important to pay extra attention to the mire habitats. In urban planning, it is better to consider the high population density generated by residential lands around the wetland parks, buffer zones, and the connection between the wetland parks and natural habitats.
In some other studies, habitats with tall plants seemed to limit the species richness and quantity of shorebirds in the wetland habitats, or the vegetation-related attributes reduced the probability of finding shorebirds in the wetlands [34,58]. In our study, the area of the forest did not appear in the average model parameters of the richness for the all bird group or the water birds. This may be due to the artificial pure forests (Taxodium ’Zhongshanshan’) that were planted around Dianchi Lake. As all of the sites were influenced, we suggest further research on this topic.
We observed that the higher degree of connectivity between wetland habitats might be an important factor affecting the richness of the birds. In other studies researchers considered habitat density (suitable habitat at 1.5 km or less ) to be an essential predictor of wetland shorebird density and abundance, while migrant bird populations have been shown to increase significantly with the amount of suitable habitat in the landscape surrounding stopover sites [34,59]. Therefore, in future urban planning around the lake, it may be necessary to pay more attention to the degree of connection of wetland habitats. In the development of the lakeside metropolitan area, the compact development patterns benefits the city’s sensitive species, as the ample green space remains intact [60]. Dianchi Lake provides important and varied habitats for the breeding and wintering of wild birds. Pressures from human activities continue to reduce habitats available to bird species that feed, breed and live in wetlands. To manage and restore the urban lake wetlands, it is important to specify the characteristic of the habitats for all wild and water birds.
Our results are meant to guide wetland restoration projects, especially in terms of buffering the harmful effects of urbanization on bird diversity. Large ponds, high edge density of emergent plants are very important for bird diversity around wetlands. At the same time, more submerged plants in the harbor will be conducive to the survival of water birds.

5. Conclusions

Based on our study, Dianchi lake’s urban and suburban wetland birds are significantly homogeneous. The community structure in rural wetlands is notably different from that of suburban and urban areas. The main land cover factors that influence bird species richness are the built lands, submerged plants, ponds, and the edge density of emergent plants. Meanwhile, of these variables, the built lands, ponds and edge density of emergent plants are significantly different between the urban, suburban, and rural wetlands. Therefore, to maintain high biodiversity in the wetlands affected by urbanization, we must pay more attention to these land cover patterns.

Author Contributions

Q.M. and Z.W. were responsible for the research design; Q.M. drafted the main text and prepared the figures. C.L.; Q.M., W.G., W.Y. and Y.T. did bird survey; Q.M. finished the land cover classification and plant community survey; W.Y. and W.G. processed the data; Q.M. and G.W. developed the modeling framework; and Q.M. and G.W. analyzed the results. All authors were involved in discussions and editing.

Funding

The National Natural Science Foundation of China (No. 41471149) and the National Natural Science Foundation of China (No. 31060079) financially supported this study.

Conflicts of Interest

The authors declare no conflict of interest.

Appendix A. Differences in the Shannon-Wiener Index of the Urban-Rural Gradient

In six replicated surveys of 31 sample sites, the Shannon-Wiener index of all bird species ranged from 0.39 to 3.00 (mean ± s.e. = 1.71 ± 0.14), and the Shannon-Wiener index of water bird species ranged from 0.10 to 2.23 (mean ± s.e. = 0.89 ± 0.10). One-way ANOVA analysis showed that the degree of urbanization had significant effects on all birds group in the Shannon-Wiener index (Figure A1a; F2,28 = 7.621, p = 0.002). Tukey’s HSD post hoc test showed that all birds group in the Shannon-Wiener index of urban wetlands was significantly different from that of rural (p = 0.002) and suburban (p = 0.021) wetlands, and the Shannon-Wiener index of suburban wetlands showed no significant difference from that of rural wetlands (Figure A1a). Regarding water birds in the Shannon-Wiener index, one-way ANOVA analysis showed that the degree of urbanization had significant effects on the water bird Shannon-Wiener index (Figure A1b; F2,28 = 8.95, p = 0.001). Tukey’s HSD post hoc test showed that the water bird Shannon-Wiener index of urban wetlands was significantly different from that of the rural wetlands (p = 0.001), and the Shannon-Wiener index of the suburban wetlands showed no significant difference from rural and urban wetlands (Figure A1b).
Figure A1. Bar plots of Shannon-Wiener index of all birds and water birds in urban, suburban and rural sites: (a) all bird Shannon-Wiener index; (b) water bird Shannon-Wiener index. Different letters (a and b) indicate significant difference at the level of 0.05, detected by Tukey post-hoc test.
Diversity 11 00086 g0a1
Table A1. The bird species richness and Shannon-Wiener index for each season.
SeasonTypeSpecies RichnessShannon-Wiener Index
RangeMean ± S.E.RangeMean ± S.E.
SummerAll birds4–3419.32 ± 1.320.42–2.981.97 ± 0.12
Water birds0–155.00 ± 0.550–1.950.75 ± 0.09
WinterAll birds6–4022.00 ± 1.350.10–2.711.27 ± 0.15
Water birds1–157.74 ± 0.610–1.890.59 ± 0.10

Appendix B

Moran’s I is defined as
I = n S 0 i = 1 n j = 1 n w i , j ( y i y ¯ ) ( y j y ¯ ) i = 1 n ( y i y ¯ ) 2
where y i is observations, w i , j is distance weight, n is number of observations, and S 0 = i = 1 n j = 1 n w i , j .

References

  1. Hu, S.; Niu, Z.; Chen, Y.; Li, L.; Zhang, H. Global wetlands: Potential distribution, wetland loss, and status. Sci. Total Environ. 2017, 586, 319–327. [Google Scholar] [CrossRef] [PubMed]
  2. Davidson, N.C. How much wetland has the world lost? Long-term and recent trends in global wetland area. Mar. Freshw. Res. 2014, 65, 934–941. [Google Scholar] [CrossRef]
  3. Cohen, P.; Potchter, O.; Schnell, I. The impact of an urban park on air pollution and noise levels in the Mediterranean city of Tel-Aviv, Israel. Environ. Pollut. 2014, 195, 73–83. [Google Scholar] [CrossRef] [PubMed]
  4. Zhang, P.; Song, J.; Yuan, H. Persistent organic pollutant residues in the sediments and mollusks from the Bohai Sea coastal areas, North China: An overview. Environ. Int. 2009, 35, 632–646. [Google Scholar] [CrossRef] [PubMed]
  5. Braga, E.S.; Bonetti, C.; Burone, L.; Bonetti, J. Eutrophication and bacterial pollution caused by industrial and domestic wastes at the Baixada Santista estuarine system - Brazil. Mar. Pollut. Bull. 2000, 40, 165–173. [Google Scholar] [CrossRef]
  6. Verzijden, M.N.; Ripmeester, E.A.P.; Ohms, V.R.; Snelderwaard, P.; Slabbekoorn, H. Immediate spectral flexibility in singing chiffchaffs during experimental exposure to highway noise. J. Exp. Biol. 2010, 213, 2575–2581. [Google Scholar] [CrossRef] [PubMed] [Green Version]
  7. Hamer, A.J.; McDonnell, M.J. Amphibian ecology and conservation in the urbanising world: A review. Biol. Conserv. 2008, 141, 2432–2449. [Google Scholar] [CrossRef]
  8. Sewell, S.R.; Catterall, C.P. Bushland modification and styles of urban development: Their effects on birds in south-east Queensland. Wildl. Res. 1998, 25, 41–63. [Google Scholar] [CrossRef]
  9. Newbold, T.; Hudson, L.N.; Hill, S.L.L.; Contu, S.; Lysenko, I.; Senior, R.A.; Boerger, L.; Bennett, D.J.; Choimes, A.; Collen, B.; et al. Global effects of land use on local terrestrial biodiversity. Nature 2015, 520, 45. [Google Scholar] [CrossRef] [PubMed]
  10. Dennis, R.L.H.; Hardy, P.B. Loss rates of butterfly species with urban development. A test of atlas data and sampling artefacts at a fine scale. Biodivers. Conserv. 2001, 10, 1831–1837. [Google Scholar] [CrossRef]
  11. Shochat, E.; Lerman, S.B.; Anderies, J.M.; Warren, P.S.; Faeth, S.H.; Nilon, C.H. Invasion, Competition, and Biodiversity Loss in Urban Ecosystems. Bioscience 2010, 60, 199–208. [Google Scholar] [CrossRef] [Green Version]
  12. Moffatt, S.F.; McLachlan, S.M.; Kenkel, N.C. Impacts of land use on riparian forest along an urban-rural gradient in southern Manitoba. Plant Ecol. 2004, 174, 119–135. [Google Scholar] [CrossRef]
  13. Kark, S.; Iwaniuk, A.; Schalimtzek, A.; Banker, E. Living in the city: Can anyone become an “urban exploiter”? J. Biogeogr. 2007, 34, 638–651. [Google Scholar] [CrossRef]
  14. McKinney, M.L. Urbanization as a major cause of biotic homogenization. Biol. Conserv. 2006, 127, 247–260. [Google Scholar] [CrossRef]
  15. McKinney, R.A.; Raposa, K.B.; Cournoyer, R.M. Wetlands as habitat in urbanizing landscapes: Patterns of bird abundance and occupancy. Landsc. Urban Plan. 2011, 100, 144–152. [Google Scholar] [CrossRef]
  16. Morelli, F.; Benedetti, Y.; Diego Ibanez-Alamo, J.; Jokimaki, J.; Mand, R.; Tryjanowski, P.; Moller, A.P. Evidence of evolutionary homogenization of bird communities in urban environments across Europe. Glob. Ecol. Biogeogr. 2016, 25, 1284–1293. [Google Scholar] [CrossRef]
  17. Clergeau, P.; Croci, S.; Jokimäki, J.; Kaisanlahti-Jokimäki, M.-L.; Dinetti, M. Avifauna homogenisation by urbanisation: Analysis at different European latitudes. Biol. Conserv. 2006, 127, 336–344. [Google Scholar] [CrossRef]
  18. Blair, R.B. Creating a homogeneous avifauna. In Avian Ecology and Conservation in an Urbanizing World; Marzluff, J.M., Bowman, R., Donnelly, R., Eds.; Springer US: Boston, MA, USA, 2001; pp. 459–486. ISBN 978-1-4615-1531-9. [Google Scholar]
  19. Kühn, I.; Klotz, S. Urbanization and homogenization—Comparing the floras of urban and rural areas in Germany. Biol. Conserv. 2006, 127, 292–300. [Google Scholar] [CrossRef]
  20. McKinney, M.L. Urbanization, Biodiversity, and ConservationThe impacts of urbanization on native species are poorly studied, but educating a highly urbanized human population about these impacts can greatly improve species conservation in all ecosystems. BioScience 2002, 52, 883–890. [Google Scholar] [CrossRef]
  21. Fortel, L.; Henry, M.; Guilbaud, L.; Guirao, A.L.; Kuhlmann, M.; Mouret, H.; Rollin, O.; Vaissiere, B.E. Decreasing Abundance, Increasing Diversity and Changing Structure of the Wild Bee Community (Hymenoptera: Anthophila) along an Urbanization Gradient. PLoS ONE 2014, 9, e104679. [Google Scholar] [CrossRef]
  22. Bates, A.J.; Sadler, J.P.; Fairbrass, A.J.; Falk, S.J.; Hale, J.D.; Matthews, T.J. Changing Bee and Hoverfly Pollinator Assemblages along an Urban-Rural Gradient. PLoS ONE 2011, 6, e23459. [Google Scholar] [CrossRef]
  23. Clucas, B.; Marzluff, J.M. A cross-continental look at the patterns of avian species diversity and composition across an urbanisation gradient. Wildl. Res. 2015, 42, 554–562. [Google Scholar] [CrossRef]
  24. Turner, M.G. Landscape ecology in North America: Past, present, and future. Ecology 2005, 86, 1967–1974. [Google Scholar] [CrossRef]
  25. Thornton, D.H.; Branch, L.C.; Sunquist, M.E. The influence of landscape, patch, and within-patch factors on species presence and abundance: A review of focal patch studies. Landsc. Ecol. 2011, 26, 7–18. [Google Scholar] [CrossRef]
  26. Colwell, M.A. Shorebird ecology, conservation, and management; Univ of California Press: Berkley, CA, USA, 2010; pp. 134–138. [Google Scholar]
  27. Bara, M.; Segura, L.N. Effect of Air Temperature and Water Depth on Bird Abundance: A Case Study of Rallidae and Anatidae in the Northeastern Algerian Garaet Hadj Tahar. Pak. J. Zool. 2019, 51, 211–217. [Google Scholar] [CrossRef]
  28. Xia, S.; Wang, Y.; Lei, G.; Liu, Y.; Lei, J.; XiuboYu; Wen, L.; Zhou, Y. Restriction of Herbivorous Waterbird Distributions in the Middle and Lower Yangtze River Floodplain in View of Hydrological Isolation. Wetlands 2017, 37, 79–88. [Google Scholar] [CrossRef]
  29. Petersen, K.L.; Westmark, A.S. Bird Use of Wetlands in a Midwestern Metropolitan Area in Relation to Adjacent Land Cover. Am. Midl. Nat. 2013, 169, 221–228. [Google Scholar] [CrossRef]
  30. Rosselli, L.; Stiles, F.G. Wetland habitats of the Sabana de Bogota Andean Highland Plateau and their birds. Aquat. Conserv. Mar. Freshw. Ecosyst. 2012, 22, 303–317. [Google Scholar] [CrossRef]
  31. Rodrigues, A.G.; Borges-Martins, M.; Zilio, F. Bird diversity in an urban ecosystem: The role of local habitats in understanding the effects of urbanization. Iheringia Ser. Zool. 2018, 108, e2018017. [Google Scholar] [CrossRef]
  32. Whited, D.; Galatowitsch, S.; Tester, J.R.; Schik, K.; Lehtinen, R.; Husveth, J. The importance of local and regional factors in predicting effective conservation - Planning strategies for wetland bird communities in agricultural and urban landscapes. Landsc. Urban Plan. 2000, 49, 49–65. [Google Scholar] [CrossRef]
  33. Paz Silva, C.; Garcia, C.E.; Estay, S.A.; Barbosa, O. Bird Richness and Abundance in Response to Urban Form in a Latin American City: Valdivia, Chile as a Case Study. PLoS ONE 2015, 10, e0138120. [Google Scholar]
  34. Albanese, G.; Davis, C.A. Characteristics within and around stopover wetlands used by migratory shorebirds: Is the neighborhood important? Condor 2015, 117, 328–340. [Google Scholar] [CrossRef]
  35. Shwartz, A.; Shirley, S.; Kark, S. How do habitat variability and management regime shape the spatial heterogeneity of birds within a large Mediterranean urban park? Landsc. Urban Plan. 2008, 84, 219–229. [Google Scholar] [CrossRef]
  36. Menon, M.; Devi, P.M.; Rangaswamy, M. Avifaunal Richness and Abundance along an Urban Rural Gradient with Emphasis on Vegetative and Anthropogenic Attributes in Tiruchirappalli, India. Landsc. Res. 2016, 41, 131–148. [Google Scholar] [CrossRef]
  37. Chong, K.Y.; Teo, S.; Kurukulasuriya, B.; Chung, Y.F.; Rajathurai, S.; Tan, H.T.W. Not all green is as good: Different effects of the natural and cultivated components of urban vegetation on bird and butterfly diversity. Biol. Conserv. 2014, 171, 299–309. [Google Scholar] [CrossRef]
  38. Jost, L.; Chao, A.; Chazdon, R.L. Compositional similarity and β (beta) diversity. Biol. Divers. Front. Meas. Assess. 2011, 66–84. [Google Scholar]
  39. Oksanen, J.; Blanchet, F.G.; Kindt, R.; Legendre, P.; O’hara, R.B.; Simpson, G.L.; Solymos, P.; Stevens, M.H.H.; Wagner, H. Vegan: Community ecology package. R package version 1.17-4. R-Proj. Org Acess. Em 2010, 23, 2010. [Google Scholar]
  40. Agisoft Agisoft PhotoScan Unser Manual: Professional Edition, Version 1.2. 2016. Available online: https://www.agisoft.com/pdf/photoscan-pro_1_2_en.pdf (accessed on 28 April 2019).
  41. Trimble ECognition Developer 8.7 Reference Book. 2011. Available online: http://www.ecognition.com/ (accessed on 28 April 2019).
  42. ESRI ArcGIS Desktop: Release 10. Environmental Systems Research Institute: Redlands, CA, USA, 2011.
  43. McGarigal, K.; Marks, B.J. FRAGSTATS: Spatial Pattern Analysis Program for Quantifying Landscape Structure; For. Serv. Gen. Tech. Rep. PNW; USDA, Forest Service, Pacific Northwest Research Station: Washington, DC, USA, 1995; Volume 351. [Google Scholar]
  44. R Development Core Team. A Language and Environment for Statistical Computing; R Foundation for Statistical Computing: Vienna, Austria, 2018; Available online: https://www.r-project.org/ (accessed on 28 April 2019).
  45. Anderson, M.J. Distance-Based Tests for Homogeneity of Multivariate Dispersions. Biometrics 2006, 62, 245–253. [Google Scholar] [CrossRef] [PubMed]
  46. Anderson, M.J.; Ellingsen, K.E.; McArdle, B.H. Multivariate dispersion as a measure of beta diversity. Ecol. Lett. 2006, 9, 683–693. [Google Scholar] [CrossRef]
  47. Burnham, K.P.; Anderson, D.R. Model Selection and Multimodel Inference; Springer: New York, NY, USA, 2002; pp. 75,131,323,324. ISBN 978-1-280-00948-8. [Google Scholar]
  48. Bickford, D.; Ng, T.H.; Qie, L.; Kudavidanage, E.P.; Bradshaw, C.J. Forest fragment and breeding habitat characteristics explain frog diversity and abundance in Singapore. Biotropica 2010, 42, 119–125. [Google Scholar] [CrossRef]
  49. Burnham, K.P.; Anderson, D.R. Multimodel Inference: Understanding AIC and BIC in Model Selection. Sociol. Methods Res. 2004, 33, 261–304. [Google Scholar] [CrossRef]
  50. Turkheimer, F.E.; Hinz, R.; Cunningham, V.J. On the Undecidability among Kinetic Models: From Model Selection to Model Averaging. J. Cereb. Blood Flow Metab. 2003, 23, 490–498. [Google Scholar] [CrossRef] [Green Version]
  51. Grueber, C.E.; Nakagawa, S.; Laws, R.J.; Jamieson, I.G. Multimodel inference in ecology and evolution: Challenges and solutions. J. Evol. Biol. 2011, 24, 699–711. [Google Scholar] [CrossRef] [PubMed]
  52. Bartoń, K. Multi-Model Inference. R Package, Version 1.43.6. Available online: https://cran.r-project.org/web/packages/MuMIn/MuMIn.pdf (accessed on 28 April 2019).
  53. Mazerolle, M.J. Model Selection and Multimodel Inference Based on (Q)AIC(c). R Package, Version 2.2-1. Available online: https://cran.r-project.org/web/packages/AICcmodavg/AICcmodavg.pdf (accessed on 28 April 2019).
  54. Tylianakis, J.M.; Klein, A.-M.; Tscharntke, T. Spatiotemporal variation in the diversity of Hymenoptera across a tropical habitat gradient. Ecology 2005, 86, 3296–3302. [Google Scholar] [CrossRef]
  55. Flohre, A.; Fischer, C.; Aavik, T.; Bengtsson, J.; Berendse, F.; Bommarco, R.; Ceryngier, P.; Clement, L.W.; Dennis, C.; Eggers, S.; et al. Agricultural intensification and biodiversity partitioning in European landscapes comparing plants, carabids, and birds. Ecol. Appl. 2011, 21, 1772–1781. [Google Scholar] [CrossRef] [PubMed] [Green Version]
  56. Paz Silva, C.; Sepulveda, R.D.; Barbosa, O. Nonrandom filtering effect on birds: Species and guilds response to urbanization. Ecol. Evol. 2016, 6, 3711–3720. [Google Scholar] [CrossRef] [PubMed]
  57. Luo, K. Communities and Habitat Selection of Wetland Birds in the Lakeshore-Wetland Around the Dian Lake. Master’s Thesis, Yunnan University, Kunming, China, May 2014. [Google Scholar]
  58. Niemuth, N.D.; Estey, M.E.; Reynolds, R.E.; Loesch, C.R.; Meeks, W.A. Use of wetlands by spring-migrant shorebirds in agricultural landscapes of North Dakota’s Drift Prairie. Wetlands 2006, 26, 30–39. [Google Scholar] [CrossRef]
  59. Buler, J.J.; Moore, F.R.; Woltmann, S. A multi-scale examination of stopover habitat use by birds. Ecology 2007, 88, 1789–1802. [Google Scholar] [CrossRef] [PubMed]
  60. Sushinsky, J.R.; Rhodes, J.R.; Possingham, H.P.; Gill, T.K.; Fuller, R.A. How should we grow cities to minimize their biodiversity impacts? Glob. Chang. Biol. 2013, 19, 401–410. [Google Scholar] [CrossRef] [PubMed]
Figure 1. Locations of the sample sites of Lake Dianchi grouped as ■ urban, ▲suburban, and ● rural. The red arrow in the inset indicates Dianchi’s location within China.
Diversity 11 00086 g001
Figure 2. The bar plots depict bird richness (A,B), and the Morisita–Horn distances to centroid (C,D) for all birds (A,C) and water birds (B,D) at the urban, suburban, and rural sites. Different letters (a and b) indicate significant difference at the level of 0.05, detected by Tukey post-hoc test.
Diversity 11 00086 g002
Figure 3. NMDS (non-metric multi-dimensional scaling) plots based on the Morisita–Horn distance illustrating the relative similarity of assemblages of all birds (A) and water birds (B) in each transect in ■ urban, ▲ suburban, and ● rural sites. Overlay of environmental variables chosen in model-averaging.
Diversity 11 00086 g003
Table 1. Top model set with ΔAICc < 2 and the number of predictors ≤ 3. Predicting all bird richness ranked in decreasing order of model weights.
(Int)PagriPbuilEDemerPpondPsubmPfloaAICcΔAICc Weight
28.200.217−0.1920.071 218.60.000.290
30.58 −0.265 0.4632.570 219.50.890.186
30.430.212−0.266 0.424 220.01.480.138
29.63 −0.2060.633 2.041 220.11.510.136
31.13 −0.2290.070 220.11.540.134
35.26 −0.286 2.967−1.341220.41.830.116
Pagri—proportion of agricultural land area; Pbuil—proportion of built area; EDemer—edge density of emergent plants; Ppond—proportion of pond area; Psubm—proportion of submerged plant area; and Pfloa—proportion of floating plant area.
Table 2. Top model set with ΔAICc < 2 and the number of predictors ≤ 3. Predicting water bird richness ranked in decreasing order of model weights.
(Int)PbarePpondPsubmEDemerPbuilAICcΔAICcWeight
6.520.7920.1781.658 176.90.000.204
7.730.749 1.572 177.00.100.193
6.940.654 1.3580.022 177.50.640.148
7.63 1.1920.027 178.11.270.108
10.15 1.172 −0.064178.41.550.094
8.870.616 1.368 −0.044178.51.570.093
8.75 1.433 178.71.790.083
9.11 0.1671.238 −0.066178.81.930.078
Pbare—proportion of bare land area.
Table 3. Summary results of the top models after model averaging of the selected models in Table 1.
ParameterEstimateUnconditional SEConfidence IntervalRelative ImportancePr(>|z|)
(Intercept)30.357 <0.001
Pbuil−0.2340.085(−0.400, −0.068)1.000.008
EDemer0.0690.031(0.007, 0.130)0.560.036
Psubm2.5111.302(−0.042, 5.063)0.440.065
Pagri0.2150.108(0.004, 0.426)0.430.056
Ppond0.4460.216(0.023, 0.870)0.320.048
Pfloa−1.3410.696(−2.704, 0.022)0.120.066
Table 4. Summary results of the top models after model averaging of the selected models in Table 2.
ParameterEstimateUnconditional SEConfidence IntervalRelative ImportancePr(>|z|)
(Intercept)7.878 <0.001
Psubm0.7220.656(0.138, 2.708)1.000.037
Pbare0.1750.371(−0.005, 1.448)0.640.063
Ppond1.4230.109(−0.039, 0.389)0.280.126
Pbuil0.0240.040(−0.137, 0.021)0.260.168
EDemer−0.0580.016(−0.006, 0.055)0.260.137
Table 5. Results of MANCOVA to test the significance of difference in land cover pattern variables in urban, suburban and rural wetlands. The degree of freedom between groups is always 2, while the degree of freedom within groups is always 28.
Statistic ValuePbuilPsubmEDemerPpond
F-value19.3373.1893.4503.780
p-value <0.0010.0560.0460.035

