Climate Change, Bioclimatic Models and the Risk to Lichen Diversity

Royal Botanic Garden Edinburgh, 20A Inverleith Row, Edinburgh, EH3 5LR, UK
Diversity 2019, 11(4), 54; https://doi.org/10.3390/d11040054
Submission received: 19 February 2019
/
Revised: 15 March 2019
/
Accepted: 19 March 2019
/
Published: 4 April 2019
(This article belongs to the Special Issue Lichen Diversity and Biomonitoring)
Abstract
:This paper provides an overview of bioclimatic models applied to lichen species, supporting their potential use in this context as indicators of climate change risk. First, it provides a brief summary of climate change risk, pointing to the relevance of lichens as a topic area. Second, it reviews the past use of lichen bioclimatic models, applied for a range of purposes with respect to baseline climate, and the application of data sources, statistical methods, model extents and resolution and choice of predictor variables. Third, it explores additional challenges to the use of lichen bioclimatic models, including: 1. The assumption of climatically controlled lichen distributions, 2. The projection to climate change scenarios, and 3. The issue of nonanalogue climates and model transferability. Fourth, the paper provides a reminder that bioclimatic models estimate change in the extent or range of a species suitable climate space, and that an outcome will be determined by vulnerability responses, including potential for migration, adaptation, and acclimation, within the context of landscape habitat quality. The degree of exposure to climate change, estimated using bioclimatic models, can help to inform an understanding of whether vulnerability responses are sufficient for species resilience. Fifth, the paper draws conclusions based on its overview, highlighting the relevance of bioclimatic models to conservation, support received from observational data, and pointing the way towards mechanistic approaches that align with field-scale climate change experiments.
1. Introduction
Human-induced climate change is a threat to biodiversity [1,2,3] with consequences for ecosystem function and services [4] and associated human wellbeing [5]. Climate change has, however, been a recurrent feature of Earth history [6] that has shaped biodiversity evolution [7,8]. Lichens evolved at least 600 million years ago [9] and have thus responded to major planetary state shifts from icehouse to greenhouse conditions, through to Quaternary glacial–interglacial cycles. Nevertheless, the current rate and magnitude of climate change during the 21st Century is thought to exceed previous Tertiary climatic events [10,11], and it is the interaction of this rapid climate change with constraints to ecological response, such as might be caused by habitat fragmentation [12,13], that amplifies the current biodiversity threat. Hence, climate change is increasingly adopted as the overarching context in addressing inter-related conservation challenges including landscape and habitat management [14,15]. It is by acting synergistically with these other pressures, such as habitat loss or pollution, that climate change contributes to accelerated species extinction >10,000 times ‘background’ levels [16]. This leads to both a moral question about humanity as the cause of a mass extinction event [17] alongside the utilitarian need to conserve biodiversity in order to maintain ecosystem services and goods that support human wellbeing [18,19]. Set within these broad themes of climate change risk and society’s response, lichens are an important part of Earth’s evolutionary heritage, especially as a remarkable example of symbiosis [20,21,22], and they play an essential role in ecosystem functioning from global [23,24] to local levels [25].
This paper considers the role of bioclimatic models in assessing the climate change risk to lichens and informing new areas of research to further lichen conservation. Bioclimatic models are defined here as statistical, predictive tools that can be used to project a species probability or its likelihood of occurrence onto a landscape, based on the response to either climate variables alone or alongside other nonclimatic covariables. These tools have sometimes been referred to as ‘bioclimatic envelope models’ [26,27] and are a climate-orientated type of ‘species distribution model’ [28,29] or ‘habitat suitability model’ [30]. Indicator species can be identified from bioclimatic models as those at high risk under future climates and/or those that are especially sensitive to particular variables of temperature/precipitation; these species can be targeted for monitoring the impacts of climate change. Alternatively, indicator species could be those that require specific actions to reduce their vulnerability becoming foci for monitoring progress towards conservation goals designed to minimise climate change risk.
2. Bioclimatic Analysis of Lichens
Bioclimatic modelling is a structured decision-making process (Figure 1: for technical reviews relevant to bioclimatic modelling see for example [31], in addition to [26,27,28,29,30]).
Bioclimatic models provide a statistical comparison of species distribution (response) with climate predictors, testing of this predictive model, and subsequent projection of a validated model to estimate a shift in suitable bioclimatic space compared between a baseline (present-day) and a future climate change scenario. However, bioclimatic modelling of lichens has been used for a wide variety of purposes, and many such studies have explored the relationship of lichen distribution to baseline climate only, alongside a range of other covariables, and without projection to climate change scenarios (Table 1). Thus, lichen bioclimatic modelling has been used to test taxonomic hypotheses [32,33,34,35,36], improve understanding of threatened species [37,38,39,40,41,42,43,44,45] including through conservation design [46,47], identify indicator species [48,49,50,51], or to test and improve the practical application of bioclimatic methods [37,52,53,54]. These studies at the baseline highlight three key interrelated decisions characterising the development process for any bioclimatic model: 1. Data source and statistical method, 2. Model extent and resolution, 3. Choice of predictor variables.
In certain cases, bioclimatic models have been supported by systematic sampling with abundance [41,49,50] and/or presence-absence as the response variables [37,41,42,48,49,51,52]. However, in other cases, and typical for bioclimatic models more generally, studies have used lichen distributions reconstructed from the accumulation of positively confirmed but opportunistically sampled field occurrence records (e.g., herbaria and/or mapping schemes). These records are pooled over time and space to provide a net distribution. The pooling of records presents a snapshot of a species distribution at a given time period (often unspecified, see Table 1), though frequently over multiple decades. Lichen distributions are dynamic [55] and any shifts within this baseline period are discounted; there is an important balance to be struck between a time period that extends to provide a reliable distribution, minimising issues of spatial bias [56,57], while constraining this period to represent as stable a distribution as is possible with respect to prevailing climate. Furthermore, field occurrence records provide ‘presence-only’ data which present an additional statistical challenge that has been handled along a continuum, as follows: (i) by generating a constrained set of pseudo-absences [58,59] for use with standard forms of regression such as generalised linear or additive models [33,39] or with alternative methods that facilitate nested interactions such as classification and regression trees including random forest [33], (ii) using a controlled selection of ‘background’ pseudo-absence points as applied in MAXENT [34,35,40,43,44,45], or alternatively (iii) using presence-only statistical methods that compare occurrences to the properties of an entire environmental ‘background’ [38,46,47]. Lichen bioclimatic models have thus used a rich variety of statistical techniques (Table 1), extending to include nonparametric multiplicative regression that has been applied to >50% of studies with abundance or presence-absence data [36,48,50,51].
Lichen bioclimatic models at the baseline have also varied in their extent, from global [34] to landscape-scale [41]. Alongside extent, model resolution has been determined by a match between the scale used to generate the lichen response and that of available climate predictors. Baseline bioclimatic models appear to have had an average resolution of c. 2 km, though ranging from 10 km to 5 metres, with 1 km the most frequently used resolution. This scale is critical to the choice and availability of nonclimatic covariables, which have been extensively applied alongside climate as predictors in baseline models (Table 1).
To compensate for interannual variability in providing reliable estimates of spatial pattern, climate predictors are averaged over a time-period often of several decades. Even so, the choice of climate predictors presents a particular challenge, since values for temperature and precipitation will often strongly covary at the baseline, making it problematic to identify through statistical testing which may be the most directly relevant in explaining a species distribution. Studies have approached this in various ways, such as through the use of spatial co-ordinates as a climate proxy [37] including distance from the coastline [39], by using ordination to summarise climatic covariation along synthetic axes [32,50] and using indices of net climatic effects [36,45,46,47,52,53,54], or by including a purposeful selection of more nuanced but functionally-relevant climate variables (cf. [60]) such as occult precipitation, relative humidity, dew point and vapour pressure [36,42,49,52]. Nevertheless, this important choice of climate predictors opens up a series of pivotal challenges to the entire process of bioclimatic modelling, which are addressed below.
2.1. Challenge 1: The Assumption of Climatic Control
Standard bioclimatic modelling, used to explain species distributions based on climate predictors, has been repeatedly challenged by ecological statisticians [61,62,63,64,65]. Key to their criticism is the recognition that species distributions are often aggregated, and that aggregation may be determined not only by climate. One possibility is that aggregated distributions are explained by alternative predictors, such as the known effects of air pollution [66,67] or habitat structure [68,69]. To compensate, these alternative predictors can be included as covariables in bioclimatic models (Table 1). A more serious challenge—one that is not necessarily addressed by adding covariables, since it may apply equally to the covariables themselves—is that aggregated distributions can emerge from dispersal processes within ‘neutral’ environments [70], i.e., in the absence of any deterministic niche constraint (Figure 2). This leads to a situation in which an aggregated distribution will be compared to an autocorrelated predictor, including climate, but also relevant to air pollution and possibly including gradients in habitat structure, etc. On this basis, stochastic dispersal could plausibly lead—theoretically as a null model—to aggregated distributions in alternative parts of autocorrelated environmental space (Figure 2). Consequently, an equally ‘good’ bioclimatic model could be generated despite the model predictors lending no functional constraint to the species distribution. Standard approaches to model fit such as R2 are arguably inappropriate as hypothesis tests, with the role of climate as a predictor in bioclimatic models resting on the a priori assumption that lichen distributions are sensitive to climate and under climatic control. It thus becomes necessary for lichenologists to provide alternative support for genuine climatic control of lichen distributions, in much the same way that correlation of lichen distributions with pollution [71,72] was coupled to the experimental testing of physiological response [73,74].
Notwithstanding development of statistical approaches to better isolate and test climate as a model predictor [75,76], support for the direct climatic control of lichen distributions is available in at least three forms. First, expert lichenologists, based on extensive field knowledge, have related species distributions to climate across a range of contrasting environments and scales [77,78], and this can provide an overlooked but important support in bioclimatic modelling [79]. Second, there appear to be nonrandom patterns of lichen distributions in space, or through time, which are consistent with and support climate sensitivity. Postglacial lichen distributions appear to occupy the same climatic space, independently and over c. 75% of tested species, for Europe and North America [80], which points to their climatic control. Changing lichen distributions over several centuries appear consistent with historic climate change [81], again supporting climatic control. Third, functional evidence is provided by studies of lichen growth for different climates, which, when projected onto a landscape of climate predictors, allows a matching of growth rate with observed or modelled baseline distribution [82,83]. Experimental studies can isolate an effect of climate variables on lichen growth [84,85], but it is critical to show that this sensitivity has relevance at the extent and resolution of bioclimatic models, providing functional support at scale.
Overall, there will be a multitude of effects that explain lichen distributions, and lichens may differ in their relative sensitivities to these predictors for a specified extent/resolution of analysis. Nevertheless, there seems to be sufficient emerging evidence that climate is relevant as a bioclimatic predictor and can—to varying degrees—explain lichen distributions. Bioclimatic models to explain species baseline distributions may be defensible when carefully constructed. A further challenge emerges, however, with the projection of these baseline models to climate change scenarios.
2.2. Challenge 2: Projection to Climate Change Scenarios
A growing number of studies are extending bioclimatic models, developed and tested on baseline distributions, through their projection to climate change scenarios (Table 2) in order to estimate climate change risk. This has been achieved in different ways. Most studies have used a threshold of model probability or likelihood of occurrence in designating a cut-off for climatically suitable sites, thus calculating a shifted distribution or extent of these locations between the baseline and climate change scenarios [86,87,88,89,90,91,92]. A smaller number of studies have used a net difference of probability/likelihood values to calculate a shift in climatic suitability for a given region [93,94,95]. The results of these studies serve to highlight the potential significance of climate change in lichen conservation. For example, there is an estimated loss of suitable climate space > 75% for Lobaria species in Italy by the 2080s [88] and for Vulpicida pinastri in Britain by the 2050s [91], and by the 2070s an 80–100% loss for Solonopsora spp. in the Carpathians [86] with > 90% loss of suitable climate space for high-elevation lichens endemic to the Appalachians [87]. Analysis for lichen biogeographic groups can indicate the contrast between species with losses and gains of bioclimatic space [96], with a loss of suitable climate space for c. 75% of species modelled for the Iberian Peninsula by the 2080s [90]. Projection of suitable climate space for 382 lichen epiphytes in Britain [94,95] indicated 38% of species losing and 62% gaining suitable climate space, again by the 2080s, and emphasising the potential scale of compositional turnover in lichen diversity.
These studies projecting to climate change scenarios have tended to use accumulated distributions from presence-only data as a response, with pseudo-absences (though see [92,93]), and probably in an effort to isolate the strength of any climate change effect, have tended to focus exclusively on climate predictors. Studies that included nonclimatic covariables [86,91,92,94,95] may be more comprehensive ecologically, but have the added complexity of isolating a species sensitivity across multiple different predictors, in order to estimate the unique effect of climate change.
It also becomes necessary to consider the choice of climate change scenario (for technical details see [97,98,99]). Using scenarios can limit model predictors, since these need to be compatible between baseline and scenario datasets. There is often a wider choice of climate variables interpolated between instrumental measurements and relating to the baseline, compared to those available in scenarios derived from physical climate models. This can present challenges. Arctic/alpine lichens have distributions that appear to be constrained at a regional scale by climatic effects of temperature and precipitation, potentially losing 50–90% of suitable climate space by the 2050s for a region such as Britain [96]. The landscape occurrence of these species may be controlled directly by temperature/precipitation, but also indirectly by a complexity of factors nested within regional bioclimatic gradients. These indirect factors may be physical, such as the effect of wind and topography on snow distribution, negatively affecting chionophobous (snow-avoiding) terricolous lichens [100,101,102], or biotic, such as through an effect of vascular plant growth, which may increase with warmer temperatures [103,104,105]. Thus, incorporating both snow distribution [106] and vascular plant competition [107,108] can improve landscape-scale distribution models for terricolous arctic/alpine lichens. Even if regional gradients of temperature and precipitation at the baseline (broad extent/low resolution) indirectly capture landscape-scale effects on lichens, under climate change, this indirect proxy role may be weakened. For example, covariance relationships between regional bioclimatic and small-scale variables, that are a generalising assumption within baseline models, may shift as a consequence of climate change, leading to poor transferability into the future and causing inaccuracies as models are projected to climate change scenarios. Thus, warming and increased vascular plant growth may negatively affect lichens, but wind speeds may also increase under climate change [109,110]. Increasing wind speeds can cause small-scale effects that do not correspond to regional patterns of temperature/precipitation, but nevertheless could potentially offset the general warming effect on vascular plants, enabling a local persistence of terricolous lichens [111]. Interrogating this more detailed ecology through bioclimatic models would require downscaling of baseline and scenario data for variables such as wind and snow, which are currently unavailable as ‘off-the-shelf’ predictors.
The projection of bioclimatic models to climate change scenarios therefore revisits the key question of climatic control, i.e., can a species baseline distribution be assumed as under climatic control at a given extent/resolution (see Challenge 1: The Assumption of Climatic Control, above), considering: 1. The more restricted range of climate predictors available for modelling across baseline and scenarios, and 2. The transferability of covariance relationships among relevant predictors into the future. Together, these issues open up the serious challenge of nonanalogue future climates.
2.3. Challenge 3: Nonanalogue Climates and Functional Bioclimatic Models
Climate change is expected to result in a set of nonanalogue climatic conditions with no counterpart in the present-day [112,113], bringing into question model projection (extrapolation) from the baseline climate (used to develop and test species bioclimatic response) to climate change scenarios. Significantly, this nonanalogue situation appears to apply to ecosystems that have globally important lichen diversity, such as European temperate rainforest [114,115].
Nonanalogue climates become increasingly evident when considering covariance relationships between the alternative predictors that could be relevant in bioclimatic models, and how these relationships may change between baseline and scenarios (Figure 3). For example, the choice between total precipitation and number of rain-days may not matter if these covary for a baseline model (they each provide redundant information), but the choice may become important for projection to scenarios if they shift independently of each other under climate change (Figure 3). The extent of nonanalogue climates becomes strikingly apparent as bioclimatic models are increasingly informed by lichen biology. Bioclimatic modelling has been challenged to develop species response models that are supported by evidence from functional ecology [116,117,118], rather than opting for a ‘naive’ automated selection of predictors from standard suites of bioclimatic variables. A plausible functional bioclimatic model for lichens might include the Iwet hypothesis [85,119], stating that lichen growth is limited by light availability during periods when the thallus is hydrated, while allowing for an effect of temperature on rates of respiration [120,121]. In applying the Iwet hypothesis, it becomes apparent that nonanalogue climates could emerge as patterns of moisture and temperature shift with respect to a seasonal cycle of solar irradiance (Figure 3). Accordingly, lichen growth models have demonstrated the difference between mass loss (a negative impact) under 2080s climate change scenarios—high respiration given increased hydration for low light winter, with reduced photosynthesis during drier summers—and, in contrast, increased probabilities/likelihoods of occurrence (a positive impact) for standard bioclimatic models that do not consider these nonanalogue seasonal growth dynamics [83].
The incorporation of functionally relevant variables into bioclimatic models, for projection to climate change scenarios, demands further development and can draw on the example of baseline models, which have tended to utilise a broader range of relevant covariables. Thus, in addition to alternative sources of moisture (see Bioclimatic Analysis of Lichens, above) a number of baseline lichen bioclimatic models have included solar irradiance as a predictor [48,52,53,54].
3. Bioclimatic Models and Species Vulnerability
It is important to consider that bioclimatic models estimate extents of climate suitability for one or more species, and that they do not aim to estimate a species actual occurrence. Thus, the shift or loss in extent of suitable climate space needs to be interpreted against a species ability to respond to this change. Following from this, and borrowing concepts from risk analysis [122,123], it is suggested that the climate change risk for lichens can be divided into related components of exposure and vulnerability [124].
The extent to which a species climate suitability may decrease or shift, when comparing a baseline and future climate change scenario, for a given region of interest, can be characterised as a species exposure. This is amenable to bioclimatic modelling. Species may be exposed to large decreases in extent or range shifts in suitable climate space. However, the exact fate of an exposed species will depend on ecological factors that determine its response to this changing environment, representing its vulnerability (Figure 4). These ecological factors include potential for migration, adaptation or acclimation, as well as the availability of suitable or heterogeneous habitat offering microclimatic refugia. The greater the species exposure to climate change, the more effective one or more of the vulnerability responses may need to be in order to offset local, regional or global extinction risk. It is the progressive weakening of vulnerability responses, which otherwise confer resilience, that represents the fundamental risk of human-induced climate change. Bioclimatic modelling is therefore useful as a precursor, in setting the scene for how far and how fast a species may need to migrate to track suitable climate space, or in understanding the degree of adaptation or acclimation required for climate change survival. This scene setting provides the context for future research in the four key areas of climate change vulnerability, and can be used to identify climate change indicator species along a continuum of risk.
3.1. Migration
Bioclimatic range shift can provide an estimate of the migration response required to track suitable climate space (Figure 4). Range shifts will vary among species and depend on region, but have been estimated at c. 60 km per decade from baseline to the 2080s for populations of southerly-distributed epiphytes in Britain [114]. Assessing whether or not a given species could track this shifting suitable climate space can build on evidence from lichen dispersal and establishment dynamics.
Direct evidence at ecological scales—principally relating to lichen epiphytes—suggests that a majority of lichen propagules are deposited from reproductive thalli over short distances, given both an observation of propagules [125,126] and molecular detection [127,128], with a smaller proportion of propagules escaping to disperse over greater distances. This points to a ‘fat-tailed’ dispersal kernel, with landscape distributions shaped by relatively infrequent long distance dispersal, followed by a subsequent local pattern of short distance dispersal from established thalli [129]. Inference from spatial analysis supports the proposition that lichens can effectively disperse within contiguous forest over short distances (10–100 m) at decadal timescales [130,131,132], but that dispersal becomes limited among stands [131,133] requiring longer periods of time. Furthermore, the ‘fat-tail’ portion of the dispersal kernel may be effected by the mixing of lichen propagules into the air mass, so that colonisation at a landscape-scale may be related to propagule dilution and a density correlating with extant populations in a regional source area [134,135]. It seems unlikely, when considering the rate of climate change and documented rates of short distance dispersal, alongside habitat fragmentation, that lichen epiphytes could match the velocity of climate change via colonisation of ‘stepping-stone’ habitat. Long distance dispersal, which appears less well quantified at ecological scales for epiphytes, could nevertheless play a role in the climate response, as appears to have been the case for arctic-alpine species [136,137].
It is also relevant for assessing climate change vulnerability that spatial [138,139,140] and molecular inference [141,142,143,144] point to a characteristic difference in dispersal rates between lichens reproducing sexually and generating smaller spores (frequent longer distance dispersal), and asexual reproduction with larger diaspores such as isidia or soredia (shorter distance dispersal). However, there is a degree of interspecific overlap in propagule size between spores and isidia/soredia, while the dichotomy between apparently sexual/asexual species may be less clearly apparent than is sometimes assumed [145]. Additionally, because establishment also determines the effective migration rate, species interactions could confound the outcome of dispersal; thus, there is emerging support for the ‘core-fringe hypothesis’ [146], in which spore-dispersed cyanolichens may require prior colonisation of habitat by asexual species, from which they sequester their photobionts [147,148]. Where relevant, this would overturn an expectation that spore-dispersed species could track their shifting climate space more effectively than asexual species.
3.2. Adaptation
Aside from migration, species may adapt to climate change in situ, i.e., as leading range edge populations become trailing range edge populations. The overlap in suitable climate space from baseline to scenarios can inform the extent to which local population adaptation is necessary to reduce vulnerability (Figure 4). Current evidence—again, principally relating to lichen epiphytes—suggests that standing genetic diversity is related to habitat quality [143,145,149,150]. This implies a reduced ability of lichen populations to adapt to future climate change in forests/woodlands that have an intensively managed and simplified habitat structure. However, adaptation may also occur if standing genetic diversity is complemented through gene flow, should populations appear to be regionally adapted to contrasting climates [151] and with a climate signature to their genetic structure [145,152]. The effect of gene flow depends on an effective dispersal of conidia, documented at scales of 100–1000s m [144,153], or the spread of different genetic individuals from one population to another, which invokes limitations analogous to those for migrating propagules (see Migration, above). These limitations could potentially undermine sexual reproduction among isolated small populations, restricting the recombinant evolution of genetic diversity [44,154], with population genetic diversity decreasing in landscapes with low habitat connectivity consistent with reduced gene flow [145].
3.3. Acclimation
Lichens may acclimate to shifted climate space physiologically [155,156], though this is potentially limited by the rate of climate change and extreme events [157], or they may acclimate through phenotypic plasticity. Specific thallus mass (STM) provides an example of lichen acclimation through phenotypic plasticity, since STM regulates water uptake and retention, and the time available for photosynthesis [158,159]. Values of STM may shift for individual thalli of a given species seasonally [160], with respect to microhabitat [161,162,163,164] and across different regional climates [163,165] in response to prevailing moisture and warmth governing evaporation. This potential for phenotypic acclimation varies among species [166], pointing to different degrees of potential acclimation—and different vulnerabilities—to shifting climate space.
Another potentially important example of lichen acclimation is through photobiont switching. Thus, within the broad specificity that a lichen-fungus may show for its compatible photobiont partners, there may be ecological selectivity for clades that optimise fitness in a given habitat/climate [167,168,169,170]. Given that lichen photobionts show contrasting physiological adaptations [171] both the diversity of photobiont clades that can be sustained within a thallus [170,172] and switching of photobionts across generations offer potential for acclimation to climate change. Photobiont switching under climate change is implied by studies that demonstrate ecological selectivity of photobionts along latitudinal or altitudinal gradients [173,174] and receives strongest support when these spatial patterns are linked to the physiological traits of the associated photobiont clades [175]. This has led to an important extension in bioclimatic modelling investigating how bioclimatic overlap among the intraspecific diversity of lichen symbionts structures their patterns of association [176,177]. Nevertheless, the potential for acclimation through the direct recruitment of new symbiotic partners by an extant thallus may be limited if a high degree of fungal specificity for its photobiont cannot compensate for the stress-response induced by rapid climate change [178].
3.4. Habitat Quality
Habitat quality provides a further vulnerability response, and one that can potentially be managed locally to offset regional climate change effects. Studies in arctic/alpine systems have shown that microclimatic variability linked to small-scale topography can exceed climate variability at the extent and resolution of baseline and climate change scenarios [179,180]. Lichens respond to these microhabitat differences [181,182], and the potential for local adjustment to colonise suitable microclimates may reduce vulnerability to climate change [183]. This model of ‘microrefugia’ [184,185] may be common among lichens, which respond to environmental change at microhabitat scales; conceptually, this is strongly evidenced for a management context among lichen epiphytes. Species local distribution, with respect to the breadth of forest/woodland habitats occupied, can change across their geographic range [186,187]. Thus, increased microhabitat sensitivity at range-edges [188] can explain the association of certain species with ‘old-growth’ stands in suboptimal climates [189,190]. For example, oceanic lichen species may become associated with old-growth stands that are relatively more humid for a suboptimal climatic regime and which maintain greater structural diversity [191,192] providing greater availability of microclimatic refugia. This leads to an opportunity to link climate change risk with adaptive management of forest/woodland habitat structure in order to reduce vulnerability [124]; an increased extent of forest/woodland stands with old-growth properties might offset climate change threat [92].
At a larger-scale, ensuring habitat availability across heterogeneous topographic gradients may also reduce vulnerability, since within a given climate lichen epiphytes occupy delimited topographic positions with respect to slope/aspect [193,194] or proximity to water [147,187]. Habitat availability within a topographically heterogeneous landscape could reduce the effective velocity of climate change, if dispersal-limited or niche specialist species have opportunity to migrate among locally available microrefugia.
4. Conclusions
This paper has attempted to provide an overview of key challenges and opportunities related to lichen bioclimatic modelling. There exists a strong framework for using bioclimatic models to better understand lichen distributions (Table 1), and this is increasingly extended through projection to climate change scenarios in order to estimate risk (Table 2). The results of bioclimatic modelling—suggesting a significant shift in suitable climate space for many lichen species—are broadly supported by ‘floristic’ transition from cold-adapted to warm-adapted species [195,196] and northward shifts in species range limits [197,198,199,200]. However, bioclimatic models are challenged in several ways. First, lichenologists should seek to ensure that—as far as possible—model climate predictors and species responses can be supported from prior knowledge of lichen functional ecology, gaining confidence in the assumption of climatic control. Second, larger-scale climate may interact with small-scale variables relating to topography, forest/woodland stand structure, etc. It is noteworthy that on both these points, baseline models have so far included a greater range of functionally relevant predictors and small-scale covariables, compared to models projected to future scenarios (cf. Table 1 & Table 2). This includes the combination of climate predictors with topographic indices relating to ground surface moisture [39,48] or edaphic factors [40,45] representing local microclimatic condition. However, projection to scenarios from these more comprehensive models would be challenging, because it involves extrapolating a species response from climate-covariable interactions captured at the baseline, to potential nonanalogue conditions that can generate weak transferability of climate-covariable relationships under climate change.
Ultimately, projection of bioclimatic models to future scenarios estimates a changing availability of suitable climate space (exposure), albeit in greater or lesser detail, at larger or smaller extents/resolutions. The ability of a species to respond effectively to this changing climate space (its vulnerability) depends on dynamic ecological processes often not factored into statistical bioclimatic models, including dispersal, adaptation or acclimation. By using a framework of contrasting evidence to inform climate change risk [201,202], future research could identify indicator species across a continuum of high–low exposure and high–low vulnerability, in order to monitor the outcome of conservation (Figure 5). Vulnerability factors relevant to conservation include habitat connectivity to facilitate more rapid dispersal and migration, increased gene flow and recombinant evolution, alongside greater extents of heterogeneous high quality habitat with microclimatic refugia that reduce the effective velocity of climate change, while also increasing a potential for long distance dispersal given more populations and higher densities of propagules entering the air mass. Thus, in deforested landscapes, providing a sufficient extent of high quality and connected habitat can become a generic conservation tool in reducing lichen epiphyte vulnerability [203], while combining bioclimatic modelling with trait-based analysis [43,90] could provide a summary of species guilds positioned along a continuum of vulnerability.
Moving forward, bioclimatic analyses look likely to be increasingly informed by field-scale experiments, linking the lichen physiological response to climate change, with population dynamics [204], providing data for mechanistic models that use this functional climate response to couple population and habitat dynamics [205]. Nevertheless, it needs to be considered that climate change effects on lichen populations and/or distributions could ultimately be outweighed by climate impacts that result in overwhelming landscape transformation [43].
Funding
This research was funded as grant-in-aid to RBGE, on behalf of The Scottish Government’s Rural and Environment Science and Analytical Services Division. I thank two anonymous reviewers for their suggestions to improve the original manuscript.
Acknowledgments
I thank colleagues at RBGE for helpful discussions and two anonymous reviewers for comments to improve a draft manuscript.
Conflicts of Interest
The author declares no conflict of interest.
References
- Urban, M.C. Accelerating extinction risk from climate change. Science 2015, 348, 571–573. [Google Scholar] [CrossRef] [Green Version]
- Parmesan, C.; Yohe, G. A globally coherent fingerprint of climate change impacts across natural systems. Nature 2003, 421, 37–42. [Google Scholar] [CrossRef]
- Maclean, I.M.D.; Wilson, R.J. Recent ecological responses to climate change support predictions of high extinction risk. Proc. Natl. Acad. Sci. USA 2011, 108, 12337–12342. [Google Scholar] [CrossRef] [Green Version]
- Hooper, D.U.; Adair, E.C.; Cardinale, B.J.; Byrnes, J.E.K.; Hungate, B.A.; Matulich, K.L.; Gonzalez, A.; Duffy, J.E.; Gamfeldt, L.; O’Connor, M.I. A global synthesis reveals biodiversity loss as a major driver of ecosystem change. Nature 2012, 486, 105–108. [Google Scholar] [CrossRef]
- Pecl, G.T.; Araújo, M.B.; Bell, J.D.; Blamchard, J.; Bonebrake, T.C.; Chen, I.-C.; Clark, T.D.; Colwell, R.K.; Danielsen, F.; Evengård, B.; et al. Biodiversity redistribution under climate change: Impacts on ecosystems and human well-being. Science 2017, 355, eaai9214. [Google Scholar] [CrossRef] [PubMed] [Green Version]
- Caballero, R.; Lynch, P. Climate modelling and deep-time climate change. In Climate Change, Ecology and Systematics; Hodkinson, T.R., Jones, M.B., Waldren, S., Parnell, J.A.N., Eds.; Cambridge University Press: Cambridge, UK, 2011. [Google Scholar]
- Mayhew, P.J. Global climate and extinction: evidence from the fossil record. In Climate Change, Ecology and Systematics; Hodkinson, T.R., Jones, M.B., Waldren, S., Parnell, J.A.N., Eds.; Cambridge University Press: Cambridge, UK, 2011. [Google Scholar]
- Mayhew, P.J.; Jenkins, G.B.; Benton, T.G. A long-term association between global temperature and biodiversity, origination and extinction in the fossil record. Proc. R. Soc. B 2008, 275, 47–53. [Google Scholar] [CrossRef]
- Yuan, X.; Xiao, S.; Taylor, T.N. Lichen-like symbiosis 600 million years ago. Science 2005, 308, 1017–1020. [Google Scholar] [CrossRef]
- Diffenbaugh, N.S.; Field, C.B. Changes in ecologically critical terrestrial climate conditions. Science 2013, 341, 486–492. [Google Scholar] [CrossRef]
- Moritz, C.; Agudo, R. The future of species under climate change: Resilience or decline? Science 2013, 341, 504–508. [Google Scholar] [CrossRef]
- Travis, J.M.J. Climate change and habitat destruction: A deadly anthropogenic cocktail. Proc. R. Soc. B 2003, 270, 467–473. [Google Scholar] [CrossRef]
- Schwartz, M.W. Modelling the effects of habitat fragmentation on the ability of trees to respond to climatic warming. Biodivers. Conserv. 1992, 2, 51–61. [Google Scholar] [CrossRef]
- Mantyka-Pringle, C.S.; Visconti, P.; MDi Marco, M.; Martin, T.G.; Rondinini, C.; Rhodes, J.R. Climate change modifies risk of global biodiversity loss due to land-cover change. Biol. Conserv. 2015, 187, 103–111. [Google Scholar] [CrossRef]
- De Chazal, J.; Rounsevell, M.D.A. Land-use and climate change within assessments of biodiversity change: A review. Glob. Environ. Chang. 2009, 19, 306–315. [Google Scholar] [CrossRef]
- Millennium Ecosystem Assessment (MEA). Ecosystems and Human Well Being. Biodiversity Synthesis; World Resources Institute: Washington, DC, USA, 2005. [Google Scholar]
- Cafaro, P. Three ways to think about the sixth mass extinction. Biol. Conserv. 2015, 192, 387–393. [Google Scholar] [CrossRef]
- Díaz, S.; Fargione, J.; Chapin, F.S.; Tilman, D. Biodiversity loss threatens human well-being. PLOS Biol. 2006, 4, e277. [Google Scholar] [CrossRef] [PubMed]
- Costanza, R.; de Groot, R.; Sutton, P.; van der Ploeg, S.; Anderson, S.J.; Kubiszewski, I.; Farber, S.; Turner, R.K. Changes in the global value of ecosystem services. Glob. Environ. Chang. 2014, 26, 152–158. [Google Scholar] [CrossRef]
- Lutzoni, F.; Pagel, M.; Reeb, V. Major fungal lineages are derived from lichen symbiotic ancestors. Nature 2001, 411, 937–940. [Google Scholar] [CrossRef] [PubMed]
- Gargas, A.; DePriest, P.T.; Grube, M.; Tehler, A. Multiple origins of lichen symbiosis in fungi suggested by SSU rDNA phylogeny. Science 1995, 268, 1492–1495. [Google Scholar] [CrossRef] [PubMed]
- Gueidan, C.; Villaseñor, C.R.; de Hoog, G.S.; Gorbushina, A.A.; Untereiner, W.A.; Lutzoni, F. A rock-inhabiting ancestor for mutualistic and pathogen-rich fungal lineages. Stud. Mycol. 2008, 61, 111–119. [Google Scholar] [CrossRef] [PubMed] [Green Version]
- Elbert, W.; Weber, B.; Burrows, S.; Steinkamp, J.; Büdel, B.; Andreae, M.A.; Pöschl, U. Contribution of cryptogamic covers to the global cycles of carbon and nitrogen. Nat. Geosci. 2012, 5, 459–462. [Google Scholar] [CrossRef]
- Porada, P.; Weber, B.; Elbert, W.; Pöschl, U.; Kleidon, A. Estmating impacts of lichens and bryophytes on global biogeochemical cycles. Global Biogeochem. Cycles 2014, 28, 71–85. [Google Scholar] [CrossRef]
- Asplund, J.; Wardle, D.A. How lichens impact on terrestrial community and ecosystem properties. Biol. Rev. 2017, 92, 1720–1738. [Google Scholar] [CrossRef] [PubMed]
- Pearson, R.G.; Dawson, T.P. Predicting the impacts of climate change on the distribution of species: Are bioclimate envelope models useful? Glob. Ecol. Biogeogr. 2003, 12, 361–371. [Google Scholar] [CrossRef]
- Heikkinen, R.K.; Luoto, M.; Araújo, M.B.; Virkkala, R.; Thuiller, W.; Sykes, M.T. Methods and uncertainties in bioclimatic envelope modelling under climate change. Prog. Phys. Geogr. 2006, 30, 751–777. [Google Scholar] [CrossRef] [Green Version]
- Elith, J.; Leathwick, J.R. Species distribution models: Ecological explanation and prediction across space and time. Annu. Rev. Ecol. Evol. Syst. 2009, 40, 677–697. [Google Scholar] [CrossRef]
- Franklin, J. Mapping Species Distributions; Cambridge University Press: Cambridge, UK, 2009. [Google Scholar]
- Guisan, A.; Thuiller, W.; Zimmerman, N.E. Habitat Suitability and Distribution Models; Cambridge University Press: Cambridge, UK, 2017. [Google Scholar]
- Peterson, A.T.; Soberón, J.; Pearson, R.G.; Anderson, R.P.; Martinez-Meyer, E.; Nakamura, M.; Araújo, M.B. Ecological Niches and Geographic Distributions; Princeton University Press: Princeton, NJ, USA, 2011; Vol. Monographs in Population Biology 49. [Google Scholar]
- McCune, B.; Schoch, C.L.; Root, H.T.; Kageyama, S.A.; Miadlikowska, J. Geographic, climatic, and chemical differentiation in the Hypogymnia imshaugii species complex (Lecanoromycetes, Parmeliaceae) in North America. Bryologist 2011, 114, 526–544. [Google Scholar] [CrossRef]
- Martellos, S.; Attorre, F.; Farcomeni, A.; Francesconi, F.; Pittao, E.; Tretiach, M. Species distribution models backing taxa delimitation: The case of the lichen Squamarina cartilaginea in Italy. Flora 2014, 209, 698–703. [Google Scholar] [CrossRef]
- Smith, B.E.; Johnston, M.K.; Lücking, R. From GenBank to GBIF: Phylogeny-based predictive niche modeling tests accuracy of taxonomic identifications in large occurrence data repositories. PLoS ONE 2016, 11, e0151232. [Google Scholar] [CrossRef]
- Szczepańska, K.; Pruchniewicz, D.; Kossowska, M. Modeling the potential distribution of three lichens of the Xanthoparmelia pulla group (Parmeliaceae, Ascomycota) in Central Europe. Acta Soc. Bot. Pol. 2015, 84, 431–438. [Google Scholar] [CrossRef]
- McCune, B.; Printzen, C. Distribution and climatic niches of the Lecanora varia group in western U.S.A. Bibl. Lichenol. 2011, 106, 225–234. [Google Scholar]
- Haughland, D.L.; Hillman, A.; Azeria, E.T. Tackling rarity and sample bias with large-scale biodiversity monitoring: A case study examining the status, distribution and ecology of the lichen Cladonia rei in Alberta, Canada. Lichenologist 2018, 50, 211–230. [Google Scholar] [CrossRef]
- Cameron, R.P.; Neily, T.; Clayden, S.R. Distribution prediction model for Erioderma mollissimum in Atlantic Canada. Bryologist 2011, 114, 231–238. [Google Scholar] [CrossRef]
- Wiersma, Y.F.; Skinner, R. Predictive distribution model for the boreal felt lichen Erioderma pedicellatum in Newfoundland, Canada. Endanger. Species Res. 2011, 15, 115–127. [Google Scholar] [CrossRef]
- Pearson, K.; Cameron, R.P.; McMullin, R.T. Habitat associations and distribution model for Fuscopannaria leucosticta in Nova Scotia, Canada. Lichenologist 2018, 50, 487–497. [Google Scholar] [CrossRef]
- Cardós, J.L.H.; Aragón, G.; Martínez, I. A species on a tightrope: Establishment limitations of an engangered lichen in a fragmented Mediterranean landscape. Am. J. Bot. 2017, 104, 527–537. [Google Scholar] [CrossRef] [PubMed]
- Glavich, D.A.; Geiser, L.H.; Mikulin, A.G. Rare epiphytic coastal lichen habitats, modeling, and management in the Pacific northwest. Bryologist 2005, 108, 377–390. [Google Scholar] [CrossRef]
- Allen, J.L.; Lendemer, J.C. Quantifying the impacts of sea-level rise on coastal biodiversity: A case study on lichens in the mid-Atlantic Coast of eastern North America. Biol. Conserv. 2016, 202, 119–126. [Google Scholar] [CrossRef] [Green Version]
- Allen, J.L.; McKenzie, S.K.; Sleith, R.S.; Alter, S.E. First genome-wide analysis of the endangered, endemic lichen Cetradonia linearis reveals isolation by distance and strong population structure. Am. J. Bot. 2018, 105, 1556–1567. [Google Scholar] [CrossRef]
- Haughian, S.R.; Clayden, S.R.; Cameron, R. On the distribution and habitat of Fuscopannaria leucosticta in New Brunswick, Canada. Écoscience 2019, 26, 99–112. [Google Scholar] [CrossRef]
- Martínez, I.; Carreño, F.; Escudero, A.; Rubio, A. Are threatened lichen species well-protected in Spain? Effectiveness of a protected area network. Biol. Conserv. 2006, 133, 500–511. [Google Scholar] [CrossRef]
- Rubio-Salcedo, M.; Martínez, I.; Carreño, F.; Escudero, A. Poor effectiveness of the Natura 2000 network protecting Mediterranean lichen species. J. Nat. Conserv. 2013, 21, 1–9. [Google Scholar] [CrossRef]
- Shrestha, G.; Petersen, S.L.; St. Clair, L.L. Predicting the distribution of the air pollution sensitive lichen species Usnea hirta. Lichenologist 2012, 44, 511–521. [Google Scholar] [CrossRef]
- Seed, L.; Wolseley, P.; Gosling, L.; Davies, L.; Power, S.A. Modelling relationships between lichen indicators, air quality and climate on a national scale: Results from the UK OPAL survey. Environ. Pollut. 2013, 182, 437–447. [Google Scholar] [CrossRef]
- Root, H.T.; McCune, B.; Jovan, S. Lichen communities and species indicate climate thresholds in southeast and south-central Alaska, USA. Bryologist 2014, 117, 241–252. [Google Scholar] [CrossRef] [Green Version]
- Giordani, P.; Incerti, G. The influence of climate on the distribution of lichens: A case study in a borderline area (Liguria, NW Italy). Plant Ecol. 2008, 195, 257–272. [Google Scholar] [CrossRef]
- Edwards, T.C.; Cutler, D.R.; Zimmermann, N.E.; Geiser, L.H.; Alegria, J. Model-based stratifications for enhancing the detection of rare ecological events. Ecology 2005, 86, 1081–1090. [Google Scholar] [CrossRef]
- Bolliger, J.; Bergamini, A.; Stofer, S.; Kienast, F.; Scheidegger, C. Predicting the potential spatial distribution of epiphytic lichen species at the landscape scale. Lichenologist 2007, 39, 279–291. [Google Scholar] [CrossRef]
- Dymytrova, L.; Stofer, S.; Ginzler, C.; Breiner, F.T.; Scheidegger, C. Forest-structure data improve distribution models of threatened habitat specialists: Implications for conservation of epiphytic lichens in forest landscapes. Biol. Conserv. 2016, 196, 31–38. [Google Scholar] [CrossRef]
- Seaward, M.R.D. Time-space analysis of the British lichen flora, with particular reference to air quality surveys. Folia Cryptogam. Est. 1998, 32, 85–96. [Google Scholar]
- Boria, R.A.; Olson, L.E.; Goodman, S.M.; Anderson, R.P. Spatial filtering to reduce sampling bias can improve the performance of ecological niche models. Ecol. Model. 2014, 275, 73–77. [Google Scholar] [CrossRef]
- Bean, W.T.; Stafford, R.; Brashares, J.S. The effects of small sample size and sample bias on threshold selection and accuracy assessment of species distribution models. Ecography 2012, 35, 250–258. [Google Scholar] [CrossRef]
- Wisz, M.S.; Guisan, A. Do pseudo-absence selection strategies influence species distrbution models and their predictions? An information-theoretic approach based on simulated data. BMC Ecol. 2009, 9, 8. [Google Scholar] [CrossRef] [PubMed]
- Barbet-Massin, M.; Jiguet, F.; Albert, C.H.; Thuilller, W. Selecting pseudo-absences for species distributon models: How, where and how many? Methods Ecol. Evol. 2012, 3, 327–338. [Google Scholar] [CrossRef]
- Gauslaa, Y. Rain, dew, and humid air as drivers of morphology, function and spatial distribution in epiphytic lichens. Lichenologist 2014, 46, 1–16. [Google Scholar] [CrossRef] [Green Version]
- Chapman, D.S. Weak climatic associations among British plant distributions. Glob. Ecol. Biogeogr. 2010, 19, 831–841. [Google Scholar] [CrossRef]
- Beale, C.M.; Lennon, J.J.; Gimona, A. Opening the climate envelope reveals no macroscale associations with climate in European birds. Proc. Natl. Acad. Sci. USA 2008, 105, 14908–14912. [Google Scholar] [CrossRef] [PubMed] [Green Version]
- Moore, T.E.; Bagchi, R.; Aiello-Lammens, M.; Schlichting, C.D. Spatial autocorrelation inflates niche breadth-range size relationships. Glob. Ecol. Biogeogr. 2018, 27, 1426–1436. [Google Scholar] [CrossRef]
- Bahn, V.; McGill, B.J. Can niche-based distribution models outperform spatial interpolation? Glob. Ecol. Biogeogr. 2007, 16, 733–742. [Google Scholar] [CrossRef]
- Boucher-Lalonde, V.; Currie, D.J. Spatial autocorrelation can generate stronger correlations between range size and climatic niche than the biological signal—A demonstration using bird and mammal range maps. PLoS ONE 2016, 11, e0166243. [Google Scholar] [CrossRef] [PubMed]
- Van Herk, C.M.; Mathijssen-Spiekman, E.A.M.; De Zwart, D. Long distance nitrogen air pollution effects on lichens in Europe. Lichenologist 2003, 35, 347–359. [Google Scholar] [CrossRef]
- Van Dobben, H.F.; Ter Braak, C.J.F. Ranking of epiphytic lichen sensitivity to air pollution using survey data: A comparison of indicator scales. Lichenologist 1999, 31, 27–39. [Google Scholar]
- Stofer, S.; Bergamini, A.; Aragón, G.; Carvalho, P.; Coppins, B.J.; Davey, S.; Dietrich, M.; Farkas, E.; Kärkkäinen, K.; Keller, C.; et al. Species richness of lichen funtional groups in relation to land use intensity. Lichenologist 2006, 38, 331–353. [Google Scholar] [CrossRef]
- Wolseley, P.A.; Stofer, S.; Mitchell, R.; Truscott, A.-M.; Vanbergen, A.; Chimonides, J.; Scheidegger, C. Variation of lichen communities with landuse in Aberdeenshire, UK. Lichenologist 2006, 38, 307–322. [Google Scholar] [CrossRef]
- Lewis, M.A.; Pacala, S. Modeling and analysis of stochastic invasion processes. J. Math. Biol. 2000, 41, 387–429. [Google Scholar] [CrossRef] [PubMed]
- Hawksworth, D.L.; Rose, F. Qualitative scale for estimating sulphur dioxide air pollution in England and Wales using epiphytic lichens. Nature 1970, 227, 145–148. [Google Scholar] [CrossRef] [PubMed]
- Gilbert, O.L. A biological scale for the estimation of sulphur dioxide pollution. New Phytol. 1970, 69, 629–634. [Google Scholar] [CrossRef]
- Hill, D.J. Experimental study of the effect of sulphite in lichens with reference to atmospheric pollution. New Phytol. 1971, 70, 831–836. [Google Scholar] [CrossRef]
- Baddeley, M.S.; Ferry, B.W.; Finegan, E.J. The effects of sulphur dioxide on lichen respiration. Lichenologist 1972, 5, 283–291. [Google Scholar] [CrossRef]
- Beale, C.M.; Brewer, M.; Lennon, J.J. A new statistical framework for the quantification of covariate associations with species distributions. Methods Ecol. Evol. 2014, 5, 421–432. [Google Scholar] [CrossRef] [Green Version]
- Leach, K.; Montgomery, W.I.; Reid, N. Modelling the influence of biotic factors on species distribution patterns. Ecol. Model. 2016, 337, 96–106. [Google Scholar] [CrossRef] [Green Version]
- Coppins, B.J. Distribution patterns shown by epiphytic lichens in the British Isles. In Lichenology: Progress and Problems; Brown, D.H., Hawksworth, D.L., Bailey, R.H., Eds.; Academic Press: London, UK, 1976; pp. 249–278. [Google Scholar]
- Zedda, L.; Gröngröft, A.; Schultz, M.; Petersen, A.; Mills, A.; Rambold, G. Distribution patterns of soil lichens across the principal biomes of southern Africa. J. Arid Environ. 2011, 75, 215–220. [Google Scholar] [CrossRef]
- Brandt, L.A.; Benscoter, A.M.; Harvey, R.; Speroterra, C.; Bucklin, D.; Romañach, S.S.; Watling, J.I.; Mazzotti, F.J. Comparison of climate envelope models developed using expert-selected variables versus statistical selection. Ecol. Model. 2017, 345, 10–20. [Google Scholar] [CrossRef]
- Braidwood, D.W.; Ellis, C.J. Bioclimatic equilibrium for lichen distributions on disjunct continental landmasses. Botany 2012, 90, 1316–1325. [Google Scholar] [CrossRef]
- Ellis, C.J.; Yahr, R.; Belinchón, R.; Coppins, B.J. Archaeobotanical evidence for climate as a driver of ecological community change across the anthropocene boundary. Glob. Chang. Biol. 2014, 20, 2211–2220. [Google Scholar] [CrossRef]
- Eaton, S.; Ellis, C.J. Local experimental growth rates respond to macroclimate for the lichen epiphyte Lobaria pulmonaria. Plant Ecol. Divers. 2012, 5, 365–372. [Google Scholar] [CrossRef]
- Ellis, C.J.; Geddes, H.; McCheyne, N.; Stansfield, A. Lichen epiphyte response to non-analogue monthly climates: A critique of bioclimatic models. Perspect. Plant Ecol. Syst. 2017, 25, 45–58. [Google Scholar] [CrossRef]
- Green, T.G.A.; Nash, T.H.; Lange, O.L. Physiological ecology of carbon dioxide exchange. In Lichen Biology; Nash, T.H., Ed.; Cambridge University Press: Cambridge, UK, 2010; pp. 154–183. [Google Scholar]
- Palmqvist, K.; Dahlman, L.; Jonsson, A.; Nash, T.H. The carbon economy of lichens. In Lichen Biology; Nash, T.H., Ed.; Cambridge University Press: Cambridge, UK, 2010; pp. 184–217. [Google Scholar]
- Fačkovcová, Z.; Senko, D.; Svitok, M.; Guttová, A. Ecological niche conservatism shapes the distributions of lichens: Geographical segregation does not reflect ecological differentiation. Presalia 2017, 89, 63–85. [Google Scholar] [CrossRef]
- Allen, J.L.; Lendemer, J.C. Climate change impacts on endemic, high-elevation lichens in a biodiversity hotspot. Biodivers. Conserv. 2016, 25, 555–568. [Google Scholar] [CrossRef]
- Nascimbene, J.; Casazza, G.; Benesperi, R.; Catalano, I.; Cataldo, D.; Grillo, M.; Isocrono, D.; Matteucci, E.; Ongaro, S.; Potenza, G.; et al. Climate change fosters the decline of epiphytic Lobaria species in Italy. Biol. Conserv. 2016, 201, 377–384. [Google Scholar] [CrossRef]
- Kukwa, M.; Kolanowska, M. Glacial refugia and the prediction of future habitat coverage of the South American lichen species Ochrolechia austroamericana. Sci. Rep. 2016, 6, 38779. [Google Scholar] [CrossRef] [PubMed]
- Rubio-Salcedo, M.; Psomas, A.; Prieto, M.; Zimmermann, N.E.; Martínez, I. Case study of the implications of climate change for lichen diversity and distributions. Biodivers. Conserv. 2017, 26, 1121–1141. [Google Scholar] [CrossRef]
- Binder, M.D.; Ellis, C.J. Conservation of the rare British lichen Vulpicida pinastri: Changing climate, habitat loss and strategies for mitigation. Lichenologist 2008, 40, 63–79. [Google Scholar] [CrossRef]
- Ellis, C.J.; Yahr, R.; Coppins, B.J. Local extent of old-growth woodland modifies epiphyte response to climate change. J. Biogeogr. 2009, 36, 302–313. [Google Scholar] [CrossRef]
- Ellis, C.J.; Coppins, B.J.; Dawson, T.P. Predicted response of the lichen epiphyte Lecanora populicola to climate change scenarios in a clean-air region of northern Britain. Biol. Conserv. 2007, 135, 396–404. [Google Scholar] [CrossRef]
- Ellis, C.J.; Eaton, S.; Theodoropoulos, M.; Coppins, B.J.; Seaward, M.R.D.; Simkin, J. Response of epiphytic lichens to 21st Century climate change and tree disease scenarios. Biol. Conserv. 2014, 180, 153–164. [Google Scholar] [CrossRef]
- Ellis, C.J.; Eaton, S.; Theodoropoulos, M.; Coppins, B.J.; Seaward, M.R.D.; Simkin, J. Lichen Epiphyte Scenarios. A Toolkit of Climate and Woodland Change for the 21st Century; Royal Botanic Garden Edinburgh: Edinburgh, UK, 2015. [Google Scholar]
- Ellis, C.J.; Coppins, B.J.; Dawson, T.P.; Seaward, M.R.D. Response of British lichens to climate change scenarios: Trends and uncertainties in the projected impact for contrasting biogeographic groups. Biol. Conserv. 2007, 140, 217–235. [Google Scholar] [CrossRef]
- Nakićenović, N.; Swart, R. Special Report on Emissions Scenarios; Intergovernmental Panel on Climate Change 3rd Assessment Report: The Hague, The Netherlands, 2000. [Google Scholar]
- Van Vuuren, D.P.; Carter, T.R. Climate and socio-economic scenarios for climate change research and assessment: Reconciling the new with the old. Clim. Chang. 2014, 122, 415–429. [Google Scholar] [CrossRef]
- Moss, R.H.; Edmonds, J.A.; Hibbard, K.A.; Manning, M.R.; Rose, S.K.; Van Vuuren, D.P.; Carter, T.R.; Emori, S.; Kainuma, M.; Kram, T.; et al. The next generation of scenarios for climate change research and assessment. Nature 2010, 463, 747–756. [Google Scholar] [CrossRef] [PubMed]
- Bidussi, M.; Solhaug, K.A.; Gauslaa, Y. Increased snow accumulation reduces survival and growth in dominant mat-forming arctic-alpine lichens. Lichenologist 2016, 48, 237–247. [Google Scholar] [CrossRef]
- Scott, P.A.; Rouse, W.R. Impacts of increased winter snow cover on upland tundra vegetation: A case example. Clim. Res. 1995, 5, 25–30. [Google Scholar] [CrossRef]
- Wahren, C.-H.A.; Walker, M.D.; Bret-Harte, M.S. Vegetation responses in Alaskan arctic tundra after 8 years of a summer warming and winter snow manipulation experiment. Glob. Chang. Biol. 2005, 11, 537–552. [Google Scholar] [CrossRef]
- Cornelissen, J.H.C.; Callaghan, T.V.; Alatalo, J.M.; Michelsen, A.; Graglia, E.; Hartley, A.E.; Hik, D.S.; Hobbie, S.E.; Press, M.C.; Robinson, C.H.; et al. Global change and arctic ecosystems: Is lichen decline a function of increases in vascular plant biomass? J. Ecol. 2001, 89, 984–994. [Google Scholar] [CrossRef]
- Walker, M.D.; Wahren, C.H.; Hollister, R.D.; Henry, G.H.R.; Ahlquist, L.E.; Alatalo, J.M.; Bret-Harte, M.S.; Calef, M.P.; Callaghan, T.V.; Carroll, A.B.; et al. Plant community responses to experimental warming across the tundra biome. Proc. Natl. Acad. Sci. USA 2006, 103, 1342–1346. [Google Scholar] [CrossRef] [PubMed] [Green Version]
- Alatalo, J.M.; Jägerbrand, A.K.; Chen, S.; Molau, U. Responses of lichen communities to 18 yrs of natural and experimental warming. Ann. Bot. 2017, 120, 159–170. [Google Scholar] [CrossRef] [PubMed]
- Niittynen, P.; Luoto, M. The importance of snow in species distribution models of arctic vegetation. Ecography 2018, 41, 1024–1037. [Google Scholar] [CrossRef]
- Mod, H.K.; Heikkinen, R.K.; le Roux, P.C.; Väre, H.; Luoto, M. Contrasting effects of biotic interactions on richness and distribution of vascular plants, bryophytes and lichens in an arctic-alpine landscape. Polar Biol. 2016, 39, 649–657. [Google Scholar] [CrossRef]
- Mod, H.K.; Le Roux, P.C.; Guisan, A.; Luoto, M. Biotic interactions boost spatial models of species richness. Ecography 2015, 38, 913–921. [Google Scholar] [CrossRef] [Green Version]
- Leckebusch, G.C.; Ulbrich, U. On the relationship between cyclones and extreme windstorm events over Europe under climate change. Glob. Planet. Chang. 2004, 44, 181–193. [Google Scholar] [CrossRef]
- Schwierz, C.; Köllner-Heck, P.; Mutter, E.Z.; Bresch, D.N.; Vidale, P.-L.; Schär, C. Modelling European winter wind strom losses in current and future climate. Clim. Chang. 2010, 101, 485–514. [Google Scholar] [CrossRef]
- Crabtree, D.; Ellis, C.J. Species interaction and response to wind speed alter the impact of projected temperature change in a montane ecosystem. J. Veg. Sci. 2010, 21, 744–760. [Google Scholar] [CrossRef]
- Williams, J.W.; Jackson, S.T. Novel climates, no-analog communities, and ecological surprises. Front. Ecol. Environ. 2007, 5, 475–482. [Google Scholar] [CrossRef] [Green Version]
- Fitzpatrick, M.C.; Hargrove, W.W. The projection of species distribution models and the problem of non-analog climate. Biodivers. Conserv. 2009, 18, 2255–2261. [Google Scholar] [CrossRef]
- Ellis, C.J.; Eaton, S. Future non-analogue climates for Scotland’s temperate rainforest. Scott. Geogr. J. 2016, 132, 257–268. [Google Scholar] [CrossRef]
- Ellis, C.J. Oceanic and temperate rainforest climates and their epiphyte indicators in Britain. Ecol. Indic. 2016, 70, 125–133. [Google Scholar] [CrossRef]
- Austin, M. Species distribution models and ecological theory: A critical assessment and some possible new approaches. Ecol. Model. 2007, 200, 1–19. [Google Scholar] [CrossRef]
- Austin, M.P. Spatial prediction of species distributions: An interface between ecological theory and statistical modelling. Ecol. Model. 2002, 157, 101–118. [Google Scholar] [CrossRef]
- Higgins, S.I.; O’Hara, R.B.; Römermann, C. A niche for biology in species distribution models. J. Biogeogr. 2012, 39, 2091–2095. [Google Scholar] [CrossRef]
- Palmqvist, K.; Sundberg, B. Light use efficiency of dry matter gain in five macro-lichens: Relative impact of microclimate conditions and species-specific traits. Plant Cell Environ. 2000, 23, 1–14. [Google Scholar] [CrossRef]
- Sundberg, B.; Ekbald, A.; Näsholm, T.; Palmqvist, K. Lichen respiration in relation to active time, temperature, nitrogen and ergosterol concentrations. Funct. Ecol. 1999, 13, 119–125. [Google Scholar] [CrossRef] [Green Version]
- Sundberg, B.; Palmqvist, K.; Esseen, P.-A.; Renhorn, K.-E. Growth and vitality of epiphytic lichens II. Modelling of carbon gain using field and laboratory data. Oecologia 1997, 109, 10–18. [Google Scholar] [CrossRef]
- Crichton, D. The Risk Triangle. In Natural Disaster Management; Ingleton, J., Ed.; Tudor Rose: London, UK, 1999; pp. 102–103. [Google Scholar]
- Cardona, O.D.; van Aalst, M.K.; Birkmann, J.; Fordham, M.; McGregor, G.; Perez, R.; Pulwarty, R.S.; Schipper, E.L.F.; Sinh, B.T. Determinants of risk: Exposure and vulnerability. In Managing the Risks of Extreme Events and Disasters to Advance Climate Change Adaptation. A Special Report of Working Groups I and II of the Intergovernmental Panel on Climate Change (IPCC); Field, C.B., Barros, V., Stocker, T.F., Qin, D., Dokken, D.J., Ebi, K.L., Mastrandrea, M.D., Mach, K.J., Plattner, G.K., Allen, S.K., et al., Eds.; Cambridge University Press: Cambridge, UK, 2012. [Google Scholar]
- Ellis, C.J. A risk-based model of climate change threat: Hazard, exposure, and vulnerability in the ecology of lichen epiphytes. Botany 2013, 91, 1–11. [Google Scholar] [CrossRef]
- Armstrong, R.A. Dispersal in a population of the lichen Hypogymnia physodes. Environ. Exp. Bot. 1987, 27, 357–363. [Google Scholar] [CrossRef]
- Armstrong, R.A. Soredial dispersal from individual soralia in the lichen Hypogymnia physodes (L.) Nyl. Environ. Exp. Bot. 1992, 32, 55–63. [Google Scholar] [CrossRef]
- Walser, J.-C.; Zoller, S.; Büchler, U.; Scheidegger, C. Species-specific detection of Lobaria pulmonaria (lichenized ascomycete) diaspores in litter samples trapped in snow cover. Mol. Ecol. 2001, 10, 2129–2138. [Google Scholar] [CrossRef]
- Werth, S.; Wagner, H.H.; Gugerli, F.; Holderegger, R.; Csencsics, D.; Kalwij, J.M.; Scheidegger, C. Quantifying dispersal and establishment limitation in a population of an epiphytic lichen. Ecology 2006, 87, 2037–2046. [Google Scholar] [CrossRef]
- Wagner, H.H.; Werth, S.; Kalwij, J.M.; Bolli, J.C.; Scheidegger, C. Modelling forest recolonization by an epiphytic lichen using a landscape genetic approach. Landsc. Ecol. 2006, 21, 849–865. [Google Scholar] [CrossRef]
- Williams, L.; Ellis, C.J. Ecological constraints to ‘old-growth’ lichen indicators: Niche specialism or dispersal limitation? Fungal Ecol. 2018, 34, 20–27. [Google Scholar] [CrossRef]
- Öckinger, E.; Niklasson, M.; Nilsson, S.G. Is local distribution of the epiphytic lichen Lobaria pulmonaria limited by dispersal capacity or habitat quality? Biodivers. Conserv. 2005, 14, 759–773. [Google Scholar] [CrossRef]
- Belinchón, R.; Harrison, P.J.; Mair, L.; Várkonyi, G.; Snäll, T. Local epiphyte establishment and future metapopulation dynamics in landscapes with different spatiotemporal properties. Ecology 2017, 98, 741–750. [Google Scholar] [CrossRef] [Green Version]
- Dettki, H.; Klintberg, P.; Esseen, P.-A. Are epiphytic lichens in young forests limited by local dispersal? Écoscience 2000, 7, 317–325. [Google Scholar] [CrossRef]
- Gjerde, I.; Blom, H.; Heegaard, E.; Sætersdal, M. Lichen colonization patterns show minor effects of dispersal distance at landscape scale. Ecography 2015, 38, 939–948. [Google Scholar] [CrossRef]
- Hedenås, H.; Ericson, L. Species occurrence at the stand level cannot be understood without considering the landscape context: Cyanolichens on aspen in boreal Sweden. Biol. Conserv. 2008, 141, 710–718. [Google Scholar] [CrossRef]
- Geml, J.; Kauff, F.; Brochmann, C.; Taylor, D.L. Surviving climate changes: High genetic diversity and transoceanic gene flow in two arctic-alpine lichens, Flavocetraria cucullata and F. nivalis (Parmeliaceae, Ascomycota). J. Biogeogr. 2010, 37, 1529–1542. [Google Scholar] [CrossRef]
- Buschbom, J. Migration between continents: Geographical structure and long-distance gene flow in Porpidia flavicunda (lichen-forming Ascomycota). Mol. Ecol. 2007, 16, 1835–1846. [Google Scholar] [CrossRef]
- Löbel, S.; Snäll, T.; Rydin, H. Species richness patterns and metapopulation processes—Evidence from epiphyte communities in boreo-nemoral forests. Ecography 2006, 29, 169–182. [Google Scholar] [CrossRef]
- Gjerde, I.; Blom, H.; Lindblom, L.; Sætersdal, M.; Schei, F.H. Community assembly in epiphytic lichens in early stages of colonization. Ecology 2012, 93, 749–759. [Google Scholar] [CrossRef] [PubMed]
- Hedenås, H.; Ericson, L. Epiphytic macrolichens as conservation indicators: Successional sequence in Populus tremula stands. Biol. Conserv. 2000, 93, 43–53. [Google Scholar] [CrossRef]
- Werth, S.; Wagner, H.H.; Holderegger, R.; Kalwij, J.M.; Scheidegger, C. Effect of disturbance on the genetic diversity of an old-forest associated lichen. Mol. Ecol. 2006, 15, 911–921. [Google Scholar] [CrossRef]
- Walser, J.-C. Molecular evidence for the limited dispersal of vegetative propagules in the epiphytic lichen Lobaria pulmonaria. Am. J. Bot. 2004, 91, 1273–1276. [Google Scholar] [CrossRef]
- Jüriado, I.; Liira, J.; Csencsics, D.; Widmer, I.; Adolf, C.; Kohv, K.; Scheidegger, C. Dispersal ecology of the endangered woodland lichen Lobaria pulmonaria in managed hemiboreal forest landscape. Biodivers. Conserv. 2011, 20, 1803–1819. [Google Scholar] [CrossRef]
- Ronnås, C.; Werth, S.; Ovaskainen, O.; Várkonyi, G.; Scheidegger, C.; Snäll, T. Discovery of long-distance gamete dispersal in a lichen-forming ascomycete. New Phytol. 2017, 216, 216–226. [Google Scholar] [CrossRef] [PubMed]
- Belinchón, R.; Ellis, C.J.; Yahr, R. Climate-woodland effects on population genetics for two congeneric lichens with contrasting reproductive strategies. FEMS Microbiol. Ecol. 2018, 94, fiy159. [Google Scholar] [CrossRef] [PubMed]
- Rikkinen, J.; Oksanen, J.; Lohtander, K. Lichen guilds share related cyanobacterial symbionts. Science 2002, 297, 357. [Google Scholar] [CrossRef] [PubMed]
- Belinchón, R.; Yahr, R.; Ellis, C.J. Interactions among species with contrasting dispersal modes explain distributions for epiphytic lichens. Ecography 2015, 38, 762–768. [Google Scholar] [CrossRef]
- Fedrowitz, K.; Kaasalainen, U.; Rikkinen, J. Genotype variability of Nostoc symbionts associated with three epiphytic Nephroma species in a boreal forest landscape. Bryologist 2011, 114, 220–230. [Google Scholar] [CrossRef]
- Otálora, M.A.G.; Martínez, I.; Belinchón, R.; Widmer, I.; Aragón, G.; Escurado, A.; Scheidegger, C. Remnant fragments preserve genetic diversity of the old forest lichen Lobaria pulmonaria in a fragmented Mediterranean mountain forest. Biodivers. Conserv. 2011, 20, 1239–1254. [Google Scholar] [CrossRef]
- Scheidegger, C.; Bilovitz, P.O.; Werth, S.; Widmer, I.; Mayrhofer, H. Hitchhiking with forests: Population genetics of the epiphytic lichen Lobaria pulmonaria in primeval and managed forests in southeastern Europe. Ecol. Evol. 2012, 2, 2223–2240. [Google Scholar] [CrossRef] [PubMed]
- Murtagh, G.J.; Dyer, P.S.; Furneaux, P.A.; Crittenden, P.D. Molecular and physiological diversity in the bipolar lichen-forming fungus Xanthoria elegans. Mycol. Res. 2002, 106, 1277–1286. [Google Scholar] [CrossRef]
- Nadyeina, O.; Dymytrova, L.; Naumovych, A.; Postoyalkin, S.; Werth, S.; Cheenacharoen, S.; Scheidegger, C. Microclimatic differentiation of gene pools in the Lobaria pulmonaria symbiosis in a primeval forest landscape. Mol. Ecol. 2014, 23, 5164–5178. [Google Scholar] [CrossRef]
- Keller, C.; Scheidegger, C. Multiple mating events and spermatia-mediated gene flow in the lichen-forming fungus Lobaria pulmonaria. Herzogia 2016, 29, 435–450. [Google Scholar] [CrossRef]
- Singh, G.; Dal Grande, F.; Werth, S.; Scheidegger, C. Long-term consequences of disturbances on reproductive strategies of the rare epiphytic lichen Lobaria pulmonaria: Clonality a gift and a curse. FEMS Microbiol. Ecol. 2015, 91, fiu009. [Google Scholar] [CrossRef]
- Lange, O.L.; Green, T.G.A. Lichens show that fungi can acclimate their respiration to seasonal changes in temperature. Oecologia 2005, 142, 11–19. [Google Scholar] [CrossRef]
- Larson, D.W.; Kershaw, K.A. Acclimation in arctic lichens. Nature 1975, 254, 421–423. [Google Scholar] [CrossRef]
- Colesie, C.; Büdel, B.; Hurry, V.; Green, T.G.A. Can Antarctic lichens acclimatize to changes in temperature? Glob. Chang. Biol. 2018, 24, 1123–1135. [Google Scholar] [CrossRef] [PubMed]
- Gauslaa, Y.; Solhaug, K.A.; Longinotti, S. Functional traits prolonging photosynthetically active periods in epiphytic lichens during desiccation. Environ. Exp. Bot. 2017, 141, 83–91. [Google Scholar] [CrossRef]
- Phinney, N.H.; Solhaug, K.A.; Gauslaa, Y. Rapid resurrection of chlorolichens in humid air: Specific thallus mass drives rehydration and reactivation kinetics. Environ. Exp. Bot. 2018, 148, 184–191. [Google Scholar] [CrossRef]
- Larsson, P.; Solhaug, K.A.; Gauslaa, Y. Seasonal partitioning of growth into biomass and area expansion in a cephalolichen and a cyanolichen of the old forest genus Lobaria. New Phytol. 2012, 194, 991–1000. [Google Scholar] [CrossRef] [PubMed]
- Gauslaa, Y.; Coxson, D. Interspecific and intraspecific variations in water storage in epiphytic old forest lichens. Botany 2011, 89, 787–798. [Google Scholar] [CrossRef]
- Gauslaa, Y.; Lie, M.; Solhaug, K.A.; Ohlson, M. Growth and ecophysiological acclimation of the foliose lichen Lobaria pulmonaria in forests with contrasting light climates. Oecologia 2006, 147, 406–416. [Google Scholar] [CrossRef]
- Gauslaa, Y.; Palmqvist, K.; Solhaug, K.A.; Holien, H.; Nybakken, L.; Ohlson, M. Size-dependent growth of two old-growth associated macrolichen species. New Phytol. 2009, 181, 683–692. [Google Scholar] [CrossRef]
- Merinero, S.; Hilmo, O.; Gauslaa, Y. Size is a main driver for hydration traits in cyano- and cephalolichens of boreal rainforest canopies. Fungal Ecol. 2014, 7, 59–66. [Google Scholar] [CrossRef]
- Gaio-Oliveira, G.; Dahlman, L.; Máguas, C.; Palmqvist, K. Growth in relation to microclimatic conditions and physiological characteristics of four Lobaria pulmonaria populations in two contrasting habitats. Ecography 2004, 27, 13–28. [Google Scholar] [CrossRef]
- Longinotti, S.; Solhaug, K.A.; Gauslaa, Y. Hydration traits in cephalolichen members of the epiphytic old forest genus Lobaria (s.lat). Lichenologist 2017, 49, 493–506. [Google Scholar] [CrossRef]
- Yahr, R.; Vilgalys, R.; DePriest, P.T. Geographic variation in algal partners of Cladonia subtenuis (Cladoniaceae) highlights the dynamic nature of a lichen symbiosis. New Phytol. 2006, 171, 847–860. [Google Scholar] [CrossRef] [PubMed]
- Nelsen, M.P.; Gargas, A. Symbiont flexibility in Thamnolia vermicularis (Pertusariales: Icmadophilaceae). Bryologist 2009, 112, 404–417. [Google Scholar] [CrossRef]
- Nelsen, M.P.; Gargas, A. Dissociation and horizontal transmission of codispersing lichen symbionts in the genus Lepraria (Lecanorales: Stereocaulaceae). New Phytol. 2008, 177, 264–275. [Google Scholar] [CrossRef] [PubMed]
- Piercey-Normore, M.D. The lichen-forming ascomycete Evernia mesomorpha associates with multiple genotypes of Trebouxia jamesii. New Phytol. 2006, 169, 331–344. [Google Scholar] [CrossRef]
- Determeyer-Wiedmann, N.; Sadowsky, A.; Convey, P.; Ott, S. Physiological life strategies of photobionts of lichen species from Antarctic and moderate European habitats in response to stressful conditions. Polar Biol. 2019, 42, 395–405. [Google Scholar] [CrossRef]
- Casano, L.M.; del Campo, E.M.; García-Breijo, F.J.; Reig-Armiñana, J.; Gasulla, F.; del Hoyo, A.; Guéra, A.; Barreno, E. Two Trebouxia algae with different physiological performances are ever-present in lichen thalli of Ramalina farinacea. Coexistence or competition? Enviro. Microbiol. 2011, 13, 806–818. [Google Scholar] [CrossRef]
- Fernández-Mendoza, F.; Domaschke, S.; García, M.A.; Jordan, P.; Martín, M.P.; Printzan, C. Population structure of mycobionts and photobionts of the widespread lichen Cetraria aculeata. Mol. Ecol. 2011, 20, 1208–1232. [Google Scholar] [CrossRef] [PubMed]
- Dal Grande, F.; Rolshausen, G.; Divakar, P.K.; Crespo, A.; Otte, J.; Schleuning, M.; Schmitt, I. Environment and host identity structure communities of green algal symbionts in lichens. New Phytol. 2017, 217, 277–289. [Google Scholar] [CrossRef] [PubMed] [Green Version]
- Domaschke, S.; Vivas, M.; Sancho, L.G.; Printzen, C. Ecophysiology and genetic structure of polar versus temperature populations of the lichen Cetraria aculeata. Oecologia 2013, 173, 699–709. [Google Scholar] [CrossRef] [PubMed]
- Rolhausen, G.; Dal Grande, F.; Sadowska-Deś, A.D.; Otte, J.; Schmitt, I. Quantifying the climatic niche of symbiont partners in a lichen symbiosis indicates mutualist-mediated niche expansions. Ecography 2018, 41, 1380–1392. [Google Scholar] [CrossRef]
- Vančurová, L.; Muggia, L.; Peksa, O.; Řídká, T.; Škaloud, P. The complexity of symbiotic interactions influences the ecological amplitude of the host: A case study in Stereocaulon (lichenized Ascomycota). Mol. Ecol. 2018, 27, 3016–3033. [Google Scholar] [CrossRef] [PubMed]
- Williams, L.; Colesie, C.; Ullman, A.; Westberg, M.; Wedin, M.; Büdel, B. Lichen acclimation to changing environments: Photobiont switching vs. climate-specific uniqueness in Psora decipiens. Ecol. Evol. 2017, 7, 2560–2574. [Google Scholar] [CrossRef] [PubMed]
- Scherrer, D.; Körner, C. Infra-red thermometry of alpine landscapes challenges climate warming projections. Glob. Chang. Biol. 2010, 16, 2602–2613. [Google Scholar]
- Scherrer, D.; Körner, C. Topographically controlled thermal-habitat differentiation buffers alpine plant diversity against climate warming. J. Biogeogr. 2011, 38, 406–416. [Google Scholar] [CrossRef]
- John, E.; Dale, M.R.T. Determinants of spatial patterns in saxicolous lichen communities. Lichenologist 1991, 23, 227–236. [Google Scholar] [CrossRef]
- John, E.A. Fine scale patterning of species distributions in a saxicolous lichen community at Jonas Rockslide, Canadian Rocky Mountains. Holarct. Ecol. 1990, 13, 187–194. [Google Scholar] [CrossRef]
- Rodriguez, J.M.; Renison, D.; Filippini, E.; Estrabou, C. Small shifts in microsite occupation could mitigate climate change consequences for mountain top endemics: A test analyzing saxicolous lichen distribution patterns. Biodivers. Conserv. 2017, 26, 1199–1215. [Google Scholar] [CrossRef]
- Rull, V. Microrefugia. J. Biogeogr. 2009, 36, 481–484. [Google Scholar] [CrossRef] [Green Version]
- Dobrowski, S.Z. A climatic basis for microrefugia: The influence of terrain on climate. Glob. Chang. Biol. 2010, 17, 1022–1035. [Google Scholar] [CrossRef]
- Goward, T. Nephroma occultum and the maintenance of lichen diversity in British Columbia. For. Snow Landsc. Res. 1995, 70, 93–101. [Google Scholar]
- Lidén, M.; Hilmo, O. Population characteristics of the suboceanic lichen Platismatia norvegica in core and fringe habitats: Relations to macroclimate, substrate, and proximity to streams. Bryologist 2005, 108, 506–517. [Google Scholar] [CrossRef]
- Lisewski, V.; Ellis, C.J. Epiphyte sensitivity to a cross-scale interaction between habitat quality and macroclimate: An opportunity for range-edge conservation. Biodivers. Conserv. 2010, 19, 3935–3949. [Google Scholar] [CrossRef]
- Goward, T. Notes on old growth-dependent epiphytic macrolichens in inland British Columbia, Canada. Acta Bot. Fenn. 1994, 150, 31–38. [Google Scholar]
- Arsenault, A.; Goward, T. Macrolichen diversity as an indicator of stand age and ecosystem reslience along a precipitation gradient in humid forests of inland British Columbia, Canada. Ecol. Indic. 2016, 69, 730–738. [Google Scholar] [CrossRef]
- Lesica, P.; McCune, B.; Cooper, S.V.; Hong, W.S. Differences in lichen and bryophyte communities between old-growth and managed second-growth forests in the Swan Valley, Montana. Can. J. Bot. 1991, 69, 1745–1755. [Google Scholar] [CrossRef]
- McCune, B.; Antos, J.A. Epiphyte communities of the Swan Valley, Montana. Bryologist 1982, 85, 1–12. [Google Scholar] [CrossRef]
- Radies, D.; Coxson, D.S.; Johnson, C.; Konwicki, K. Predicting canopy macrolichen diversity and abundance within old-growth inland temperate rainforests. For. Ecol. Manag. 2009, 259, 86–97. [Google Scholar] [CrossRef]
- Goward, T.; Arseneau, A. Inland old-growth rain forests: safe havens for rare lichens? In Proceedings, The Management of Species and Habitats at Risk. Volume 2; Darling, L.M., Ed.; Ministry of Environment, Land and Parks: Victoria, UK, 1999. [Google Scholar]
- Van Herk, C.M.; Aptroot, A.; Van Dobben, H.F. Long-term monitoring in the Netherlands suggests that lichens respond to global warming. Lichenologist 2002, 34, 141–154. [Google Scholar] [CrossRef]
- Aptroot, A.; Van Herk, C.M. Further evidence of the effects of global warming on lichens, particularly those with Trentepohlia phycobionts. Environ. Pollut. 2007, 146, 293–298. [Google Scholar] [CrossRef] [PubMed]
- Lättman, H.; Milberg, P.; Palmer, M.W.; Mattson, J.-E. Changes in the distribution of epiphytic lichens in southern Sweden using a new statistical method. Nord. J. Bot. 2009, 27, 413–418. [Google Scholar] [CrossRef]
- Ellis, C.J.; Binder, M.D. Inferred shift in the British distribution of Vulpicida pinastri using herbarium and mapping data. Bull. Br. Lichen Soc. 2007, 101, 4–10. [Google Scholar]
- Søchting, U. Flavoparmelia caperata—A probable indicator of increased temperatures in Denmark. Graph. Scr. 2004, 15, 53–56. [Google Scholar]
- Ohmura, Y.; Seaward, M.R.D. Is Glyphis cicatricosa an indicator for ‘global warming’ or an ‘urban heat island’ effect in Japan? Lichenologist 2017, 49, 291–296. [Google Scholar] [CrossRef]
- Dawson, T.P.; Jackson, S.T.; House, J.I.; Prentice, I.C.; Mace, G.M. Beyond predictions: Biodiversity conservation in a changing climate. Science 2011, 332, 53–58. [Google Scholar] [CrossRef] [PubMed]
- Thomas, C.D.; Hill, J.K.; Anderson, B.J.; Bailey, S.; Beale, C.M.; Bradbury, R.B.; Bulman, C.R.; Crick, H.Q.P.; Eigenbrod, F.; Griffiths, H.M.; et al. A framework for assessing threats and benefits to species responding to climate change. Methods Ecol. Evol. 2011, 2, 125–142. [Google Scholar] [CrossRef]
- Ellis, C.J.; Eaton, S. The biogeography of climate change risk for Scotland’s woodland biodiversity: Epiphytes. Scott. Geogr. J. 2018, 134, 257–267. [Google Scholar] [CrossRef]
- Smith, R.J.; Nelson, P.R.; Jovan, S.; Hanson, P.J.; McCune, B. Novel climates reverse carbon uptake of atmospherically dependent epiphytes: Climatic constraints on the iconic boreal forest lichen Evernia mesomorpha. Am. J. Bot. 2018, 105, 1–9. [Google Scholar] [CrossRef] [PubMed]
- Ellis, C.J. A mechanistic model of climate change risk: Growth rates and microhabitat specificity for conservation priority woodland epiphytes. Perspect. Plant Ecol. Syst. 2018, 32, 38–48. [Google Scholar] [CrossRef]
Figure 1.
Example decision making framework for bioclimatic modelling; choice of species drives an initial ecological model that should consider how evidence from physiological studies might inform predictor variables (climate and covariables); species choice may also determine the relevant available distributional data, which needs to match at extent and resolution with the predictors; the ecological model (whether linear, nonlinear, with or without interactions) combines with the structure of response-predictor data to further determine the choice of statistical method; the statistical method is applied and tested and once validated is projected to the baseline and climate change scenarios; the use of scenarios can constrain the choice of predictors, in order to ensure that these are available at the same extent/resolution for both the baseline and climate change scenarios.

Figure 2.
Graphic to demonstrate a null hypothesis of climatic control. (A.) Species larger-scale distributions can be shaped by long distance dispersal; (B.) Irrespective of environmental control, short distance dispersal can create aggregated distributions on ecological timescales; (C.) This aggregated distribution is compared to an autocorrelated climate surface to generate a ‘good’ statistical model; (D.) Randomly positioning the aggregated distribution in an alternative part of geographic space would generate a different but equally good model, rendering diagnostics for model fit spurious as hypothesis tests for climatic control of species distributions.

Figure 3.
Graphic to demonstrate the potential for nonanalogue climates. Graphs (A.) (baseline) and (B.) (scenario) have the same annual total precipitation for a theoretical study site but distributed differently throughout the year; this can generate a contrasting relationship between precipitation totals and number of rain-days as alternative predictors of moisture availability. Furthermore, monthly precipitation totals have a different relationship with the solar cycle of photosynthetic photon flux density (PPFD) when comparing (A.) with similar moisture availability for low and high light periods and (B.) with higher moisture during a low light, and lower moisture during a high light period. Considering alternative interacting covariables such as light availability opens up the wide potential for nonanalogue climates, as future climate change is expected to shift moisture patterns seasonally, monthly and with respect to annual solar cycles.

Figure 4.
Bioclimatic models can be used to frame questions about species vulnerability and climate change risk; the solid-line envelope of suitable climate at the baseline may shift spatially under a climate change scenario (dashed-line envelope). Consequently: species may or may not be able to migrate among habitat patches to track this shifted suitable climate, or individual populations at the colder range edge (baseline) may transition towards the warmer range edge under climate change and may therefore need to adapt, depending on standing genetic diversity and gene flow, or acclimate through phenotypic plasticity including photobiont switching.

Figure 5.
Conceptually, bioclimatic models estimating exposure to larger-scale climate change can be cross-referenced with a species ecological response relating to habitat specialisation and microclimatic niche availability, dispersal rate, genetic diversity or acclimation potential, in order to map an overall climate change risk score and to identify indicator species for conservation.


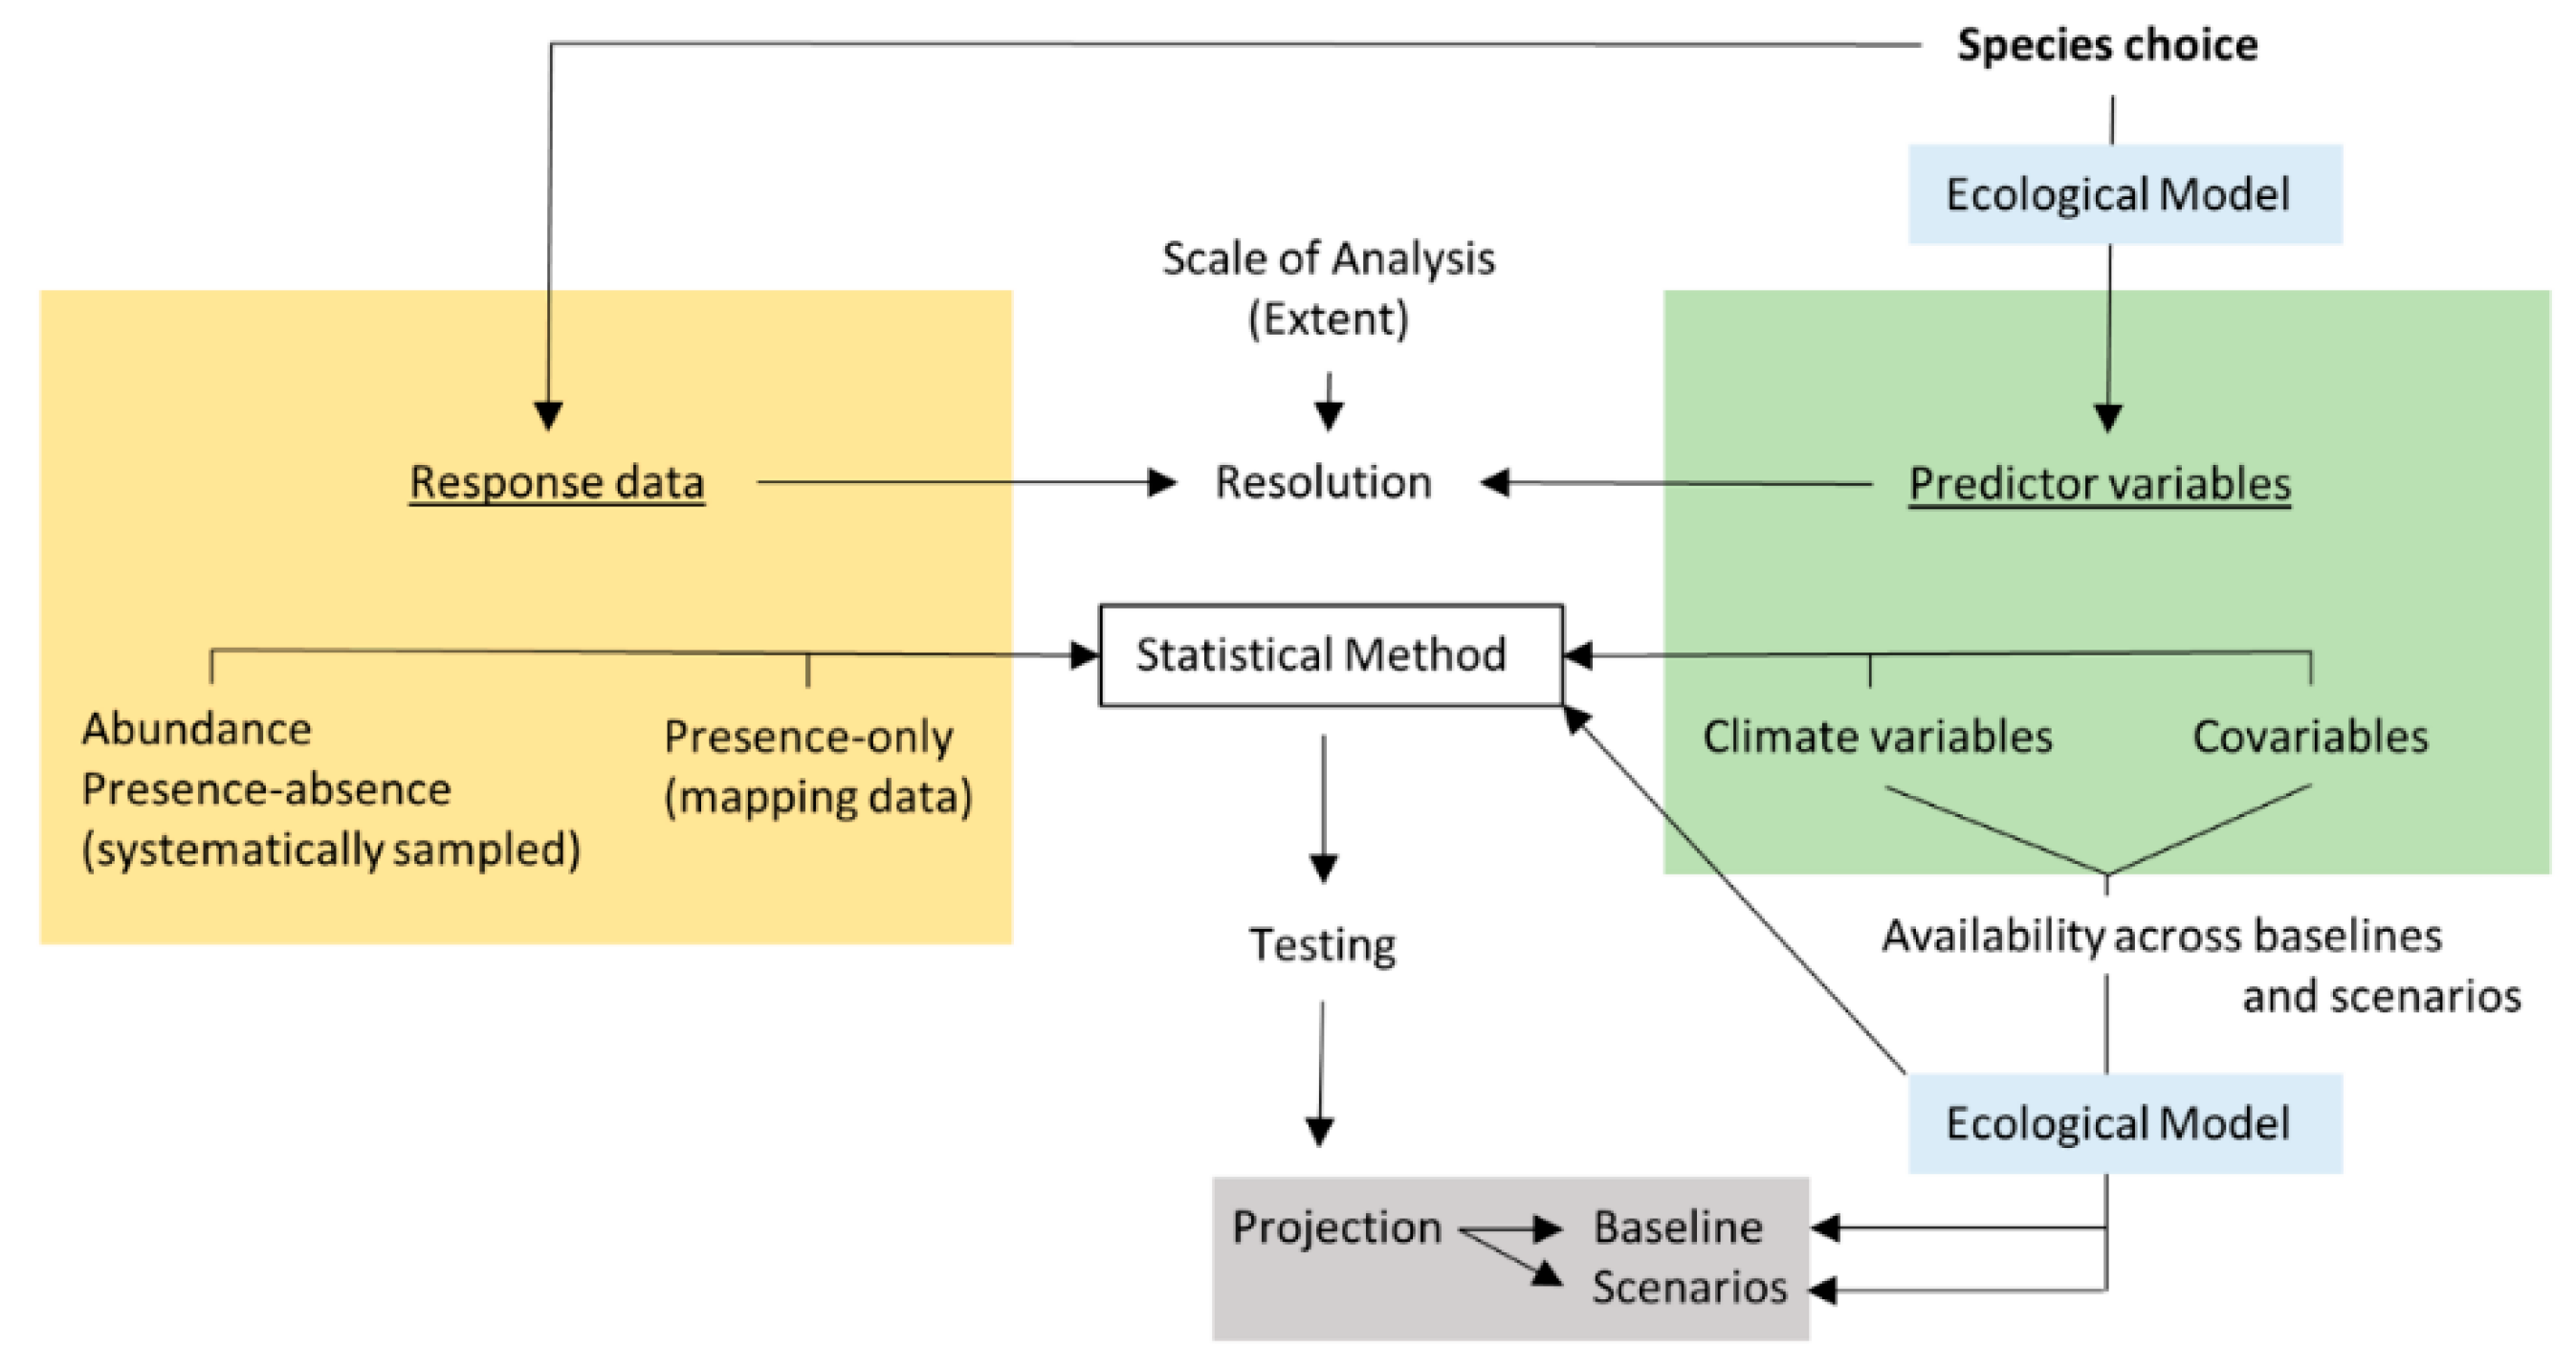
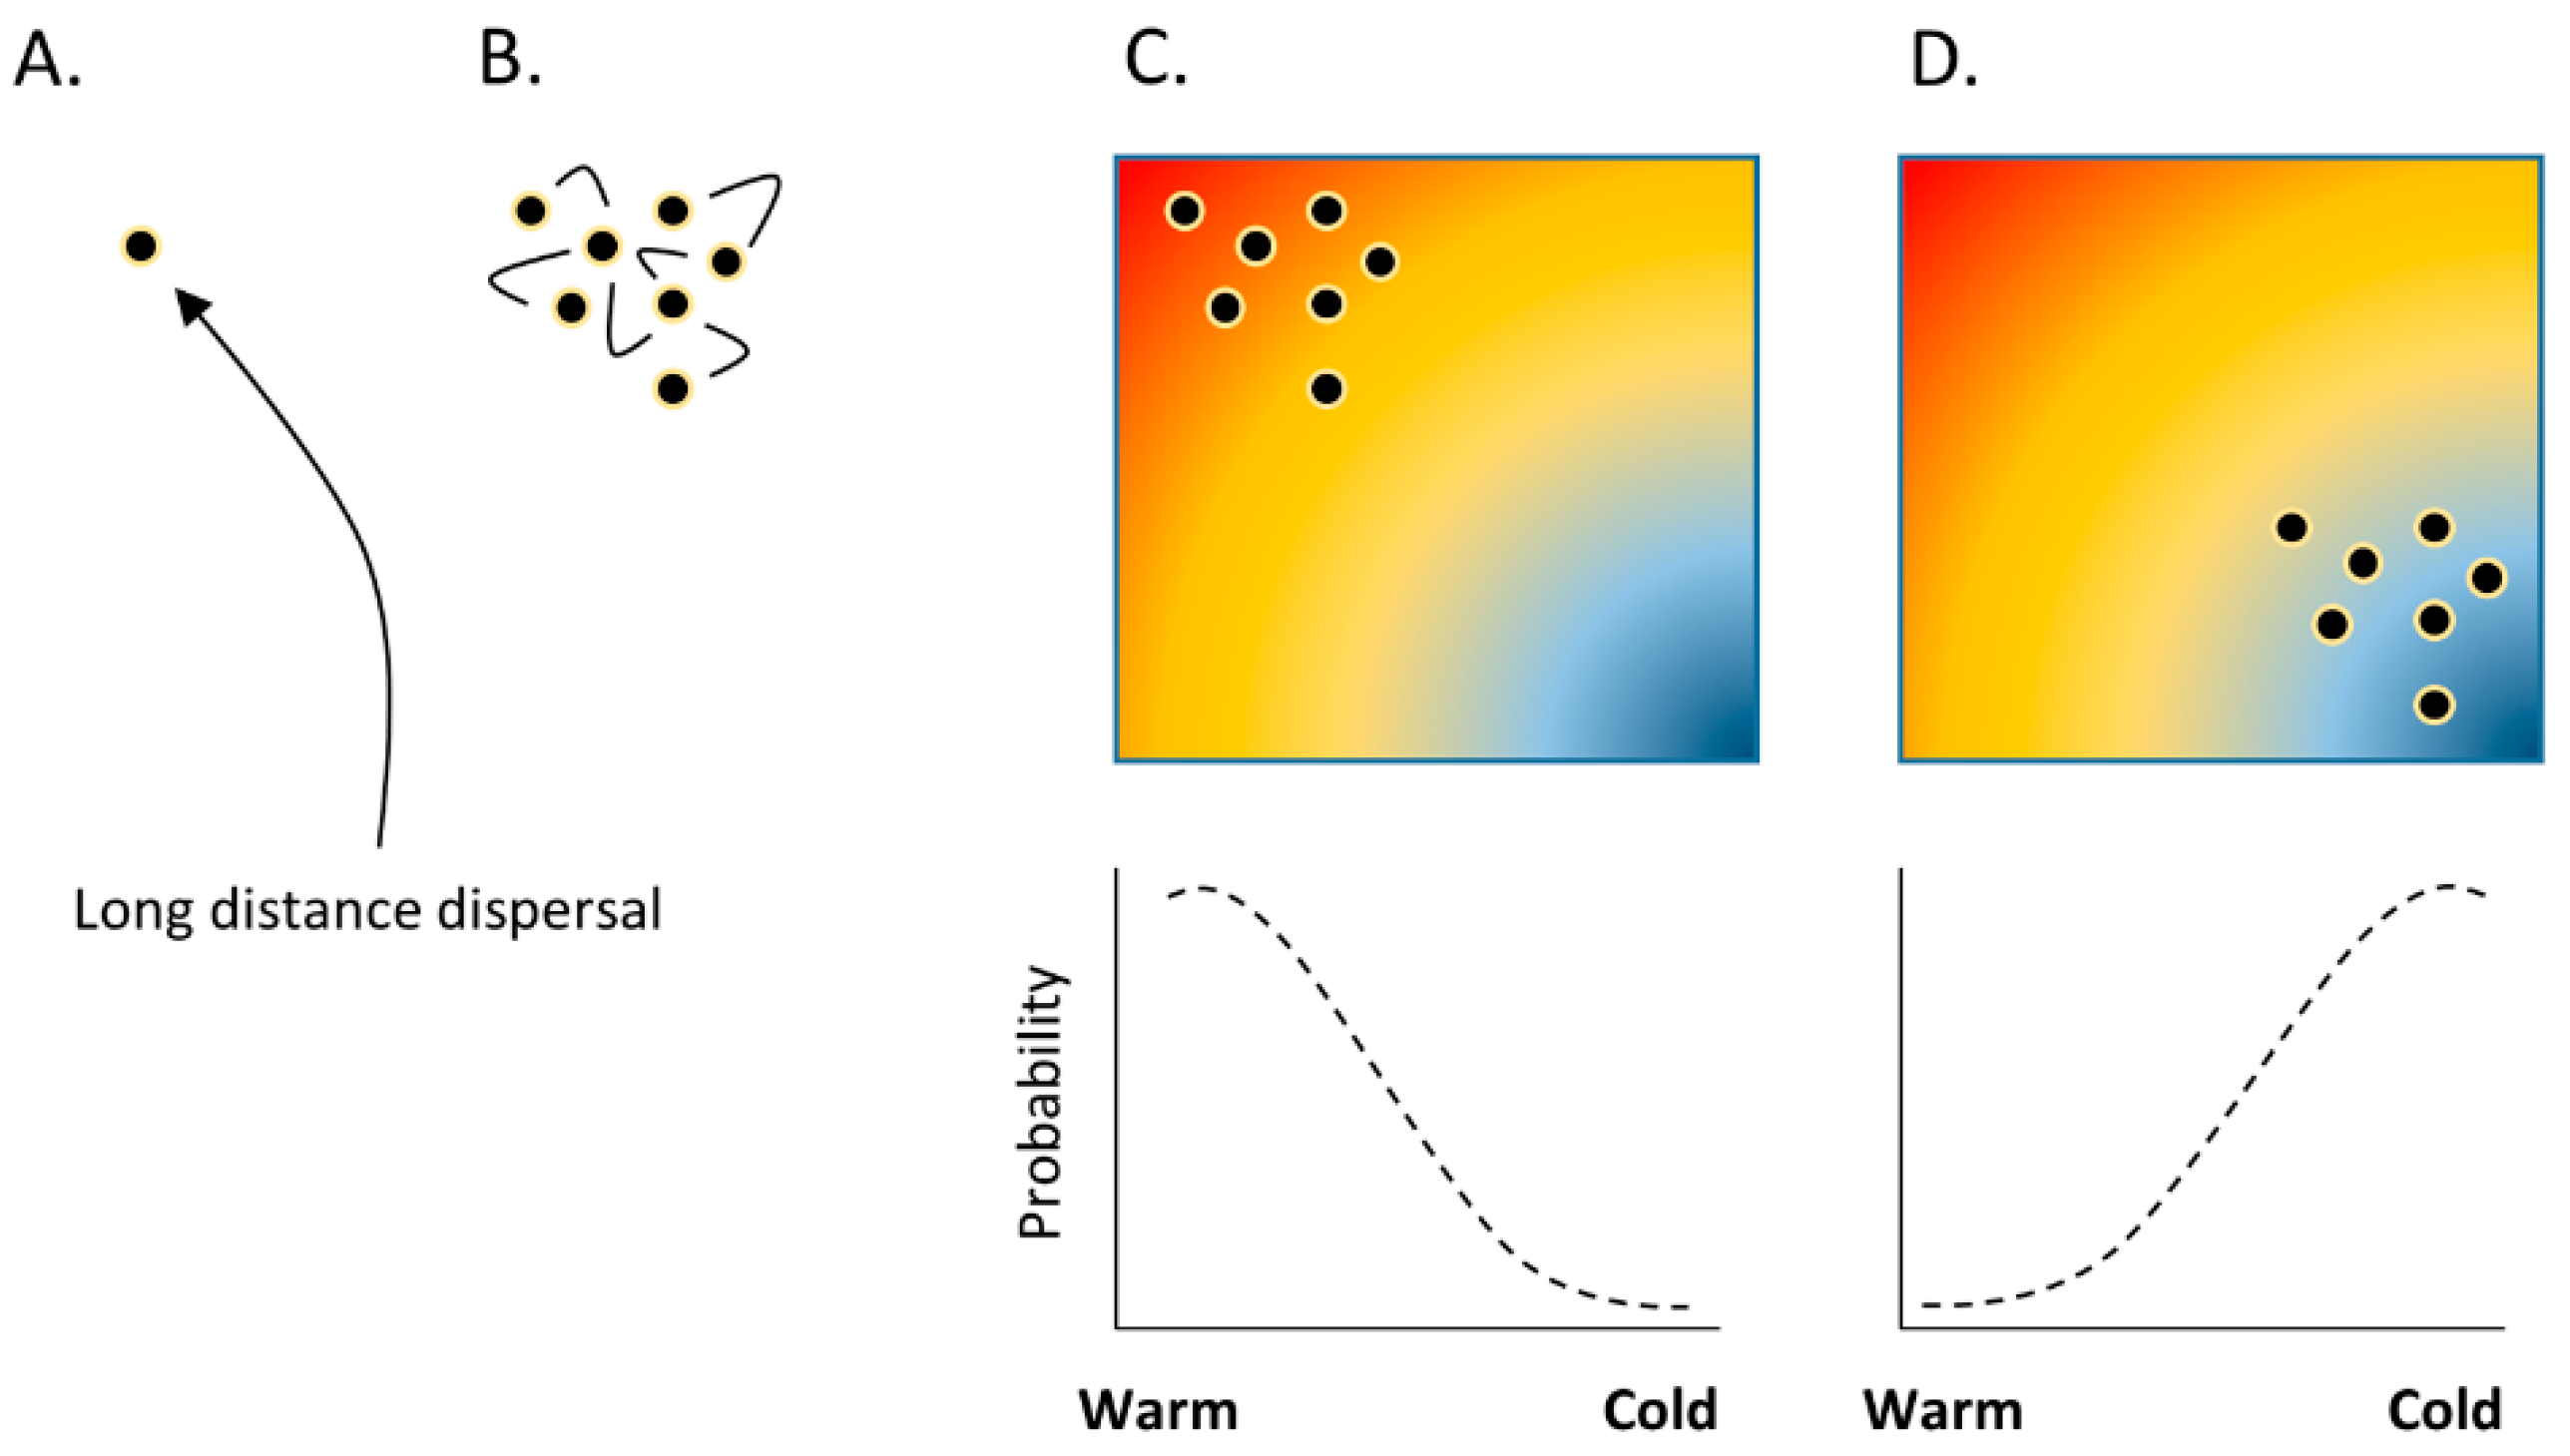
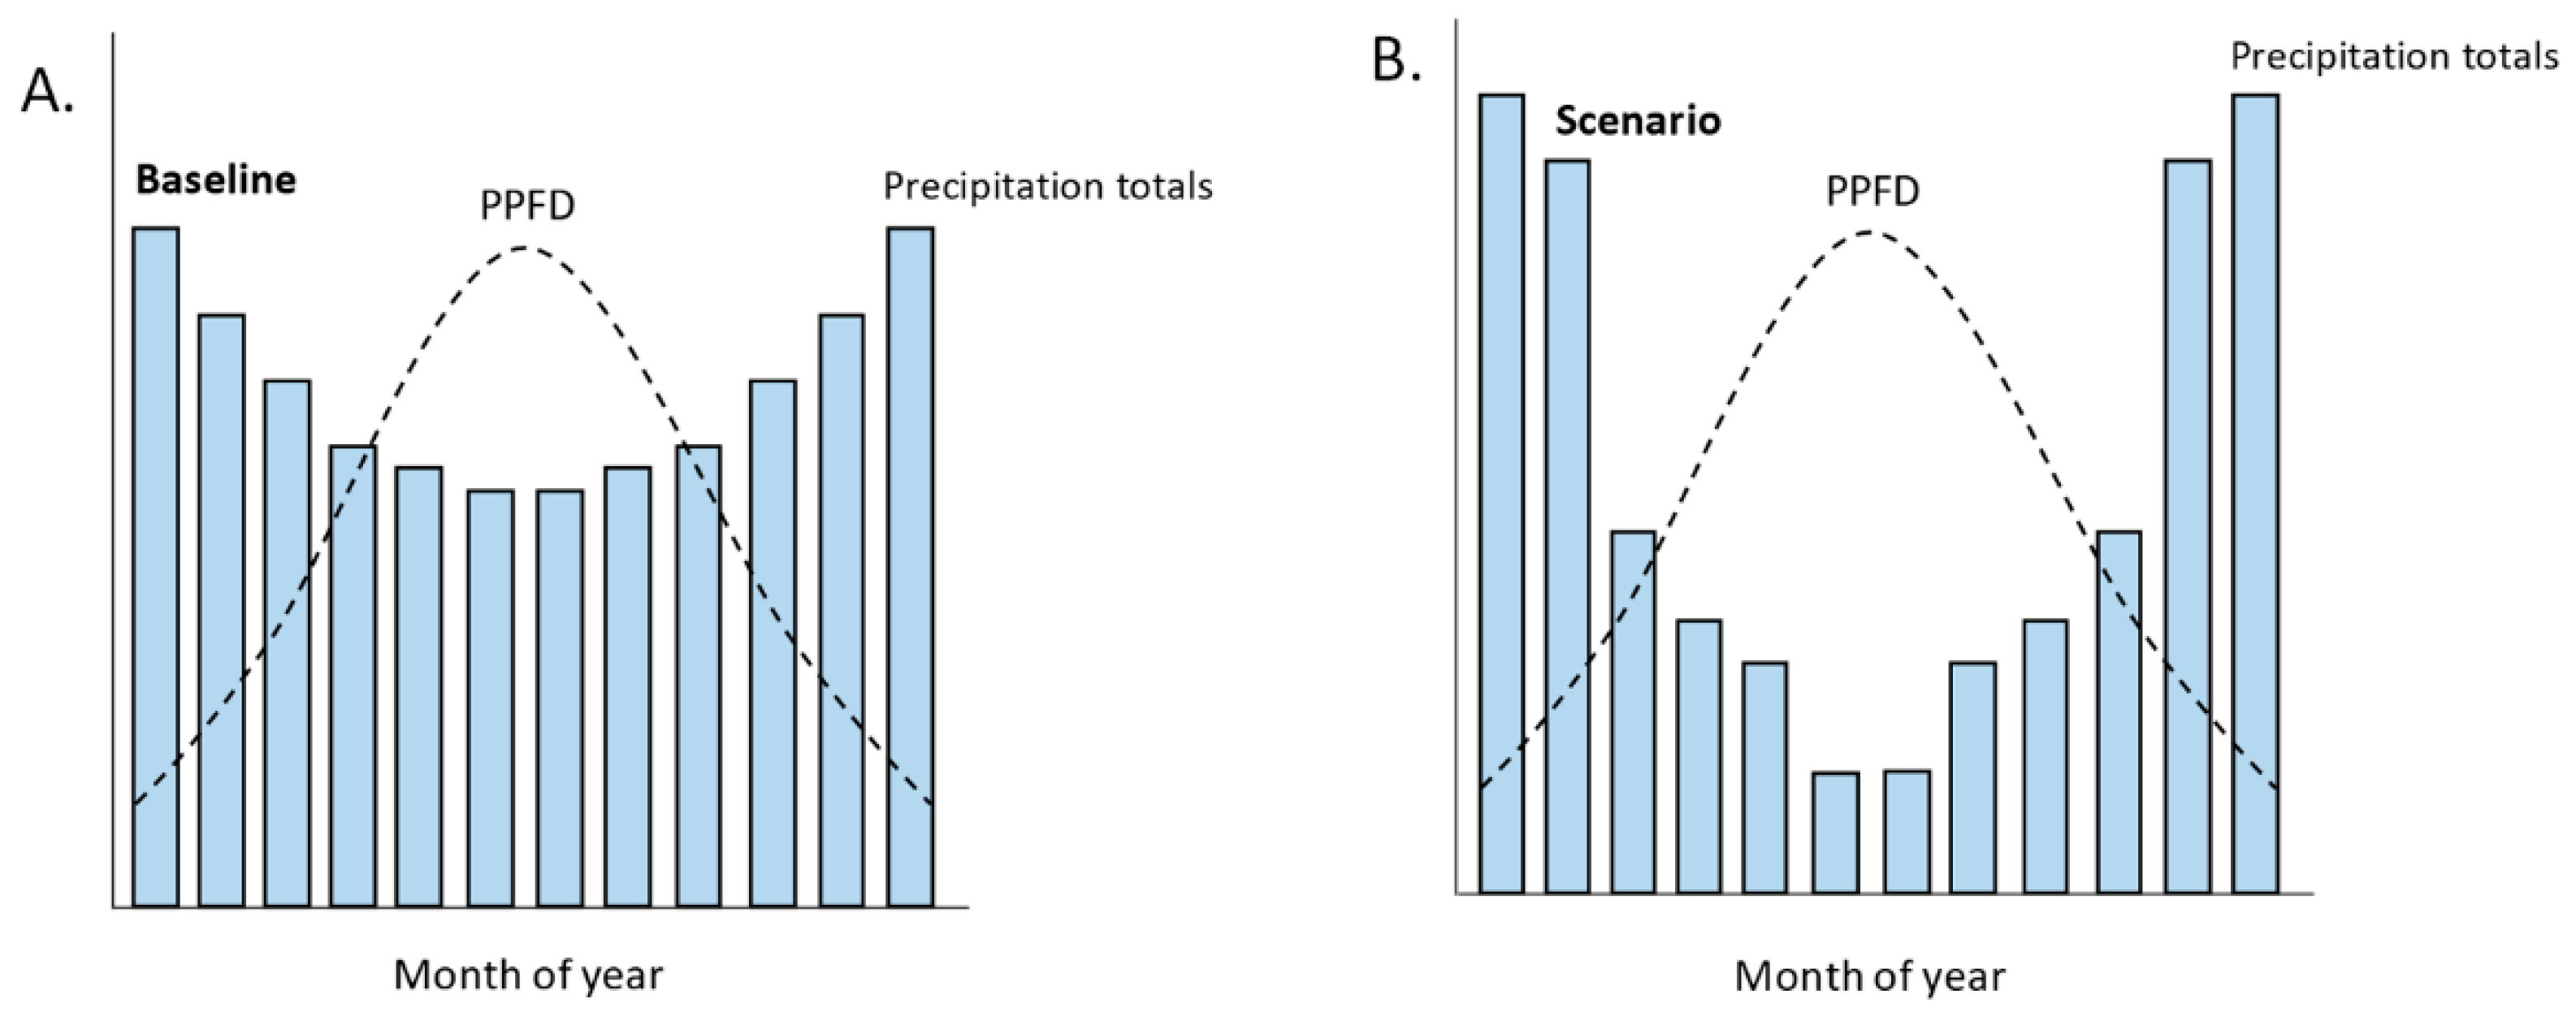
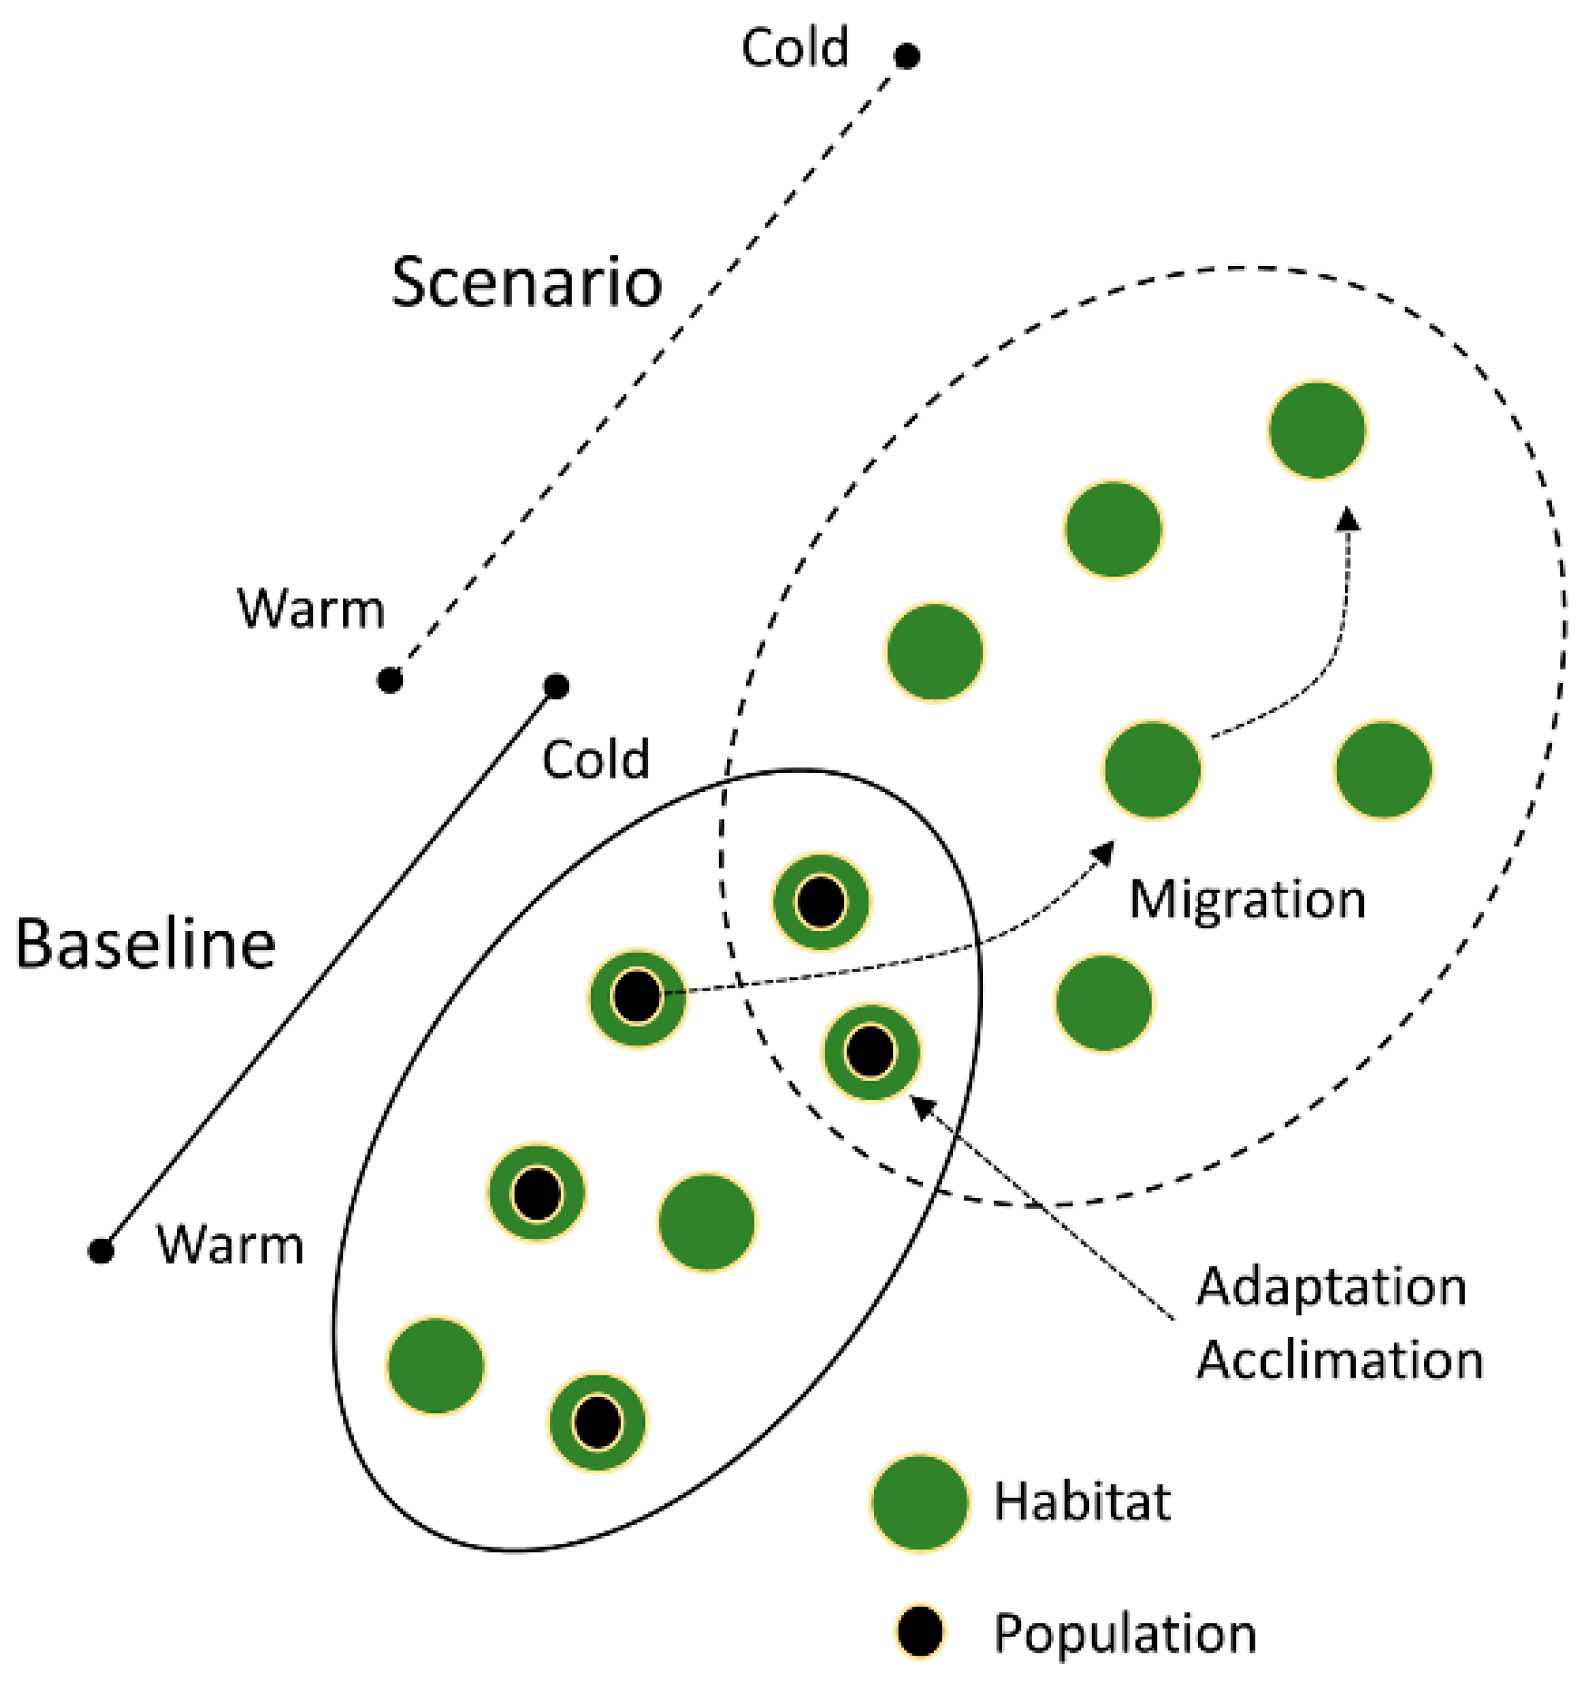
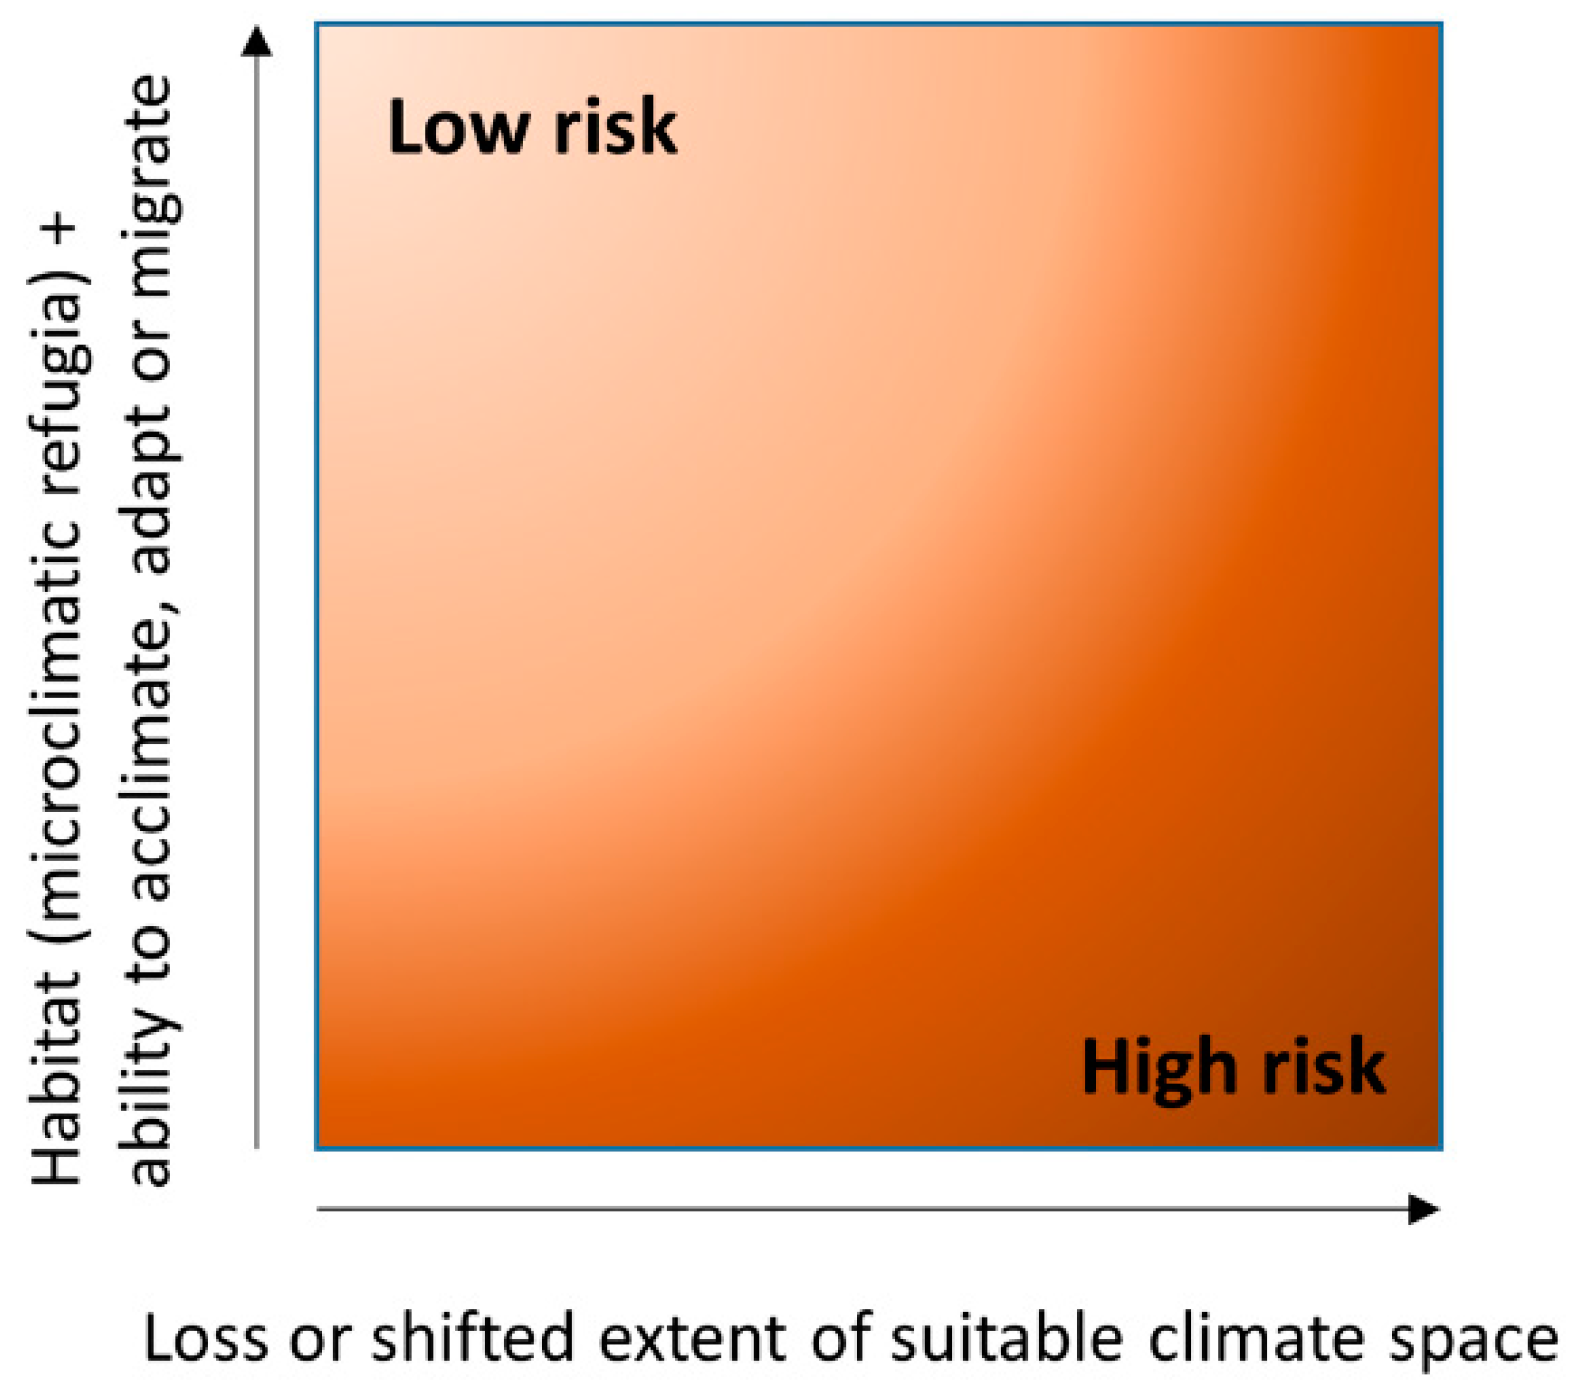
Table 1.
Examples of bioclimatic modelling studies on lichens, investigating response to the baseline climate only. The list is not exhaustive and is drawn primarily from the Web of Science Core Collection under the Boolean search terms for a period 1990–2018: ‘lichen AND climat* AND model* AND (bioclimat* OR species distribution OR habitat suitability)’. Examples are further restricted to studies that use distributional data to understand the response of individual lichens (mycobiont and photobiont in symbiosis), as opposed to community response (composition/richness) or functional groups.
| Response | Extent | Resolution | Baseline | Variables | Covariables | Data | Method | Purpose | Citation |
|---|---|---|---|---|---|---|---|---|---|
| Cetradonia linearis | South East USA | 0.3 km | Unspecified | Temperature Precipitation | None | Presence Pseudo-absences | MAXENT | Conservation Assessment | [44] |
| Cladonia rei | Alberta | 0.025 km | 2009–2013 | Proxy Climate (Lat. & Long.) | Edaphic Habitat Structure | Presence-Absence | GLM | Conservation Assessment Method Development | [37] |
| Erioderma mollissimum | Atlantic Canada | Unspecified | Unspecified | Temperature Precipitation | Altitude | Presence | Mahalanobis | Conservation Assessment | [38] |
| Erioderma pedicellatum | Newfoundland | 0.08 km | 1998–2008 | Proxy Climate (Distance to Coast) | Topography Habitat Structure | Presence Pseudo-absences | GAM | Conservation Assessment | [39] |
| Fuscopannaria leucosticta | New Brunswick | 0.05 km | Unspecified | Temperature Precipitation Thermic Indices | Edaphic Habitat Structure | Presence Pseudo-absences | MAXENT | Conservation Assessment | [45] |
| Fuscopannaria leucosticta | Nova Scotia | 0.05 km | 2005–2015 | Temperature Precipitation | Altitude Topography Edaphic Habitat Structure | Presence Pseudo-absence | MAXENT | Conservation Assessment | [40] |
| Hypogymnia imshaugii agg. | Pacific Northwest | Unspecified | Unspecified | PCA Axes (Temp. and Precip.) | None | Presence-Absence | NPMR | Taxonomic Hypotheses | [32] |
| Pectenia plumbea | Cabañeros NP(Spain) | 0.005 km | 2013 | Temperature Precipitation | Altitude Topography Habitat Structure | Presence-Absence Abundance | GLM | Conservation Assessment | [41] |
| Squamarina cartilaginea agg. | Italy | 1 km | Unspecified | Temperature Precipitation | Geology Habitat Structure | Presence Pseudo-absence | GLMRF | Taxonomic Hypotheses | [33] |
| Usnea hirta | Western USA | 1 km | 1991–1999 | Temperature Precipitation | Altitude Topography Solar Radiation Habitat Structure | Presence-Absence | NPMR | Bioindicator Testing | [48] |
| Usnea longissima | Global | 5 km | Unspecified | Temperature Precipitation | Altitude Habitat Structure | Presence Pseudo-absence | MAXENT | Taxonomic Hypotheses | [34] |
| Xanthoparmelia pulla agg. | Central Europe | 1 km | Unspecified | Temperature Precipitation | Altitude | Presence Pseudo-absence | MAXENT | Taxonomic Hypotheses | [35] |
| 4 species (proxies for rare species) | Pacific Northwest | 0.09 km | 1993–2000 | Temperature Precipitation Relative Humidity Vapour Pressure Thermic Indices | Altitude Topography Solar Radiation | Presence-Absence | CART | Method Development | [52] |
| 6 species (epiphytes) | Switzerland | Plots & 20 km | Unspecified 1989–2000 | Thermic Indices Hygric Indices | Habitat Structure Solar Radiation | Presence & Presence-Absence | GLM | Method Development | [53] |
| 9 species (Lecanora varia agg.) | Western USA | 2 km | Unspecified | Temperature Precipitation Relative Humidity Dew Point Thermic Indices | Altitude | Presence | NPMR | Taxonomic Hypotheses | [36] |
| 9 species (three bioindicator groups) | England | 5 km | 2009–2011 | Temperature Precipitation Relative Humidity | Pollutants | Abundance Presence-Absence | GLM | Bioindicator Testing | [49] |
| 11 species (Peltigerales) | Spain | 10 km | 1995–2005 | Temperature Precipitation Hygric Indices | Altitude Geology Habitat Structure | Presence | ENFA | Conservation Assessment | [46] |
| 12 species (epiphytes) | Alaska | 0.8 km | 2004–2008 | PCA Axes (Temp. and Precip.) | Habitat Structure | Abundance | NPMR | Bioindicator Testing | [50] |
| 15 species (epiphytes) | Pacific Northwest | 0.06 km | 2000–2001 | Temperature Precipitation Relative Humidity Dew Point | Topography Habitat Structure | Presence-Absence | GLM | Conservation Assessment | [42] |
| 18 species (three substratum types) | Spain | 10 km | Unspecified | Temperature Precipitation Hygric Indices | Altitude Geology Habitat Structure | Presence | ENFA | Conservation Assessment | [47] |
| 20 species (epiphytes) | Switzerland | Plots & 20 km | Unspecified 1989–2000 | Precipitation Thermic Indices Hygric Indices | Topography Habitat Structure Solar Radiation | Presence-Absence & Pseudo-absence | GLM MAXENT | Method Development | [54] |
| 59 species (epiphytes) | NW Italy | Unspecified | Unspecified | Temperature Precipitation | None | Presence-Absence | NPMR | Bioindicator Testing | [51] |
| 193 species (epiphytes & terricolous) | USA Atlantic Coast | 1 km | 1870–2015 | Temperature Precipitation | None | Presence Pseudo-absence | MAXENT | Conservation Assessment | [43] |
NOTES: Resolution refers to the resolution of the species data, or the climate data (whichever is lowest); Baseline refers to the data range for species distributions (not climate); Topography includes slope and aspect as well as landscape position (e.g., distance to coast) and derived variables (e.g., soil moisture); Habitat Structure ranges from land cover class to vegetation composition.
Table 2.
Examples of bioclimatic modelling studies on lichens, investigating response to both the baseline and climate change scenarios. The list is not exhaustive and is drawn primarily from the Web of Science Core Collection under the Boolean search terms for a period 1990–2018: ‘lichen AND climat* AND model* AND (bioclimat* OR species distribution OR habitat suitability)’. Examples are further restricted to studies that use distributional data to understand the response of individual lichens (mycobiont and photobiont in symbiosis), as opposed to community response (composition/richness) or functional groups.
| Response | Extent | Resolution | Baseline | Variables | Covariables | Data | Method | Climate Scenario | Citation |
|---|---|---|---|---|---|---|---|---|---|
| Lecanora populicola | Scotland | 10 km | 2003–2005 | Temperature Precipitation | None | Presence-Absence | NPMR | 2020s & 2050s B2 & A1F1 (SRES) | [93] |
| Ochrolechia austroamericana | Global | 5 km | Unspecified | Temperature Precipitation | Altitude | PresencePseudo-absences | MAXENT | 2080s A1b, A2a & B2a (SRES) | [89] |
| Vulpicida pinastri | Britain | 10 km | 1961–2008 | Temperature Precipitation | Pollutants | Presence Pseudo-absences | NPMR | 2050s B2 & A1F1 (SRES) | [91] |
| 2 species (Solonopsora spp.) | Carpathians | 2010-2015 | 0.5 km | Temperature Precipitation | Altitude Topography Geology Habitat Structure | Presence-Absence | CSM | 2050s & 2070s 2.6 & 8.5 (RCP) | [86] |
| 3 species (Lobaria spp.) | Italy | 1 km | Unspecified | Temperature Precipitation | None | Presence Pseudo-absences | MAXENT | 2020s, 2050s & 2080s A2 and B1 (SRES) | [88] |
| 8 species (endemics) | South East USA | 1 km | 2014 | Temperature Precipitation | None | Presence Pseudo-absences | MAXENT | 2050s & 2070s 2.6 & 8.5 (RCP) | [87] |
| 26 species (five biogeographic groups) | Britain | 10 km | 1961–2006 | Temperature Precipitation | None | Presence Pseudo-absences | NPMR | 2050s B2 & A1F1 (SRES) | [96] |
| 41 species (five trait groups) | Iberian Peninsula | 1 km & 10 km | Unspecified | Temperature Precipitation | None | Presence Pseudo-absences | GAMGLMCART | 2080s A1B (SRES) | [90] |
| 42 species (old-growth indicators) | Scotland | 5 km | 1971–2006 | Temperature Precipitation | Habitat Structure | Presence-Absence | NPMR | 2050s B2 & A1F1 (SRES) | [92] |
| 382 species (epiphytes) | Britain | 10 km | 1961–2010 | Temperature Precipitation | Pollutants Habitat Structure | Presence Pseudo-absences | MAXENT | 2050s & 2080s A1B & A1F1 (SRES) | [94,95] |
NOTES: Resolution refers to the resolution of the species data, or the climate data (whichever is lowest); Baseline refers to the data range for species distributions (not climate); Topography includes slope and aspect as well as landscape position (e.g., distance to coast) and derived variables (e.g., soil moisture); Habitat Structure ranges from land cover class to vegetation composition.
© 2019 by the author. Licensee MDPI, Basel, Switzerland. This article is an open access article distributed under the terms and conditions of the Creative Commons Attribution (CC BY) license (http://creativecommons.org/licenses/by/4.0/).
Share and Cite
MDPI and ACS Style
Ellis, C.J. Climate Change, Bioclimatic Models and the Risk to Lichen Diversity. Diversity 2019, 11, 54. https://doi.org/10.3390/d11040054
AMA Style
Ellis CJ. Climate Change, Bioclimatic Models and the Risk to Lichen Diversity. Diversity. 2019; 11(4):54. https://doi.org/10.3390/d11040054
Chicago/Turabian StyleEllis, Christopher J. 2019. "Climate Change, Bioclimatic Models and the Risk to Lichen Diversity" Diversity 11, no. 4: 54. https://doi.org/10.3390/d11040054
Note that from the first issue of 2016, this journal uses article numbers instead of page numbers. See further details here.