Abstract
Common buzzard is the most abundant bird of prey in Europe, and its population has undergone serious changes. In this study, we focused on a population in Central Poland (study area 105 km2, forests around 24 km2, seven forest complexes) to analyze how certain environmental factors influenced population abundance, breeding parameters, and diet composition. The study was undertaken from 2011 to 2018, and the results were compared with data from two study periods (1982–1992; 2001–2003). Current population density was 3.5 pairs/10 km2 of total area and 14.3 pairs/10 km2 of forested area, it was negatively correlated to the abundance of northern goshawk, and it grew in the last few decades. Mammals were dominant prey (72.6% prey items, 38.6% of biomass), but their share in diet changed following rodent availability. A decrease in the share of voles was recorded, reflecting drop in their abundance and dampening of abundance cycles. Breeding parameters were similar to those in the past, and the number of offspring depended on small rodent availability. Buzzards adapted to changes in the stand structure, i.e., when share of Scots pine decreased, they chose it as their nesting tree less frequently. All this showed that buzzard is a very adaptable species.
1. Introduction
Common buzzard Buteo buteo is the most abundant bird of prey in Poland and in Europe [1,2,3]. In most countries, its abundance decreased between the second half of the 20th century and the 1970s. The main reasons for this were deforestation, persecution, and usage of organochloride pesticides in the 1950s and 1960s [4,5,6]. In most cases, those factors have been eliminated, which allowed the population to grow in the last few decades [7,8,9,10]. Additionally, in Poland, cases of a dynamic population growth were recorded. In the farmland of Eastern Poland (sampling area of 343 km2), the population increased from 18 to 58 pairs in the years 1983–1996 [11]. A similar trend was noted in Western Poland (study area of 150 km2), where 16 breeding pairs were recorded in 1971, while 30 pairs 14 years later [12]. In general, the Polish population was stabilized after an increase in the last two decades of the 20th century [1].
Buzzard settlement, density, and productivity are dependent on the combination of several factors, such as food availability [9,13,14,15], nest site choice [15], weather conditions in spring [13] or predation risk [15]. The species that may affect common buzzard negatively are, e.g., northern goshawks Accipiter gentilis [16,17,18,19] and eagle owls Bubo bubo [15].
Long-term studies enable population dynamics to be linked with environmental conditions. Our study was done in Central Poland, in the field and forest mosaic, where long-term studies of birds of prey Falconiformes (including common buzzard) began in 1982 [20]. At present, (2011–2018) we have continued the long-term monitoring of this species. We compared data obtained in the current study with analogical data obtained in the previous study periods [20,21,22,23,24,25,26]. Therefore, we were able to analyze crucial environmental factors (i.e., prey availability, changes in the forest structure and abundance of a competitive raptor species, i.e., northern goshawk) that may have influenced the population density of the common buzzard, its breeding parameters, and diet composition.
2. Materials and Methods
The study was based on fieldwork done in the years 2011–2018 and published data from the two study periods: (i) 1982–1992 [20,21,22,23] and (ii) 2001–2003 [24,26], which were used for comparisons.
2.1. Study Area
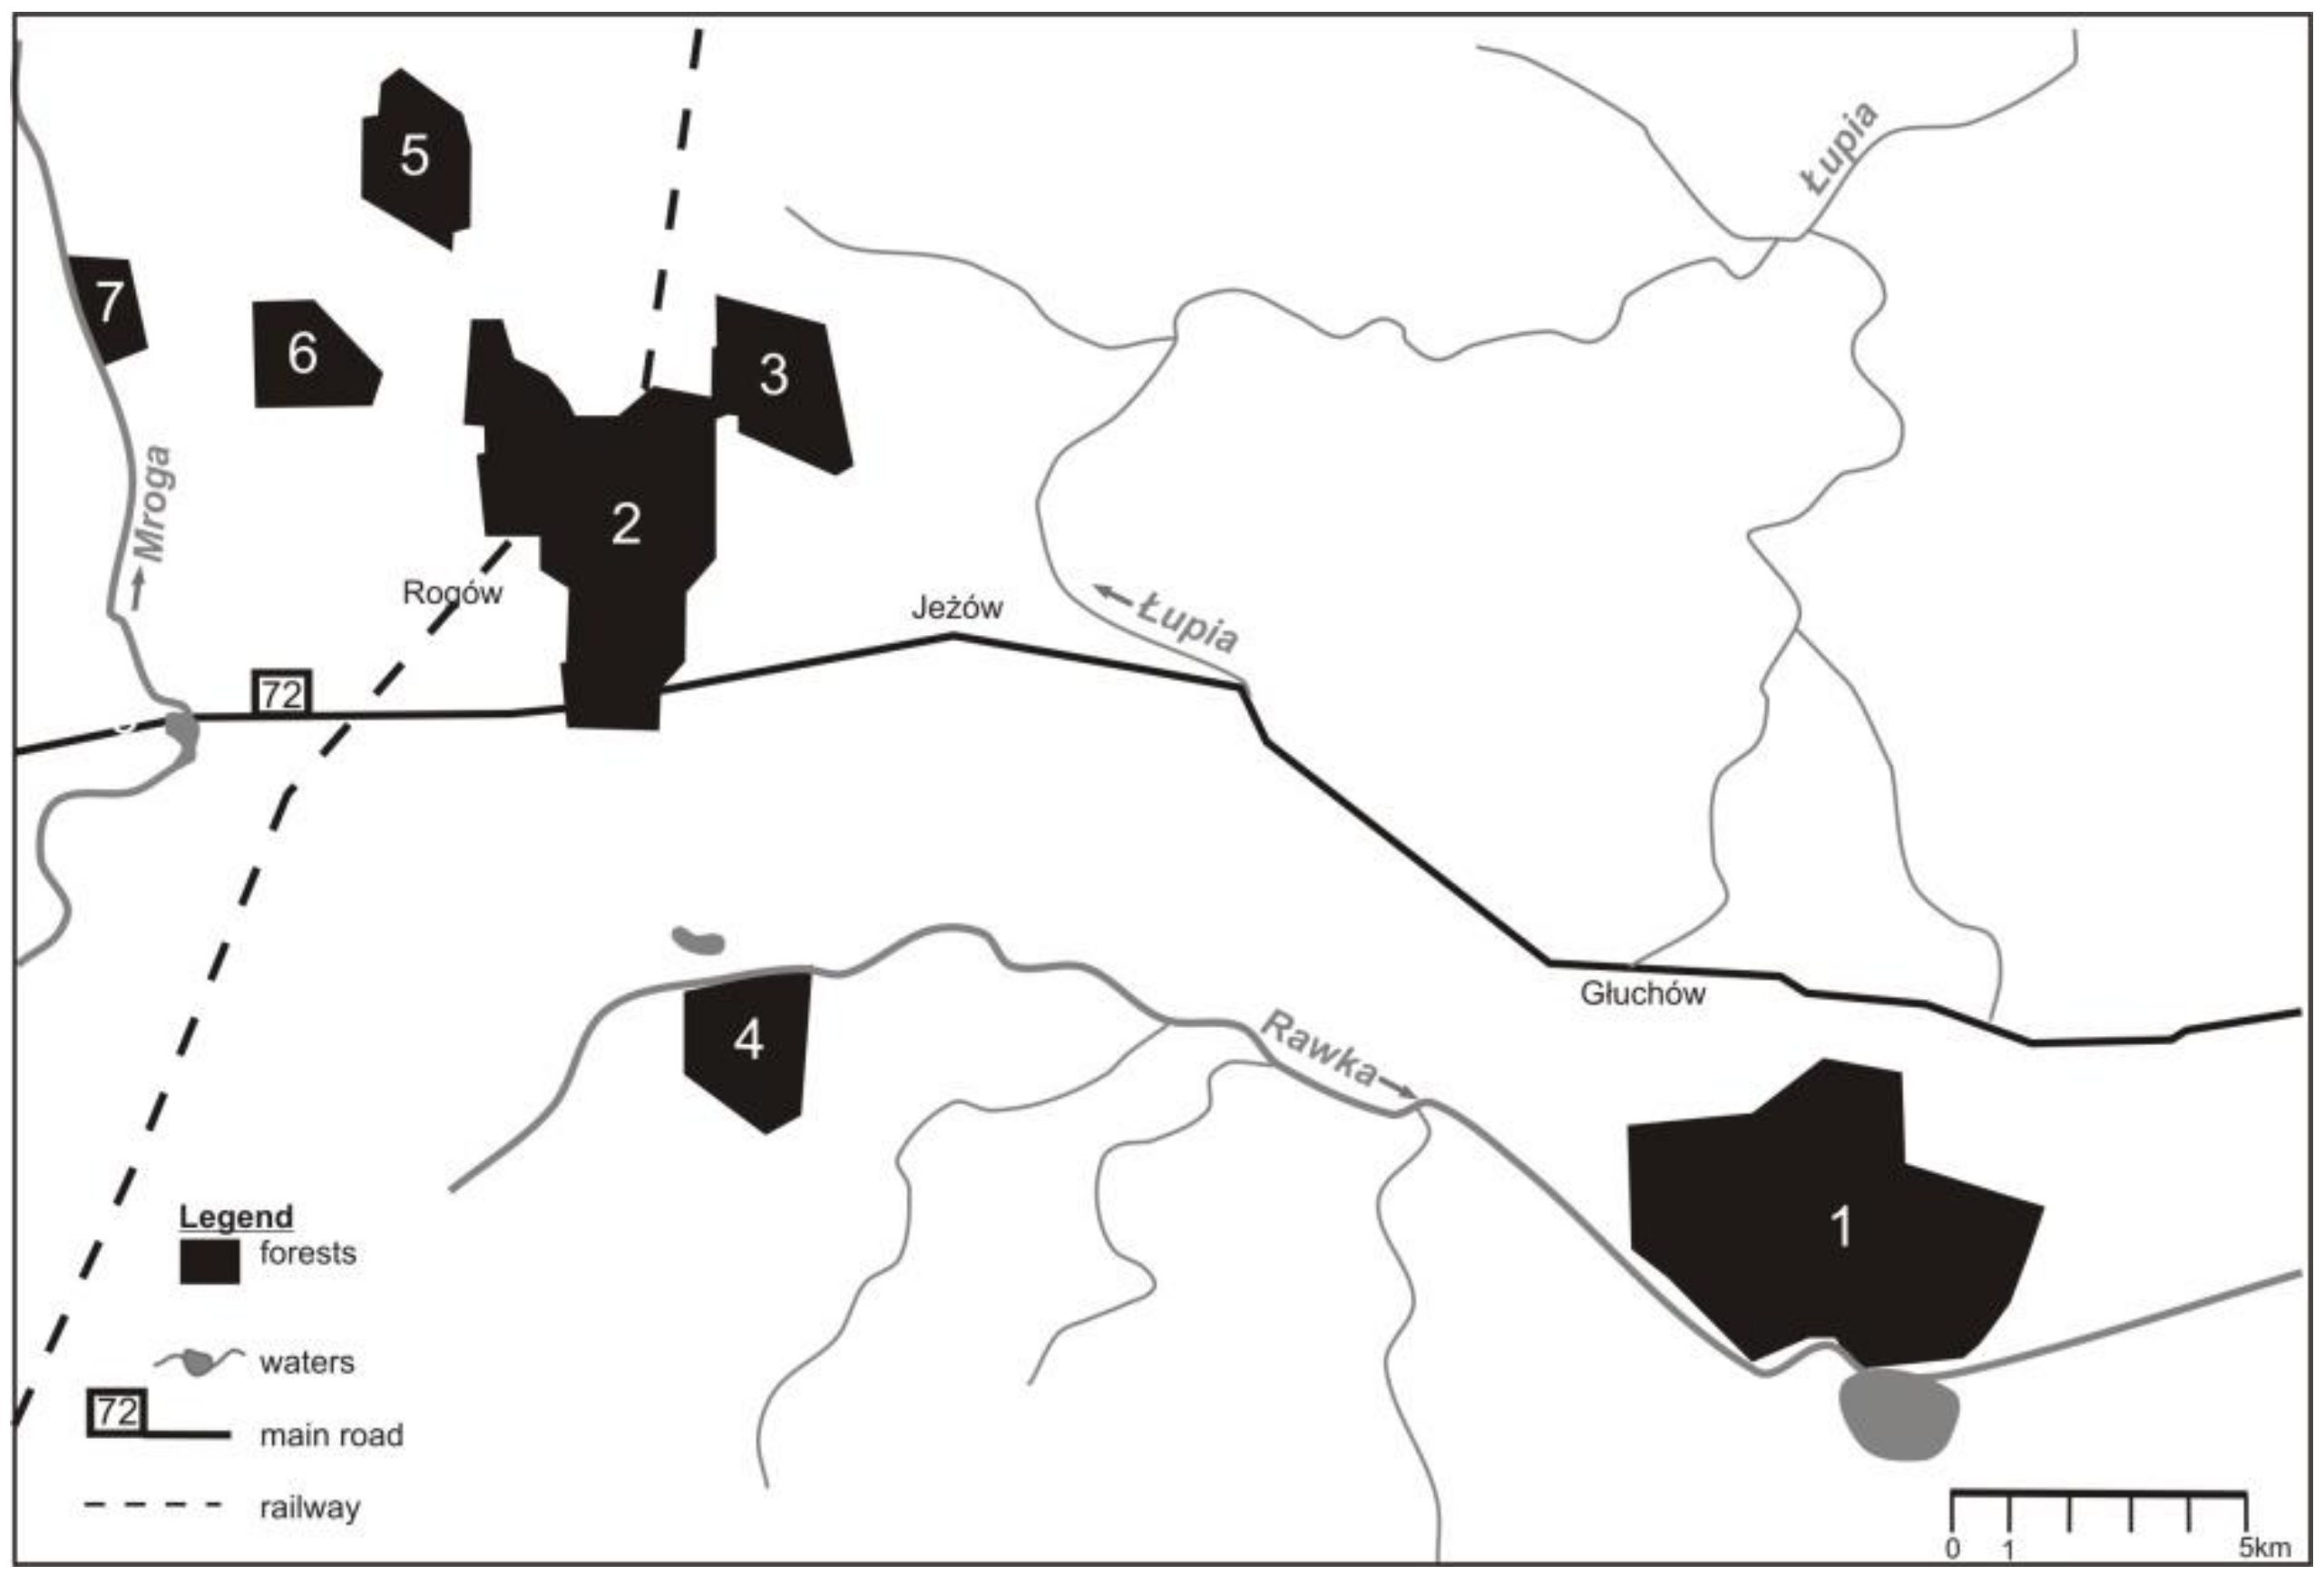
The studies were done in Central Poland, in the area of Experimental Forest Station of Warsaw University of Life Sciences, in the vicinity of the village of Rogów (51° 49’ 17,98 N, 19° 53’ 54, 15 E). The study area comprised ca. 105 km2 of field and forest mosaic. Forests accounted for around 25% of the area (~2400 ha) and formed seven complexes (70–1000 ha) (Figure 1). The remaining part of the area were arable lands (59%), orchards (5%), grasslands (5%), and scattered buildings [24]. The main forest habitat types were fresh mixed forest and fresh broadleaved forest (together 83%). The main forest-forming species was Scots pine Pinus sylvestris, but its share has dropped in the last decades, as the species structure of stands was adjusted to habitat types. By contrast, the share of larch Larix decidua and broadleaved species rose. Further, the share of older stands, which are the best for buzzards to build their nests, grew in the later decades (Table 1).
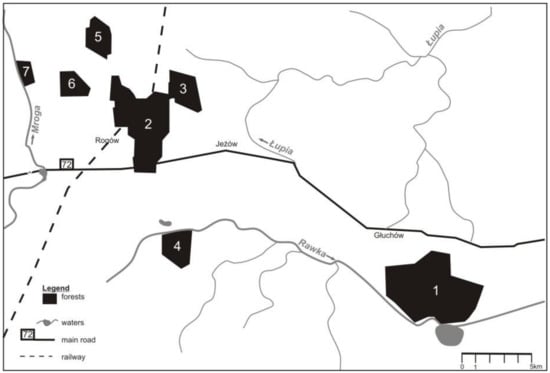
Figure 1.
Distribution of forest complexes in the study area (Central Poland, vicinity of Rogów village, Experimental Forest Station of Warsaw University of Life Sciences).

Table 1.
Changes in the structure of stands in the study area (Central Poland, vicinity of Rogów village, Experimental Forest Station of Warsaw University of Life Sciences) in the subsequent decades [27].
The mean stand age and stand volume increased in the subsequent decades and in January 2009 reached 71 years and 281 m3/ha, as compared to 51 years and 213 m3/ha in 1978. The annual harvest in the years 2014–2017 was 4.9 m3/ha. The felling age of Scots pine and larch was 100–120 years. The forest area grew slightly [27].
2.2. Inventory of Common Buzzard Population, Its Breeding Success, and Measurements of Nesting Trees
All stands, except the parts with newly planted trees and sapling stands, were searched. After the breeding season (in autumn), areas where nests might have been missed (i.e., calls of adult or young birds were heard during the breeding season) were checked again. All found nests were recorded on the map of stands (1:10,000) and recorded in a GPS receiver (Garmin 62sc).
All occupied nests were visited in June and July to estimate the number of fledglings. The reasons for brood loss were determined when possible. The breeding success (percent of pairs that successfully produced at least one fledgling) and the number of fledglings were calculated both for successful pairs and for all known breeding pairs.
Measurements of nesting trees were done in November and December. Tree species were determined and the height of nest placement and tree diameter at 1.3 m height were measured.
2.3. Diet Composition of Common Buzzard
Diet composition was assessed on the basis of an analysis of pellets and other prey remains that were collected on average every two weeks in the vicinity of nests from April to July. In a laboratory, prey remains were systematically assigned with the aid of keys [28,29,30,31,32]. Furthermore, collection of feathers and skulls was used for comparisons. In some cases, histological analysis of hair was performed [33]. We tried to avoid double counting of prey, e.g., we included an avian prey assigned to the species level on the basis of feathers from a plucking site; at the same time, bird remains from one pellet found in the same territory were excluded. Mean prey body mass was adopted on the basis of literature [28,34,35,36], while body mass of rodents was assessed during live-trapping done every year. For carrion, mean daily food requirement (200 g) was adopted as consumed biomass, while for insects, 1 g was adopted as body mass for all species. Diet composition was presented as share of a given taxon in a total number of prey items or consumed biomass.
2.4. Small Rodent Availability
As small rodents are the staple food for common buzzards [22,26], we monitored their abundance. In 2011–2017, parallel counts in field and forest were done three times per year (early May, early July, and late September). Each trapping area was of 90 m × 50 m rectangular shape (0.45 ha), delimited by the extreme positions of live-traps, involving 50 traps separated by 10-metre distances, arranged in a grid pattern. Oats was used as bait (or oats plus a piece of apple in the field habitat). Traps were baited and open for 12 h, then checked twice a day over three days to generate a relative indicator of rodent population density (number of individuals per 100 trap-days) for the consecutive years. Trapped rodents were marked, and the species was identified.
2.5. Inventory of Goshawk Population
We also added data on the abundance of goshawk population, as it is the main competing raptor species in this area [37]. Inventory of goshawk was done according to the methodology, at the same time and in the same areas as the inventory of common buzzard (detailed description and results of the inventory are given in Reference [38]).
2.6. Statistical Analysis
The normality of data distribution was checked with the Shapiro–Wilk test. To compare abundance of breeding pairs in the three study periods, the Kruskal–Wallis test with the post hoc Mann–Whitney test were used. For correlation between common buzzard and northern goshawk abundance and the breeding parameters and rodent availability, Pearson correlation was used. Percentage share of the main groups in a diet in subsequent years was compared with chi-square test, and Bonferroni correction for multiple comparisons was applied (p = 0.017). A statistical analysis was performed using the Past3 software, Hammer Ø., Natural History Museum, University of Oslo, Oslo, Norway [39].
3. Results
3.1. Dynamics of Abundance of Common Buzzard
The current population density (2011-2018) of the common buzzard was 3.5 pairs/10 km2 of total area and 14.3 pairs/10 km2 of forested area. Between 36 to 39 (on average 37.2, SD = 1.04) breeding pairs were recorded each year. The number of breeding pairs increased when compared with the two previous study periods (Kruskal–Wallis test, H = 16.58, p < 0.0005; post hoc Mann–Whitney test, p < 0.05 for all comparisons between the three study periods) and was observed in all forest complexes. Additionally, in the last study period, birds nesting outside forest complexes (in an old park, in groups of trees) were recorded (Table 2). The abundance of the common buzzard was negatively correlated with the abundance of goshawk recorded in this area (Pearson correlation, r = −0.93, p < 0.0001) (Figure 2).
Table 2.
An average number of breeding pairs in the three compared periods in seven forest complexes and in the whole area of study (Central Poland, vicinity of Rogów village, Experimental Forest Station of Warsaw University of Life Sciences). Numbers of forest complexes as in Figure 1. Data for 1982–1992 [20], 2001–2003 [24], 2011–2018: Current study.
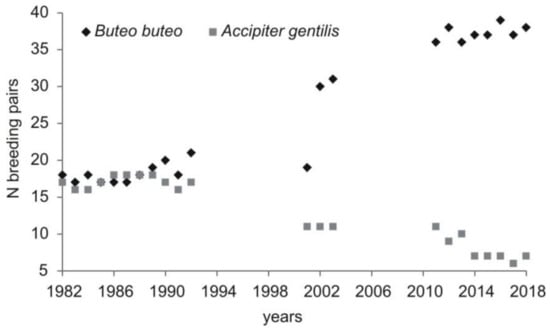
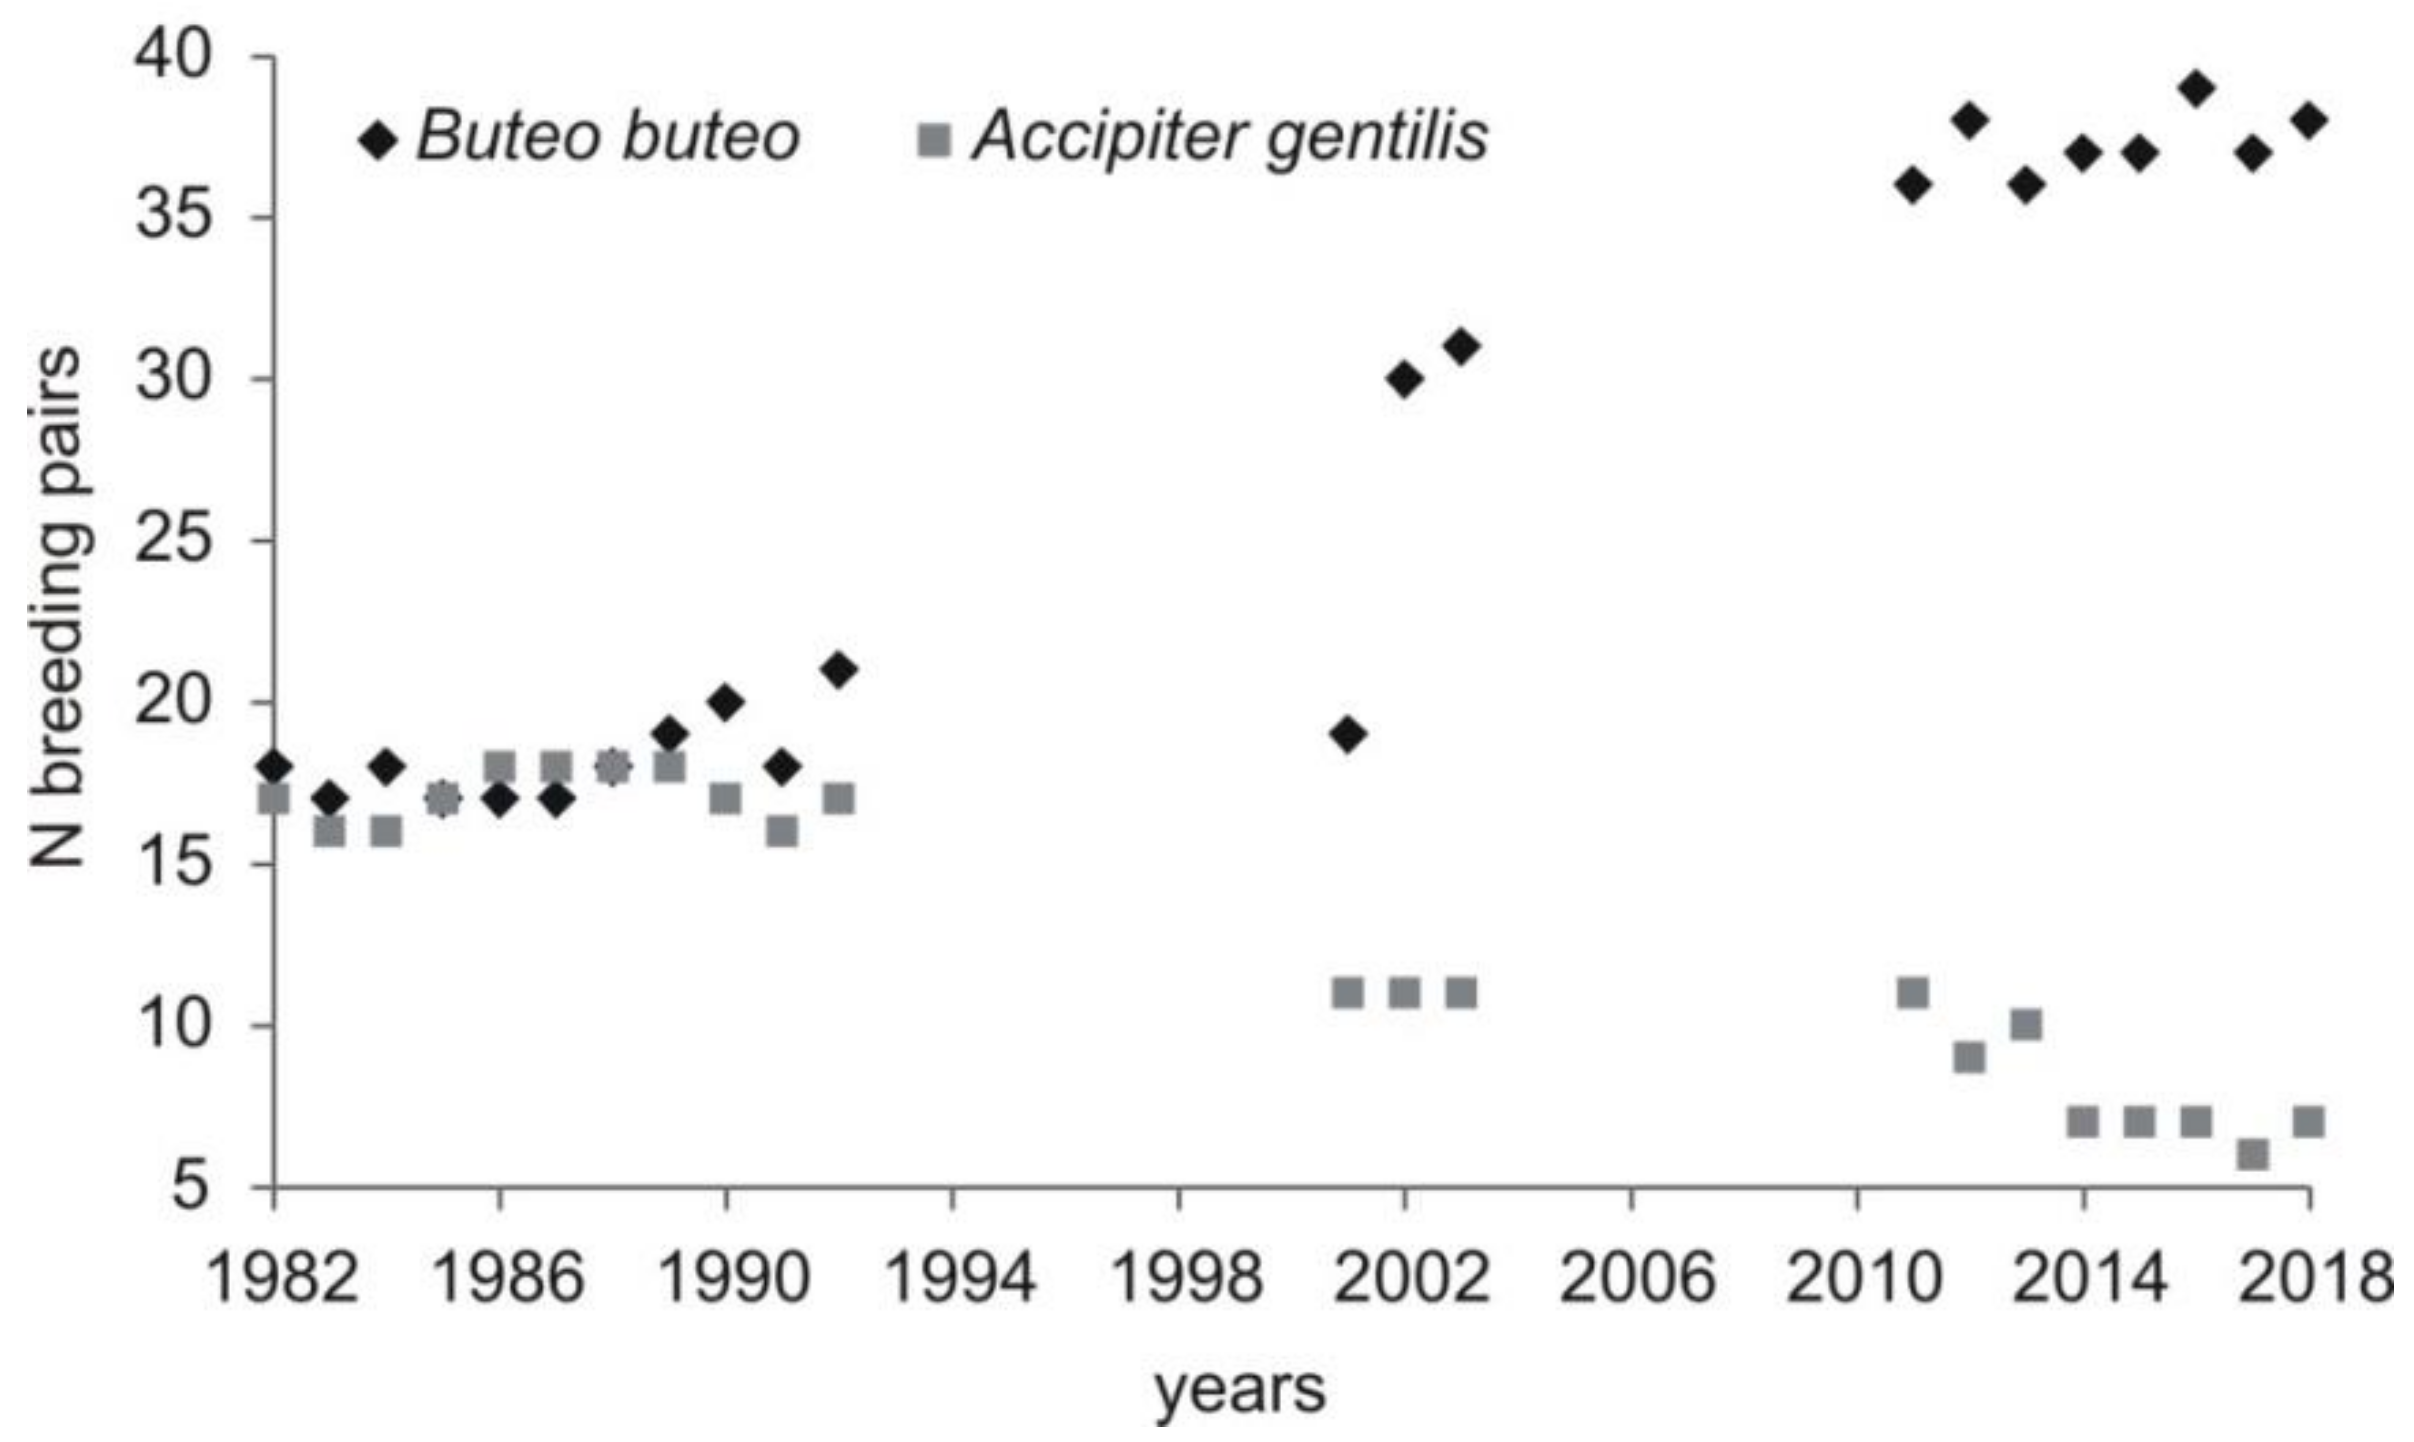
Figure 2.
Density of common buzzard in relation to changing abundance of northern goshawk in the area of study (Central Poland, vicinity of Rogów village, Experimental Forest Station of Warsaw University of Life Sciences). Numbers of forest complexes as in the Figure 1. Data for 1982–1992 [20], 2001–2003 [25,40], 2011–2018: Current study, [38].
3.2. Diet Composition in Relation to Prey Availability
In the current study period (2011–2018), common buzzards preyed mainly on mammals, which accounted for 72.6% prey items but for 38.6% of total biomass consumed. The most important were small rodents (52.6% prey items), mostly from the Apodemus genus (18.6% prey items) and Microtus genus (17.7% prey items). Apodemus species also dominated among live-trapped small rodents, accounting together for more than 70% of all trapped individuals; striped-field mouse A. agrarius dominated in the field, while yellow-necked mouse A. flavicollis in the forest, with each accounting for ca. 70% of trapped individuals in those habitats. By contrast, voles Microus spp. were not frequently trapped in the field (about 8% of trapped individuals), while they were absent from the forest (Table A1). Amphibians, reptiles, and insects were supplementary prey (Table A2).
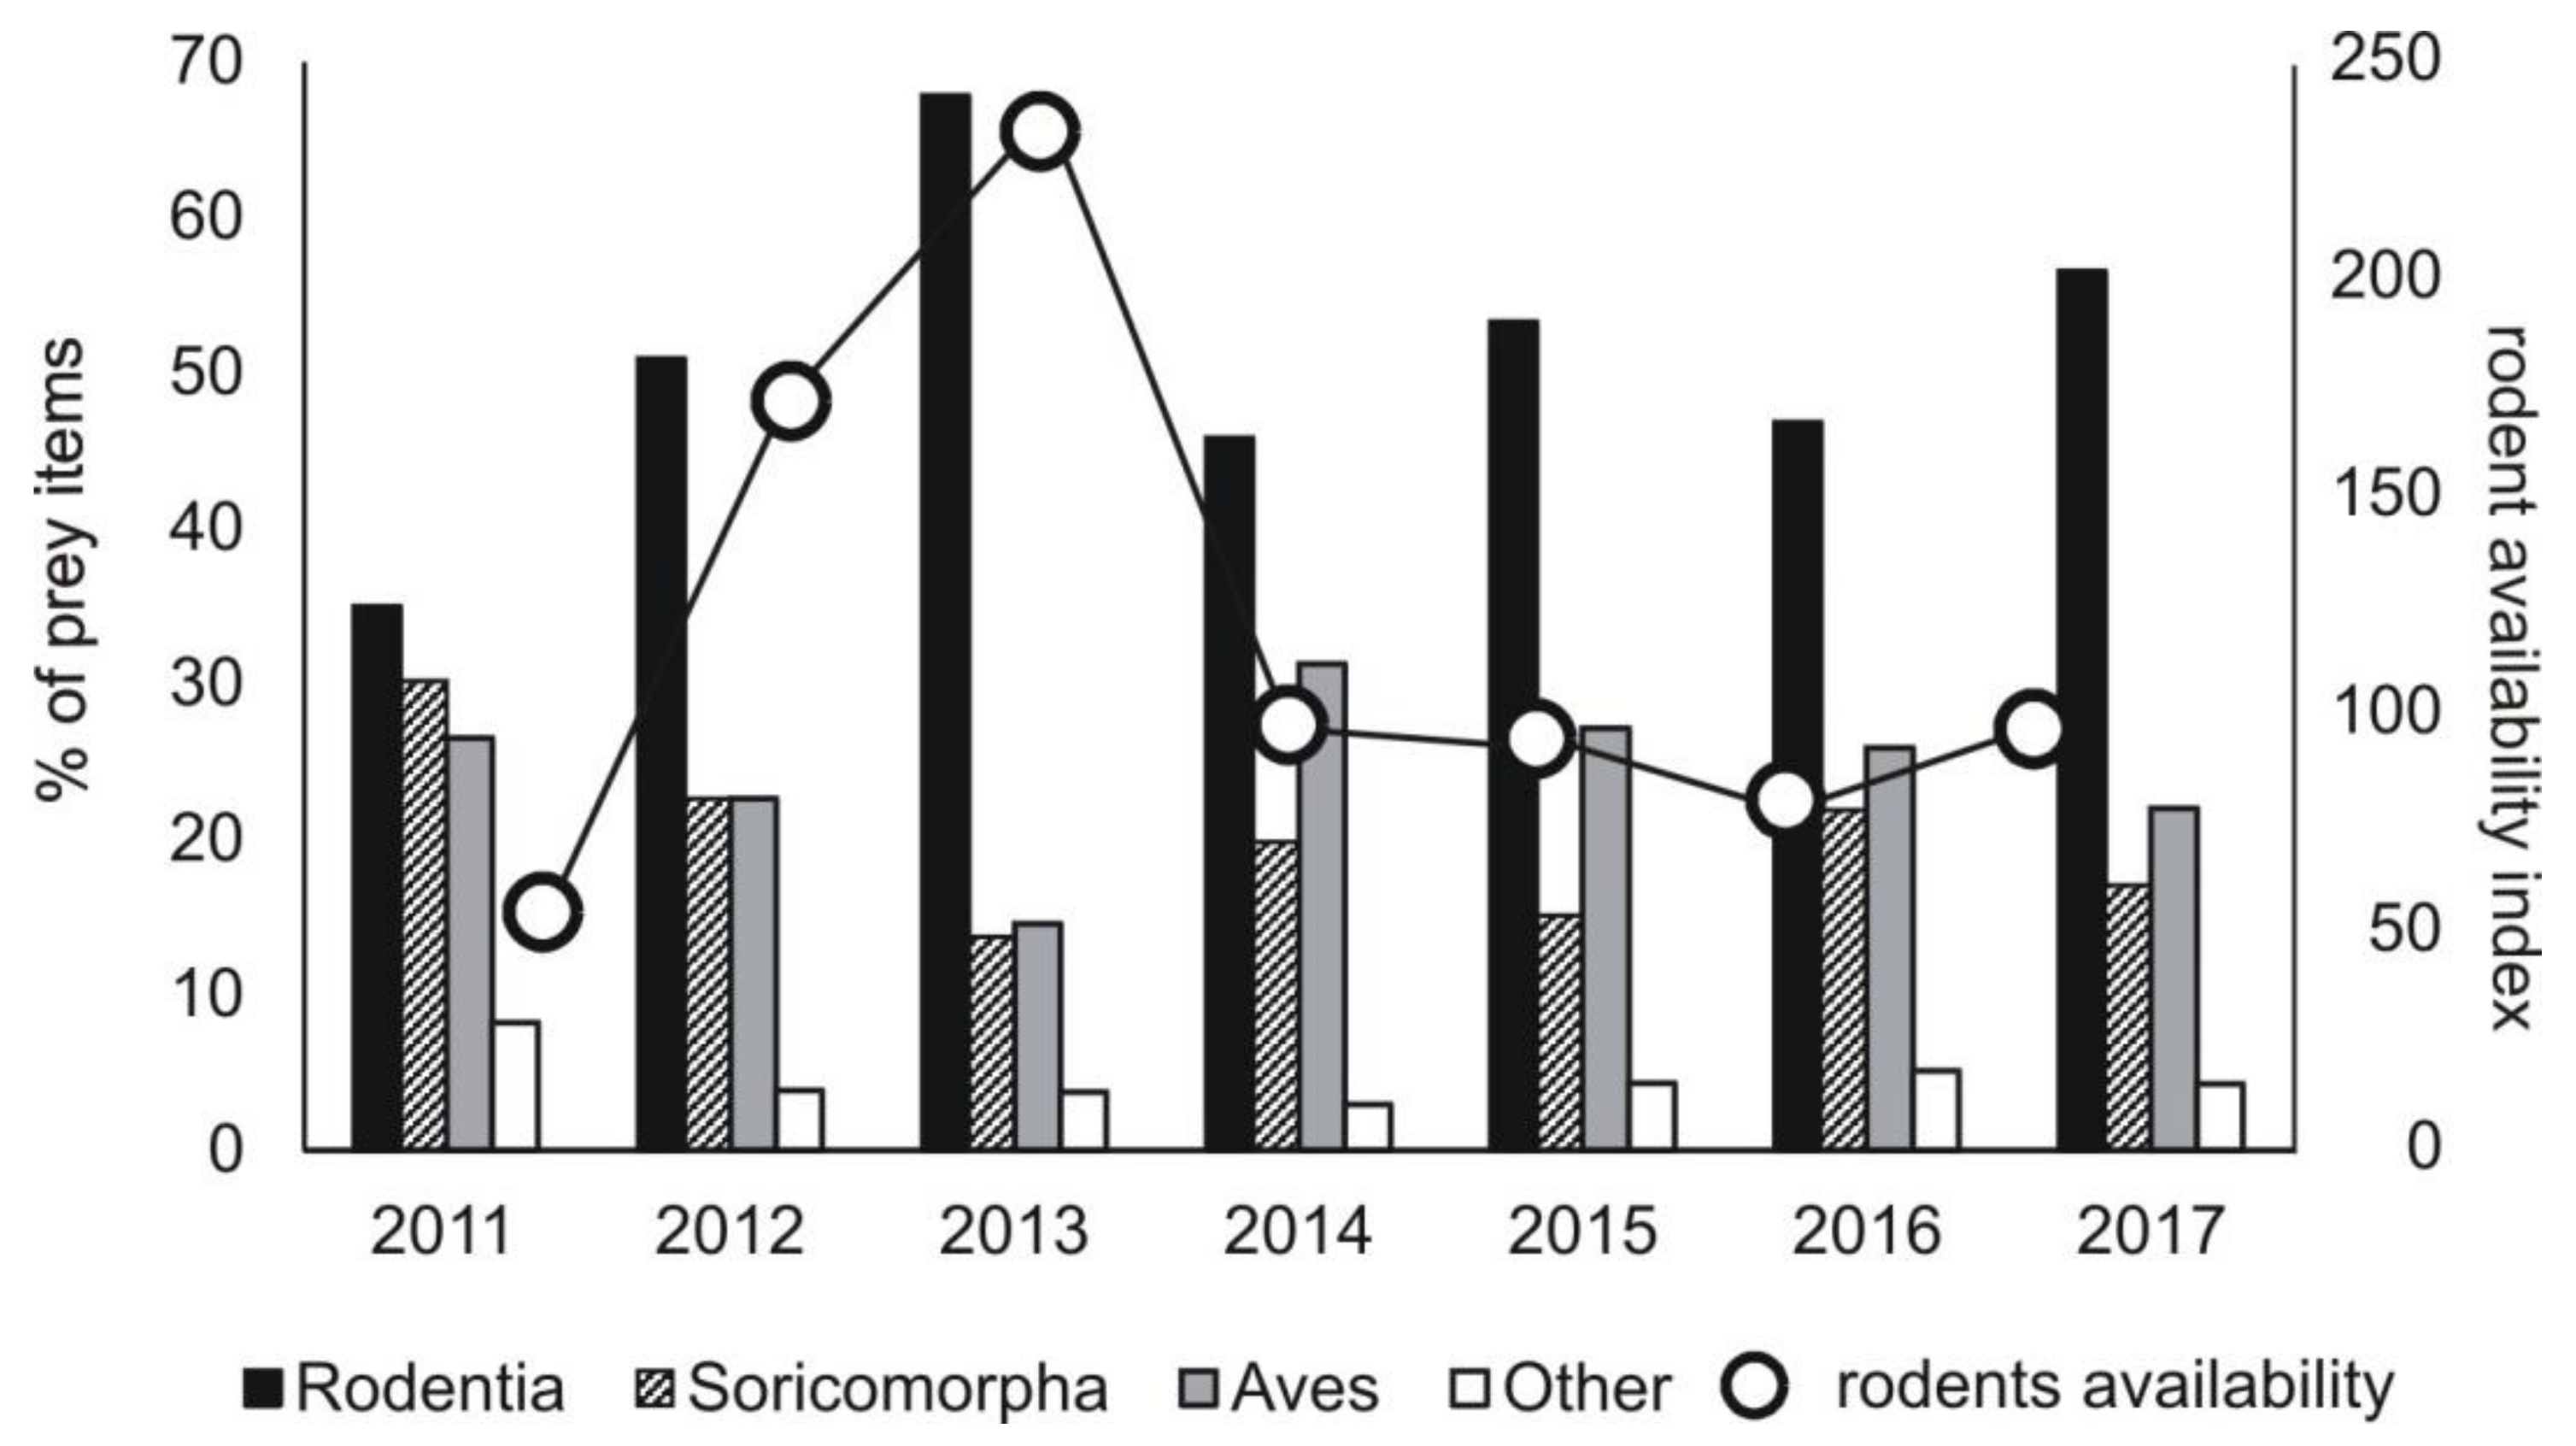
The percentage share of the main groups of prey changed in the subsequent study years. The lowest share of rodents was recorded in 2011 (30.2% of prey items), the highest in 2013 (67.9% of prey items) (chi-square test, χ2 = 166.06, df = 6, p < 0.0001) (Figure 3). The share of rodents in a diet was correlated with their availability in a given year (Pearson correlation, r = 0.809, p < 0.05) (Figure A1). When rodents were rare (in 2011), the highest share of Soricomorpha (shrews and moles) (30.2% prey items) and other prey (reptiles, amphibians, insects) was recorded in a diet, while in 2013, it was the lowest (Soricomorha: χ2 = 70.34, df = 6, p < 0.0001; other prey: χ2 = 20.33, df = 6, p < 0.005) (Figure 3).
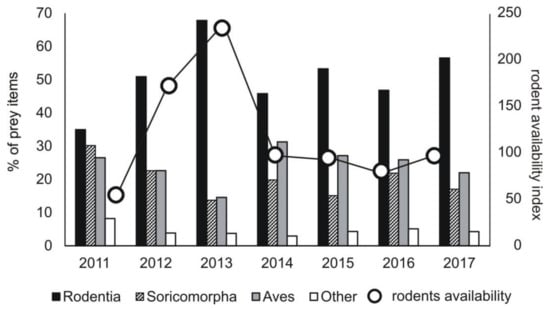
Figure 3.
Share of the main groups of prey in diet of common buzzard in the subsequent study years in the area of study (Central Poland, vicinity of Rogów village, Experimental Forest Station of Warsaw University of Life Sciences), as related to availability of small rodents (pooled density index N ind./100 trap-days for data from spring, summer, and autumn and from field and forest sampling areas, detailed data in Figure A1).
Compared to the previous study periods, a decrease in the share of voles Microtus spp. (from 44% of all prey items in 1982–1992 to 18% now) was recorded (chi-square test, χ2 = 809.28, df = 2, p < 0.0001) (Table 3). There were no detailed data on rodent availability in the previous study periods. Nevertheless, data on common vole Microtus arvalis were available for the years 1979–1982 [21]. In that time, its density showed clear cyclic abundance with minimum density of 2 ind./ha and maximum of 80 ind./ha (on average 22.5, SD = 38.3), while in the current study, pooled densities of voles from Microtus genus were more even and generally lower, i.e., the minimum value was 2.0 ind./ha, maximum 10 ind./ha (on average 7.3, SD = 2.5) (Figure A2).
Table 3.
Share of selected prey categories in common buzzard diet in the area of study (Central Poland, vicinity of Rogów village, Experimental Forest Station of Warsaw University of Life Sciences) in the three compared breeding periods. Data for 1982–1992 [21,25], 2001–2002 [26]; 2011–2018: Current study.
Decrease in the share in a diet was also evident in the case of bank vole Myodes glareolus, which in the first period constituted over 11% of all prey items, while recently, it was just 2.2% (chi-square test, χ2 = 340.18, df = 2, p < 0.0001). At the same time, the share of mice Apodemus spp. increased (from 3% in 1982–1992 to almost 19% of prey items currently) (chi-square test, χ2 = 714.11, df = 2, p < 0.0001). The share of small game (brown hare Lepus europaeus, pheasant Phasianus colchicus, grey partridge Perdix perdix) decreased, as it was almost 2% of prey items in the first study period, while currently, no such prey was recorded (Table 3).
3.3. Breeding Parameters
In the current study period, breeding success was between 53 to 87%, the lowest in 2011 when rodent abundance was very low, yet no correlation between breeding success and rodent availability (pooled density index N ind./100 trap-days for data from spring, summer, and autumn and from field and forest sampling areas, Figure A1) was found (Pearson correlation, r = 0.412, p > 0.05). However, the number of produced fledglings per breeding pair (min 0.7., max 1.8, average 1.3, SD = 1.0) and the number of fledglings per successful pair (min 1.4, max 2.2, average 1.8, SD = 0.7) depended on small rodent availability (Pearson correlation, r = 0.855, p < 0.05 and r = 0.870, p < 0.05, respectively) (Table A3). In 11 cases, breeding failure was recorded due to the nest falling down or tree being broken; in five cases, due to predators (martens Martes spp.—two cases, white-tailed eagle Haliaeetus albicilla—two cases, ravens Corvus corax—one case); in three cases, nests were abandoned when forest works were done in the close proximity. In other cases, no reason was determined.
Breeding parameters seemed to be similar or slightly lower than in the first study period 1982–1992, yet available data did not allow for statistical comparisons (Table 4).
Table 4.
Breeding parameters of the common buzzard population in the area of study (Central Poland, vicinity of Rogów village, Experimental Forest Station of Warsaw University of Life Sciences) in the three compared breeding periods. Data for 1982–1992 [21], 2001–2003 [37]; 2011–2018: Current study.
3.4. Characteristics of Nesting Trees
Almost half of the nests were built on Scots pines; larches were also important as nesting trees (more than 30% of cases). Compared to the previous study periods, the share of pine as a nesting tree decreased, while that of larch increased (Table 5).
Table 5.
Characteristics of nesting trees of the common buzzard in the area of study (Central Poland, vicinity of Rogów village, Experimental Forest Station of Warsaw University of Life Sciences) in the three compared breeding periods. Data for 1982–1992 [23], 2001–2003 [41], 2011–2018: Current study.
The mean age of nesting trees was 71 years, height of placement 18 m, and tree diameter 38 cm. Mean tree age was different in the case of Scots pine (83.5 years, SD = 14.1) and larch (56.7 years, SD = 7.2), (Mann–Whitney test, Z = 7.46, p < 0.0001). Compared to the two previous study periods, nests were located on younger trees, the other parameters remained similar, but the available data did not allow for statistical comparisons (Table 5).
4. Discussion
4.1. Abundance Dynamics in Relation to Changing Conditions
The current density of the common buzzard in our study area was high when compared to other European studies [8,10,13,42,43]. It was stable in the first study period (1982–1992; [20]), and probably at least until 1978 [21]. Then, the population started to grow (in the beginning of the 1990s), and this has continued until today. One of the reasons that might have allowed for the population growth was the decrease in the northern goshawk number. Up to 1989, the abundance of the two species was similar, but since 1989, buzzards have always been in larger numbers, and this disproportion was higher every breeding season. The abundance of goshawk dropped to 6–7 pairs [38], while that of the common buzzard peaked at 37–39 pairs in the last few years (this study). The situation from one of the forest complexes in our study area (no. 7; 70 ha; Figure 1) shows relations between the two species very well. When goshawk was present in this forest (one pair), two pairs of buzzards nested there. However, before and after this period, with goshawk absent from the forest complex, the number of pairs of buzzards increased to four [24,44,45]. Goshawks can prey on juvenile and adult buzzards (review in Reference [46]). Indeed, in our study area in 2001–2002, buzzard (mostly juveniles) constituted almost 1% of goshawks’ prey items [47]. The two species may also compete for food, as the current share of birds in a total consumed biomass by common buzzards was 60%, with more than 18% being domestic pigeons Columba livia f. domestica and poultry, the staple food of goshawks in this area [38]. Niche overlap between the two species was reported to be especially strong in times of low vole abundance, when buzzards switched to birds. This resulted in lower breeding performance of the two species [20]. Further, in our studies, a relatively high share of birds in diet was noted in time of low rodent availability. The presence of goshawks is known to be the factor that affects nest place choice by buzzards [17] and negatively influence their breeding parameters [16,18,19]. The other species that may compete with common buzzard is raven. In fact, its population decreased in our study area in previous years [48]. Moreover, in contrast to the previous study periods [26,41], no cases of buzzard persecution (i.e., shooting, cutting of nesting trees, trapping of birds) were recorded in the last few years. In the UK, reduced persecution was one of the factors that allowed a rapid population increase [9]. Finally, the factor which might have influenced the population of the common buzzard positively was the relatively mild winters in the last decades [49], as it was shown that snow cover in spring is negatively related to breeding performance [13], while changing winter weather resulted in higher survival rates, which seemed to account for an increase in population size in Germany [50].
4.2. Diet Composition and Changes in Prey Availability
Our results showed important changes in the diet composition of the common buzzard in the last 30 years, which were the result of changes in rodent availability, mainly a decrease in the abundance of voles of Microtus genus, and dampening of their population cycles. Such a collapse in vole cycles was reported in many countries [51,52,53,54], including North–Eastern and Western Poland [55], and referred to Microtus arvalis, M. agrestis and M. oeconomus [55,56]. The reasons for this are not fully explained, yet they are usually connected to climatic changes [57,58] (but see Reference [59]). When voles are available and abundant, they may form the bulk of the common buzzard’s diet, i.e., in the farmland of Western Poland, where common vole reached densities of more than 300 ind./ha in the 1970–1980s, buzzards fed mainly on those rodents (over 80% of consumed biomass) [60]. In our study area, the densities of common voles were never that high; nevertheless, in 1981, this species density was higher than 80 ind./ha [21]. In times of peak density, voles migrated from open to forest areas and even in forest complexes were one of the dominant rodent species [61]. In the 1980s, mice (Apodemus and Mus species) were rather rare in the field rodent community. This changed in the last decade, i.e., in 2011–2017 (current study), the maximum density of voles (three Microtus species pooled together) did not exceed 10 ind./ha. Further, live trapping of rodents in the first decade of the 20th century did not show high densities of voles [62]; by contrast, striped-field mice dominated in open areas [62]. This decrease in vole abundance was reflected by a drop in their share in the common buzzard diet, which decreased by over 40% in the last 35 years, and an increase in the share of striped-field mouse. The striped-field mouse is a highly adaptable species, inhabiting various habitats, i.e., fields, meadows, small woodlots, field-forest ecotone, and also urbanized areas, and expanding in the geographical range and spectrum of habitats where it lives. It is also daytime-active, which correlates with the activity pattern of the common buzzard [63,64,65,66]. The other mouse species, yellow-necked mouse, was a dominant species among rodents trapped in the forest. What is interesting is that in the field area, yellow-necked mice were trapped in considerable numbers. This was the case mostly in 2013, when their peak abundance was recorded, and mice moved from the forest to neighboring open fields. However, in the diet of the common buzzard, this species was represented marginally, i.e., its share was a bit over 1%.
The observed changes in field rodent community may be the result of climate warming. According to data from local weather station in Rogów, mean temperature increased in the last decades, while snow cover lasted a shorter time [50,67]. The other factor may be unfavorable changes in farming practices. In the 1980s, plants preferred by voles, i.e., medicago Medicago spp., other alfalfa crops, and vegetables [68] accounted for more than 11% of the whole cultivated area [21]. Currently, crop structure has changed and the aforementioned plants are not cultivated anymore; the same applies to the cultivation of oats, while potato cultivation was severely reduced. Today, cultivated areas are dominated by wheat, rape, and maize; the last two were unknown in the area 40 years ago.
We showed that common buzzards reacted to changes in rodent availability by switching to other food categories. This raptor is a food opportunist, hunting a wide spectrum of prey species [69], but focusing on those most abundant and thus most available ones [70]. In European conditions, these are usually voles Microtus spp., but in times of drop in their abundance, buzzards hunt an alternative prey, such as soricomorphs, lagomorphs, birds, including forest grouses, amphibians, reptiles, and invertebrates, including earthworms [7,71,72,73,74]. The diet composition of the common buzzard depends on the landscape structure. In Belarus, the share of voles Microtus spp. decreased, while the share of amphibians, reptiles, soricomorphs, and bank vole grew with an increasing forest cover. In agricultural areas, main prey were voles and striped-field mice, while in the suburbs, almost one fourth of consumed biomass were young domestic cats Felis catus [75]. In the Białowieża primeval forest, a big forest area, a primeval habitat for common buzzard, Soricomopha accounted for 22.5% of prey items, and bank vole (15% prey items) was the rodent species most commonly caught [35]. In areas, where voles occur in low densities (North Spain), buzzards preyed mainly on rabbits and reptiles [76]. In North Ireland, where voles were absent, main prey were rabbits Oryctolagus cuniculus, rats Rattus norvegicus, and corvids [77]. Rabbits may be the primary prey for common buzzards [14,78], and their high abundance can be responsible for the buzzard population growth [9]. In our study area, a sharp drop in the abundance of small game living in agrocenoses (i.e., brown hare, grey partridge, pheasant) was reported recently, while European rabbits went extinct [38]. However, these species were never an important prey for common buzzard in our study area, and their share in a diet dropped in the last decades. Similarly, a decrease in the share of domestic pigeons and poultry was recorded, which reflected changes in their availability due to socioeconomic changes in Polish farmland [38]. The other prey that were caught less often now were amphibians. This can also be connected to climate warming and the disappearance of most (known to us) small water bodies being the place for breeding.
4.3. Breeding Parameters and Nesting Tree Choice
Our results showed that in the last decades, the breeding success of the common buzzard did not change and was around 75%. In the 1980s, productivity per breeding pair and per successful pair was slightly higher, yet a dynamic growth of the common buzzard population was observed in the last decades. This slight drop in productivity may be density-dependent [79] or can be the result of changes in prey availability [6,80], as the first study period (1982–1992) was the only one when abundance peaks of voles were observed. Indeed, in Poland, the highest breeding parameters (1.7 juv./breeding pair, 2.3 juv./per successful pair, breeding success 72%) were shown in the 1980s in the agrocenoses of the Western part of the country, where cyclic peaks in the abundance of common voles were reported [12]. To compare, in the Białowieża National Park (vast, pristine forest), productivity was lower, i.e., 1.3 juv./breeding pair [69]. Even lower breeding parameters were shown for a continuous forest complex in South-Eastern Poland, i.e., 0.8 juv./per breeding pair and 1.6 juv./successful pair [81]. A lather low breeding success was also reported in the Italian pre-Alps in the 1990s (breeding success 72%, 1.1 juveniles per breeding pair, 1.5 juveniles per successful pair) [10].
We also showed that common buzzards adapted to changes in stand structure, i.e., when the share of Scots pine decreased, it was chosen as a nesting tree less frequently. A higher proportion of larch in stands could result in a higher availability of convenient nesting trees. This species grows fast and was used for nesting much earlier than pine, so with a felling age similar to Scots pine, larch stands were available for nesting for a longer period. Moreover, we observed that nests built on larches were much more durable than on other tree species. In Poland, Scots pine was often a dominant nesting tree [82,83,84,85], as it is the main species in the structure of Polish forests [86]. By contrast, in the Białowieża National Park, a small-leaved lime Tilia cordata dominating in stands, was also chosen most often (60% of nests), with Norway spruce Picea abies and Norway maple Acer platanoides taking the next places [69]. In various areas, different tree species can be chosen as nesting places. In Estonia, buzzards placed their nests on Norway spruces (42.3%) and on birch trees Betula spp. (27.4%) most often [87]. Norway spruce was also a dominant nesting tree in Finland [88]. In the pre-Alps area in Italy, birds built their nests on sweet chestnut Castanea sativa (tree species dominating in this area) [10,15], but they may also place their nests on rock stony ledges [10,15,89]. In the agrocenoses of Western Poland, buzzards nested in parks, roadside tree alleys, or even on single trees in the fields [12]. Such an expansion outside forest complexes was also observed in the last years in our study area. Finally, a case of common buzzard nesting in a building was reported in Spain [90]. This shows that common buzzards are very adaptable when breeding site choice is concerned.
5. Conclusions
The common buzzard is a species that inhabits various landscapes, from continuous forests to relatively open landscapes, like agrocenoses or moorlands. The field and forest mosaic of our study area is somewhere in the middle of this continuum, with highly available nest sites (mature trees) and open arable lands, with abundant small rodents, as a hunting place. At the same time, this is the type of landscape that undergoes a variety of changes, i.e., changes in farming practices affect prey availability, forest management affects nest site availability, and the socioeconomic situation may result in lower or higher persecution of birds by farmers. In our case, both positive (lower persecution, higher availability of nesting trees) and negative (lower abundance of voles as preferred rodent prey) changes took place. Common buzzards adapted well to these changes and, despite being forced to switch to an alternative prey, their population grew significantly. The last factor which probably allowed this population growth might have been the drop in the northern goshawk number, a raptor species that may affect the common buzzard negatively.
Author Contributions
Conceptualization, J.G.; Methodology, J.G.; Investigation, J.G., D.K.-G.; Data curation, J.G., D.K.-G.; Writing—Original draft preparation, J.G., D.K.-G.; Writing—Review and editing, J.G., D.K.-G.; Supervision, J.G.; Project administration, J.G.; Funding acquisition, J.G.
Funding
The research was conducted within the framework of the research topics entitled “Population dynamics, diet composition and food niche overlap in birds of prey (Falconiformes) and owls (Strigiformes) in central Poland” (240115), as well as “Monitoring and analysis of long-term population trends in birds of prey (Falconiformes) and the raven (Corvus corax) in central Poland” (240104).
Conflicts of Interest
The authors declare no conflict of interest. The funders had no role in the design of the study; in the collection, analyses, or interpretation of data; in the writing of the manuscript, or in the decision to publish the results.
Appendix A
Table A1.
Species composition of rodents trapped in field and forest sampling area in Central Poland, vicinity of Rogów village, Experimental Forest Station of Warsaw University of Life Sciences in the years 2011–2017.
Table A1.
Species composition of rodents trapped in field and forest sampling area in Central Poland, vicinity of Rogów village, Experimental Forest Station of Warsaw University of Life Sciences in the years 2011–2017.
| Species | Forest | Field |
|---|---|---|
| % | ||
| Apodemus agrarius | - | 69.2 |
| Apodemus flavicollis | 71.5 | 11.6 |
| Myodes glareolus | 28.5 | - |
| Microtus spp. | - | 8.3 |
| Mus musculus | - | 7.6 |
| Apodemus sylvaticus | - | 1.7 |
| Other | - | 1.6 |
| N | 554 | 576 |
Table A2.
Detailed diet composition of common buzzard in the area of study (Central Poland, vicinity of Rogów village, Experimental Forest Station of Warsaw University of Life Sciences) in the years 2011–2018, as based on analysis of remains from plucking sites and pellets.
Table A2.
Detailed diet composition of common buzzard in the area of study (Central Poland, vicinity of Rogów village, Experimental Forest Station of Warsaw University of Life Sciences) in the years 2011–2018, as based on analysis of remains from plucking sites and pellets.
| Prey | N Prey | Body Mass | Biomass | Prey | Biomass |
|---|---|---|---|---|---|
| (g) | % | ||||
| Microtus arvalis | 514 | 20 | 10,280 | 10.1 | 5.8 |
| Microtus oeconomus | 50 | 42 | 2100 | 1.0 | 1.2 |
| Microtus subterraneus | 3 | 20 | 60 | 0.1 | 0.0 |
| Microtus spp. | 337 | 25 | 8425 | 6.6 | 4.7 |
| ∑ Microtus | 904 | 20,865 | 17.7 | 11.7 | |
| Apodemus agrarius | 491 | 24 | 11,784 | 9.6 | 6.6 |
| Apodemus flavicollis | 64 | 31 | 1984 | 1.3 | 1.1 |
| Apodemus sylvaticus | 52 | 22 | 1144 | 1.0 | 0.6 |
| Apodemus spp. | 340 | 27 | 9180 | 6.7 | 5.2 |
| ∑ Apodemus | 947 | 24,092 | 18.6 | 13.5 | |
| Mus musculus | 70 | 15 | 1050 | 1.4 | 0.6 |
| Micromys minutus | 31 | 7 | 217 | 0.6 | 0.1 |
| Rattus norvegicus | 8 | 200 | 1600 | 0.2 | 0.9 |
| Myodes glareolus | 112 | 18 | 2016 | 2.2 | 1.1 |
| Sciurus vulgaris | 2 | 250 | 500 | 0.0 | 0.3 |
| Rodentia indet. | 608 | 22 | 13,376 | 11.9 | 7.5 |
| ∑ Rodentia | 2682 | 18,759 | 52.6 | 10.5 | |
| Talpa europaea | 737 | 80 | 58,960 | 14.4 | 33.1 |
| Sorex araneus | 122 | 8 | 976 | 2.4 | 0.5 |
| Sorex minutus | 47 | 5 | 235 | 0.9 | 0.1 |
| Sorex spp. | 71 | 6.5 | 461.5 | 1.4 | 0.3 |
| Lepus europaeus juv. | 2 | 100 | 200 | 0.0 | 0.1 |
| Oryctolagus cuniculus f. dom. | 2 | 200 | 400 | 0.0 | 0.2 |
| Mustela sp. | 4 | 45 | 180 | 0.1 | 0.1 |
| Felis catus juv. | 28 | 200 | 5600 | 0.5 | 3.1 |
| Sus domestica | 1 | 200 | 200 | 0.0 | 0.1 |
| Canis familiaris juv. | 6 | 200 | 1200 | 0.1 | 0.7 |
| Capreolus capreolus | 1 | 200 | 200 | 0.0 | 0.1 |
| ∑ Mammalia | 3703 | 68,612.5 | 72.6 | 38.6 | |
| Columba livia f. dom. | 49 | 400 | 19,600 | 1.0 | 11.0 |
| Columba palumbus | 19 | 475 | 9025 | 0.4 | 5.1 |
| Streptopelia decaocto | 10 | 225 | 2250 | 0.2 | 1.3 |
| Asio otus | 1 | 250 | 250 | 0.0 | 0.1 |
| Gallus domesticus | 26 | 500 | 13,000 | 0.5 | 7.3 |
| Dendrocopos major | 30 | 70 | 2100 | 0.6 | 1.2 |
| Dendrocopos spp. | 5 | 70 | 350 | 0.1 | 0.2 |
| Motacilla alba | 7 | 24 | 168 | 0.1 | 0.1 |
| Turdus philomelos | 50 | 50 | 2500 | 1.0 | 1.4 |
| Turdud pilastris | 6 | 70 | 420 | 0.1 | 0.2 |
| Turdus viscivorus | 4 | 80 | 320 | 0.1 | 0.2 |
| Turdus merula | 35 | 70 | 2450 | 0.7 | 1.4 |
| Turdus spp. | 63 | 65 | 4095 | 1.2 | 2.3 |
| Phylloscopus spp. | 19 | 8 | 152 | 0.4 | 0.1 |
| Ficedula spp. | 5 | 15 | 75 | 0.1 | 0.0 |
| Parus major | 23 | 20 | 460 | 0.5 | 0.3 |
| Paridae spp. | 18 | 18 | 324 | 0.4 | 0.2 |
| Alauda arvensis | 22 | 38 | 836 | 0.4 | 0.5 |
| Sitta europea | 10 | 22 | 220 | 0.2 | 0.1 |
| Garrulus glandarius | 74 | 175 | 12,950 | 1.5 | 7.3 |
| Sturnus vulgaris | 110 | 80 | 8800 | 2.2 | 4.9 |
| Passer spp. | 60 | 25 | 1500 | 1.2 | 0.8 |
| Fringilla coelebs | 22 | 20 | 440 | 0.4 | 0.2 |
| Chloris chloris | 3 | 26 | 78 | 0.1 | 0.0 |
| Coccothraustes coccothraustes | 30 | 55 | 1650 | 0.6 | 0.9 |
| Emberiza citrinella | 20 | 30 | 600 | 0.4 | 0.3 |
| Small bird unident. | 303 | 25 | 7575 | 5.9 | 4.3 |
| Medium bird unident. | 195 | 75 | 14,625 | 3.8 | 8.2 |
| ∑ Aves | 1219 | 10,6813 | 23.9 | 60.0 | |
| Rana spp. | 18 | 15 | 270 | 0.4 | 0.2 |
| Natrix natrix | 10 | 100 | 1000 | 0.2 | 0.6 |
| Anguis fragilis | 26 | 30 | 780 | 0.5 | 0.4 |
| Lacertidae | 31 | 12 | 372 | 0.6 | 0.2 |
| Insecta | 96 | 1 | 96 | 1.9 | 0.1 |
| Total | 5103 | 177,943.5 | 100.0 | 100.0 | |
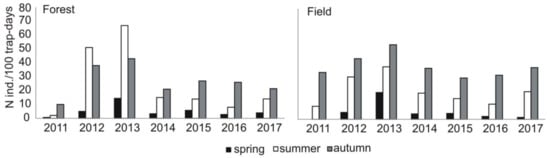
Figure A1.
Changes in small rodent density in two (forest and field) sampling areas in the area of study (Central Poland, vicinity of Rogów village, Experimental Forest Station of Warsaw University of Life Sciences) in the years 2011–2017 as based on live trapping.
Figure A1.
Changes in small rodent density in two (forest and field) sampling areas in the area of study (Central Poland, vicinity of Rogów village, Experimental Forest Station of Warsaw University of Life Sciences) in the years 2011–2017 as based on live trapping.
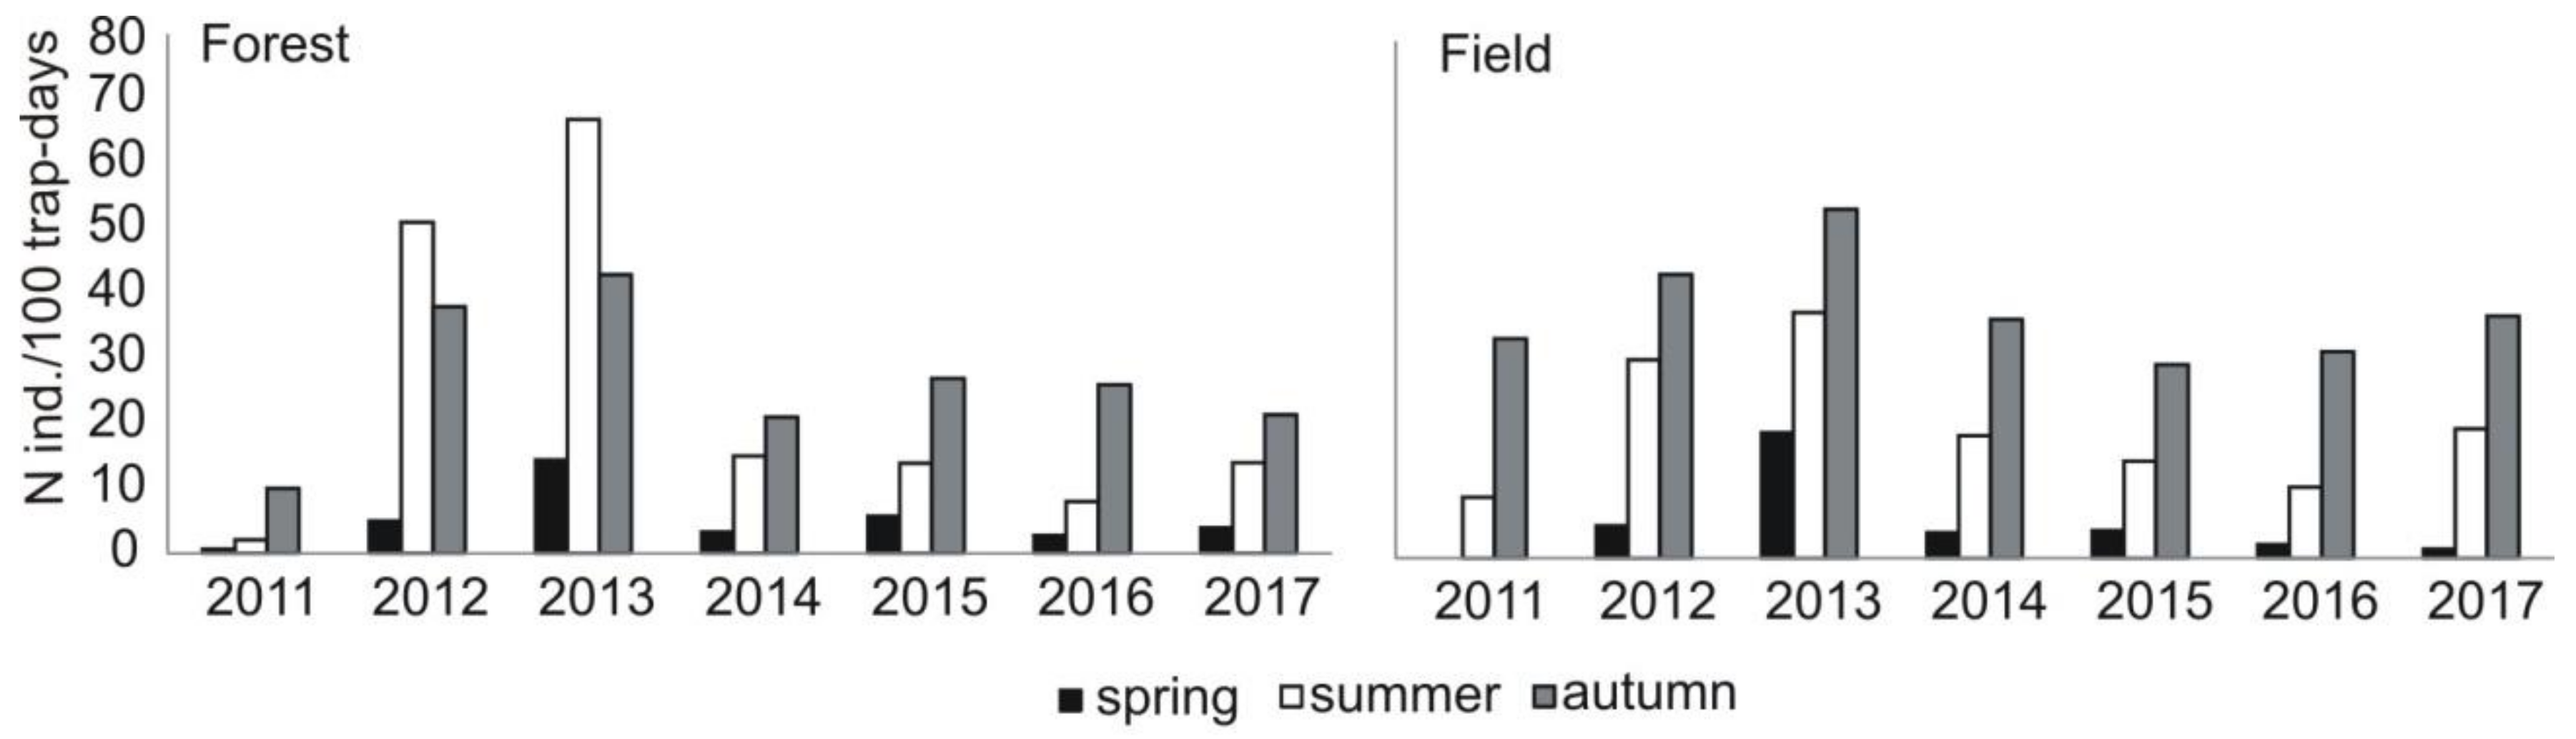
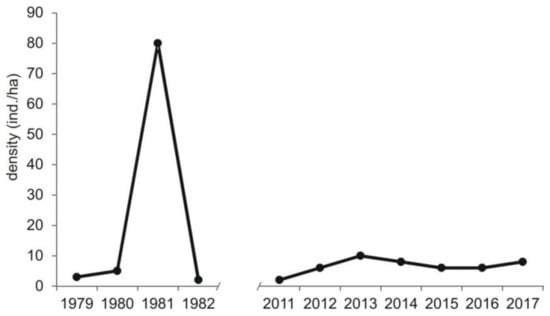
Figure A2.
Density of voles Microtus spp. currently (this study) and of common vole Microtus arvalis in the beginning of 1980s [21] in Central Poland, vicinity of Rogów village, Experimental Forest Station of Warsaw University of Life Sciences.
Figure A2.
Density of voles Microtus spp. currently (this study) and of common vole Microtus arvalis in the beginning of 1980s [21] in Central Poland, vicinity of Rogów village, Experimental Forest Station of Warsaw University of Life Sciences.

Table A3.
Breeding parameters of common buzzard population in the area of study (Central Poland, vicinity of Rogów village, Experimental Forest Station of Warsaw University of Life Sciences) in the subsequent years.
Table A3.
Breeding parameters of common buzzard population in the area of study (Central Poland, vicinity of Rogów village, Experimental Forest Station of Warsaw University of Life Sciences) in the subsequent years.
| Year | Breeding Success | N Fledglings Per | |
|---|---|---|---|
| Breeding Pair | Successful Pair | ||
| 2011 | 53 | 0.8 | 1.4 |
| 2012 | 87 | 1.7 | 2.0 |
| 2013 | 73 | 1.8 | 2.2 |
| 2014 | 76 | 1.4 | 1.9 |
| 2015 | 79 | 1.2 | 1.6 |
| 2016 | 77 | 1.4 | 1.8 |
| 2017 | 70 | 1.2 | 1.7 |
| 2018 | 76 | 1.2 | 1.7 |
References
- Chylarecki, P.; Chodkiewicz, T.; Neubauer, G.; Sikora, A.; Meissner, W.; Woźniak, B.; Wylegała, P.; Ławicki, Ł.; Marchowski, D.; Betleja, J.; et al. Trendy Liczebności Ptaków w Polsce; Główny Inspektorat Ochrony Środowiska: Warszawa, Poland, 2018.
- Adamski, A.; Olech, B.; Lontkowski, J. Common Buzzard Buteo buteo. In The Atlas of Breeding Birds in Poland 1985–2004; Sikora, A., Rodhe, Z., Gromadzki, M., Neubauer, G., Chylarecki, P., Eds.; Bogucki Wydawnictwo Naukowe: Poznań, Poland, 2007; pp. 145–147. [Google Scholar]
- Hagemeijer, E.J.M.; Blair, M.J. (Eds.) The EBCC Atlas of European Breeding Birds: Their Distribution and Abundance; T & AD Poyser: London, UK, 1997. [Google Scholar]
- Border, J.A.; Massimino, D.; Gillings, S. Potential Future Distribution and Abundance Patterns of Common Buzzards Buteo buteo; Research Report 707; British Trust for Ornithology: Thetford, UK, 2018. [Google Scholar]
- Kovács, A.; Burfield, I. Diurnal forest raptors in Europe: Population estimates, trends, threats and conservation. In Ecology and Conservation of European Forest–Dwelling Raptors; Zuberogoitia, I., Martinez, J.E., Eds.; Departamento de Agricultura de la Diputación Foral de Bizkaia: Bilbao, Spain, 2012; pp. 28–39. [Google Scholar]
- Sim, I.M.W.; Cross, A.V.; Lamacraft, D.L.; Pain, D.J. Correlates of Common Buzzards Buteo buteo density and breeding success in the West Midlands. Bird Study 2001, 48, 317–329. [Google Scholar] [CrossRef]
- Snow, D.W.; Perrins, C.M. The Birds of Western Palearctic, Concise Edition; Oxford University Press: Oxford, UK; New York, NY, USA, 1998; Volume 1. [Google Scholar]
- Halley, D.J. Population changes and territorial distribution of Common Buzzards Buteo buteo in the Central Highlands, Scotland. Bird Study 1993, 40, 24–30. [Google Scholar] [CrossRef]
- Sim, L.M.; Campbell, L.; Pain, D.J.; Wilson, J.D. Correlates of the population increase of the Common Buzzards Buteo buteo in the West Midlands between 1983 and 1996. Bird Study 2000, 47, 154–164. [Google Scholar] [CrossRef]
- Sergio, F.; Boto, A.; Scandolara, C.; Bogliani, G. Density, nest sites, diet, and productivity of common buzzards (Buteo buteo) in the Italian pre-Alps. J. Raptor Res. 2002, 36, 24–32. [Google Scholar]
- Pugacewicz, E. Changes in the numbers of bird of prey in the agricultural landscape of the Równina Bielska plain (eastern Poland) in 1983–1996. Not. Orn. 1997, 38, 183–196. [Google Scholar]
- Pielowski, Z. The population and breeding success of predatory birds on farmland near Czempiń (Western Poland). Acta Ornithol. 1991, 26, 107–118. [Google Scholar]
- Selås, V. Breeding density and brood size of common buzzard Buteo buteo in relation to snow cover in spring. Ardea 2001, 89, 471–479. [Google Scholar]
- Graham, I.M.; Redpath, S.M.; Thirgood, S.J. The diet and breeding density of Common Buzzards Buteo buteo in relation to indices of prey abundance. Bird Study 1995, 42, 165–173. [Google Scholar] [CrossRef]
- Sergio, F.; Scandolara, C.; Marchesi, L.; Pedrini, P.; Penteriani, V. Effect of agro-forestry and landscape changes on common buzzards (Buteo buteo) in the Alps: Implications for conservation. Anim. Conserv. 2005, 8, 17–25. [Google Scholar] [CrossRef]
- Kostrzewa, A. Interspecific interaction competition in three European raptor species. Ethol. Ecol. Evol. 1991, 3, 127–143. [Google Scholar] [CrossRef]
- Krüger, O. Analysis of nest occupancy and nest reproduction in two sympatric raptors: Common buzzard Buteo buteo and goshawk Accipiter gentilis. Ecography 2002, 25, 523–532. [Google Scholar] [CrossRef]
- Krüger, O. Interaction between common buzzard Buteo buteo and goshawk Accipiter gentilis: Trade-offs revealed by a field experiment. Oikos 2002, 96, 441–452. [Google Scholar] [CrossRef]
- Hakkarainen, H.; Mykrä, S.; Kurki, S.; Tornberg, R.; Jungell, S. Competitive interaction among raptors in boreal forests. Oecologia 2004, 141, 420–424. [Google Scholar] [CrossRef] [PubMed]
- Goszczyński, J. Density and productivity of common buzzard Buteo buteo and Goshawk Accipiter gentilis populations in Rogów, central Poland. Acta Ornithol. 1997, 32, 149–155. [Google Scholar]
- Goszczyński, J. The Effect of Structural Differentiation of Ecological Landscape on the Predator-Prey Interactions; Treatises and Monographs, Publications of Warsaw Agricultural University SGGW-AR: Warsaw, Poland, 1985. [Google Scholar]
- Goszczyński, J. The food habits of Buzzards and Goshawks during the nesting period. In Proceedings of the XXth Congress of the International Union of Game Biologists, Gödöllő, Hungary, 21–26 August 1991; Csanyi, S., Ernhaft, J., Eds.; pp. 387–390. [Google Scholar]
- Goszczyński, J. The breeding performance of the Common Buzzard Buteo buteo and Goshawk Accipiter gentilis in Central Poland. Acta Ornithol. 2001, 36, 105–110. [Google Scholar] [CrossRef]
- Goszczyński, J.; Gryz, J.; Krauze, D. Fluctuations of a Common Buzzard Buteo buteo population in Central Poland. Acta Ornithol. 2005, 40, 75–78. [Google Scholar] [CrossRef]
- Goszczyński, J.; Piłatowski, T. Diet of common buzzards (Buteo buteo) and Goshawks (Accipiter gentilis) in the nesting period. Ekol. Pol. 1986, 34, 655–667. [Google Scholar]
- Gryz, J.; Krauze-Gryz, D. The influence of raptors (Falconiformes) and raven (Corvus corax) on populations of game animals. Ann. WULS-SGGW For. Wood Technol. 2014, 86, 114–124. [Google Scholar]
- Wasilewski, G. (The Rogów Forest District) Based on Forest Management Plans for the Rogów Forest District. Personal communication, 2018. [Google Scholar]
- Pucek, Z. (Ed.) Keys to Vertebrates of Poland-Mammals; Polish Scientific Publishers: Warsaw, Poland, 1981. [Google Scholar]
- Moreno, E. Clave osteologica para la identification de los Passeriformes Ibericos. 1. Aegithalidae, Remizidae, Fringiliade, Alaudidae. Ardeola 1985, 32, 295–377. [Google Scholar]
- Moreno, E. Clave osteologica para la identification de los Passeriformes Ibericos. 2. Hirundinidae, Prunellidae, Sittidae, Cerothidae, Troglotytidae, Cinclidae, Lanidae, Oriolodae, Corvidae, Sturnidae, Motacillidae. Ardeola 1986, 33, 69–129. [Google Scholar]
- März, R. Gewöll- und Rupfungskunde; Akademie-Verlang: Berlin, Germany, 1987. [Google Scholar]
- Ujhelyi, P. Identification of the Fringillidae of Europe on the basis of craniometric characteristics. Aquila 1992, 99, 99–110. [Google Scholar]
- Teerink, B.J. Hair of West-European Mammals; Working Papers of the Research Institute for Nature Management; Cambridge University Press: Dutch, The Netherlands, 1991. [Google Scholar]
- Szczepski, B.; Kozłowski, P. Pomocnicze Tabele Ornitologiczne; PWN: Warsaw, Poland, 1953. [Google Scholar]
- Jędrzejewska, B.; Jędrzejewski, W. Predation in Vertebrate Communities, the Białowieża Primeval Forest as a Case Study; Springer: Berlin/Heidelberg, Germany, 1998. [Google Scholar]
- Aulak, W.; Rowiński, P. Tabele Biologiczne Kręgowców; Wydawnictwo SGGW: Warsaw, Poland, 2010. [Google Scholar]
- Gryz, J.; Krauze, D.; Goszczyński, J. Abundance of bird of prey Falconiformes and raven Corvus corax in the vicinity of Rogów, central Poland. Not. Orn. 2006, 47, 43–57. [Google Scholar]
- Gryz, J.; Krauze-Gryz, D. Pigeon and poultry breeders, friends or enemies of northern goshawk? A long term study in central Poland. Animals 2019. Under review. [Google Scholar]
- Hammer, Ø.; Harper, D.A.T.; Ryan, P.D. PAST: Paleontological Statistics Software Package for Education and Data Analysis. Palaeontol. Electron. 2001, 4, 9. [Google Scholar]
- Gryz, J. Ecology of Northern Goshawk Accipiter Gentilis Population in the Experimental Forest Station in Rogów. Master’s Thesis, Warsaw University of Life Sciences, Warsaw, Poland, 2003. [Google Scholar]
- Krauze, D. Ecology of Common Buzzard Buteo Buteo Population in the Experimental Forest Station in Rogów. Master’s Thesis, Warsaw University of Life Sciences, Warsaw, Poland, 2003. [Google Scholar]
- Tzortzakaki, O.; Simaiakis, S.; Xiroucgakis, S. Abundance of common buzzards (Buteo buteo) in olive monocultures in the island of Crete. J. Biol. Res. Thessalon. 2012, 17, 44–50. [Google Scholar]
- Penteriani, V.; Faivre, B. Breeding density and landscape-level habitat selection of common buzzards (Buteo buteo) in a mountains area (Abruzzo Apennines, Italy). J. Raptor Res. 1997, 31, 208–212. [Google Scholar]
- Gryz, J. Monitoring and Analysis of Long-Term Abundance Trends of Birds of Prey (Falconiformes) and Raven (Corvus corax) in Central Poland; Forest Research Institute: Sękocin Stary, Poland, 2013. [Google Scholar]
- Gryz, J. (Forest Research Institute, Sękocin Stary, Poland). Unpublished data. 2018. [Google Scholar]
- Krüger, O. The importance of competition, food, habitat, weather and phenotype for the reproduction of Buzzard Buteo buteo. Bird Study 2004, 51, 125–132. [Google Scholar] [CrossRef]
- Krauze, D.; Gryz, J.; Goszczyński, J. Food composition of the goshawk Accipiter gentilis L. 1758 during the nesting season in the Rogów Forest (central Poland). Fol. For. Pol. Ser. A-For. 2005, 47, 45–53. [Google Scholar]
- Gryz, J.; Krauze-Gryz, D. Indirect influence of African swine fever outbreak on raven (Corvus corax) population. Animals 2019, 9, 41. [Google Scholar] [CrossRef] [PubMed]
- Gryz, J.; Chojnacka-Ożga, L.; Krauze-Gryz, D. A tawny owl (Strix aluco) population remains stable despite changing environmental conditions—A case study from central Poland. Pol. J. Ecol. 2019, in press. [Google Scholar]
- Jonker, R.M.; Chakarov, N.; Krüger, O. Climate change and habitat heterogeneity drive a population increase in Common Buzzards Buteo buteo through effects on survival. IBIS 2014, 156, 97–106. [Google Scholar] [CrossRef]
- Ims, R.A.; Henden, J.; Killengreen, S.T. Collapsing population cycles. Trends Ecol. Evol. 2008, 23, 79–86. [Google Scholar] [CrossRef] [PubMed]
- Kausrud, K.L.; Mysterud, A.; Steen, H.; Vik, J.O.; Østbe, E.; Cazelles, B.; Framstad, E.; Eikset, A.M.; Mysterud, I.; Solhøy, T.; et al. Linking climate change to lemming cycles. Nature 2008, 456, 93–97. [Google Scholar] [CrossRef] [PubMed]
- Cornulier, T.; Yoccoz, N.G.; Bretagnolle, V.; Brommer, J.E.; Butet, A.; Ecke, F.; Elston, D.A.; Framstad, E.; Henttonen, H.; Hörnfeldt, B.; et al. Europe-wide dampening of population cycles in keystone herbivores. Science 2013, 340, 63–66. [Google Scholar] [CrossRef] [PubMed]
- Gouveia, A.; Bejček, V.; Flousek, J.; Sedláček, F.; Stastný, K.; Zima, J.; Yoccoz, N.; Stenseth, N.; Tkadlec, E. Long-term pattern of population dynamics in the field vole from central Europe: Cyclic pattern with amplitude dampening. Popul. Ecol. 2015, 57, 581–589. [Google Scholar] [CrossRef]
- Bierman, S.M.; Fairbairn, J.P.; Petty, S.J.; Elston, D.A.; Tidhar, D.; Lambin, X. Changes over time in the spatiotemporal dynamics of cyclic populations of field vole (Microtus agrestis L.). Am. Nat. 2006, 167, 583–590. [Google Scholar] [CrossRef] [PubMed]
- Gliwicz, J.; Jancewicz, E. Cascade effect of climate warming: Snow duration-vole population dynamics-biodiversity. Br. J. Environ. Clim. Chang. 2016, 6, 43–52. [Google Scholar] [CrossRef]
- Hörnfeldt, B. Long-term decline in numbers of cyclic vole in boreal Sweden: Analysis and presentation of hypotheses. Oikos 2004, 107, 376–392. [Google Scholar] [CrossRef]
- Hoset, K.S.; Le Galliard, J.; Gundersen, G. Demographic responses to a mild winter in enclosed vole populations. Popul. Ecol. 2009, 51, 279–288. [Google Scholar] [CrossRef]
- White, T.C.R. What has stopped the cycles of sub-Arctic animal populations? Predators or food? Basic Appl. Ecol. 2011, 12, 481–487. [Google Scholar] [CrossRef]
- Truszkowski, J. Role of the Common Buzzard (Buteo buteo L.) in agrocenoses of the Middle Wielkopolska. Pol. Ecol. Stud. 1976, 2, 103–111. [Google Scholar]
- Kurzyna, M. Annual Changes in Abundance and Species Composition of Small Rodents in Górki Forest Complex. Master’s Thesis, Warsaw University of Life Sciences, Warsaw, Poland, 1982. [Google Scholar]
- Gryz, J.; Krauze-Gryz, D.; Lesiński, G. Mammals in the vicinity of Rogów (central Poland). Fragm. Faun. 2011, 54, 183–197. [Google Scholar] [CrossRef]
- Gliwicz, J.; Kryštufek, B. Apodemus agrarius. In The Atlas of European Mammals; Mitchell-Jones, A.J., Amori, G., Bogdanowicz, W., Kryštufek, B., Reijnders, P.J.H., Spitzenberge, F., Stubbe, M., Thissen, J.B.M., Vohralík, V., Zima, J., Eds.; Academic Press: London, UK, 1999. [Google Scholar]
- Gryz, J.; Krauze, D.; Goszczyński, J. The small mammals of Warsaw as based on the analysis of tawny owl (Strix aluco) pellets. Ann. Zool. Fenn. 2008, 45, 281–285. [Google Scholar] [CrossRef]
- Kaneko, Y.; Kryštufek, B.; Zagarondnyuk, I.; Vohralík, V.; Batsaikhan, N.; Avirmed, D.; Sukhchuluun, G. Apodemus agrarius (errata version published in 2017). In The IUCN Red List of Threatened Species; 2016; e.T1888A115057408; Available online: http://dx.doi.org/10.2305/IUCN.UK.2016-3.RLTS.T1888A22422191.en (accessed on 3 February 2019).
- Tulis, F.; Ambros, M.; Baláž, I.; Žiak, D.; Hulejová Sládkovičová, V.; Miklós, P.; Dudich, A.; Stollmann, A.; Kliment, P.; Somogyi, B.; et al. Expansion of the Striped field mouse (Apodemus agrarius) in the south-western Slovakia during 2010–2015. Fol. Oecol. 2016, 43, 64–73. [Google Scholar]
- Chojnacka-Ożga, L.; Ożga, W. Air temperature anomalies in experimental forests in Rogow in 1924–2015. For. Res. Pap. 2018, 79, 37–44. [Google Scholar] [CrossRef]
- Babińska-Werka, J. Estimation of losses caused by field vole Microtus arvalis (Pallas 1778) in alfalfa fields. EPPO Bull. 1978, 8, 43–46. [Google Scholar] [CrossRef]
- Jędrzejewski, W.; Szymura, A.; Jędrzejewska, B. Reproduction and food of the Buzzard Buteo buteo in the relation to the abundance of rodents and birds in Białowieża National Park, Poland. Ecol. Ethol. Evol. 1994, 8, 1–18. [Google Scholar]
- Goszczyński, J. Connection between predatory birds and mammals and their prey. Acta Theriol. 1977, 22, 527–534. [Google Scholar] [CrossRef]
- Reif, V.; Tornberg, R.; Jungell, S.; Korpimäki, E. Diet variation of common buzzards in Finland supports the alternative prey hypothesis. Ecography 2001, 24, 267–274. [Google Scholar] [CrossRef]
- Selås, V. Predation on reptiles and birds by the common buzzard, Buteo buteo, in relations to changes in its main prey, voles. Can. J. Zool. 2001, 79, 2086–2093. [Google Scholar] [CrossRef]
- Voříšek, P.; Krištín, A.; Obuch, J.; Votýpka, J. Diet of Common Buzzard in the Czech Republic and its importance for gamekeeping. Buteo 1997, 9, 57–68. [Google Scholar]
- Tubbs, C.R. The Common Buzzard; David & Charles Ltd.: Devon, UK, 1974. [Google Scholar]
- Sidorovich, A.A.; Ivanovskij, V.V.; Sidorovich, V.E.; Solovej, I.A. Landscape-related variation in the diet composition of the common buzzard (Buteo buteo) in Belarus. Slovak Raptor J. 2016, 10, 65–74. [Google Scholar] [CrossRef]
- Mañosa, S.; Cordero, P.J. Seasonal and sexual variation in the diet of the common buzzard in northeastern Spain. J. Raptor Res. 1992, 26, 235–238. [Google Scholar]
- Rooney, E.; Montgomery, W.I. Diet diversity of the Common Buzzard (Buteo buteo) in a vole-less environment. Bird Study 2013, 60, 147–155. [Google Scholar] [CrossRef]
- Kenward, R.E.; Hall, D.G.; Walls, S.S.; Hodder, K.H. Factors affecting predation by buzzards Buteo buteo on released pheasants Phasianus colchicus. J. Appl. Ecol. 2001, 38, 813–822. [Google Scholar] [CrossRef]
- Carrete, M.; Donázar, J.A.; Margalida, A. Density-depended productivity depression in Pyrenean Bearded Vulture: Implications for conservation. Ecol. Appl. 2006, 16, 1674–1682. [Google Scholar] [CrossRef]
- Swann, R.L.; Etheridge, B. A comparison of breeding success and prey of the Common Buzzard in two areas of northern Scotland. Bird Study 1995, 42, 37–43. [Google Scholar] [CrossRef]
- Matusiak, J.; Wojciak, J.; Keller, M. Distribution, abundance and breeding performance of birds of prey Falconiformes in Strzeleckie Forests. Not. Orn. 2002, 43, 145–161. [Google Scholar]
- Bednorz, J.; Kosiński, Z. Liczebność, rozmieszczenie i efekty rozrodu leśnych ptaków drapieżnych i kruka Corvus corax w Wielkopolskim Parku narodowym w latach 1992–1993. Not. Orn. 1997, 38, 27–41. [Google Scholar]
- Wylegała, P. Abundance and habitat selection of raptors and the raven Corvus corax in the agriculture landscape of the Równina Szamotulska plain in 1999–2000. Not. Orn. 2002, 43, 21–28. [Google Scholar]
- Buczek, T.; Keller, M.; Różycki, A.Ł. Lęgowe ptaki szponiaste Falconiformes Lasów Parczewskich-zmiany liczebności i rozmieszczenia w latach 1991–1993 i 2002–2004. Not. Orn. 2007, 48, 217–231. [Google Scholar]
- Jędrzejewski, W.; Jędrzejewska, B.; Keller, M. Nest site selection by the buzzard Buteo buteo L. in the extensive forests of eastern Poland. Biol. Conserv. 1988, 43, 145–158. [Google Scholar] [CrossRef]
- Polish Forests, State Forests. Available online: https://www.lasy.gov.pl/en/our-forests/polish-forests (accessed on 3 February 2019).
- Lõhmus, A. Nest-tree and nest-stand characteristics of forest-dwelling raptors in east-central Estonia: Implication for forest management and conservation. Proc. Estonian Acad. Sci. Biol. Ecol. 2006, 55, 31–50. [Google Scholar]
- Solonen, T. Nest-site of Common Buzzard Buteo buteo in Finland. Orn. Fenn. 1982, 59, 191–192. [Google Scholar]
- Rodríguez, B.; Siverio, F.; Rodríguez, A.; Siverio, M.; Hernández, J.J.; Figuerola, J. Density, habitat selection and breeding biology of Common Buzzards Buteo buteo in an insular environment. Bird Study 2010, 57, 75–83. [Google Scholar] [CrossRef]
- Castillo-Gómez, C.; Moreno-Rueda, G. A record of a common buzzard (Buteo buteo) nesting in an abandoned building. J. Raptor Res. 2011, 45, 275–277. [Google Scholar] [CrossRef]
© 2019 by the authors. Licensee MDPI, Basel, Switzerland. This article is an open access article distributed under the terms and conditions of the Creative Commons Attribution (CC BY) license (http://creativecommons.org/licenses/by/4.0/).