The Relative Effects of Local and Landscape Characteristics of Hedgerows on Bats


1
French National Museum of Natural History, UMS Patrimoine Naturel (PATRINAT), AFB, MNHN, CNRS, CP41, 36 rue Geoffroy Saint-Hilaire, 75005 Paris, France
2
French National Museum of Natural History, Centre for Ecology and Conservation Sciences (CESCO UMR7204), MNHN-CNRS-Sorbonne University, 55 rue Buffon, 75005 Paris, France
3
French National Museum of Natural History, Marine Station of Concarneau, Place de la croix, 29900 Concarneau, France
*
Author to whom correspondence should be addressed.
Diversity 2018, 10(3), 72; https://doi.org/10.3390/d10030072
Submission received: 15 April 2018
/
Revised: 9 July 2018
/
Accepted: 10 July 2018
/
Published: 23 July 2018
(This article belongs to the Special Issue Diversity and Conservation of Bats)
Abstract
:The role of hedgerows in maintaining biodiversity in areas of intensive agriculture is well known, particularly for bats. However, few studies have addressed the importance of the intrinsic characteristics of hedgerows for bats and disentangled the relative effects of local and landscape characteristics of hedgerows on bat activity. In an acoustic survey, we assessed bat activity by recording bat calls using detectors and manually verified all calls using spectrogram analysis. The parameters used to determine local hedgerow structures were the length of the line of trees, of shrub hedgerows, of wooded hedgerows without shrubs and of hedgerows including the three strata (tree, shrub and herb) at a local scale. We assessed the influence of hedgerow structure and on bat activity with an approach considering both species and community, comparing two different scales, the local and the landscape. We highlighted the importance of hedgerow characteristics for bats on both the local and landscape scales even though responses differ between species and spatial scales. We found that the presence of trees in hedgerows exerts a generally positive influence on bat activity and that hedgerows with the three strata had lower bat activity than hedgerows with trees. In our study, some bats seemed to prefer agricultural landscapes dominated by wooded hedgerows and, on the local scale, hedgerows that include trees with little diversified among strata, except for gleaning species. Our study shows that in terms of hedgerow management, conservation efforts must be designed and undertaken on both the local and landscape scales.
1. Introduction
Bat species are threatened worldwide, in spite of their protection status [1]. Agricultural intensification is an established threat to biodiversity and a major driver of biodiversity loss [2,3], particularly for bats [4,5,6]. Agricultural intensification involves (i) loss of natural areas to agriculture, (ii) replacement of permanent grazing meadows with annual crops, (iii) increased use of fertilizers and pesticides, (iv) homogenization of the farming landscape over space and time and (v) fragmentation of natural habitats [7]. The role of hedgerows in maintaining biodiversity in European agricultural landscapes is also well known [8], in particular for bats [9,10,11,12,13].
Hereafter, we will name all such linear landscape elements “hedgerows” in accordance with Baudry & Jouin [14], who defined hedgerow as a line of trees and/or shrubs. Hedgerows provide important food resources, including insect prey, for bats [12,13,15]. Many bats are known to be highly dependent on linear landscape elements such as hedgerows, because when commuting from their roost to foraging areas, sometimes several kilometres away, they usually fly along wooded edges, riverine forests and hedgerows [16,17]. Linear elements, such as hedgerows, constitute aids to navigation for bats with structure-bound ecologies. Even small discontinuities in linear elements may impact their use [18]. The availability of vegetation corridors thus constitutes a key component of their home-range quality [19,20] and in mitigating habitat fragmentation caused by human activities which is a great threat for population viability [21,22].
Despite their key functions in agricultural landscapes (for example as natural barriers, “windbreaks” or “shelters” for livestock and auxiliary crops) [23] and their importance for biodiversity [24] and ecosystem services [25,26], hedgerows have undergone a drastic decline, particularly in Europe [23,27,28]. Half of the hedgerows in western France were lost after 1950 mainly due to agriculture intensification [14] and a nationwide policy of land-consolidation. Agricultural policies such as national land-consolidation programs contribute to increasing the size of agricultural parcels, thus decreasing the density of hedgerows [27]. Such landscapes are linked to particular agriculture uses. They have not been replanted and residual hedgerows became “relict trees” (a few dispersed trees) or “lines of trees” (a few aligned trees but unrelated by a shrub strata) [28]. Drivers of these changes occurred on both the landscape and local scales. On the local scale, hedgerows have experienced drastic changes in their floristic diversity, particularly a shift toward species associated with higher soil fertility [24]. On a larger scale, Carrey et al. [29] noted that hedgerow losses were also associated with a lack of management. Indeed, heterogeneous agricultural landscapes mixing pastures and crops and structured by hedgerow networks called “bocage” in some countries in Western Europe, are an inherited feature of very old agricultural practices [23]. Thenail & Baudry [30] demonstrated that the location of farms along a gradient of decreasing hedgerow density and increasing field size is correlated to their land use, ranging from a finer, heterogeneous mosaic in a dense bocage (i.e., a landscape with a high density of hedgerows) to large patches of uniform fields in an open bocage with sparse hedgerows. It is also on this larger scale that hedgerows are protected by legislation in several countries [23]. Today, increasing attention is paid to connectivity between patches of habitats [31] and the creation or protection of ecological corridors [32], in part because such landscape structures enabling dispersal are expected to help in a future adaptation to climate change [33]. In environmental policies, such as the EU 2020 Biodiversity Strategy, connectivity within landscapes has thus become a key point. Given the current trend of changes in land uses, substantial investment in the development of green infrastructure is needed [34].
On the local scale and depending on their primary function (hedgerows can serve as limits, borders, stock-proof fences and sources of wood production), hedgerow structures can be highly diverse, such as lines of trees, dense rows of shrubs, or include different strata [23]. This is also on this scale that subsidies and/or tax shelters for agroecosystem schemes are distributed to farmers and landowners to create, conserve and manage hedgerows. Examples of such incentives include Natura 2000 management contracts [35] and eligibility for Agri-Environment Schemes (AES) for planting and managing hedgerows [36]. However, the effects of AES are still debated [36,37,38,39]. The mixed effectiveness of such measures, including hedgerows, underscores the need to (i) identify intrinsic characteristics influencing the quality of hedgerows for bat foraging activity and (ii) disentangle the relative effects of local and landscape characteristics on bat activity. This knowledge is of value for conservation, because it identifies levers of actions to improve efficiency in conservation activities.
On the basis of an acoustic survey, the aim of this study was to determine the relative importance of the local and landscape characteristics of hedgerows on bat activity. As bats are highly mobile and use large home ranges (see [40,41]) during their foraging activity, we hypothesized that bats could be sensitive to hedgerows on large spatial scales, as described by Bellamy et al. [9] and Frey-Ehrenbold et al. [42]. On the landscape scale, we studied the effects on bat activity of the density, wood production and diversity of hedgerows within a 1000 m radius of plots where bat activity was recorded. We hypothesized that (1) the density of hedgerows had a positive effect on bat activity, (2) wood production could favour tree dwelling species such as, in our study, Myotis spp., B. barbastellus and N. noctula.
However, on the local scale, the diversity of hedgerow structures may provide a diversity of roosting, foraging habitats and navigational aids for bats. The literature on the subject is scarce and potential effects are not obvious. On the local scale, we studied the effects of different types of hedgerows (from lines of trees to hedgerows including different strata) and the effect of distances to the nearest hedgerow (0–50 m) on bat activity. We expected that this distance could have a significant effect [43], because hedgerows concentrate large amounts of insects [44].
One of the major aims of this study was to disentangle the relative effects of local and landscape characteristics of hedgerows on bat activity. We studied the effects of hedgerow structure on bat activity on two spatial scales, the local scale (structure of hedgerows at a distance of up to 50 m) and on the landscape scale (up to 1000 m). We chose the distance of 50 m for the local scale because for many species, it fit the maximum distance of detection [45]. For the landscape scale, we selected a radius of 1000 m (i.e., 314 hectares), comparable to the home range of some individuals and a range where the effects of semi-natural areas on bat activity are detected [6,46]. Given that the processes that result in different relationships with landscape structures on different spatial scales depend on species traits [47,48], we used two approaches: (i) a species approach where we tested the effects of localand landscape structures of hedgerows on bat activity and (ii) a functional approach where we also tested the effects of local and landscape structures of hedgerows on bat traits (habitat specialization), foraging strategy and species richness. This information is essential for developing effective conservation plans and improving land-management strategies.
2. Materials and Methods
2.1. Study Area
The study was conducted in western France, in the Loire delta, between the cities of Nantes and Saint-Nazaire, in a protected area belonging to the European Natura 2000 network. The site mainly is composed of grasslands grazed by cattle and hay meadows extensively managed and surrounded by a dense network of hedgerows. Hedgerows are strongly linked to the presence and management of permanent lowland meadows, a habitat in sharp decline in Europe [49]. The study site is situated in a specific landscape, the western bocage of France, an area characterised by extensive, permanent meadows, relatively few crops and a very high density of hedgerows (70–90 linear meters per hectare, see Supplementary Materials 3 and 5).
2.2. Sampling Design and Scale Approach
We employed a random, stratified design in which 51 point counts were sampled in the meadows, the dominant habitat in the study site and with the aim to avoid including supplementary effects linked with crop types or farming practices. The distance to hedgerow influences drastically bat activity (i.e., bat activity exponentially decreases while distance to hedgerow increases and becomes very low at more than 100 m (see [43]). We selected points according to three classes of distance from the hedgerow with 23 point counts at 0 m (i.e., at the edge of the hedgerow), 17 point counts at 25 m and 11 point counts at 50 m from the hedgerow. Such design allowed us to compare the effect of hedgerow internal characteristics to a well-known effect, that is, the distance to the hedgerow. In addition, we defined two circular buffers (with a radius of 50 m for the local scale and 1000 m for the landscape scale) around each point count that defined our sampling plots. With the aim to sample in agricultural landscapes dominated by pastures, we selected points for which grassland cover was greater than 50% whatever the considered scale (the average of grassland cover measured within our set of samples was 86% grassland within a 50 m radius buffer and 66% within a 1000 m radius buffer). To measure the effects of the hedgerows characteristics on different scales, we used ArcGIS 9.3 and a local land-use database [50] (see Supplementary Materials 3).
2.3. Hedgerow Characteristics on the Local and Landscape Scales
Using a regional database [50], we calculated, for the local and landscape scales, a set of variables based on hedgerow characteristics. For the local scale, we chose the distance of 50 m because for many species, it fits with the maximum distance of detection [45]. For the landscape scale, we chose a radius of 1000 m (i.e., 314 hectares) a range that is comparable to the home range of some individuals of Pipistrellus spp. [40,51], E. serotinus [41] and B. barbastellus [52] or to the mean distance between roost and feeding sites for species such as P. nathusii [53] and E. serotinus [54].
On the local scale (i.e., within a radius of 50 m from the recording plot), we calculated five variables describing hedgerow characteristics, namely the length of the line of trees (Length50m), of shrub hedgerows with only shrubs (Shrub50m), of wooded hedgerows without shrubs (Wooded50m), of hedgerows including the three strata (tree, shrub and herb) (3Strat50m) and the distance to the nearest hedgerow (Dist_hedgerow).
On the landscape scale (i.e., within a radius of 1000 m from the recording plot), we calculated three metrics describing the amount and structure of linear elements within the landscape, namely (i) the density (Density1000m, that is, the sum of hedgerow lengths in meters within the 1000 m buffer), (ii) the structural diversity (Diversity1000m, that is, a Shannon diversity index calculated from the distribution of different types of hedgerow (Length50m, Shrub50m, Wooded50m, 3Strat50m) within the 1000 m buffer) and (iii) the wood production (Woodproduct1000m, that is, a measure of the wood volume contained in the linear element (in cubic meters) which is the product of length of the hedgerow segments and a coefficient of woody elements within these hedgerow segments (for more details on the database, see Supplementary Materials 1). There was a very low correlation between the diversity and production variables (for the 500 m buffer, rho = 0.124, p value = 0.215). The degree of correlation meant that these variables could be included in the same model (see Supplementary Materials 2).
2.4. Bat Sampling
Bat activity was assessed by recording bat calls using a Tranquility Transect Bat detector (Courtpan Design Ltd., Cheltenham, UK) with direct and continuous recording on a Zoom H2 digital recorder (Zoom Corporation, Tokyo, Japan) at a sampling rate of 96 ks/s in the .wav format. We used the high frequency output, which did not include a trigger on sound volume [6]. We placed one detector at each location at a height of 1.5 m above the ground and facing away from the hedgerow. Each station was monitored twice in 2011. The first monitoring session was from 15th June to 31st July, during which time female bats are known to give birth and to feed their offspring. The second monitoring session was performed from 15th August to 30th September, during which the young are flying and individuals are suspected to be less dependent on their reproductive roost. For each station, we recorded two 30-min sound samples (one per session). This sampling occurred during the bat activity peak, which begins 30 min after sunset and spans 4 h [55]. The sampling was performed only when the weather conditions were favourable, that is, no rain, low wind speed and temperature higher than 12 °C. Hourly cloud-cover, temperature and wind-speed data were retrieved from a local weather station [56]. We used Scan’R (Binary Acoustic Technology, 2010) to isolate each bat vocalization. This software also automatically measured relevant parameters to help identifications. In a second step each call was manually checked and identified to the species level by the authors using Syrinx software version 2.6 [57] for spectrogram analyses (for more details, see [58,59]. Exceptions included vocalizations of Plecotus austriacus and Plecotus auritus, which were pooled as Plecotus spp., and those of Myotis myotis, Myotis daubentonii, Myotis mystacinus, Myotis nattereri and Myotis bechsteinii, which were pooled as Myotis spp., due to their very low occurrence and some uncertainties in identification. We used the number of calls per 30 min as a proxy for the measure of bat activity.
2.5. Mean Trait Community Index
2.5.1. Habitat-Specialization Index
Each species was characterized for habitat specialization through the calculation of a Species Specialization Index (SSI) using the Julliard approach [60]. For the bat SSI calculation, we used an independent data set provided by the national biodiversity-monitoring scheme coordinated by the French National Museum of Natural History (see http://vigienature.mnhn.fr/ and [6] for more details on the data set used). The SSI for each species was extracted from [6]. This SSI is a variation coefficient of species abundance across habitats calculated at the French scale (see Table 1). We calculated a mean trait community index Community Specialization Index (CSI) based on weighted average of habitat specialization of each species present in the community (the CSI is calculated as the arithmetic mean of the SSI of the detected species weighted by the abundance data [60]). All calls contribute to the assessment of CSI.
2.5.2. Foraging-Strategy
We distinguished two guilds according to their foraging strategy, namely “hawking bats” which include Pipistrellus species, Eptesicus serotinus and Nyctalus species that mainly search the sky for prey [61] and “gleaning bats” which include Myotis and Plecotus species that usually eat more non-volant arthropods (i.e., diurnal brachyceran Diptera, weevils, Lepidopteran larvae, harvestmen and spiders) than “hawking bats” [16,62,63] (see Table 1). Based on Dietz et al. [16], we conducted analyses by summing, on the one hand, the activity of hawking species and on the other hand, the activity of gleaning species. For the bat community approach (foraging-strategy and CSI), we corrected the bat activity by their distance of detection (see coefficients of detection in Barataud [45] before calculating the community indices.
2.6. Data Analysis
All analyses were performed using the statistical software R [64]. We assessed potential variation in bat activity with respect to the local hedgerow structure (5 local continuous variables (length in meters)), that is, alignment of trees, wooded hedgerows without the presence of shrubs, three strata, shrub hedgerows with only shrubs, distance to hedgerow and the landscape composition of hedgerows (3 landscape variables, that is, density, diversity, wood production index) using Generalized Mixed Models (GLMM; function ‘glmmADMB’ in the glmmADMB package [65,66]. Among factors known to influence bat activity there is the season [67,68], hours in the night [69], weather conditions such as temperature [70], consequently we took into account temperature and minutes after sunset as co-variables. According to the hierarchical structure of our sampling design (the same sites were sampled twice within a year), we treated the season variable as a random effect but the other explanatory variables as fixed effects [71]. These 12 fixed effects were centred and standardized so that the regression coefficients were comparable in magnitude [72] and to make it possible to disentangle the relative effects of local and landscape characteristics of hedgerows on bat activity. To account for spatial autocorrelation, we added an autocovariate (i.e., a distance-weighted function of neighbouring response values [73]) with the autocov dist function in R (package spdep, [74]. Before performing each GLMM, we systematically evaluated the correlations among explanatory variables using Spearman’s rho for quantitative variables [75] to detect obvious correlation (see Supplementary Materials 2). Secondly, we estimated variance-inflation factors (VIF) on each model [76]. According to Heiberger & Holland [77], given that all variables shown a VIF value <3 and according to Chatterjee & Hadi [78], the mean of VIF values was <2, there was no striking evidence of multicollinearity. Thus, our full models were structured in the following way:
where bat variable could be bat activity for a specific taxon (n = 9) or community traits (richness, foraging type, CSI).
[Bat variable] ~ local hedgerow variables + landscape hedgerow variables + temperature + minutes after sunset + autocovariate + 1|Season
In a second step, we performed a backward selection of variables based on AIC criteria (full models for each species or community are shown in Supplementary Materials 4). According to the nature of the response variable (bat count) and potential over dispersion, we performed for each species GLMMs with a Poisson error distribution, a negative binomial distribution (link = log) and zero truncated models with a negative binomial error distribution [71]. Choice and validation of models were based on a multi-criteria approach following Zuur et al. [71] taking into account potential patterns in residual and AIC values [79] and the pseudo R-square value. When models did not fit well, we transformed the response variable (i.e., bat activity) into a presence/absence variable and then used a binomial error distribution (link = logit).
We aimed to evaluate whether the quality of our model was good by comparing it to the null model (including only the random effects) using Akaike’s information criterion (AIC) [80].
3. Results
A total of 35,263 bat calls belonging to 14 species were recorded at the 51 point counts during the two periods. The majority of echolocation calls came from three Pipistrellus species (Pipistrellus pipistrellus (48.5%), Pipistrellus kuhli (24.4%) and Pipistrellus nathusii (21.2%)). Details on the occurrence of other species are provided in Table 1. Given the AIC values, the selected model consistently exhibited smaller AIC value than Full or Null models (showing a better fit of the selected model), except for the Myotis ssp. (for this group no significant variables were identified) (see Supplementary Materials 4).
3.1. Local Variables of Hedgerows
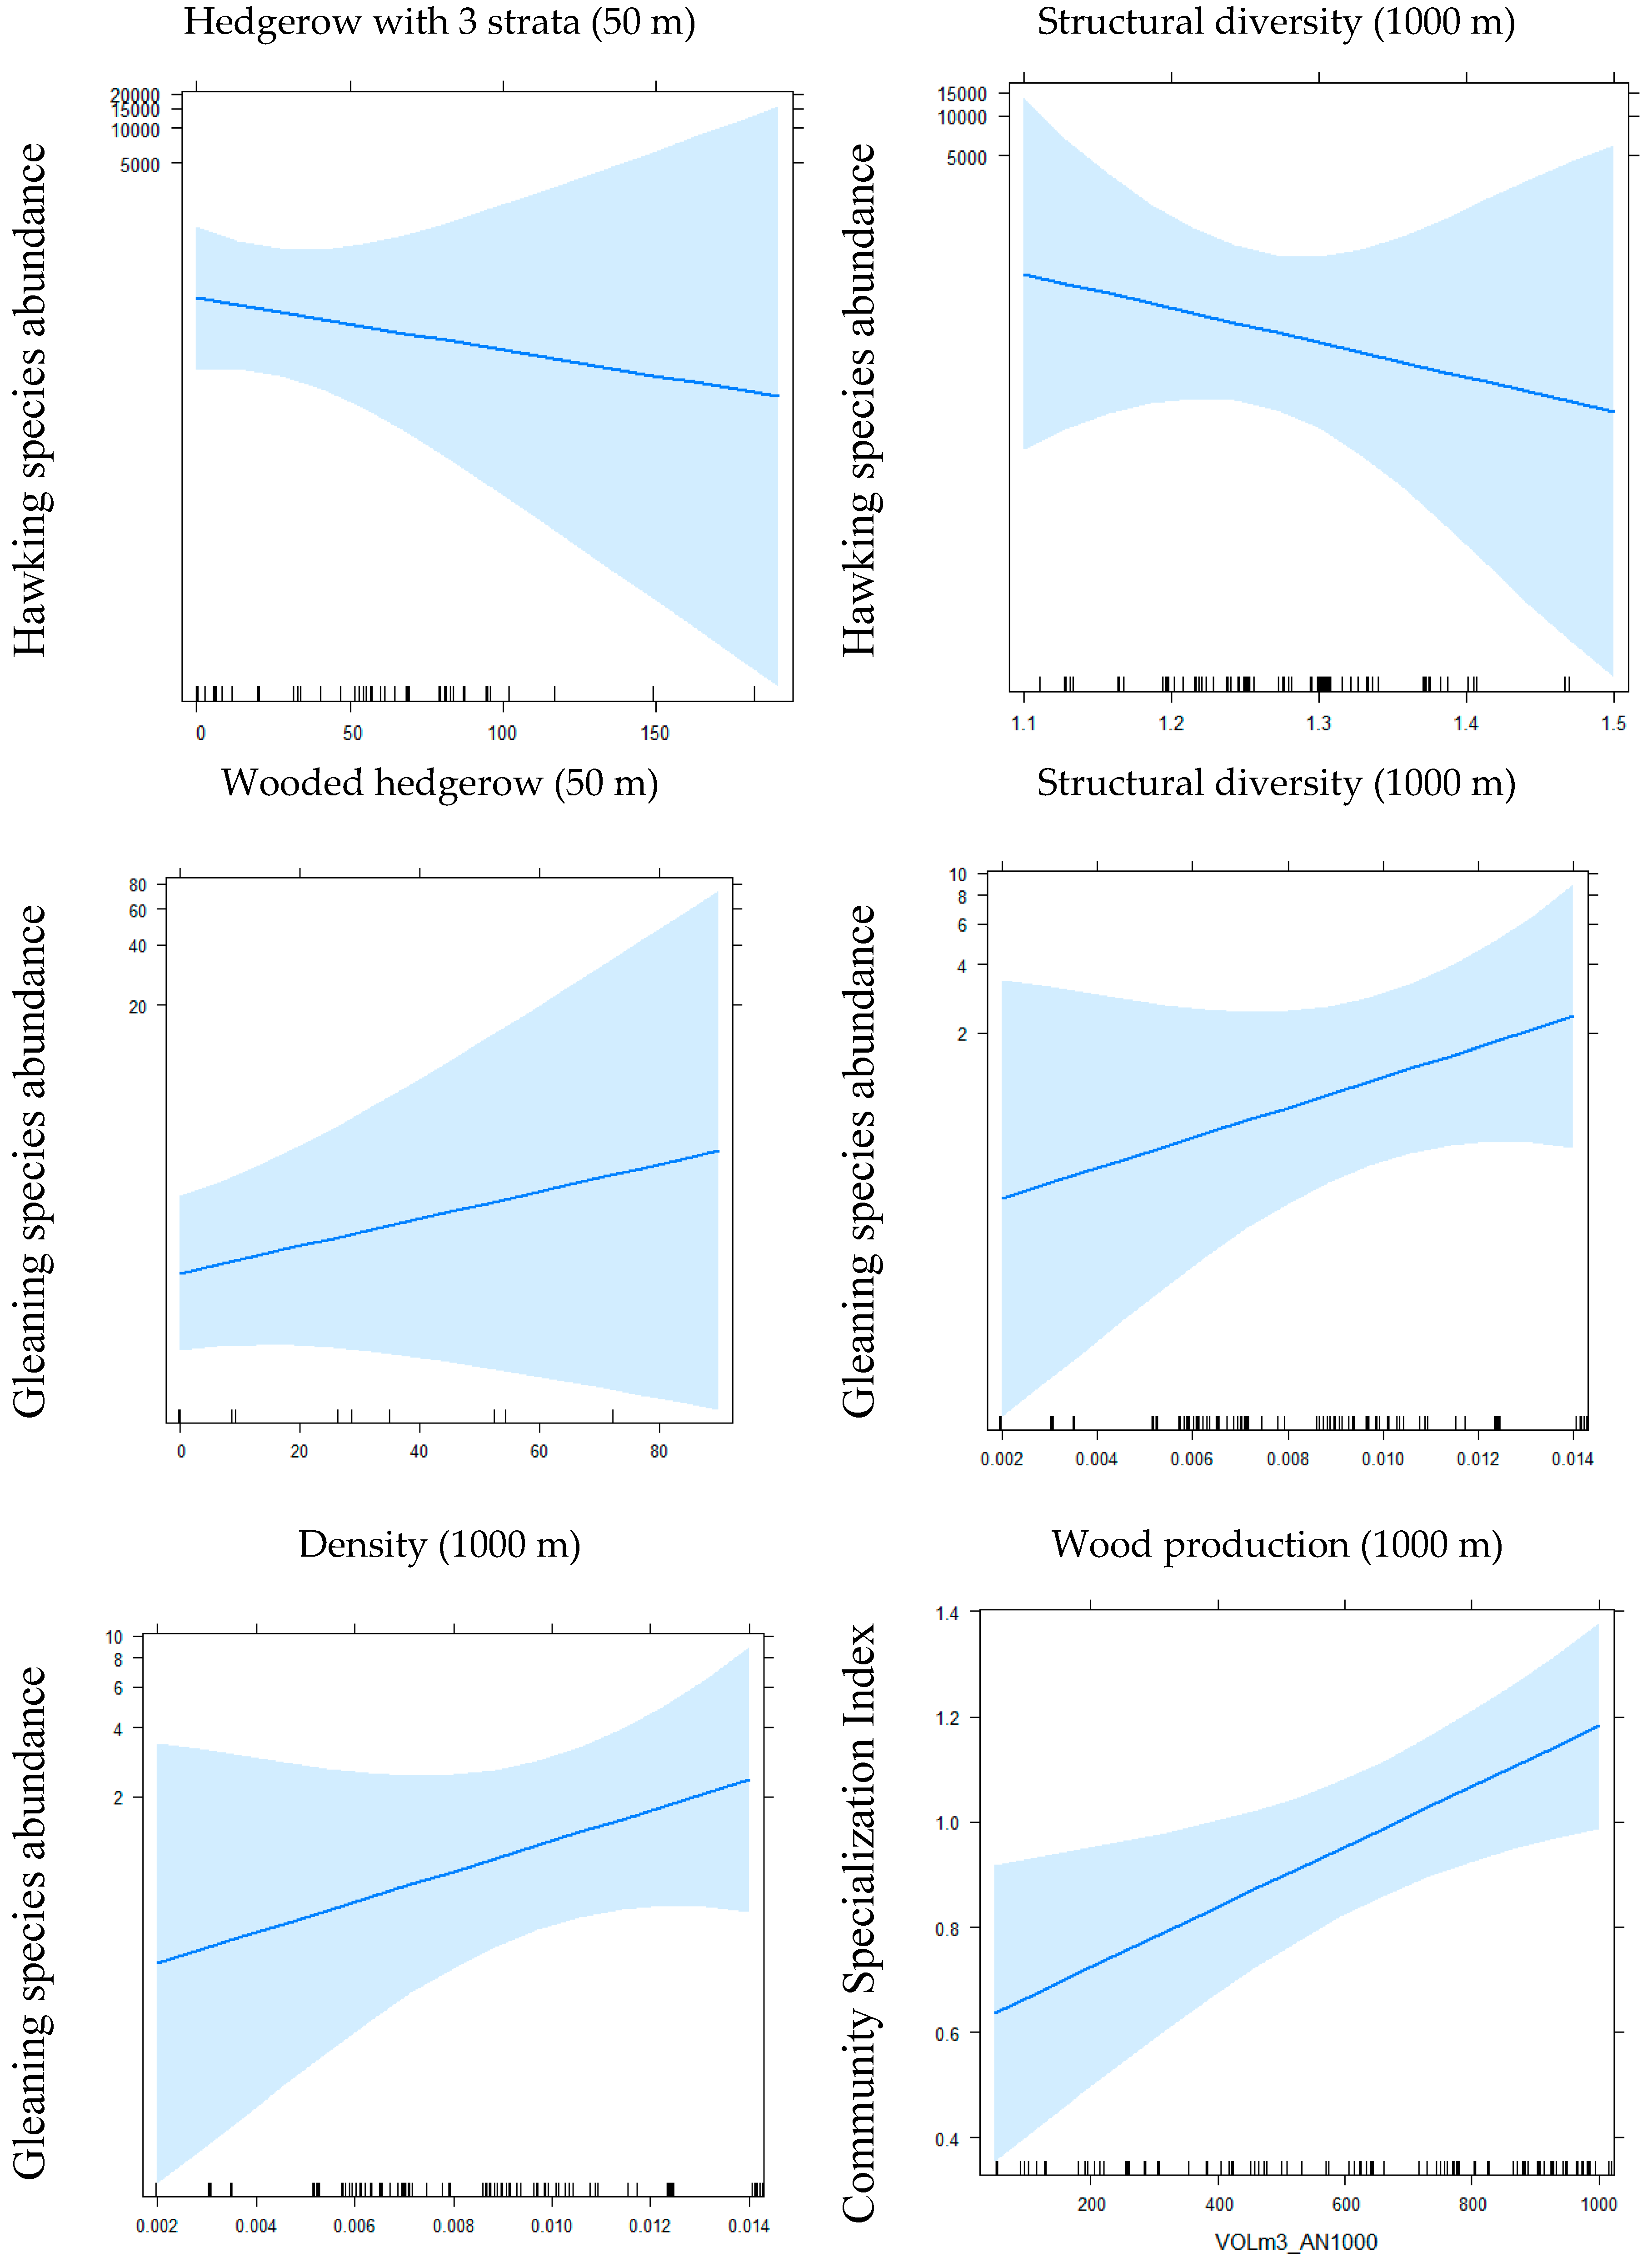
According to GLMM, for the variable length of “alignment of trees,” we obtained 3 significant effects: 2 positive effects and 1 negative among 13 tests (i.e., for 4 groups (CSI, specific richness, 2 foraging strategies) and 9 species) (see Table 2 and Figure 1). For the variable “length of shrub hedgerows with only shrubs,” we obtained 5 significant effects: 2 negative and 3 positive effects among 13 tests. For the variable length of “wooded hedgerows without the presence of shrubs,” we obtained 5 significant effects: 3 positive and 2 negative effects among 13 tests. For the variable length of “three-strata hedgerows” (tree, shrub and herb) we obtained 5 significant negative effects among 13 tests and for the variable “distance to the nearest hedgerow,” 2 significant negative effects among 13 tests were obtained. At the local scale, the responses are weak and contrasted among species except a global negative effect of hedgerows, including the three strata on bat activity. At a local scale, a doubling of the linear of current “wooded hedgerows without the presence of shrubs” (i.e., 4.93 m within a buffer of 50 m radius) increased the activity of B. barbastellus by 22% (p < 0.05), the activity of P. pipistrellus by 11% (p < 0.001), the activity of Plecotus spp. by 24% (p < 0.01) and increased the richness by 6% (p < 0.05), while the activity of N. leisleri decreased by 9% (p < 0.05) and the activity of gleaning species group by 7% (p < 0.05).
3.2. Landscape Variables of Hedgerows
For the “density for 1000 m buffer” variable, we obtained 1 positive and 1 negative effect among 13 tests (see Table 2 and Figure 1). For the “wood production for 1000 m buffer” variable, we obtained 6 positive effects and no negative effects among 13 tests. For the “structural diversity for 1000 m buffer” variable, we obtained 4 negative effects and 1 positive effect among 13 tests. We obtained opposing results for the groups of hawking species (negative effect) and gleaning species (positive effect). The measure of the wood volume included in hedgerows on the landscape scale appears to be the best predictor, positively influencing bat activity. The importance of hedgerow networks for bats is contrasted between species/or species group, for example, a doubling of the current density of hedgerows (i.e., 0.008 m within a 1000 m buffer) would increase by 4.7 (p < 0.001) the activity of gleaning species.
3.3. Habitat Preferences of Species
B. barbastellus activity was higher on the local scale in wooded hedgerows without shrubs and, on the landscape scale, increased with wood production. For Myotis spp. and N. noctula, we obtained no significant results, which may be due to the scarcity of data. Regarding Plecotus spp., only one local variable (i.e., wooded hedgerows without shrubs) positively influenced their activity. The activity of E. serotinus increased with the amount of shrub hedgerows and decreased when the “distance to the nearest hedgerow” increased. On the landscape scale, wood production had a positive effect for E. serotinus, while hedge density had a negative effect. Considering the degree and significance of effects, for E. serotinus, the best predictor would seem to be wood production. On the local scale, N. leisleri activity was negatively influenced by the alignments of trees, shrub hedgerows and wooded hedgerows but also decreased with the distance to the nearest hedgerow. On the landscape scale, wood production had a positive influence on the activity of this species. Concerning the degree and significance of effects, for N. leisleri, the best predictor would seem to be the alignment of trees. On the local scale, P. pipistrellus activity was positively influenced by the amount of wooded hedgerow and shrub hedgerow, while three-strata hedgerows influenced it negatively. The structural diversity of hedgerows on the landscape scale had a negative effect and, in terms of the degree and significance of effects, no variables stood out from the others. Concerning P. kuhlii, only one local variable, “three-strata hedgerow,” exerted a negative effect and one landscape variable, the structural diversity of hedgerows, had a negative effect. This latter variable had a slightly greater effect than the local variable. Concerning P. nathusii, the “three-strata hedgerow” variable had a negative effect while wood production had a positive effect on the landscape scale, with a slightly lesser effect than the local variable.
More generally, for the group of hawking species, two local variables, alignment of trees and shrub hedgerow, had a significant positive effect while the “three-strata hedgerow” variable had a negative effect and, on the landscape scale, structural diversity had a negative effect. For the group of gleaning species, on the local scale, the variable “alignment of trees” had a positive effect, while the number of wooded hedgerows and shrub hedgerows had a negative effect and, on the landscape scale, the density of hedgerows, the structural diversity and wood production had a positive effect. Finally, we obtained opposite results between hawking and gleaning groups concerning the local variables “three-strata hedgerow” and “shrub hedgerow,” on the one hand and the structural diversity within the 1000 m buffer, on the other. However, a congruent result was obtained concerning tree alignments. In terms of the degree and significance of effects, the density is the variable that most influences the activity of gleaning species, whereas for hawking species no variable stands out from the others.
Regarding CSI, we obtained a significant positive effect of wood production. Concerning species richness, the most influential and significant variables were the “three-strata hedgerow” on the local scale and structural diversity within the 1000 m buffer, for which the negative effects were similar.
4. Discussion
In this study, we assessed the influence of hedgerow structure on bat activity with an approach by both species and community, with a comparison of the effects on the local and landscape scales. Similar to many other studies, we highlighted the importance of hedgerow network for bats [17,18,81,82]. Indeed, hedgerow characteristics are of relevance for bats on both the local and landscape scales even though responses differ between species and spatial scales.
Although bats are mobile species that can travel miles to their foraging territories (for example, the distance between the breeding colony and foraging areas can reach 20 km for B. barbastellus [83], 11.5 km for E. serotinus [84], 5.1 km for P. pipistrellus [85], 4 km for Plecotus austriacus [86]), our study showed that local variables also have a significant influence on their foraging activities and they have a positive effect, especially for Plecotus spp. and B. barbastellus (Table 2). Based on significant variables and effect size, we found that generally, local hedgerow variables have the same influence on bat activity as landscape hedgerow variables (we considered that there is a difference when the effect size differed by factor greater than 1.5), except for E. serotinus and the gleaning group where landscape hedgerow variables have a greater effect and for Plecotus spp. for which a local hedgerow variable is the most important variable.
Whatever the scale considered, the presence of trees in hedgerows (i.e., “wooded hedgerows without the presence of shrubs” and “wood production”) generally influences bat activity positively, a result congruent with Boughey et al. [13,87]. Except for N. leisleri these two variables show a significant, positive effect, even though they represent two different scales, the local and the landscape. On the contrary and again, whatever the scale considered, variables representing the diversity of strata (i.e., three-strata hedgerows and structural diversity) generally have a negative effect. In other words, the species seem to prefer agricultural landscapes dominated mainly by wooded hedgerows (i.e., wood production) instead of landscapes including a variety of hedgerow types. At the local scale, the species seem to prefer hedgerows that include trees with few diversified strata, except for the gleaning species. Again, this result is congruent with the Boughey et al. [13] study that noted that two gleaning species (Plecotus auritus and Myotis natereri) were associated with structurally complex habitats. The negative effect of the variety of hedgerow types on the local and landscape scales is surprising, because such local or landscape heterogeneity may produce a diversity of habitats, which is usually linked with greater richness or abundance of bats [45] and greater biodiversity in general [88]. Our study would seem to indicate that a greater number of trees in hedgerows is a favourable factor for numerous hawking species. The mechanisms underlying this type of correlation could be linked to an accumulation of small, airborne insects in sheltered places that probably occurs when the insects are drawn into the recirculating air behind hedgerows. Such accumulations occur there partly because the immediate, local population spreads from the sheltering vegetation but largely because the hedgerow acts as a windbreak and concentrates insects from passing airborne populations [44,89,90]. Accumulation increases with the impermeability of the windbreak [91]. Thus, the amount of small, airborne insects accumulated close to wooded hedgerows would be an interesting resource, especially for hawking bats that prey mainly on small flying insects, such as Diptera nematocera [61,92]. In addition, wooded hedgerows are seminatural habitats that provide the conditions for numerous insects to achieve their life cycle, consequently hedgerows contribute directly to increasing both the abundance and diversity of insects and particularly larger moth species [93]. On the other hand, gleaning bats could be favoured by heterogeneity within hedgerows because such heterogeneity could increase niche diversity and thus resource partitioning. Compared to hawking species, gleaning bats mainly eat a variety of insect types including diurnal brachyceran Diptera and non-volant arthropods, such as weevils, lepidopteran larvae, harvestmen and spiders [16,62,63]. In addition, some species appear to be specialists in foraging for some specific preys, such as Myotis myotis on Coleopteran Carabidae [94,95,96], Barbastella barbastellus, Plecotus auritus and P. austriacus on Lepidoptera [97,98,99] M. nattereri and M. emarginatus on spiders [63].
In terms of caution required concerning our results and for the purpose of generalization, it should be noted that the study site is situated in a specific landscape, the western bocage of France, a territory characterised by extensive, permanent meadows, relatively few crops and a very high density of hedgerows (70–90 linear meters per hectare, see Supplementary Materials 5). Similar studies should be conducted in a variety of agricultural landscapes and particularly hedgerows in contexts of intensive agriculture. While variations of width and height are included indirectly in our hedgerow typology (i.e., a shrub hedgerow is smaller and less large than a wooded hedgerow), future studies could to explore more precisely the influence of width and height within hedgerow categories (i.e., the influence of the width and height of shrub hedgerows).
In terms of management, the dynamics of hedgerow networks are related to global agricultural intensification which has led to drastic hedgerow losses. In the United Kingdom, half of all hedgerows were removed during the 20th century [100] and half of the hedgerows in western France were lost after 1950 [14]. Staley et al. [24] observed in U.K. rural landscapes a shift in hedgerows toward species associated with higher soil fertility. Such pressures highlight the need for a comprehensive response from the Common Agriculture Policy to protect and restore hedgerow networks. On both the local and landscape scales, our results indicate the importance of wood volume in hedgerows, though wooded hedgerows are a vulnerable type of hedgerow that has undergone a drastic decline [29]. In addition, the low rate of newly established trees will cause senescence issues in the U.K. [101] and in western France [102]. Meanwhile, maintaining or establishing new, emergent trees within hedgerows implies additional costs for land managers [13]. Such additional costs emphasize the potential utility of financial measures such as Agri-Environment-Climate Measures (AECM) for the maintenance and management of hedgerows with pollarded trees. To date, local governments have taken the lead in providing financial subsidies for planting hedgerows. Conditions to receive such subsidies are usually minor in that they simply require, for example, that hedgerows be trimmed less than once per year and even clear-cutting of trees is authorized when the aim is to promote the formation of new growth. It has been demonstrated that a decrease in the intensity of hedgerow trimming improves the diversity of numerous taxa, for example, Coleoptera [103], Lepidoptera [104]. Finally, Agri-Environment Scheme (AES) payments must be placed in the context of global drivers. On one hand, unmanaged hedgerows tend to disappear more quickly that managed hedgerows [29], highlighting the need for socio-economic uses of hedgerows. On the other hand, increasing demand for energy increases fuelwood-driven changes in forestry and affects the management of hedgerows (whole-tree harvesting and postharvest recovery of logging residues and stumps), while in the forest context, such biofuel harvests place additional pressure on biodiversity [105]. For new planting of hedgerows, financial assistance could be based on a preliminary diagnosis to identify the best location of hedgerows and to select the local species best adapted to the context, particularly tree species given to our results. For the maintenance of existing hedgerows, financial assistance could depend on work to strengthen the local structure by planting trees and the continuity of hedgerows in the landscape context. The continued presence of hedgerows is linked to their management on the plot scale and our study shows that in terms of hedgerow management, conservation efforts must also be designed and undertaken on both the local and landscape scales.
Supplementary Materials
The following are available online at https://www.mdpi.com/1424-2818/10/3/72/s1.
Author Contributions
A.L., J.-F.J. and C.K. conceived and designed the experiments; A.L. performed the experiments; A.L., J.-F.J. and C.K. analyzed the data; A.L., N.M., J.-F.J. and C.K. contributed reagents/materials/analysis tools; A.L., N.M., J.-F.J. and C.K. wrote the paper.
Funding
Funding was provided by the EDF company (Electricite de France S.A.). The funders had no role in study design, data collection and analysis, decision to publish, or preparation of the manuscript.
Acknowledgments
The authors thank the EDF company for its financial support of this study. We certify that the funding sources had no influence on the collection, analysis or interpretation of the data. We gratefully acknowledge CORELA (Conservatoire Régional des Rives de la Loire et de ses Affluents: http://www.corela.org/) for the land-use database and the hedgerow database. We thank Lucille Brianceau for her assistance with fieldwork and Léa Noël for her help with the sonogram analyses. We are deeply appreciative of the Vigie-Nature volunteers for data collection making possible the calculation of a Species Specialization Index for bats.
Conflicts of Interest
The authors declare no conflicts of interest.
References
- IUCN. The IUCN Red List of Threatened Species. 2017. Available online: http://www.iucnredlist.org/ (accessed on 1 January 2018).
- Bengtsson, J.; Ahnström, J.; Weibull, A. The effects of organic agriculture on biodiversity and abundance: A meta-analysis. J. Appl. Ecol. 2005, 42, 261–269. [Google Scholar] [CrossRef]
- Benton, T.G.; Vickery, J.A.; Wilson, J.D. Farmland biodiversity: Is habitat heterogeneity the key? Trends Ecol. Evol. 2003, 18, 182–188. [Google Scholar] [CrossRef]
- Estrada, A.; Coates-Estrada, R. Bats in continuous forest, forest fragments and in an agricultural mosaic habitat-island at Los Tuxtlas, Mexico. Biol. Conserv. 2002, 103, 237–245. [Google Scholar] [CrossRef]
- Gorresen, P.M.; Willig, M.R. Landscape responses of bats to habitat fragmentation in Atlantic forest of Paraguay. J. Mammal. 2004, 85, 688–697. [Google Scholar] [CrossRef]
- Kerbiriou, C.; Azam, C.; Touroult, J.; Marmet, J.; Julien, J.F.; Pellissier, V. Common bats are more abundant within Natura 2000 areas. Biol. Conserv. 2018, 217, 66–74. [Google Scholar] [CrossRef]
- Matson, P.A.; Parton, W.J.; Power, A.; Swift, M. Agricultural intensification and ecosystem properties. Science 1997, 277, 504–509. [Google Scholar] [CrossRef] [PubMed]
- Graham, L.; Gaulton, R.; Gerard, F.T.; Staley, J. The influence of hedgerow structural condition on wildlife habitat provision in farmed landscapes. Biol. Conserv. 2018, 220, 122–131. [Google Scholar] [CrossRef]
- Bellamy, C.; Scott, C.; Altringham, J. Multiscale, presence-only habitat suitability models: Fine-resolution maps for eight bat species. J. Appl. Ecol. 2013, 50, 892–901. [Google Scholar] [CrossRef]
- Lookingbill, T.R.; Elmore, A.J.; Engelhardt, K.A.; Churchill, J.B.; Gates, J.E.; Johnson, J.B. Influence of wetland networks on bat activity in mixed-use landscapes. Biol. Conserv. 2010, 143, 974–983. [Google Scholar] [CrossRef]
- Hale, J.D.; Fairbrass, A.J.; Matthews, T.J.; Sadler, J.P. Habitat composition and connectivity predicts bat presence and activity at foraging sites in a large UK conurbation. PLoS ONE 2012, 7, e33300. [Google Scholar] [CrossRef] [PubMed]
- Verboom, B.; Spoelstra, K. Effects of food abundance and wind on the use of tree lines by an insectivorous bat, Pipistrellus pipistrellus. Can. J. Zool. 1999, 77, 1393–1401. [Google Scholar] [CrossRef]
- Boughey, K.L.; Lake, I.R.; Haysom, K.A.; Dolman, P.M. Improving the biodiversity benefits of hedgerows: How physical characteristics and the proximity of foraging habitat affect the use of linear features by bats. Biol. Conserv. 2011, 144, 1790–1798. [Google Scholar] [CrossRef]
- Baudry, J.; Jouin, A. De la Haie aux Bocages. Organisation, Dynamique et Gestion; INRA: Paris, France, 2003; 435p. [Google Scholar]
- Wickramasinghe, L.P.; Harris, S.; Jones, G.; Vaughan Jennings, N. Abundance and species richness of nocturnal insects on organic and conventional farms: Effects of agricultural intensification on bat foraging. Conserv. Biol. 2004, 18, 1283–1292. [Google Scholar] [CrossRef]
- Dietz, C.; von Helversen, O.; Nill, D. L’encyclopédie des Chauves-Souris d’Europe et d’Afrique du Nord: Biologie, Caractéristiques, Protection; Delachaux et Niestlé: Paris, France, 2009; 400p. [Google Scholar]
- Froidevaux, J.S.P.; Boughey, K.L.; Barlow, K.E.; Jones, G. Factors driving population recovery of the greater horseshoe bat (Rhinolophus ferrumequinum) in the UK: Implications for conservation. Biodivers. Conserv. 2017, 26, 1–21. [Google Scholar] [CrossRef]
- Pinaud, D.; Claireau, F.; Leuchtmann, M.; Kerbiriou, C. Modelling landscape connectivity for greater horseshoe bat (Rhinolophus ferrumequinum) using an empirical quantification of resistance. J. Appl. Ecol. 2018, in press. [Google Scholar] [CrossRef]
- Walsh, A.L.; Harris, S. Factors determining the abundance of vespertilionid bats in Britain: Geographical, land class and local habitat relationships. J. Appl. Ecol. 1996, 33, 519–529. [Google Scholar] [CrossRef]
- Hein, C.D.; Castleberry, S.B.; Miller, K.V. Site-occupancy of bats in relation to forested corridors. For. Ecol. Manag. 2009, 257, 1200–1207. [Google Scholar] [CrossRef]
- Quinn, J.F.; Harrison, S.P. Effects of habitat fragmentation and isolation on species richness: Evidence from biogeographic patterns. Oecologia 1988, 75, 132–140. [Google Scholar] [CrossRef] [PubMed]
- Boyce, M.S. Population viability analysis. Annu. Rev. Ecol. Syst. 1992, 23, 451–506. [Google Scholar] [CrossRef]
- Baudry, J.; Bunce, R.G.H.; Burel, F. Hedgerows: An international perspective on their origin, function and management. J. Environ. Manag. 2000, 60, 7–22. [Google Scholar] [CrossRef]
- Staley, J.T.; Bullock, J.M.; Baldock, K.C.R.; Redhead, J.W.; Hooftman, D.A.P.; Button, N.; Pywell, R.F. Changes in hedgerow floral diversity over 70 years in an English rural landscape, and the impacts of management. Biol. Conserv. 2013, 167, 97–105. [Google Scholar] [CrossRef]
- Morandin, L.A.; Kremen, C. Bee preference for native versus exotic plants in restored agricultural hedgerows. Restor. Ecol. 2013, 21, 26–32. [Google Scholar] [CrossRef]
- Morandin, L.A.; Long, R.F.; Kremen, C. Hedgerows enhance beneficial insects on adjacent tomato fields in an intensive agricultural landscape. Agric. Ecosyst. Environ. 2014, 189, 164–170. [Google Scholar] [CrossRef] [Green Version]
- Sklenicka, P.; Molnarova, K.; Brabec, E.; Kumble, P.; Pittnerova, B.; Pixova, K.; Salek, M. Remnants of medieval field patterns in the Czech Republic: Analysis of driving forces behind their disappearance with special attention to the role of hedgerows. Agric. Ecosyst. Environ. 2009, 129, 465–473. [Google Scholar] [CrossRef] [Green Version]
- Staley, J.T.; Sparks, T.H.; Croxton, P.J.; Baldock, K.C.R.; Heard, M.S.; Hulmes, S.; Hulmes, L.; Peyton, J.; Amy, S.R.; Pywell, R.F. Long-term effects of hedgerow management policies on resource provision for wildlife. Biol. Conserv. 2012, 145, 24–29. [Google Scholar] [CrossRef] [Green Version]
- Carey, P.D.; Wallis, S.; Chamberlain, P.M.; Cooper, A.; Emmett, B.A.; Maskell, L.C.; McCann, T.; Murphy, J.; Norton, L.R.; Reynolds, B.; et al. Chapter 5, Boundary and Linear Features Broad Habitat. In Countryside Survey: UK Results from 2007; Carey, P.D., Wallis, S., Chamberlain, P.M., Cooper, A., Emmett, B.A., Maskell, L.C., McCann, T., Murphy, J., Norton, L.R., Reynolds, B., et al., Eds.; Centre for Ecology and Hydrology, Natural Environment Research Council: Swindon, UK, 2008. [Google Scholar]
- Thenail, C.; Baudry, J. Variation of farm spatial land use pattern according to the structure of the hedgerow network (bocage) landscape: A case study in northeast Brittany. Agric. Ecosyst. Environ. 2004, 101, 53–72. [Google Scholar] [CrossRef]
- Fahrig, L.; Baudry, J.; Brotons, L.; Burel, F.G.; Crist, T.O.; Fuller, R.J.; Sirami, C.; Siriwardena, G.M.; Martin, J.L. Functional landscape heterogeneity and animal biodiversity in agricultural landscapes. Ecol. Lett. 2011, 14, 101–112. [Google Scholar] [CrossRef] [PubMed]
- Briers, R.A. Incorporating connectivity into reserve selection procedures. Biol. Conserv. 2002, 103, 77–83. [Google Scholar] [CrossRef]
- Lawton, J.H.; Brotherton, P.N.M.; Brown, V.K.; Elphick, C.; Fitter, A.H.; Forshaw, J.; Haddow, R.W.; Hilborne, S.; Leafe, R.N.; Mace, G.M.; et al. Making Space for Nature: A Review of England’s Wildlife Sites and Ecological Network; DEFRA: London, UK, 2010. [Google Scholar]
- Maes, J.; Barbosa, A.; Baranzelli, C.; Zulian, G.; Batista e Silva, F.; Vandecasteele, I.; Hiederer, R.; Liquete, C.; Paracchini, M.L.; Mubareka, S.; et al. More green infrastructure is required to maintain ecosystem services under current trends in land-use change in Europe. Landsc. Ecol. 2015, 30, 517–534. [Google Scholar] [CrossRef] [PubMed] [Green Version]
- Dupont, H.; Gourmelon, F.; Rouan, M.; Le Viol, I.; Kerbiriou, C. The contribution of agent-based simulations to conservation management on a Natura 2000 site. J. Environ. Manag. 2016, 168, 27–35. [Google Scholar] [CrossRef] [PubMed] [Green Version]
- Kleijn, D.; Sutherland, W.J. How effective are European agri-environment schemes in conserving and promoting biodiversity? J. Appl. Ecol. 2003, 40, 947–969. [Google Scholar] [CrossRef] [Green Version]
- Kleijn, D.; Baquero, R.A.; Clough, Y.; Diaz, M.; De Estaban, J.; Fernandez, F.; Gabriel, D.; Herzog, F.; Holzschuh, A.; Jöhl, R.; et al. Mixed biodiversity benefits of agri-environment schemes in five European countries. Ecol. Lett. 2006, 9, 243–254. [Google Scholar] [CrossRef] [PubMed]
- Wittingham, M.J. The future of agri-environment schemes: Biodiversity gains and ecosystem service delivery? J. Appl. Ecol. 2011, 48, 509–513. [Google Scholar] [CrossRef]
- Fuentes-Montemayor, E.; Goulson, D.; Park, K.J. Pipistrelle bats and their prey do not benefit from four widely applied agri-environment management prescriptions. Biol. Conserv. 2011, 144, 2233–2246. [Google Scholar] [CrossRef]
- Davidson-Watts, I.; Jones, G. Differences in foraging behaviour between Pipistrellus pipistrellus (Schreber, 1774) and Pipistrellus pygmaeus (Leach, 1825): Foraging behaviour in cryptic bat species. J. Zool. 2005, 268, 55–62. [Google Scholar] [CrossRef]
- Perez-Jorda, J.L.; Ibañez, C. Preliminary results on activity rhythms and space use obtained by radio-tracking a colony of Eptesicus serotinus. Myotis 1991, 29, 61e66. [Google Scholar]
- Frey-Ehrenbold, A.; Bontadina, F.; Arlettaz, R.; Obrist, M.K. Landscape connectivity, habitat structure and activity of bat guilds in farmland-dominated matrices. J. Appl. Ecol. 2013, 50, 252–261. [Google Scholar] [CrossRef]
- Kelm, D.H.; Lenski, J.; Kelm, V.; Toelch, U.; Dziock, F. Seasonal bat activity in relation to distance to hedgerows in an agricultural landscape in central Europe and implications for wind energy development. Acta Chiropterologica 2014, 16, 65–73. [Google Scholar] [CrossRef]
- Lewis, T. The Distribution of Flying Insects near a Low Hedgerow. J. Appl. Ecol. 1969, 6, 443–452. [Google Scholar] [CrossRef]
- Barataud, M. Acoustic Ecology of European Bats, Species Identification, Study of Their Habitat and Foraging Behavior; Inventaires et biodiversité Series; Muséum National d’Histoire Naturelle: Paris, France, 2015; 352p. [Google Scholar]
- Kerbiriou, C.; Bas, Y.; Le Viol, I.; Lorrilliere, R.; Mougnot, J.; Julien, J.-F. Potentiality of the bat pass duration measure for studies dealing with bat activity. Bioacoustic 2018, in press. [Google Scholar] [CrossRef]
- Desrochers, A.; Renaud, C.; Hochachka, W.M.; Cadman, M. Area-sensitivity by forest songbirds: Theoretical and practical implications of scale-dependency. Ecography 2010, 33, 921–931. [Google Scholar] [CrossRef]
- Penone, C.; Kerbiriou, C.; Julien, J.F.; Julliard, R.; Machon, N.; Le Viol, I. Urbanisation effect on Orthoptera: Which scale matters? Insect Conserv. Divers. 2013, 6, 319–332. [Google Scholar] [CrossRef]
- Van Dijk, G. The status of semi-natural grasslands in Europe. Conserv. Low Land Dry Grassl. Birds Eur. 1991, 15–36. Available online: http://mandadb.hu/common/file-servlet/document/659220/default/doc_url/The_status_of_semi_natural_grasslands_in_europe.pdf (accessed on 15 April 2018).
- Geffray, O. Le bocage en vallée de la Loire: Mise à jour cartographique et estimation des capacités en bois-énergie. Conservatoire Régional des Rives de la Loire et de ses Affluents (CORELA), Rapport d’étude. 2010. Available online: http://www.geopal.org/accueil/geoservice (accessed on 15 April 2018).
- Stone, E.; Zeale, M.R.K.; Newson, S.E.; Browne, W.J.; Harris, S.; Jones, G. Managing Conflict between Bats and Humans: The Response of Soprano Pipistrelles (Pipistrellus pygmaeus) to Exclusion from Roosts in Houses. PLoS ONE 2015, 10, e0131825. [Google Scholar] [CrossRef] [PubMed]
- Hillen, J.; Kiefer, A.; Veith, M. Interannual Fidelity to Roosting Habitat and Flight Paths by Female Western Barbastelle Bats. Acta Chiropterol. 2010, 12, 187–195. [Google Scholar] [CrossRef]
- Flaquer, C.; Puig-Montserrat, X.; Goiti, U.; Vidal, F.; Curcó, A.; Russo, D. Habitat selection in Nathusius’ pipistrelle (Pipistrellus nathusii): the importance of wetlands. Acta Chiropterol. 2009, 11, 149–155. [Google Scholar] [CrossRef]
- Robinson, M.F.; Stebbings, R.E. Home range and habitat use by the serotine bat, Eptesicus serotinus, in England. J. Zool. 1997, 243, 117–136. [Google Scholar] [CrossRef]
- Roche, N.; Catto, C.; Langton, S.; Aughney, T.; Russ, J. Development of a Car-Based Bat Monitoring Protocol for the Republic of Ireland; Irish Wildlife Manuals, No. 19; National Parks and Wildlife Service, Department of Environment, Heritage and Local Government: Dublin, Ireland, 2005.
- Météo France. French National Meteorological Service. 2012. Available online: www.meteofrance.com (accessed on 1 August 2012).
- Burt, J. Syrinx a Software for Real Time Spectrographic Recording, Analysis and Playback of Sound. 2006. Available online: http://www.syrinxpc.com (accessed on 15 April 2018).
- Lacoeuilhe, A.; Machon, N.; Le Bocq, A.; Julien, J.F.; Kerbiriou, K. The influence of low intensities of light pollution on bat communities in a semi-natural context. PLoS ONE 2014, 9, e103042. [Google Scholar] [CrossRef] [PubMed]
- Lacoeuilhe, A.; Machon, N.; Julien, J.F.; Kerbiriou, C. Effects of hedgerows on bats and bush crickets at different spatial scales. Acta Oecol. 2016, 71, 61–72. [Google Scholar] [CrossRef]
- Julliard, R.; Clavel, J.; Devictor, V.; Jiguet, F.; Couvet, D. Spatial segregation of specialists and generalists in bird communities. Ecol. Lett. 2006, 9, 1237–1244. [Google Scholar] [CrossRef] [PubMed]
- Schnitzler, H.U.; Moss, C.F.; Denzinger, A. From spatial orientation to food acquisition in echolocating bats. Trends Ecol. Evol. 2003, 18, 386–394. [Google Scholar] [CrossRef]
- Audet, D. Foraging behavior and habitat use by a gleaning bat, Myotis myotis (Chiroptera: Vespertilonidae). J. Mammal. 1990, 71, 420–427. [Google Scholar] [CrossRef]
- Swift, S.M.; Racey, P.A. Gleaning as a foraging strategy in Natterer’s bat Myotis nattereri. Behav. Ecol. Sociobiol. 2002, 52, 408–416. [Google Scholar]
- R Core Team. R: A Language and Environment for Statistical Computing; R Foundation for Statistical Computing: Vienna, Austria, 2018; Available online: https://www.R-project.org/ (accessed on 2 July 2018).
- Fournier, D.A.; Skaug, H.J.; Ancheta, J.; Ianelli, J.; Magnusson, A.; Maunder, M.; Nielsen, A.; Sibert, J. AD Model Builder: Using automatic differentiation for statistical inference of highly parameterized complex nonlinear models. Optim. Methods Softw. 2012, 27, 233–249. [Google Scholar] [CrossRef] [Green Version]
- Skaug, H.; Fournier, D.; Bolker, B.; Magnusson, A.; Nielsen, A. Generalized Linear Mixed Models Using ‘AD Model Builder’. R Package Version 0.8.3.2.2015. Available online: http://glmmadmb.r-forge.r-project.org/repos/ (accessed on 30 June 2013).
- Hayes, J.P. Temporal variation in activity of bats and the design of echolocation-monitoring studies. J. Mammal. 1997, 78, 514–524. [Google Scholar] [CrossRef]
- O’Donnell, C.F.J. Conservation status and causes of decline of the threatened New Zealand long-tailed bat Chalinolobus tuberculatus (Chiroptera: Vespertilionidae). Mamm. Rev. 2000, 30, 89–106. [Google Scholar] [CrossRef]
- Azam, C.; Kerbiriou, C.; Vernet, A.; Julien, J.F.; Bas, Y.; Plichard, L.; Maratrat, J.; Le Viol, I. Is part-night lighting an effective measure to limit the impacts of artificial lighting on bats? Glob. Chang. Boil. 2015, 21, 4333–4341. [Google Scholar] [CrossRef] [PubMed]
- Ciechanowski, M.; Zajac, T.; Bilas, A.; Dunajski, R. Spatiotemporal variation in activity of bat species differing in hunting tactics: Effects of weather moonlight, food abundance, and structural clutter. Can. J. Zool. 2007, 85, 1249–1263. [Google Scholar] [CrossRef]
- Zuur, A.F.; Ieno, E.N.; Walker, N.; Saveliev, A.A.; Smith, G.M. Mixed Effects Models and Extensions in Ecology with R; Statistics for Biology and Health; Springer: New York, NY, USA, 2009; 574p. [Google Scholar]
- Schielzeth, H. Simple means to improve the interpretability of regression coefficients. Methods Ecol. Evol. 2010, 1, 103–113. [Google Scholar] [CrossRef] [Green Version]
- Dormann, C.F.; McPherson, J.M.; Araújo, M.B.; Bivand, R.; Bolliger, J.; Carl, G.; Davies, R.D.; Hirzel, A.; Jetz, W.; Daniel Kissling, W.; et al. Methods to account for spatial autocorrelation in the analysis of species distributional data: A review. Ecography 2007, 30, 609–628. [Google Scholar] [CrossRef]
- Bivand, R.S.; Hauke, J.; Kossowski, T. Computing the Jacobian in Gaussian spatial autoregressive models: An illustrated comparison of available methods. Geogr. Anal. 2013, 45, 150–179. [Google Scholar] [CrossRef]
- Crawley, M.J. The R Book; Wiley-Blackwell: Chicago, IL, USA, 2009. [Google Scholar]
- Fox, J.; Monette, G. Generalized collinearity diagnostics. J. Am. Stat. Assoc. 1992, 87, 178–183. [Google Scholar] [CrossRef]
- Heiberger, R.M.; Holland, B. Multiple Comparisons. In Statistical Analysis and Data Display; Springer: New York, NY, USA, 2004; pp. 155–185. [Google Scholar] [CrossRef]
- Chatterjee, S.; Hadi, A.S. Regression Analysis by Example; John Wiley & Sons: Hoboken, NJ, USA, 2015. [Google Scholar]
- Burnham, K.P.; Anderson, D.R. Model Selection and Inference—A Practical Information-Theorical Approach, 2nd ed.; Springer: New York, NY, USA, 2002. [Google Scholar]
- Burnham, K.P.; Anderson, D.R.; Huyvaert, K.P. AIC model selection and multimodel inference in behavioral ecology: Some background, observations, and comparisons. Behav. Ecol. Sociobiol. 2011, 65, 23–35. [Google Scholar] [CrossRef]
- Verboom, B.; Huitema, H. The importance of linear landscape elements for the pipistrelle Pipistrellus pipistrellus and the serotine bat Eptesicus serotinus. Landsc. Ecol. 1997, 12, 117–125. [Google Scholar] [CrossRef]
- Dietz, M.; Pir, J.B.; Hillen, J. Does the survival of greater horseshoe bats and Geoffroy’s bats in Western Europe depend on traditional cultural landscapes? Biodivers. Conserv. 2013, 22, 3007–3025. [Google Scholar] [CrossRef]
- Zeale, M.R.; Davidson-Watts, I.; Jones, G. Home range use and habitat selection by barbastelle bats (Barbastella barbastellus): Implications for conservation. J. Mammal. 2012, 93, 1110–1118. [Google Scholar] [CrossRef]
- Arthur, L.; Lemaire, M.; Dufrêne, L.; Le Viol, I.; Julien, J.F.; Kerbiriou, C. Understanding bat-habitat associations and the effects of monitoring on long-term roost success using a volunteer dataset. Acta Chiropterol. 2014, 16, 397–411. [Google Scholar] [CrossRef]
- Racey, P.A.; Swift, S.M. Feeding Ecology of Pipistrellus pipistrellus (Chiroptera: Vespertilionidae) during Pregnancy and Lactation. I. Foraging Behaviour. J. Anim. Ecol. 1985, 54, 205–215. [Google Scholar] [CrossRef]
- Razgour, O.; Hanmer, J.; Jones, G. Using multi-scale modelling to predict habitat suitability for species of conservation concern: The grey long-eared bat as a case study. Biol. Conserv. 2011, 144, 2922–2930. [Google Scholar] [CrossRef] [Green Version]
- Tillon, L. Utilisation des gîtes et des terrains de chasse par les Chiroptères forestiers, propositions de gestion conservatoire. Ph.D. Thesis, Université Toulouse III Paul Sabatier, Toulouse, France, 2015. [Google Scholar]
- Larrieu, L.; Cabanettes, A. Species, live status, and diameter are important tree features for diversity and abundance of tree microhabitats in subnatural montane beech-fir forest. Can. J. For. Res. 2012, 42, 1433–1445. [Google Scholar] [CrossRef]
- Lewis, T. Patterns of distribution of insects near a windbreak of tall trees. Ann. Appl. Biol. 1970, 65, 213–220. [Google Scholar] [CrossRef]
- Lewis, T.; Dibley, G.C. Air movement near windbreaks and a hypothesis of the mechanism of the accumulation of airborne insects. Ann. Appl. Biol. 1970, 66, 477–484. [Google Scholar] [CrossRef]
- Pasek, J.E. Influence of wind and windbreaks on local dispersal of insects. Agric. Ecosyst. Environ. 1988, 22–23, 539–554. [Google Scholar] [CrossRef]
- Holderied, M.W.; von Helversen, O. Echolocation range and wingbeat period match in aerial-hawking bats. Proc. Biol. Sci. 2003, 270, 2293–2299. [Google Scholar] [CrossRef] [PubMed] [Green Version]
- Merckx, T.; Feber, R.; Mclaughlan, C.; Bourn, N.A.D.; Parsons, M.S.; Townsend, M.C.; Riordan, P.; Macdonald, D.W. Shelter benefits less mobile moth species: The field-scale effect of hedgerow trees. Agric. Ecosyst. Environ. 2010, 138, 147–151. [Google Scholar] [CrossRef]
- Arlettaz, R. Feeding behaviour and foraging strategy of free-living mouse-eared bats, Myotis myotis and Myotis blythii. Anim. Behav. 1996, 51, 1–11. [Google Scholar] [CrossRef]
- Zahn, A.; Rottenwallner, A.; Güttinger, R. Population density of the greater mouse-eared bat (Myotis myotis), local diet composition and availability of foraging habitats. J. Zool. 2006, 269, 486–493. [Google Scholar] [CrossRef]
- Pereira, M.J.; Rebelo, H.; Rainho, A.; Palmeirim, J.M. Prey selection by Myotis myotis (Vespertilionidae) in a Mediterranean region. Acta Chiropterol. 2002, 4, 183–193. [Google Scholar] [CrossRef]
- Arlettaz, R.; Godat, S.; Meyer, H. Competition for food by expanding pipistrelle bat populations (Pipistrellus pipistrellus) might contribute to the decline of lesser horseshoe bats (Rhinolophus hipposideros). Biol. Conserv. 2000, 93, 55–60. [Google Scholar] [CrossRef]
- Sierro, A.; Arlettaz, R. Barbastelle bats (Barbastella spp.) specialize in the predation of mooths: Implications for foraging tactics and conservation. Acta Oecol. 1997, 18, 91–106. [Google Scholar] [CrossRef]
- Beck, A. Fecal analysis of European bat species. Myotis 1995, 32–33, 109–119. [Google Scholar]
- Barr, C.J.; Parr, T.W. Hedgerows: Linking ecological research and countryside policy. In Hedgerow Management and Nature Conservation; Watt, T.A., Buckley, G.P., Eds.; Wye College Press, Wye College, University of London: London, UK, 1994; pp. 119–136. [Google Scholar]
- Department for Environment Food and Rural Affairs (DEFRA). Trends, Long Term Survival and Ecological Values of Hedgerow Trees: Development of Populations Models to Inform Strategy; Report to the UK Government Department for the Environment, Food and Rural Affairs; Forest Research, Forestry Commission: London, UK, 2010.
- Pointereau, P. Les haies évolution du linéaire en France depuis quarante ans. Courrier de l’environnement de l’INRA 2002, 46, 69–73. [Google Scholar]
- Charrier, S.; Petit, S.; Burel, F. Movements of Abax parallelepipedus (Coleoptera, Carabidae) in woody habitats of a hedgerow network landscape: A radiotracing study. Agric. Ecosyst. Environ. 1997, 61, 133–144. [Google Scholar] [CrossRef]
- Staley, J.T.; Botham, M.S.; Chapman, R.E.; Amy, S.R.; Heard, M.S.; Hulmes, L.; Savage, J.; Pywell, R.F. Little and late: How reduced hedgerow cutting can benefit Lepidoptera. Agric. Ecosyst. Environ. 2016, 224, 22–28. [Google Scholar] [CrossRef] [Green Version]
- Riffell, S.; Verschuyl, J.; Miller, D.; Wigley, T.B. Biofuel harvests, coarse woody debris, and biodiversity—A meta-analysis. For. Ecol. Manag. 2011, 261, 878–887. [Google Scholar] [CrossRef]
Figure 1.
Main effects of local and landscape variables of hedgerows on bat communities’ indices.


Table 1.
Species traits (habitat specialization), foraging strategies and occurrence in samples. For assessment of Habitat Specialization Index, see [59]. We distinguished two main guilds according to their foraging strategies: “gleaning bats” which mainly eat diurnal brachyceran Diptera and non-volant arthropods, such as weevils, lepidopteran larvae, harvestmen and spiders and “hawking bats” which mainly search the sky for prey.
| Bat Species | Total Number of Calls | Average Number of Calls per Sample (±SE) | Habitat Specialization Index (SSI) | Foraging Type |
|---|---|---|---|---|
| Barbastella barbastellus | 304 | 2.980 ± 2.036 | 3.6 | NA |
| Eptesicus serotinus | 817 | 8.010 ± 2.336 | 1.5 | Hawking |
| Myotis spp. (mainly daubentonii) | 179 | 1.755 ± 0.763 | 3.2 | Gleaning |
| Nyctalus leisleri | 327 | 3.206 ± 1.118 | 0.9 | Hawking |
| Nyctalus noctula | 274 | 2.686 ± 1.054 | 1.6 | Hawking |
| Pipistrellus kuhlii | 8600 | 84.314 ± 15.202 | 0.7 | Hawking |
| Pipistrellus nathusii | 7464 | 73.176 ± 40.149 | 3.1 | Hawking |
| Pipistrellus pipistrellus | 17,090 | 167.549 ± 75.354 | 0.5 | Hawking |
| Plecotus spp. (mainly austriacus) | 208 | 2.039 ± 0.968 | 1.4 | Gleaning |
Table 2.
Effects of local and landscape variables of hedgerows on bat species and communities’ indices. Co-variables temperature, number of minutes after sunset and spatial autocorrelation are presented in Supplementary Materials 4.
Table 2.
Effects of local and landscape variables of hedgerows on bat species and communities’ indices. Co-variables temperature, number of minutes after sunset and spatial autocorrelation are presented in Supplementary Materials 4.
| Species and Communities | Distribution in the Model | Foraging Strategy *** | Local Hedgerow Variables | Landscape Hedgerow Variables | ||||||||||||||
|---|---|---|---|---|---|---|---|---|---|---|---|---|---|---|---|---|---|---|
| Length50m | Shrub50m | Wooded50m | 3strat50m | Dist_hedgerow | Density1000m | Woodproduct1000m | Diversity1000m | |||||||||||
| Estimated ± se | P-Value | Estimated ± se | P-Value | Estimated ± se | P-Value | Estimated ± se | P-Value | Estimated ± se | P-Value | Estimated ± se | P-Value | Estimated ± se | P-Value | Estimated ± se | P-Value | |||
| B. barbastellus | Binomial | NA | 1.04 ± 0.50 | 0.04 * | −1.28 ± 0.90 | 0.16 | 1.65 ± 0.86 | 0.05 | ||||||||||
| E. serotinus | NegBin | Hawking | 0.26 ± 0.12 | 0.03 * | −0.68 ± 0.33 | 0.04 * | −1.08 ± 0.42 | 0.01 ** | 1.81 ± 0.44 | 4.3 × 10⁻⁵ *** | ||||||||
| P. kuhlii | NegBin | Hawking | 0.19 ± 0.10 | 0.07 | −0.34 ± 0.17 | 0.05 * | −0.52 ± 0.16 | 0.1 × 10⁻² ** | ||||||||||
| P. nathusii | NegBin | Hawking | 0.27 ± 0.16 | 0.09 | −0.51 ± 0.19 | 0.01 ** | −0.29 ± 0.16 | 0.07 | 0.32 ± 0.16 | 0.04 * | −0.26 ± 0.16 | 0.10 | ||||||
| P. pipistrellus | NegBin | Hawking | 0.44 ± 0.08 | 2.1 × 10⁻⁷ *** | 0.37 ± 0.09 | 3.7 × 10⁻⁵ *** | −0.27 ± 0.11 | 0.02 * | −0.54 ± 0.12 | 1.0 × 10⁻⁵ *** | ||||||||
| N. leisleri | NegBin | Hawking | −1.23 ± 0.36 | 0.001 *** | −0.80 ± 0.40 | 0.04 * | −0.41 ± 0.20 | 0.04 * | −0.90 ± 0.42 | 0.03 * | 0.96 ± 0.34 | 0.0052 ** | ||||||
| N. noctula | Binomial | Hawking | 0.68 ± 0.37 | 0.07 | ||||||||||||||
| Myotis spp. * | Binomial | Gleaning | / | |||||||||||||||
| Plecotus spp. ** | Binomial | Gleaning | 1.03 ± 0.59 | 0.08 | 1.20 ± 0.45 | 0.01 ** | −6.90 ± 6.51 | 0.29 | −0.98 ± 0.65 | 0.13 | ||||||||
| Hawking species | NegBin | / | 0.32 ± 0.11 | 0.3 × 10⁻² ** | 0.15 ± 0.07 | 0.04 * | −0.34 ± 0.12 | 0.004 ** | −0.40 ± 0.10 | 4.3 × 10⁻⁵ *** | ||||||||
| Gleaning species | NegBin | / | 0.59 ± 0.22 | 0.01 ** | −4.29 ± 1.94 | 0.03 * | −0.36 ± 0.16 | 0.02 * | 4.56 ± 2.64 | 0.08 | −11.87 ± 6.18 | 0.06 | 7.86 ± 3.71 | 0.034 * | 7.61 ± 3.91 | 0.05 | 1.12 ± 0.18 | 1.3 × 10⁻⁹ *** |
| CSI | Gaussian | / | 0.18 ± 0.05 | 0.004 | ||||||||||||||
| Species richness | NegBin | / | 0.12 ± 0.06 | 0.06 | −0.16 ± 0.075 | 0.03 * | −0.18 ± 0.07 | 0.0140 * | ||||||||||
NegBin: Negative binomial with zero inflated; Length50m: Length of the line of trees; Shrub50m: Length of shrub hedgerows with only shrubs; Wooded50m: Length of wooded hedgerows without shrubs; 3Strat50m: Length of hedgerows including the three strata (tree, shrub and herb); Dist_hedgerow: distance to the nearest hedgerow; Density1000m: density, that is, sum of hedgerow lengths in meters within the 1000 m buffer; Diversity1000m: structural diversity, that is, a Shannon diversity index calculated from the distribution of the different types of hedgerow (Length50m, Shrub50m, Wooded50m, 3Strat50m) within the 1000 m buffer; Woodproduct1000m: wood production that is, a measure of the wood volume contained in the linear element (in cubic meters); * Myotis bechsteinii, Myotis daubentonii, Myotis myotis, Myotis mystacinus, Myotis nattereri; ** Plecotus austriacus and Plecotus auritus; *** [16].
© 2018 by the authors. Licensee MDPI, Basel, Switzerland. This article is an open access article distributed under the terms and conditions of the Creative Commons Attribution (CC BY) license (http://creativecommons.org/licenses/by/4.0/).
Share and Cite
MDPI and ACS Style
Lacoeuilhe, A.; Machon, N.; Julien, J.-F.; Kerbiriou, C. The Relative Effects of Local and Landscape Characteristics of Hedgerows on Bats. Diversity 2018, 10, 72. https://doi.org/10.3390/d10030072
AMA Style
Lacoeuilhe A, Machon N, Julien J-F, Kerbiriou C. The Relative Effects of Local and Landscape Characteristics of Hedgerows on Bats. Diversity. 2018; 10(3):72. https://doi.org/10.3390/d10030072
Chicago/Turabian StyleLacoeuilhe, Aurélie, Nathalie Machon, Jean-François Julien, and Christian Kerbiriou. 2018. "The Relative Effects of Local and Landscape Characteristics of Hedgerows on Bats" Diversity 10, no. 3: 72. https://doi.org/10.3390/d10030072
Note that from the first issue of 2016, this journal uses article numbers instead of page numbers. See further details here.