METHODS
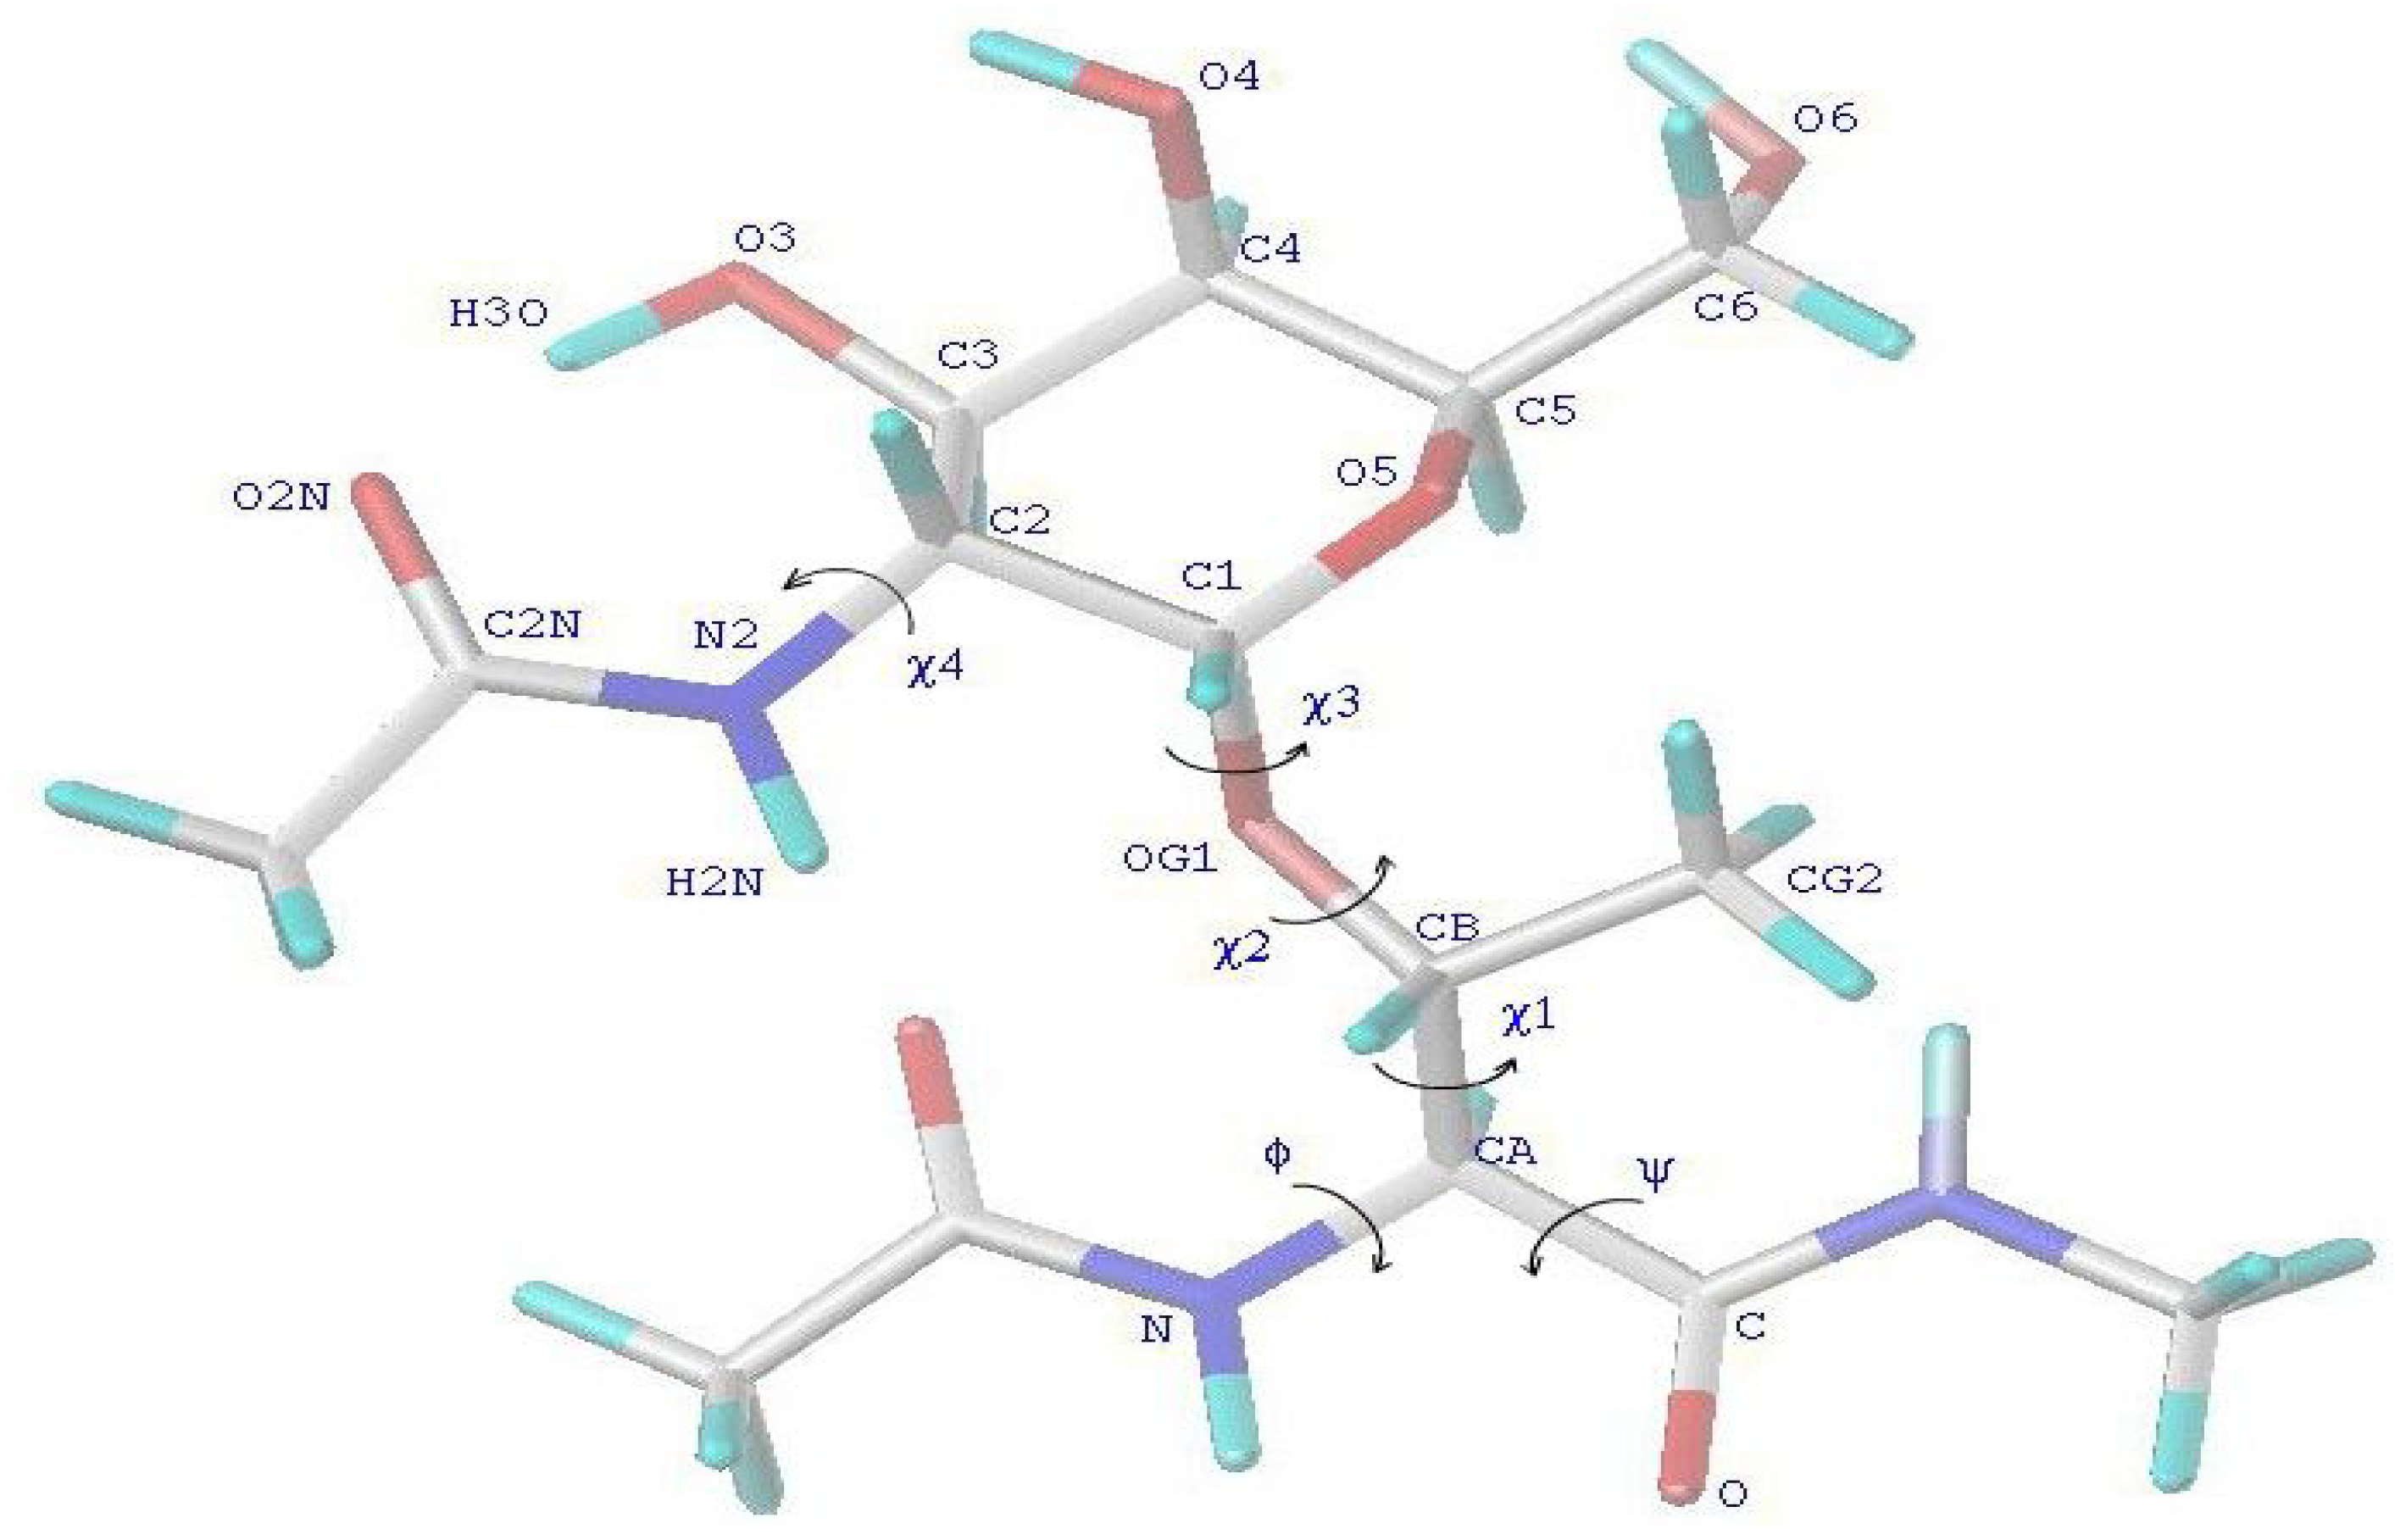
Starting structures for MD simulations. All starting structures of the peptides were taken in similar extended conformations of the peptide backbone for each residue with the corresponding dihedral angles: φ ≈ -82°, ψ ≈ 125°. The conformations of the side-chains for the glycosylated Thr residues (
Figure 1) were for each residue previously defined from a grid search and MD simulations [
2]. The geometry of the glycosyl ring was taken in the
4C
1 chair conformation.
MD simulations protocol. The SANDER module of the AMBER 6 package and the updated version of the GLYCAM parameters [
3,
4] were used for MD simulations. All starting structures were solvated in a periodic box of TIP3P water that was extended in each direction in order to have at least 9 Å from the box wall to any atom of the solute. This led to approximately 4200÷6700 water molecules depending on the solute starting conformation. All simulations were performed using periodic boundary conditions and the SHAKE algorithm [
5]. Constant pressure simulations (NTP) were run at a time step of 1 fs. These simulations were carried out at a temperature of 283 °K with Berendsen temperature coupling [
6]. This rather low temperature was used for comparison conformational data derived from the MD trajectories with experimental NMR data collected at 10 °C that will be described elsewhere. The electrostatic interactions were computed with the Particle Mesh Ewald method [
7] implemented in SANDER. The Lenard-Jones interactions were evaluated with a 9.0 Å cutoff value. The non-bonded pair list was updated every 100 steps. After the initial 1000 steps of energy minimization, the system was equilibrated during 100 ps of MD run with positional constraints. During the first 20 ps of the equilibration, the system was heated from 0 to 283 °K. The positional constraints were gradually reduced from 50 to 0.5 kcal/(mol*Å) within equilibration time. The productive MD simulations (without positional constraints) were run for 1.0 ns. Generated structures were stored in trajectory files every 0.1 ps, providing 10,000 conformers for each run. The collected structural data were analyzed with the CARNAL module of the AMBER 6 software and the graphic tools of the SYBYL 6.6 (Tripos, Inc., St. Louis). All calculations were performed on the Beowulf cluster containing five dual CPU Dell PowerEdge 1400 servers with 2 x 933 MHz CPUs and analyzed on the SGI O2 workstation.
Figure 1.
Schematic representation of the N-acetyl -N’-methylamide of Thr-GalNAc residue
Figure 1.
Schematic representation of the N-acetyl -N’-methylamide of Thr-GalNAc residue
RESULTS AND DISCUSSION
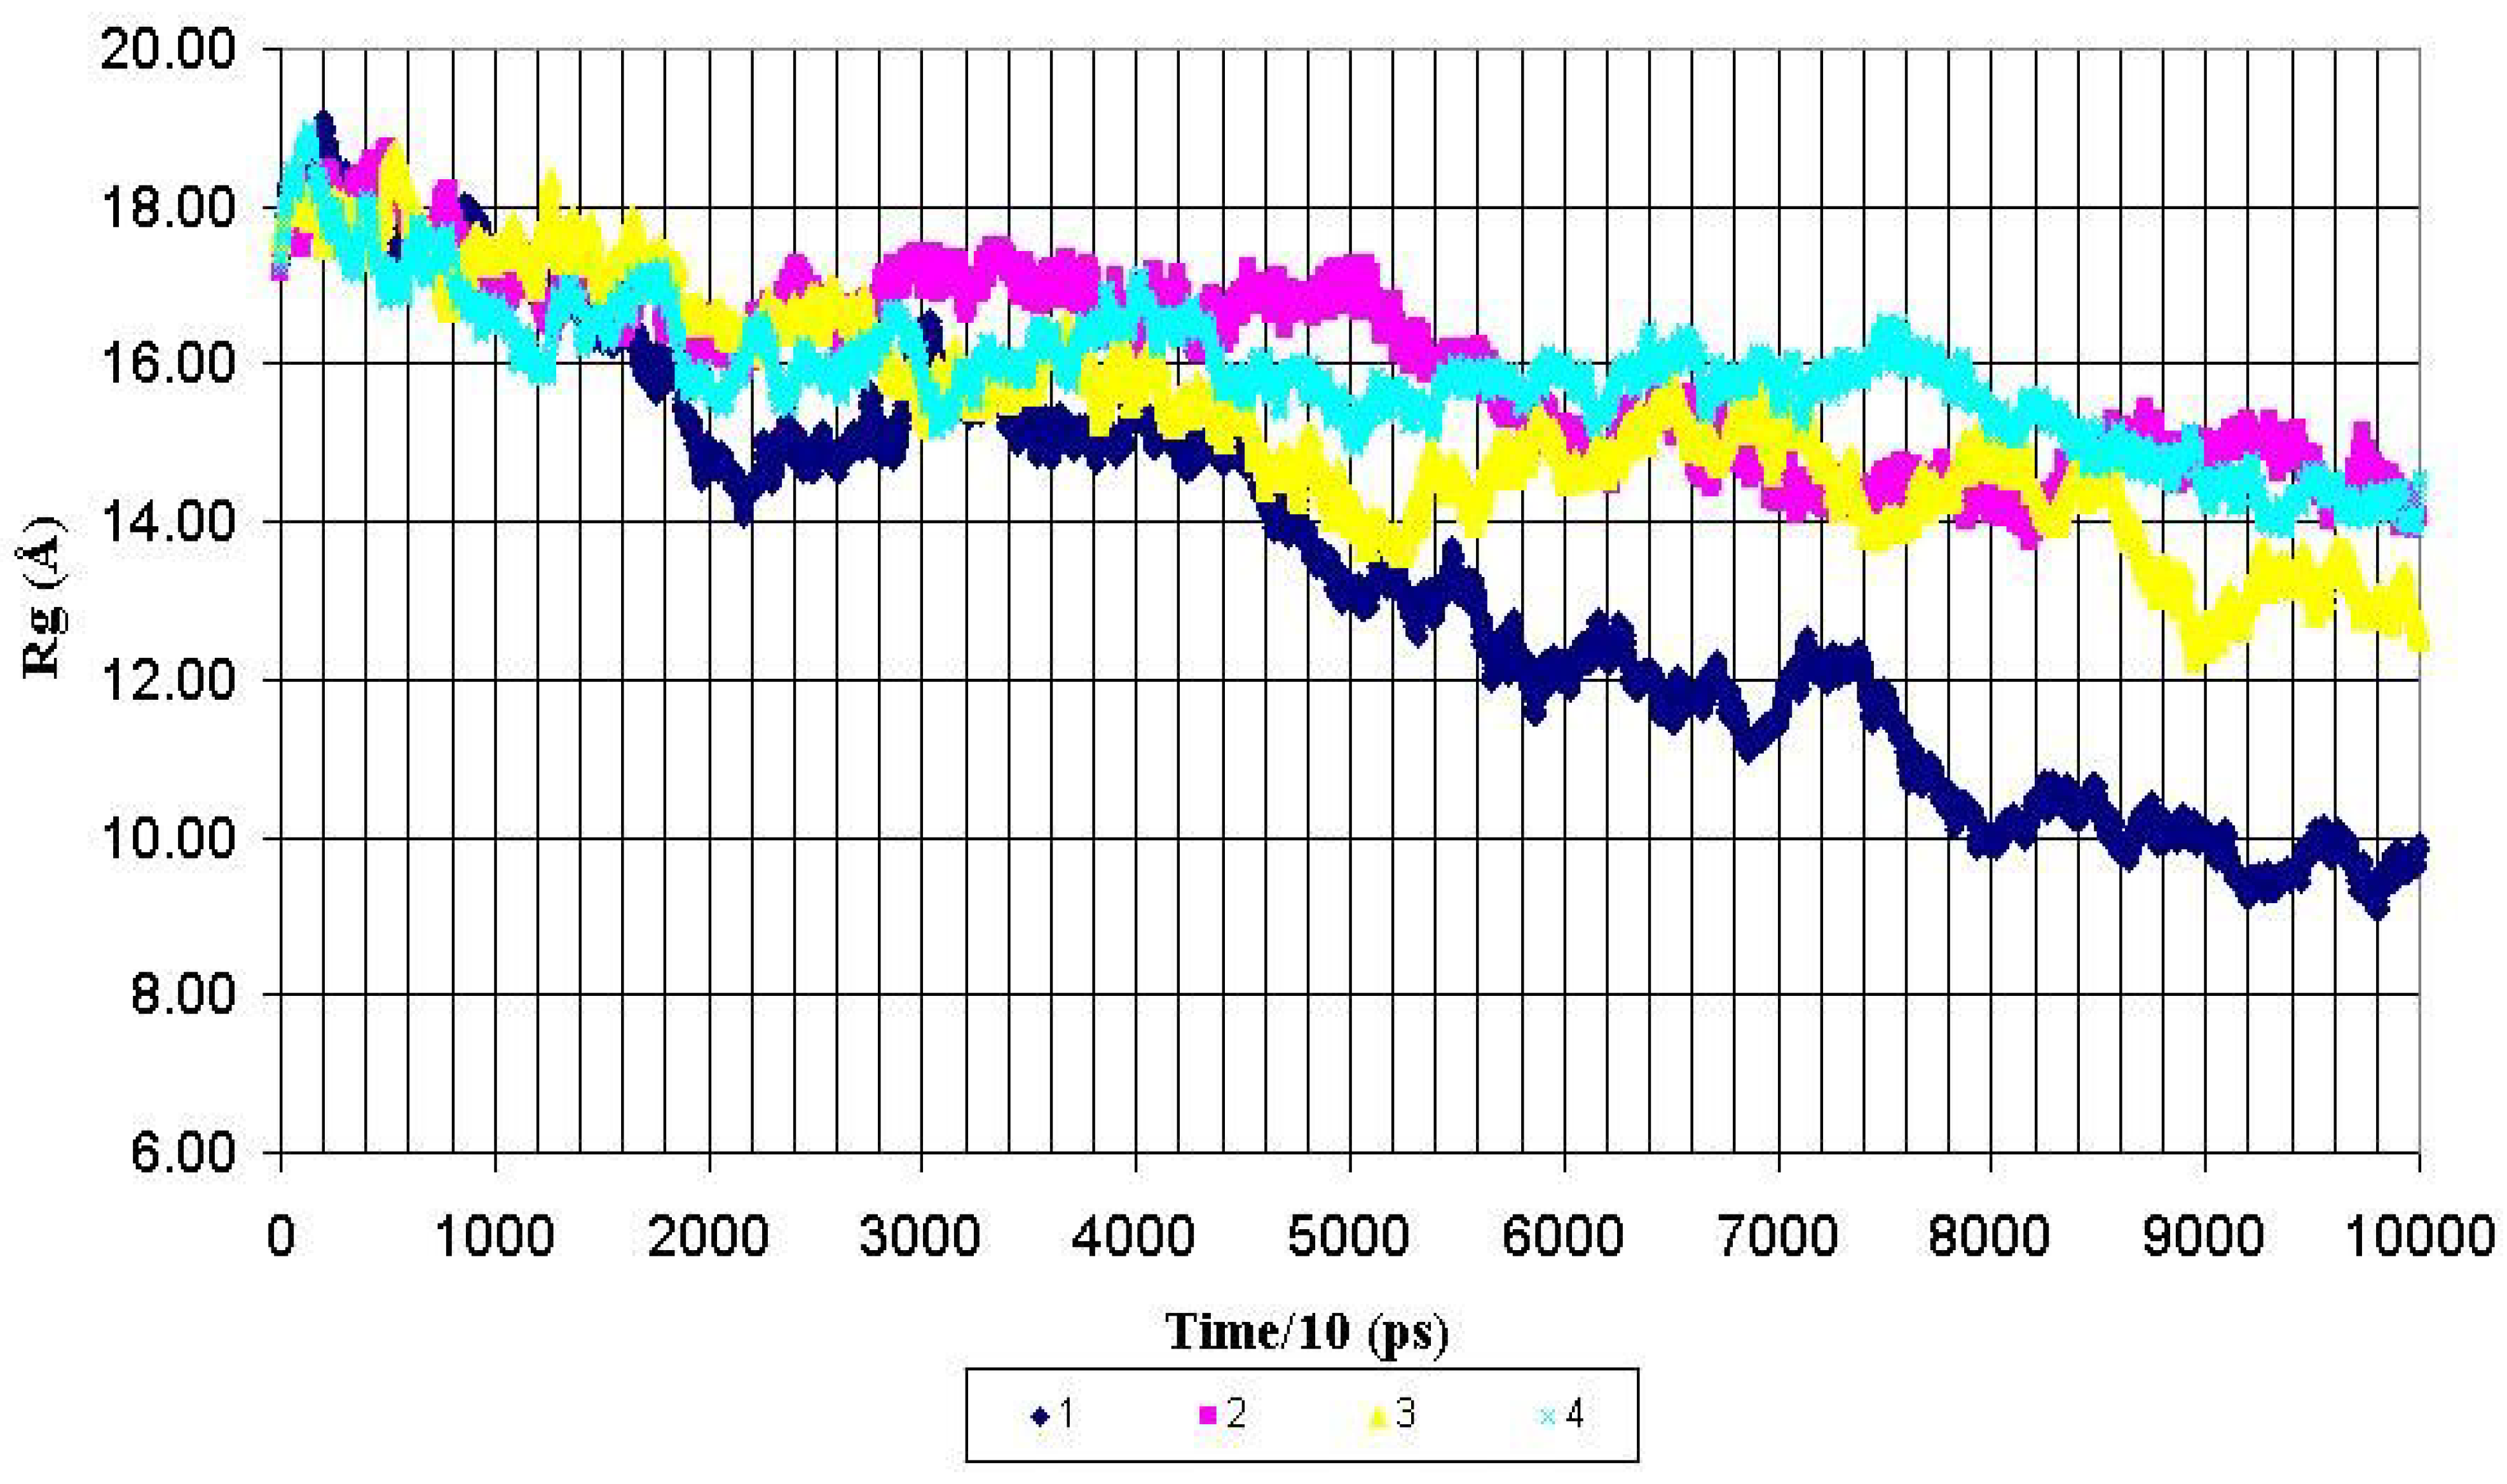
Structural features of the peptide backbone. The overall shape of the whole molecule and its central fragment PDTRPAP for all peptides were monitored by the calculation of the corresponding radius of gyration (Rg) for each MD run. The radiuses of gyration were calculated for backbone heavy atoms and presented as functions of MD simulation time in the
Figure 2 and
Figure 3. As can be seen from the
Figure 2, the Rg value for the whole nonglycosylated AHG21 peptide was decreased from ~17 Å to mean value of 10.8 ± 1.0 Å after 600 ps of the MD simulations. At the same time, the mean values of the Rg for the glycosylated peptides AHG21(T5), AHG21(T17), and AHG21(T5,T17)were significantly bigger: 14.7 ± 0.4 Å, 14.2 ± 0.9 Å, and 15.3 ± 0.7 Å, respectively.
Figure 2.
Radius of gyration (Rg) for backbone heavy atoms of the nonglycosylated peptide AHG21 – (1) and glycosylated peptides: AHG21 (T17) – (2), AHG21 (T5) – (3), AHG21 (T5, T17) – (4) during 1.0 ns MD simulations.
Figure 2.
Radius of gyration (Rg) for backbone heavy atoms of the nonglycosylated peptide AHG21 – (1) and glycosylated peptides: AHG21 (T17) – (2), AHG21 (T5) – (3), AHG21 (T5, T17) – (4) during 1.0 ns MD simulations.
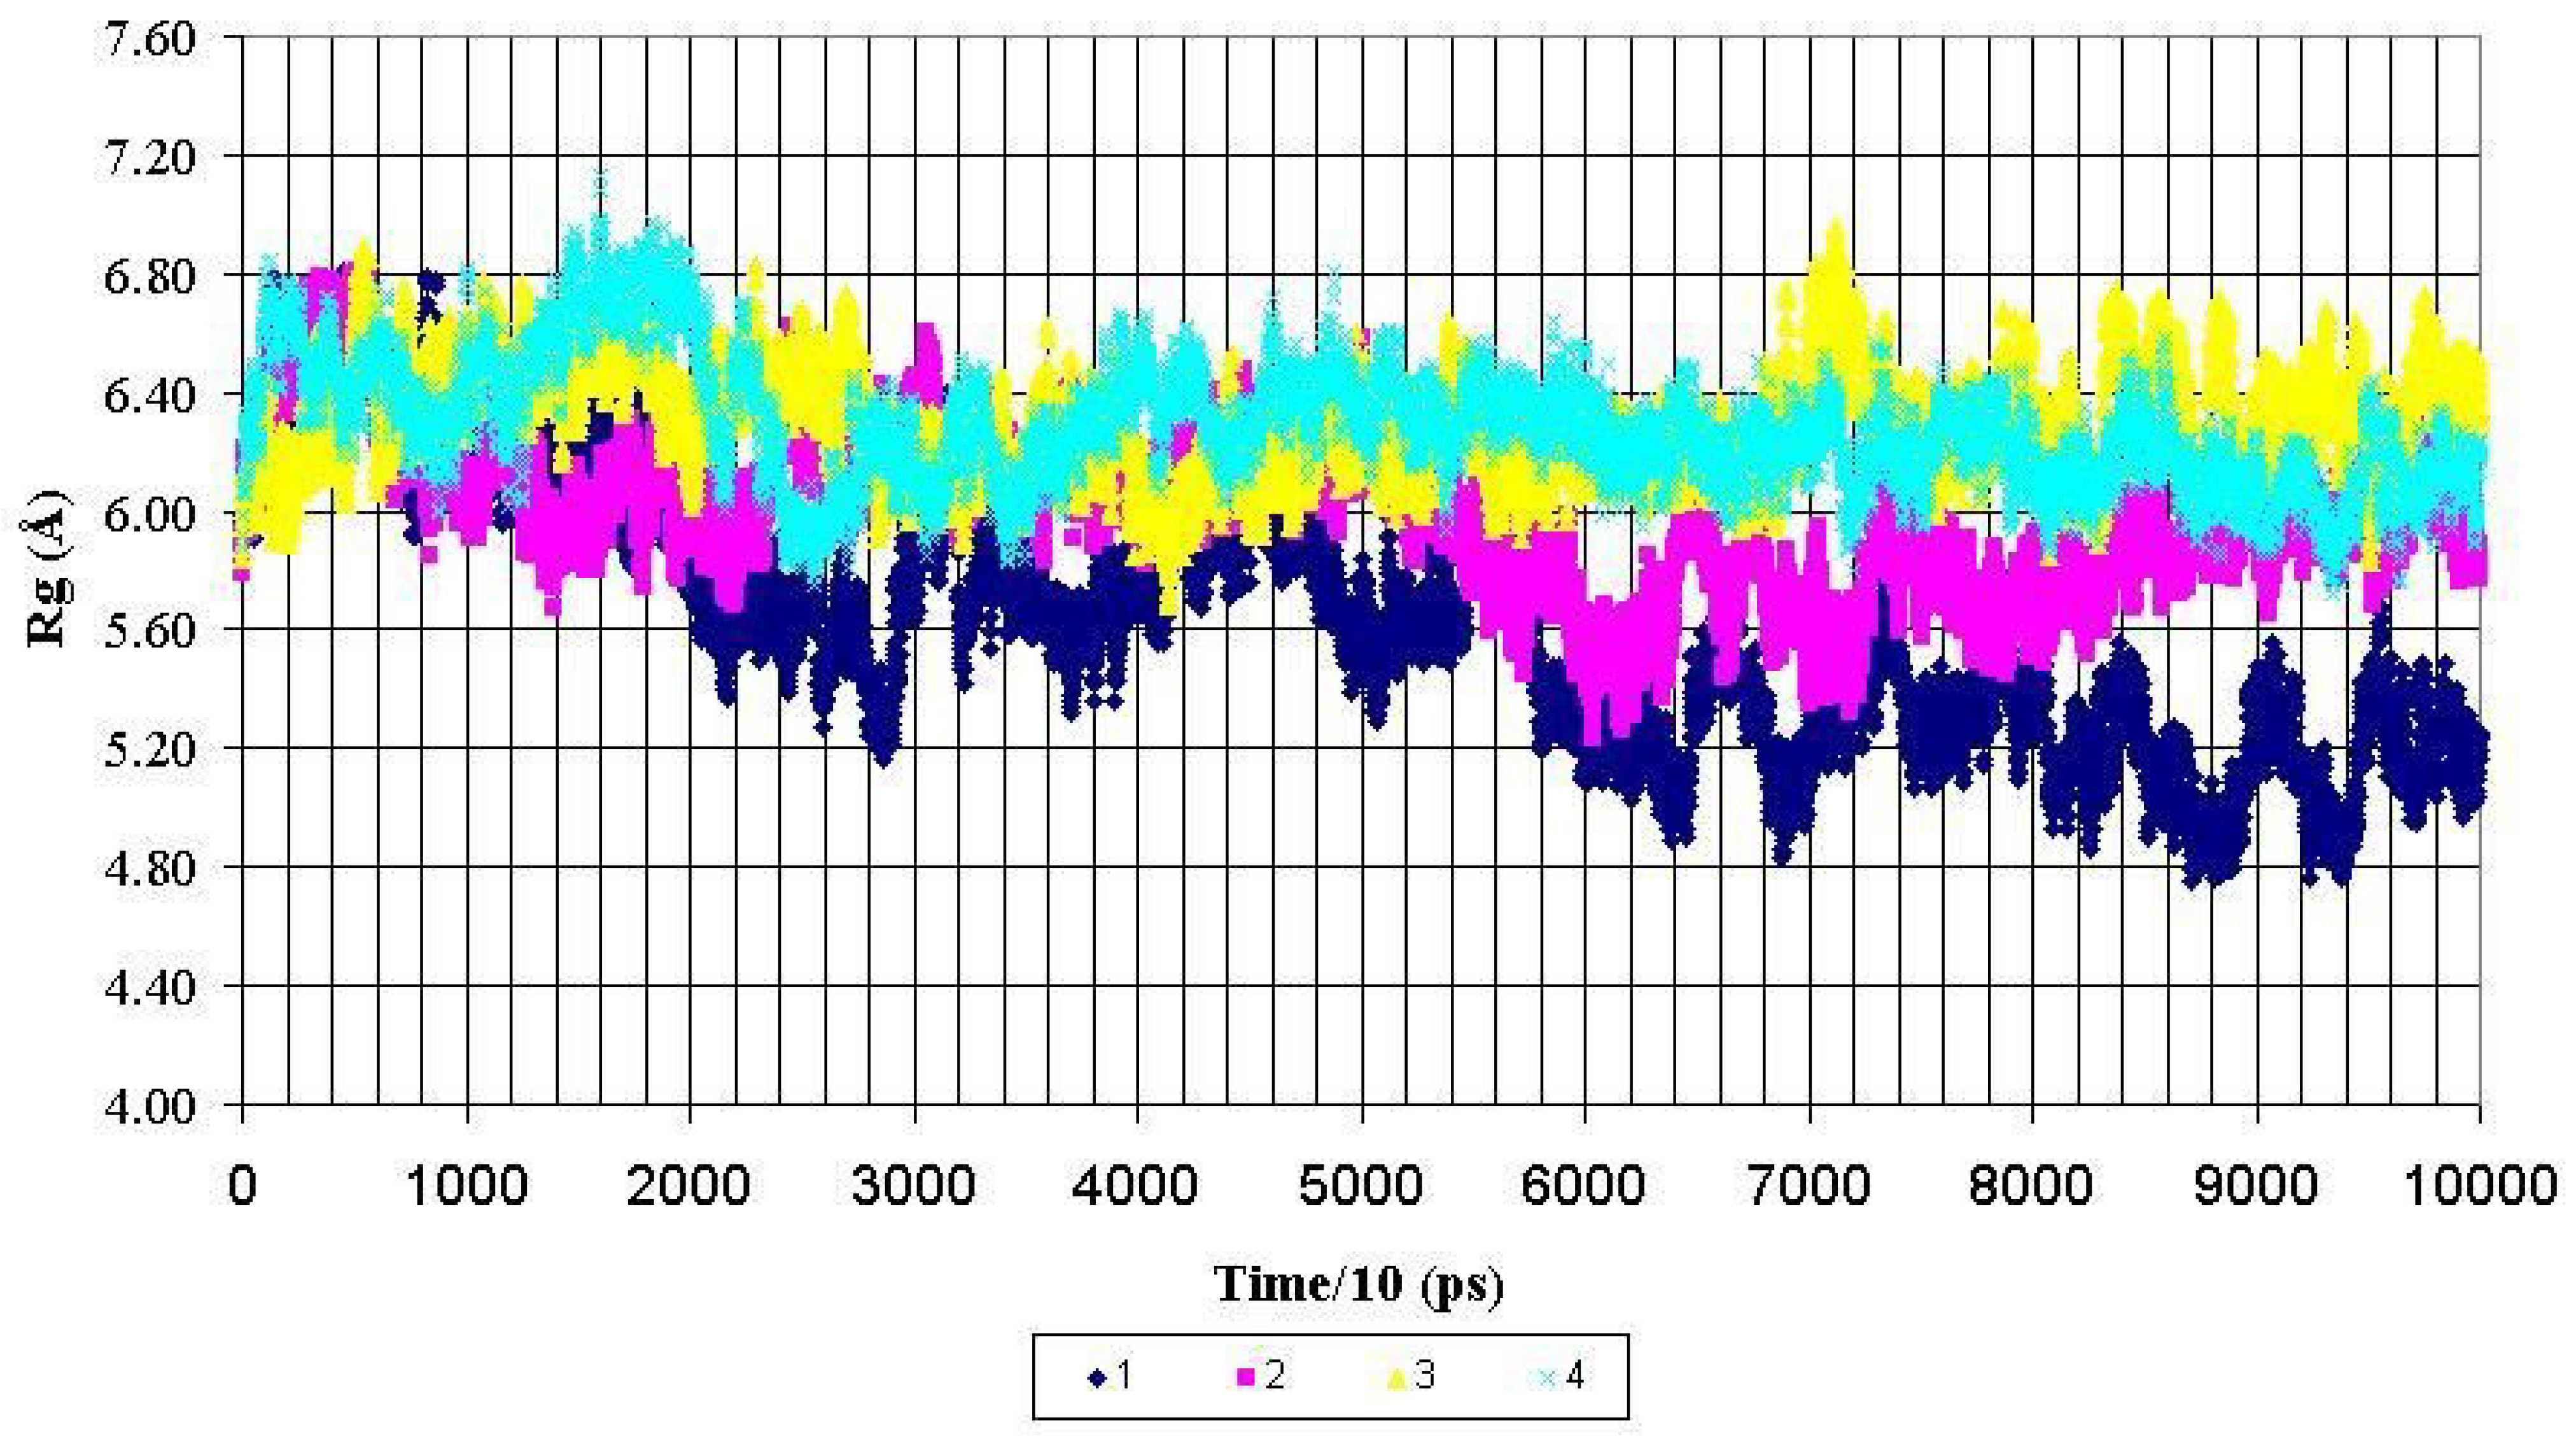
Figure 3.
Radius of gyration (Rg) for backbone heavy atoms of the PDTRPAP fragment of the nonglycosylated peptide AHG21 – (1) and glycosylated peptides: AHG21 (T17) – (2), AHG21 (T5) – (3), AHG21 (T5, T17) – (4) during 1.0 ns MD simulations.
Figure 3.
Radius of gyration (Rg) for backbone heavy atoms of the PDTRPAP fragment of the nonglycosylated peptide AHG21 – (1) and glycosylated peptides: AHG21 (T17) – (2), AHG21 (T5) – (3), AHG21 (T5, T17) – (4) during 1.0 ns MD simulations.
For the central fragment PDTRPAP, the radiuses of gyration after 600 ps of the MD simulations demonstrated the same tendency to more compact structures for the nonglycosylated peptide AHG21. The corresponding values of Rg for this fragment were decreased from ~ 5.8 Å to the mean value of 5.2 ± 0.2 Å for the AHG21 peptide, whereas for the glycosylated peptides AHG21(T5), AHG21(T17), and AHG21(T5, T17), the Rg mean values were 5.8 ± 0.2 Å, 6.3 ± 0.2 Å, and 6.1 ± 0.1 Å, respectively (
Figure 3). Thus, the comparison of the radiuses of gyration during the 1ns MD simulations suggests that the GalNAc attachment at T5, T17, or at both positions promotes the extended conformations of the glycopeptide backbone.
Analysis of RMSDs between coordinate sets of the backbone atoms (C
α, C, N) of the starting structures and corresponding average structures calculated during MD simulations also supported this observation. The average structures were calculated for the time intervals: 0-100-300-500-700-900-1000 ps. The corresponding RMSDs for the nonglycosylated AHG21 and glycosylated AHG21(T5), AHG21(T17), and AHG21(T5, T17) peptides are shown in
Table 1.
Table 1.
RMSD between coordinate sets of the backbone atoms (Cα, C, N) for the starting structures of the peptides and corresponding average structures during the production run of MD simulations.
Table 1.
RMSD between coordinate sets of the backbone atoms (Cα, C, N) for the starting structures of the peptides and corresponding average structures during the production run of MD simulations.
| Time intervals (ps) | RMSD (Å) |
|---|
| AHG21 | AHG21(T5) | AHG21(T17) | AHG21(T5, T17) |
|---|
| 0 - 100 | 0.7 | 0.5 | 0.4 | 0.6 |
| 100 - 300 | 1.3 | 0.8 | 0.8 | 0.6 |
| 300 - 500 | 1.4 | 0.9 | 0.8 | 0.6 |
| 500 - 700 | 1.9 | 0.7 | 1.1 | 1.0 |
| 700 - 900 | 2.0 | 1.0 | 1.0 | 1.4 |
| 900 - 1000 | 2.0 | 0.8 | 1.2 | 1.2 |
Analogous data for the PDTRP fragment are shown in
Table 2.
Table 2.
RMSD between coordinate sets of the backbone atoms (Cα, C, N) of the PDTRP fragment for the starting peptide structures and corresponding average structures during the production run of MD simulations.
Table 2.
RMSD between coordinate sets of the backbone atoms (Cα, C, N) of the PDTRP fragment for the starting peptide structures and corresponding average structures during the production run of MD simulations.
| Time interval (ps) | RMSD (Å) |
|---|
| AHG21 | AHG21(T5) | AHG21(T17) | AHG21(T5, T17) |
|---|
| 0 - 100 | 3.0 | 2.0 | 1.4 | 2.3 |
| 100 - 300 | 3.8 | 3.8 | 2.9 | 3.9 |
| 300 - 500 | 5.2 | 4.9 | 2.7 | 3.7 |
| 500 - 700 | 8.0 | 5.6 | 4.2 | 4.5 |
| 700 - 900 | 11.0 | 6.1 | 5.7 | 5.5 |
| 900 - 1000 | 13.0 | 6.8 | 6.0 | 6.7 |
For the nonglycosylated AHG21 peptide, RMSD between the starting structure and the average structures during 1ns of the MD simulations was steadily increased to 13 Å, while RMSDs for the glycosylated peptides were significantly lower (
Table 1). Analogously, for the PDTRP fragment, RMSDs for the glycosylated peptides during MD simulations were significantly lower than for the nonglycosylated peptide AHG21 (
Table 2). These data suggest that O-glycosylation significantly stabilized the extended conformations of the PDTRP fragment, as well as of the whole molecule.
Dihedral angles dynamics. To evaluate conformational effects of the O-glycosylation of Thr5 and Thr17 on the flanking Ser residues, the backbone conformations derived from the MD trajectories for the nonglycosylated and glycosylated peptides were compared and analyzed. The backbone dihedral angles φ, ψ were assigned to the conformational clusters (
p, r,
b, c, l,
g, i, or
d) corresponding to the distinct areas on the Ramachandran plot [
8]. Populations of the conformational clusters were calculated for the Ser6 and Ser16 residues that were adjacent to either glycosylated or nonglycosylated Thr residue at the corresponding positions T5 and T17 (
Figure 4 and
Figure 5).
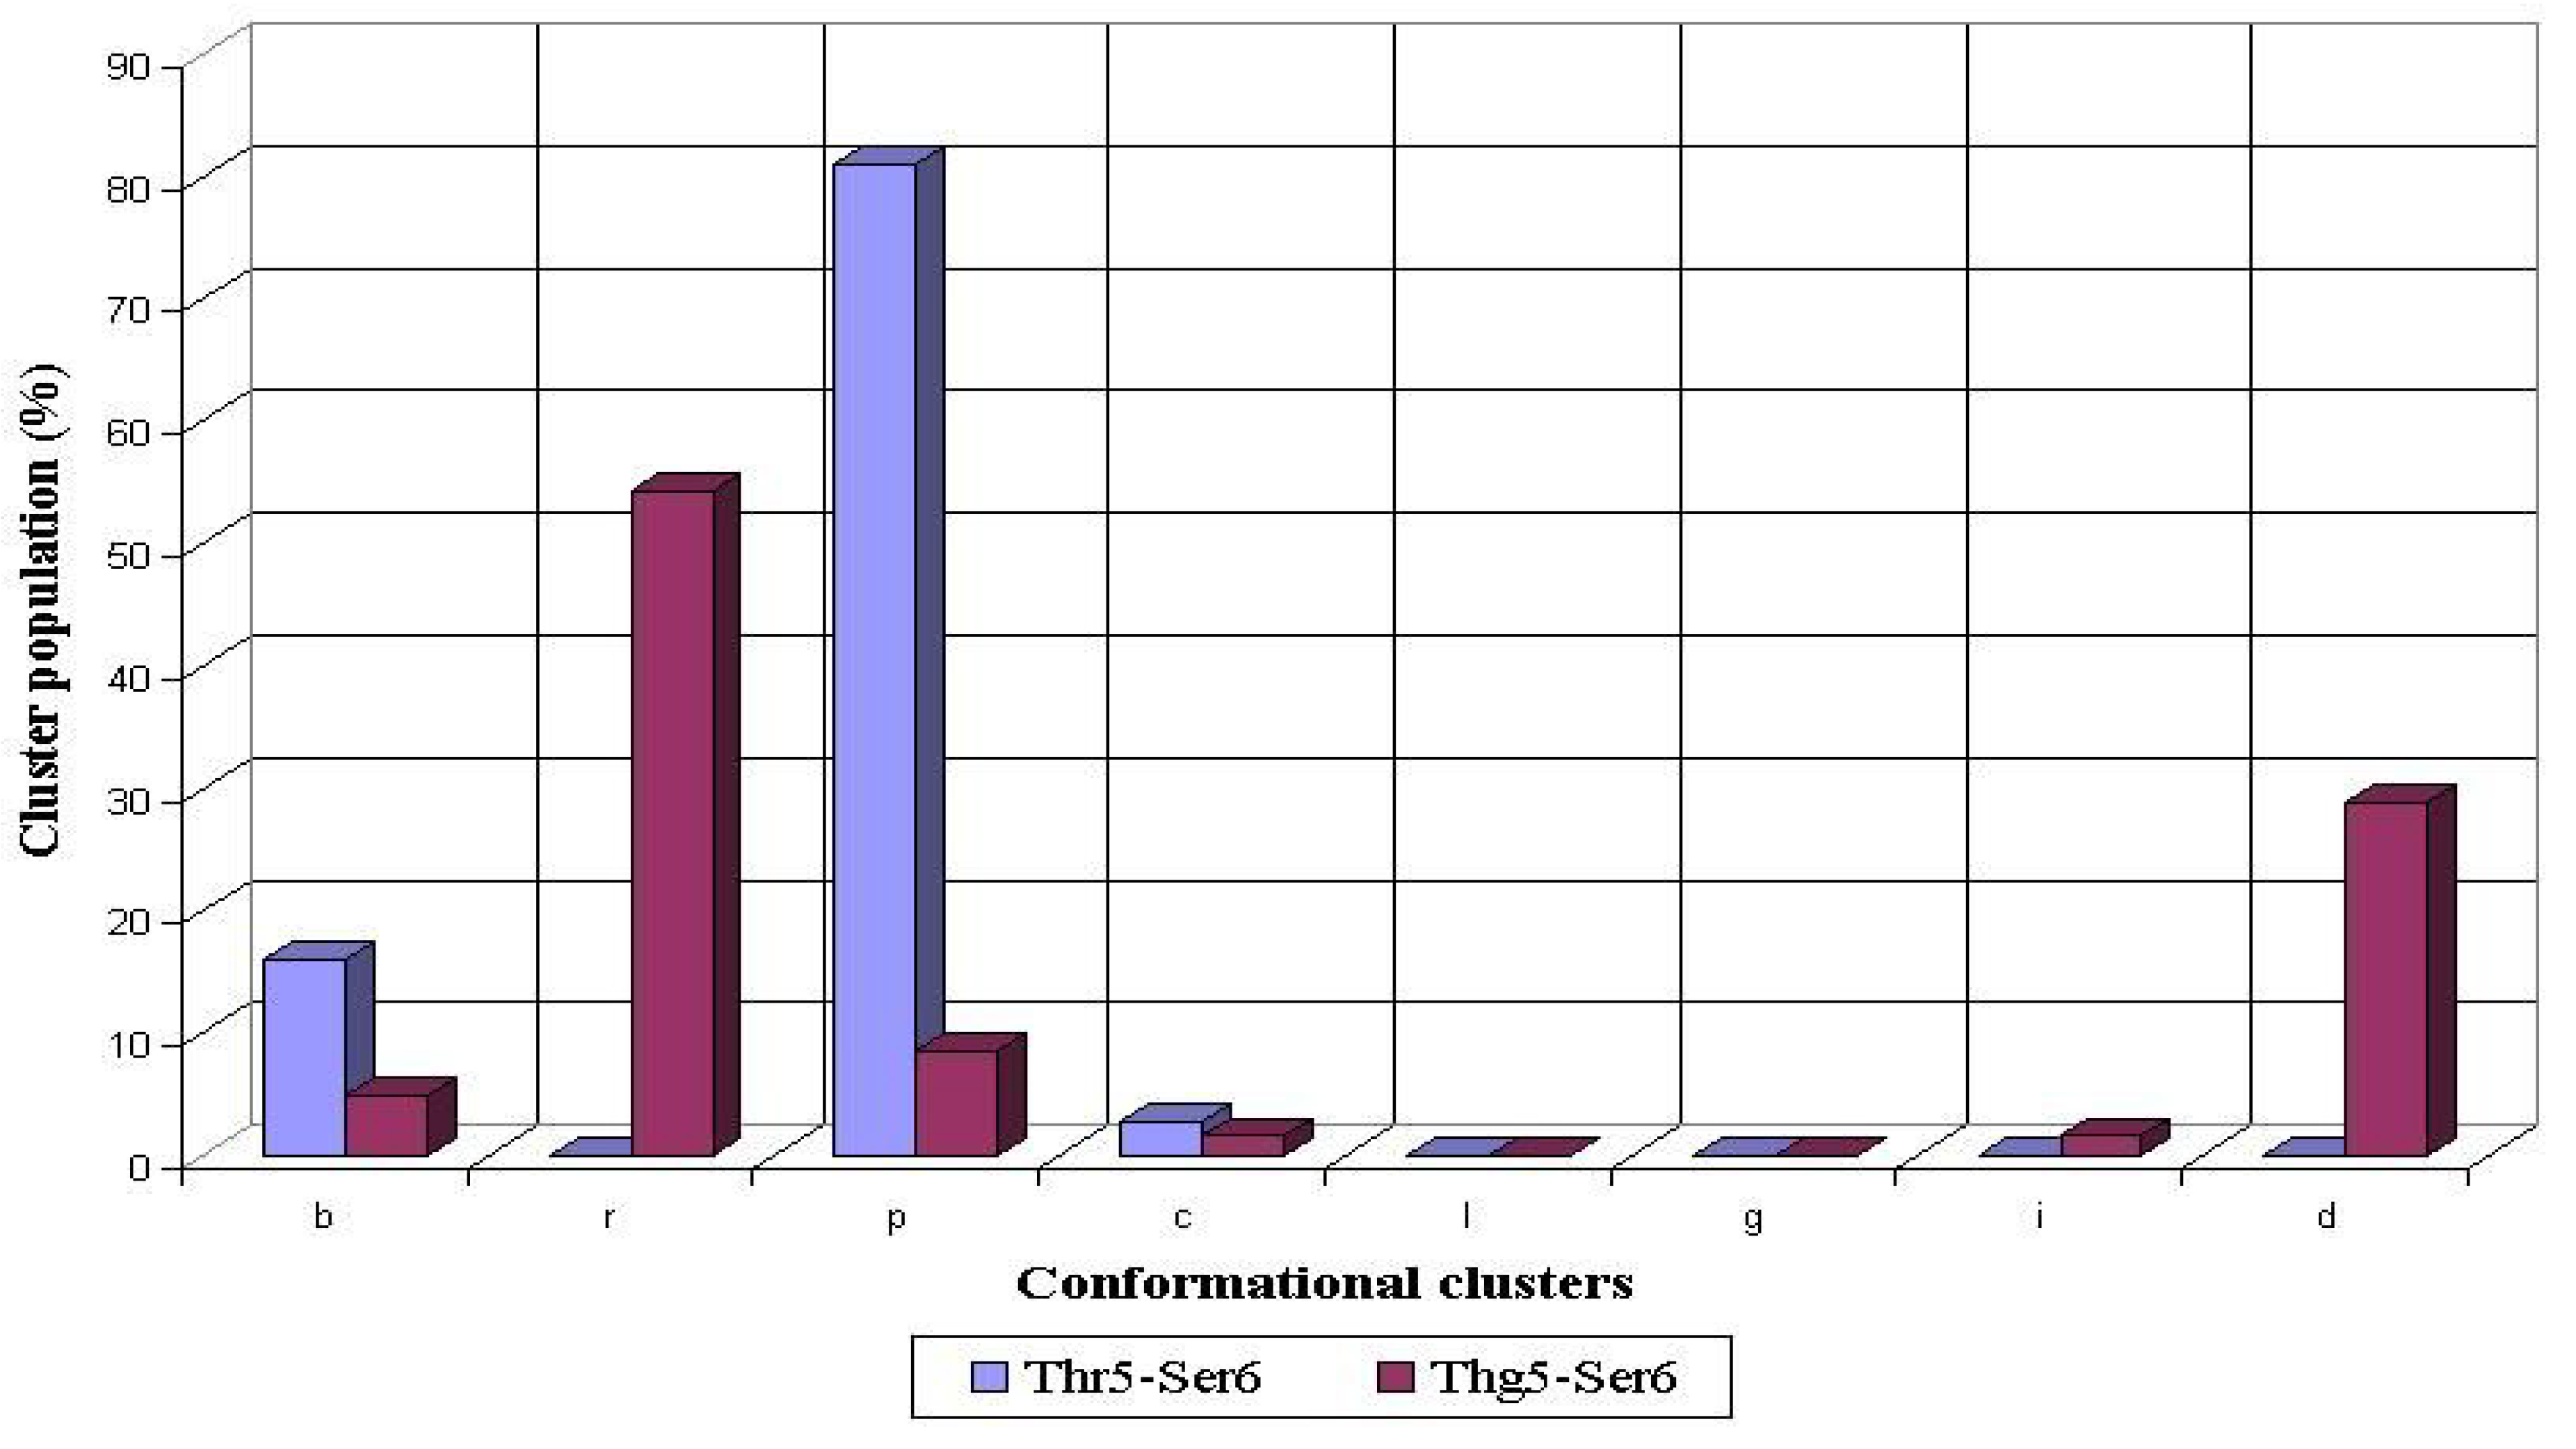
Figure 4.
Conformational propensities of Ser6 flanking the nonglycosylated (Thr5-Ser6) and glycosylated (Thg5-Ser6) threonine residue during 1 ns MD simulations in peptides AHG21 and AHG21 (T5), respectively
Figure 4.
Conformational propensities of Ser6 flanking the nonglycosylated (Thr5-Ser6) and glycosylated (Thg5-Ser6) threonine residue during 1 ns MD simulations in peptides AHG21 and AHG21 (T5), respectively
For the nonglycosylated Thr5 residue, the backbone conformations of the following Ser6 mostly populated the
p cluster (81%), whereas the
b cluster was populated significantly lower (16%) (
Figure 4). The glycosylation of Thr5 caused a significant decrease of population of the
p and
b clusters, while the
r and
d clusters turned to the most populated ones (54% and 29%, correspondingly). This increase of the
r cluster population for the Ser residue following the glycosylated threonine was consistent with our previous data obtained for the 15-residue peptide from the MUC1 tandem repeat [
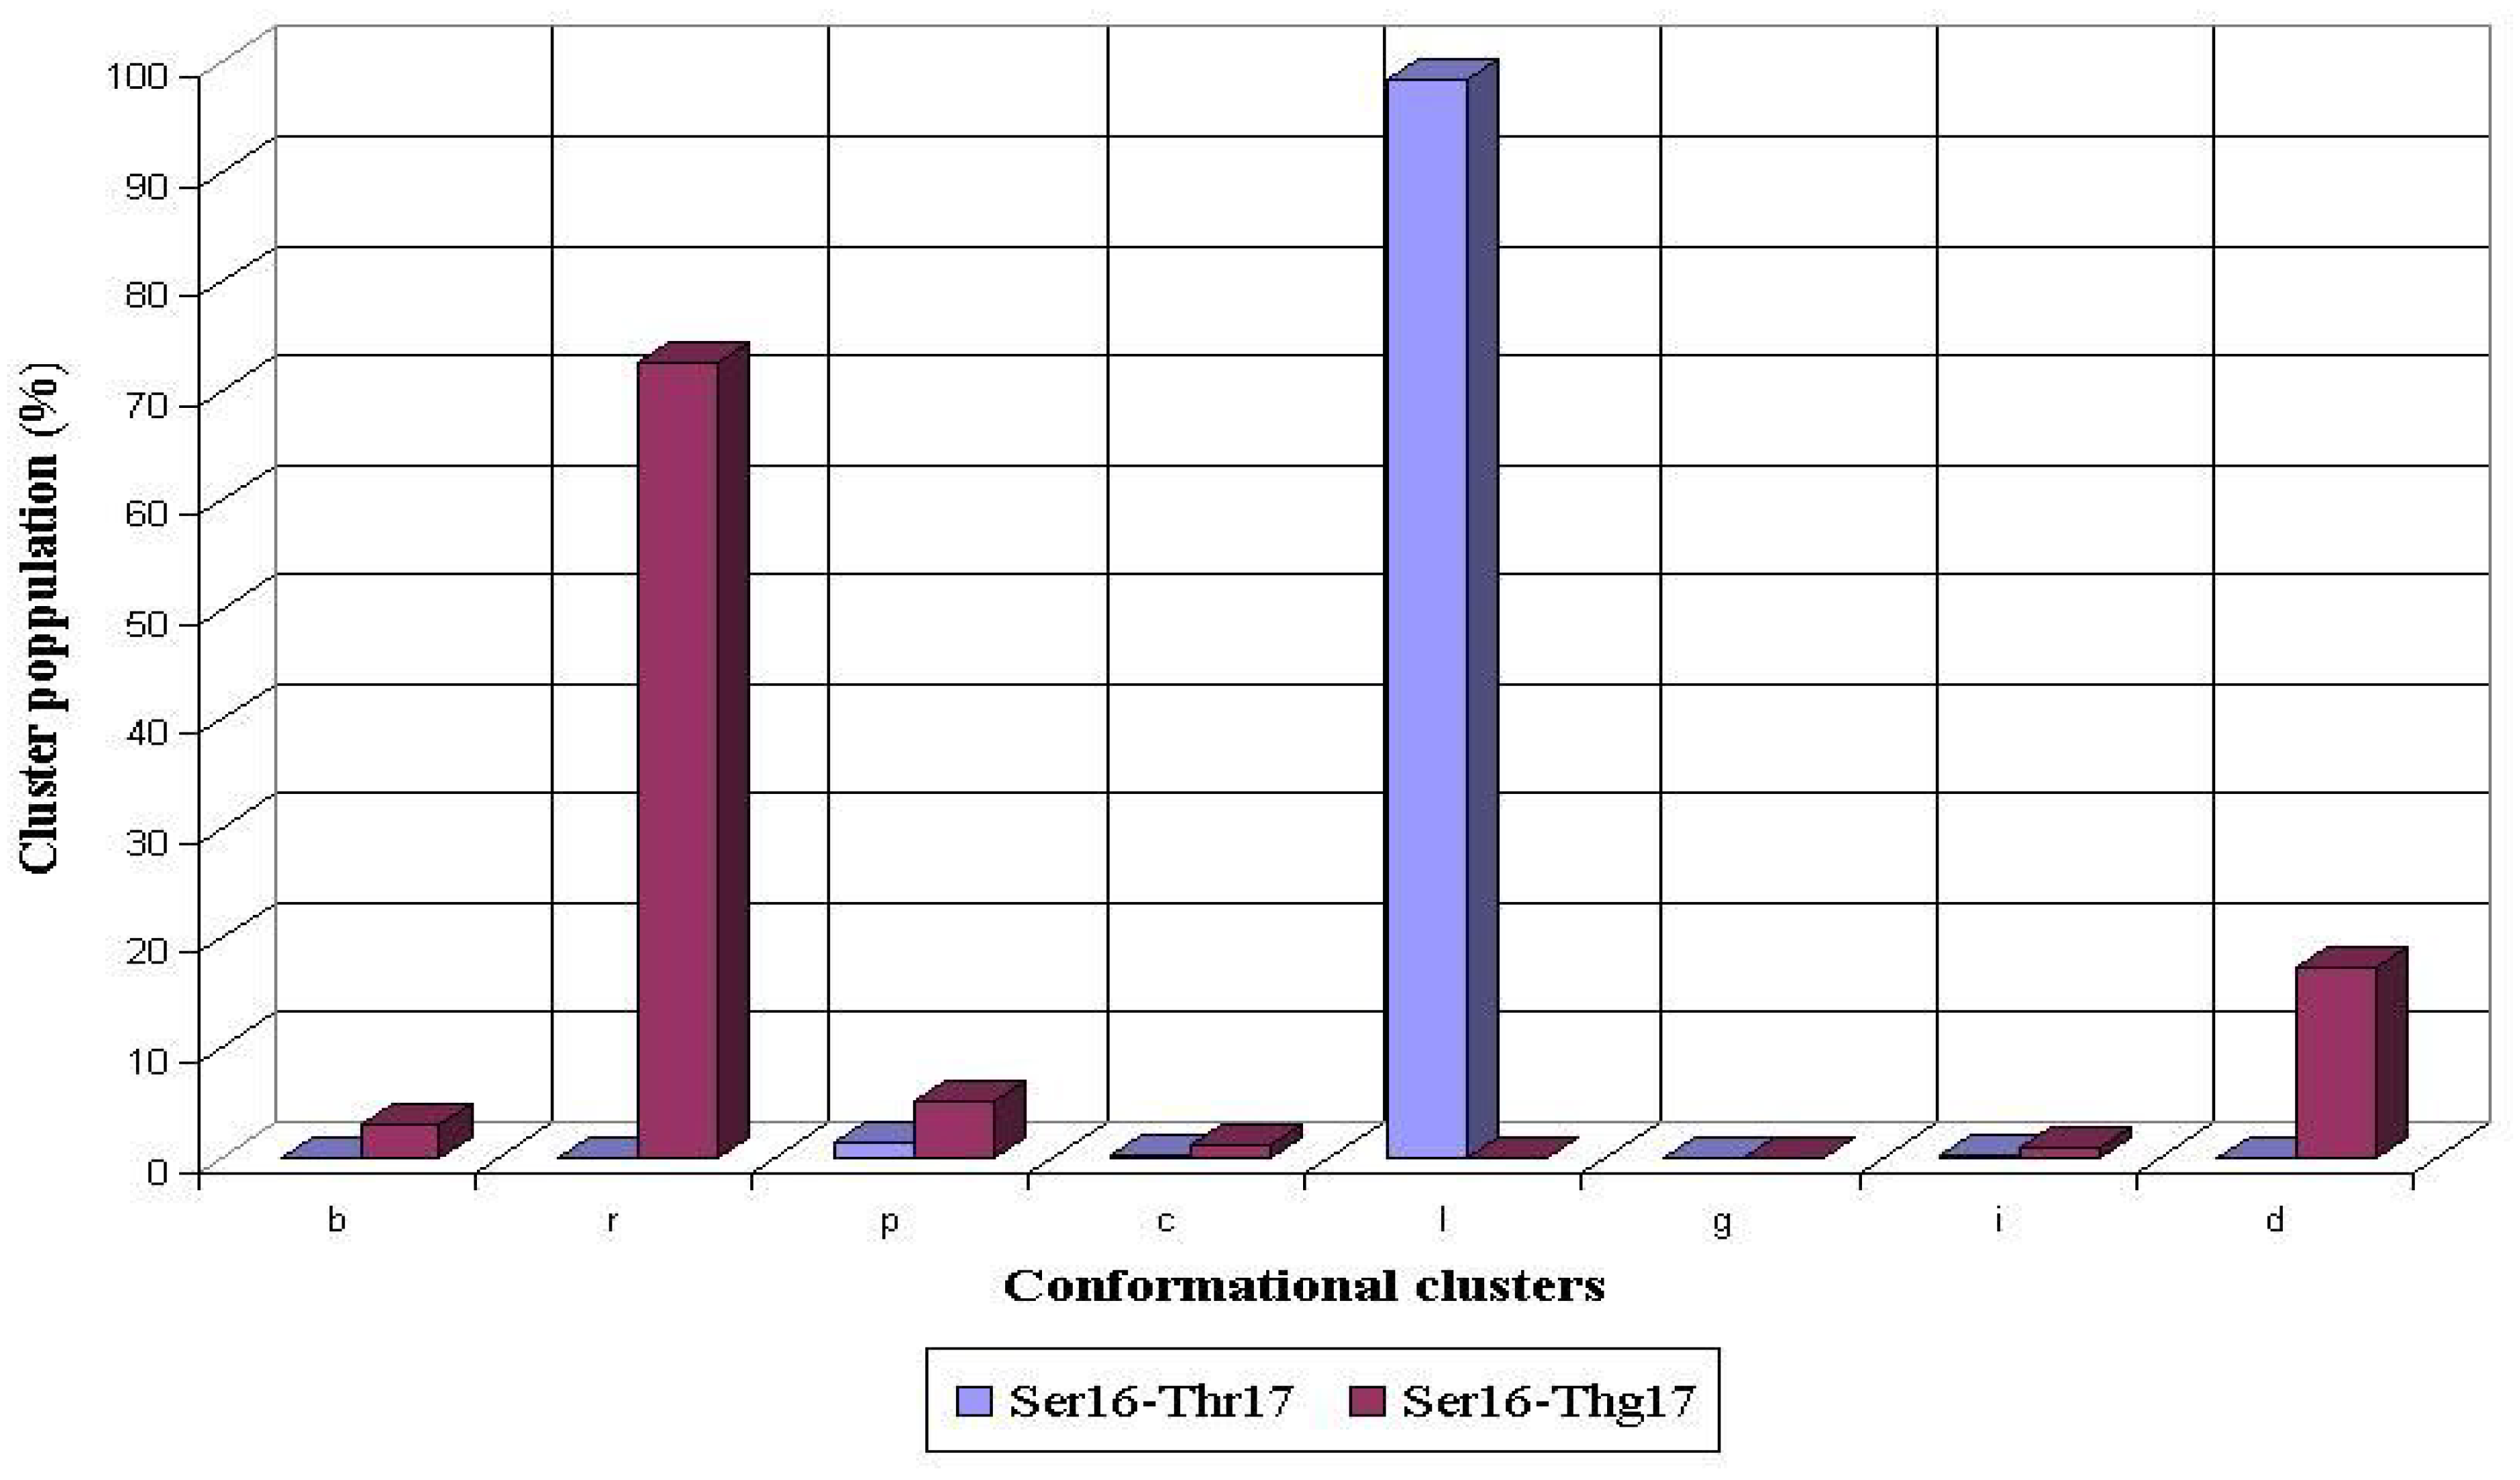
8]. The glycosylation of Thr17 also caused a significant rearrangement of the preferred conformations adopted by the preceding Ser16 during the MD simulations. For the nonglycosylated Thr17, the most conformers populated
l conformational cluster of the Ser16 residue (98%), whereas non-populated
r cluster became the most populated (73%) after the O-glycosylation of Thr 17 (
Fig. 5).
Figure 5.
Conformational propensities of Ser16 flanking the nonglycosylated (Ser16-Thr17) and glycosylated (Ser16-Thg17) threonine residue during 1 ns MD simulations in peptides AHG21 and AHG21 (T17), respectively.
Figure 5.
Conformational propensities of Ser16 flanking the nonglycosylated (Ser16-Thr17) and glycosylated (Ser16-Thg17) threonine residue during 1 ns MD simulations in peptides AHG21 and AHG21 (T17), respectively.
Thus, the glycosylation of the Thr residues caused significant rearrangements of the preferred conformational distributions for the flanking Ser residues. These distributions are distinct for the Ser residues that precede or follow an adjacent threonine. These distinct conformational propensities may explain, in part, differential substrate specificities demonstrated by the same GalNAc-transferases toward the Ser glycosylation within the MUC1-derived substrates that contain the -VTSA- or -GSTA- fragments [
9,
10].
Structural comparison of the PDTRP fragment with X-ray data. The PDTRP fragment of the tandem repeat of the MUC1 protein core is a well-known immunodominant epitope recognized by several anti-MUC1 monoclonal antibodies. It is also found within several antigenic MUC1-derived peptides that can be presented by the major histocompatibility complex (MHC) to T cell receptors. To evaluate structural effects of glycosylation on conformational propensities of the peptide backbone of the PDTRP fragment that might be beneficial for the MHC presentation, the structural features of the PDTRP region observed during the MD simulations were compared with a published crystal structure of the MUC1 peptide antigen SAPDTRPA complexed with the MHC [
11]. The RMSD criterion of 1 Å for the backbone atoms (C
α, C, N) of the PDTRP fragment was used as a measure of similarity between the crystal and MD-derived structures .
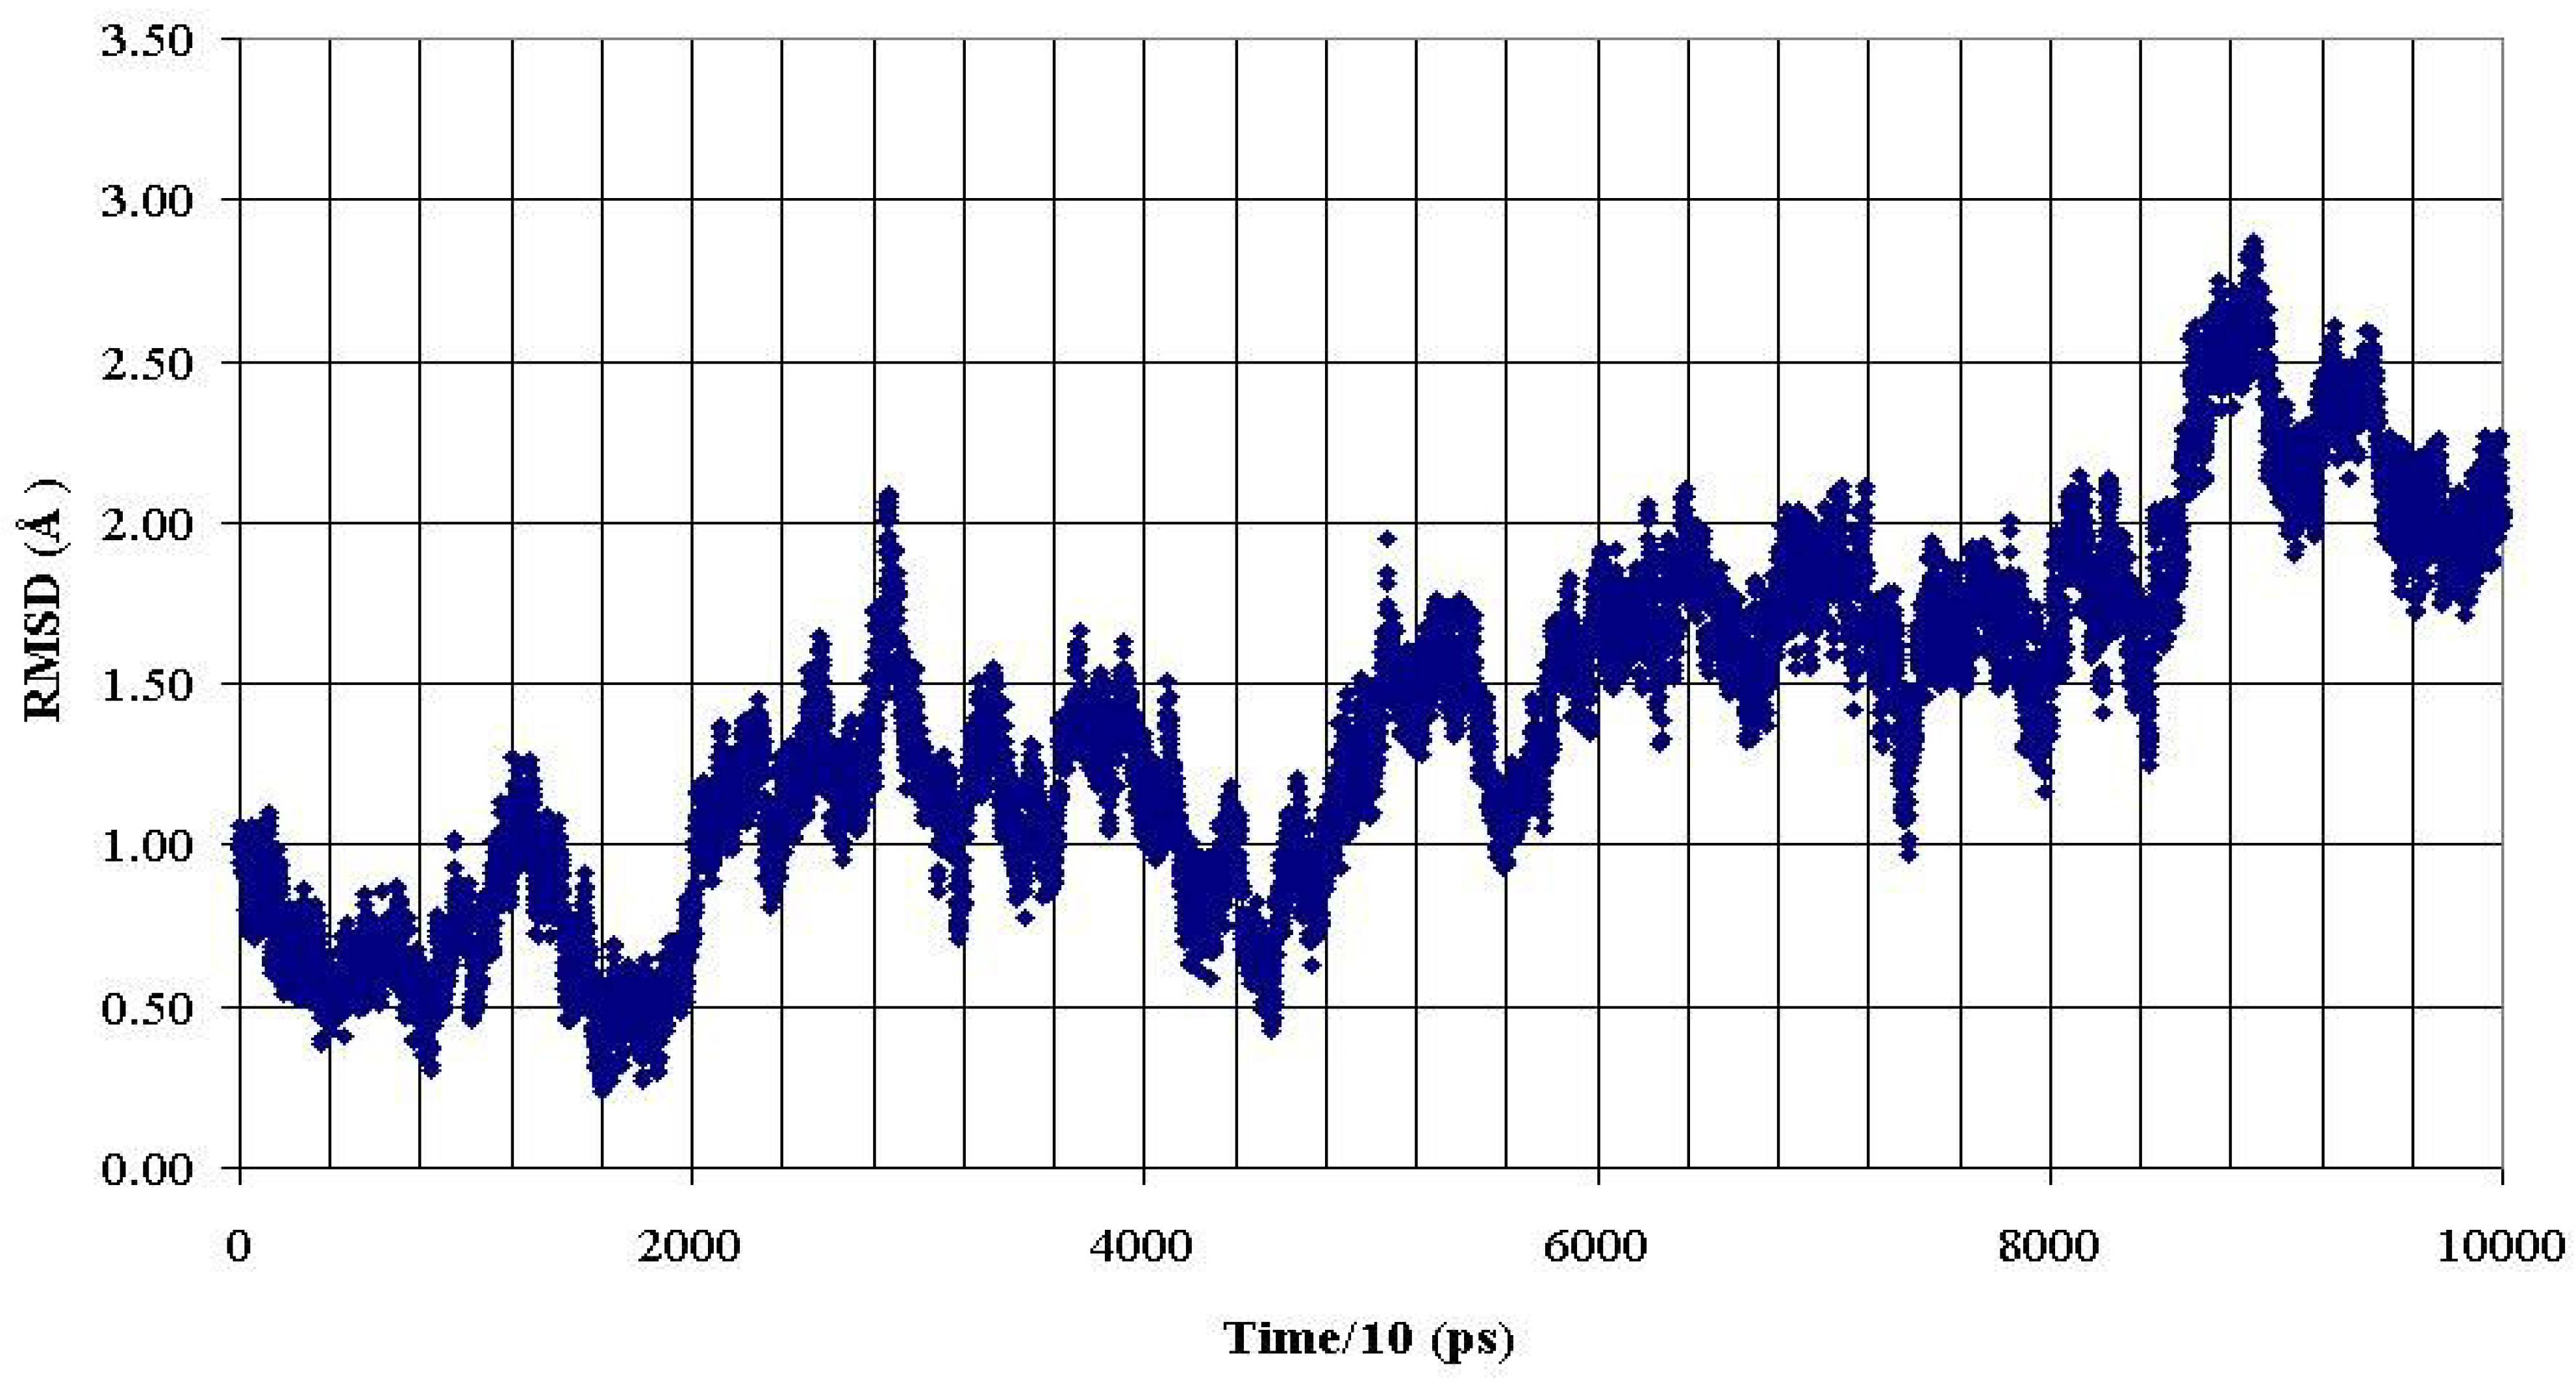
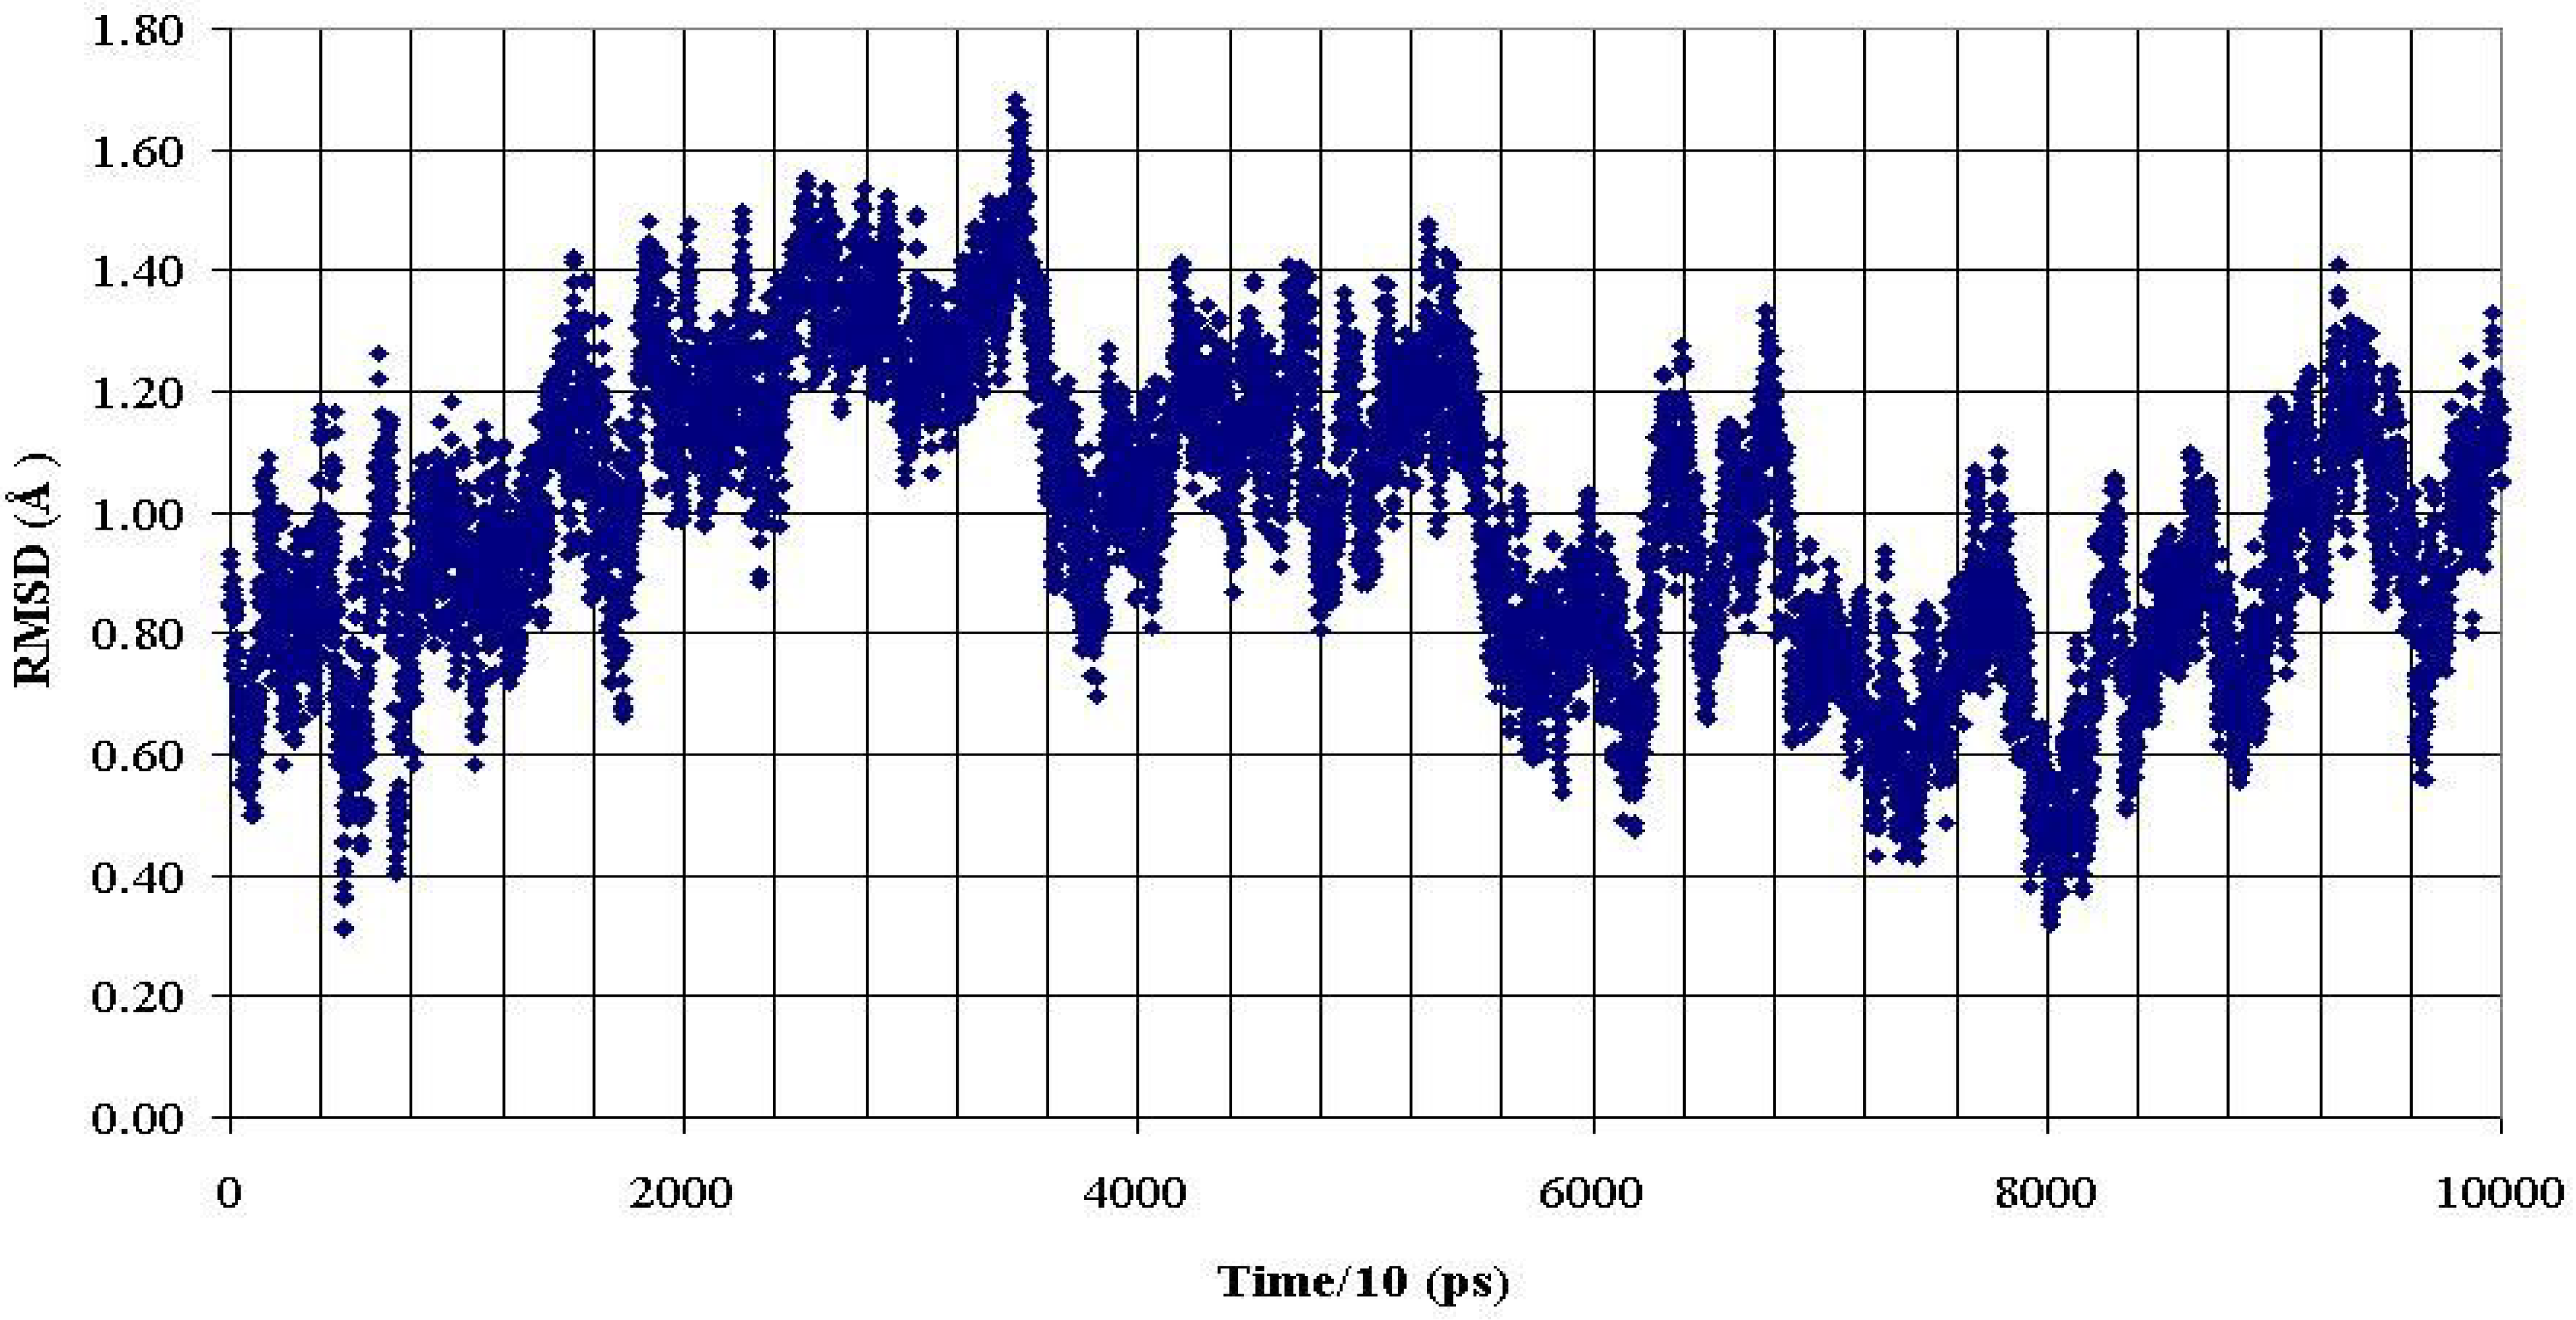
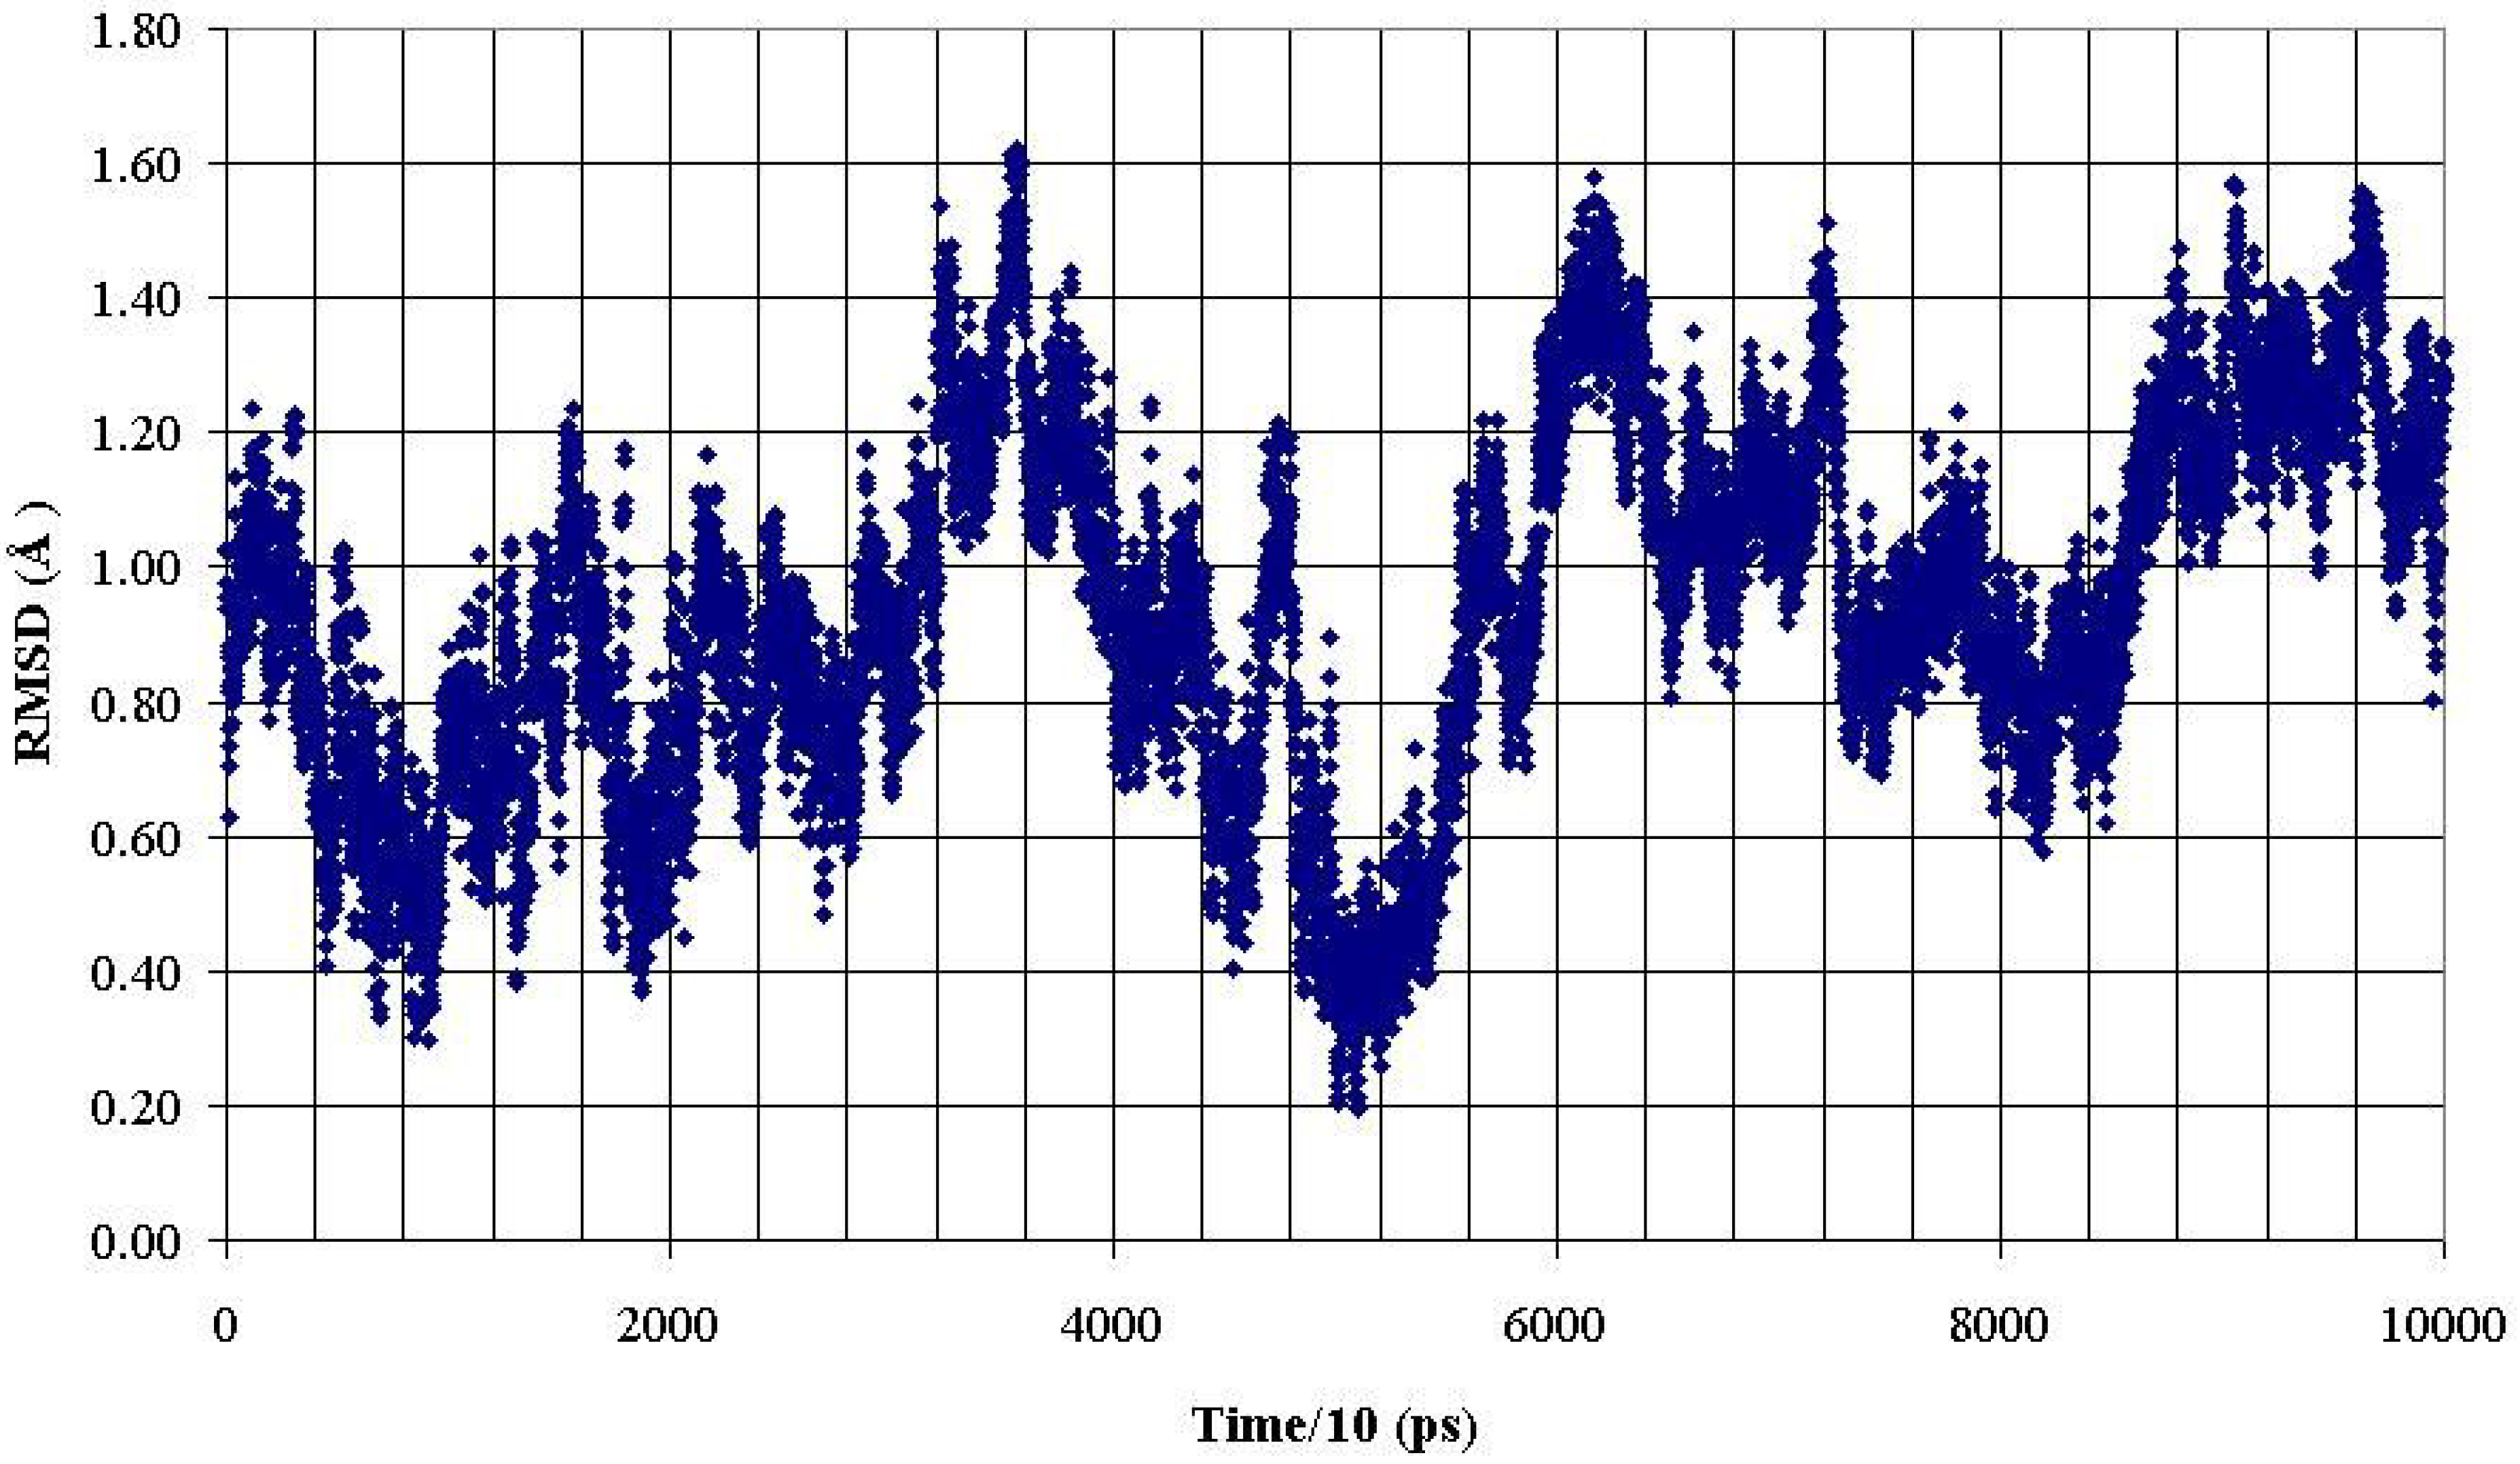
For the nonglycosylated peptide, the percentage of the MD-derived structures with RMSDs less than 1 Å was 26.9 %, while for the glycosylated peptides AHG21(T5) and AHG21(T17), this percentage was significantly larger: 52.5 % and 59.3 %, correspondingly (
Figure 6,
Figure 7 and
Figure 8).
Figure 6.
RMSD of backbone heavy atoms of the PDTRP fragment of the nonglycosylated peptide AHG21 during 1 ns MD simulation within reference at the crystal structure [
11].
Figure 6.
RMSD of backbone heavy atoms of the PDTRP fragment of the nonglycosylated peptide AHG21 during 1 ns MD simulation within reference at the crystal structure [
11].
Figure 7.
RMSD of backbone heavy atoms of the PDTRP fragment of the glycosylated peptide AHG21 (T5) during 1 ns MD simulation within reference at the crystal structure [
11].
Figure 7.
RMSD of backbone heavy atoms of the PDTRP fragment of the glycosylated peptide AHG21 (T5) during 1 ns MD simulation within reference at the crystal structure [
11].
Figure 8.
RMSD of backbone heavy atoms of the PDTRP fragment of the glycosylated peptide AHG21 (T17) during 1 ns MD simulation within reference at the crystal structure [
11].
Figure 8.
RMSD of backbone heavy atoms of the PDTRP fragment of the glycosylated peptide AHG21 (T17) during 1 ns MD simulation within reference at the crystal structure [
11].
These data demonstrated that O-glycosylation at the Thr5 or Thr17 positions promoted backbone conformations of the PDTRP fragment that were consistent with the structural features of the peptides presented by MHC. This observation can be used for developing antigenic glycopeptides as potential antitumor vaccines.


