Article

From Metal Cluster to Metal Nanowire: A Topological Analysis of Electron Density and Band Structure Calculation

1
National Center For High-Performance Computing, Hsinchu, Taiwan, ROC
2
Department of Chemistry, National Taiwan University, Taipei, Taiwan 106, ROC
*
Authors to whom correspondence should be addressed.
Int. J. Mol. Sci. 2002, 3(1), 38-55; https://doi.org/10.3390/i3010038
Submission received: 19 September 2001 / Accepted: 28 January 2002 / Published: 31 January 2002
(This article belongs to the Special Issue From Nanoclusters to Proteins)

Abstract

:
We investigate a theoretical model of molecular metalwire constructed from linear polynuclear metal complexes. In particular we study the linear Crn metal complex and Cr molecular metalwire. The electron density distributions of the model nanowire and the linear Crn metal complexes, with n = 3, 5, and 7, are calculated by employing CRYSTAL98 package with topological analysis. The preliminary results indicate that the bonding types between any two neighboring Cr are all the same, namely the polarized open-shell interaction. The pattern of electron density distribution in metal complexes resembles that of the model Cr nanowire as the number of metal ions increases. The conductivity of the model Cr nanowire is also tested by performing the band structure calculation.

I. Introduction

The abilities to produce, manipulate and to study nanometer scale structures developed immensely over years have opened up the possibilities for the design and construction of molecular-scale equivalents of solid-state devices [1,2,3]. Among those nanostructures, the metallic lines connecting active devices on a chip have been recognized to play a decisive role in determining the functionality and reliability of future integrated circuit industry [1]. Single-wall nanotubes have been considered to be ideal conducting nanowires due to their high yields [4], structural uniformity and metallic properties of particular varieties of the highly symmetric structures [5]. Still much effort has been devoted to construct metallic connection in molecular scale. With the rapidly advanced fabrication technology, metallic nanowires have been created by mechanically breaking a fine metal wire [6], by separating a tip and a flat substrate [7,8,9], or two macroscopic electrodes in contact [10], by anodizing Al nanowires with an atomic force microscope [11], and by electrochemical deposition [12,13]. All the methods mentioned above have difficulties in maintaining the uniformity in both the detailed atomic scale size and structure of the nanowires. Recently, a novel linear structure of organometallic complexes [Mnn-peptea)4Cl2], where peptea is an abbreviation for pentapyridyltetramine and M represents metal atom and n indicates the number of the metal ions, has been successfully synthesized and crystallized for various numbers of metal ions with a defined length by several research groups [14,15,16,17]. We refer this particular type of linear organometallic complexes as LOM complexes from now on.
There are several properties of the LOM complexes worth close to be attended. Firstly, the structure of the LOM complexes maintains almost the same regardless the types or number of metal ions [14]. Secondly, the metal-metal distance also remains almost the same no matter the types or number of metal ions [16]. Thirdly, the organic ligands of the LOM complexes surround the central metal ions in a form of helix structure, which increases the overall structural stability (see Fig. 1 for example) [14]. Finally, the number of the central metal ions and structure of the LOM complexes can be controlled precisely through experimental means. For example, the Cr LOM complexes with various numbers of metal ions from 3, 4, 5, 7, up to 9 [15,16,17,18,19] have been synthesized successfully. With the above-mentioned features, the LOM complexes can serve as potential metallic connections between nanodevices provided that the metal ions possess metallic behavior with high conductivity. In order to fulfill this potential, it is important to examine the electronic properties of the LOM complexes with various lengths of metal chains and to construct hypothetic infinite LOM (HILOM) nanowires from such LOM complexes. 
The organization of this paper is as follows: We describe the model construction of the Cr LOM complexes and the Cr HILOM nanowire in Sec. II., and briefly review some features of the topological analysis method in Sec. III.. Including Laplacian distributions and deformation density maps, results of CRYSTAL98 and topological analysis of electron density and Laplacian are presented in Sec IV, in which we also compare the patterns of the electron density of the Cr atoms in the LOM complexes and those found in the HILOM nanowire. We also calculate the band structure of the Cr HILOM nanowire in Sec. IV.
Figure 1. Crystal structure of [Cr99-(peptea) 4Cl2)(C2H4Cl2) 10 [19]. Ligands are drawn in different colors to show the helix structure around the metal chain (in azure).
Ijms 03 00038 g001

II. Modeling Structure

Cr33-dpa)4Cl2, simplified as Cr3 from now on, is taken out from crystal unit cell of Cr3C44H42N12Cl2O, in P21/c space group [18].  In order to facilitate the computation, the space group of the model unit cell is set as P422 (by increasing the symmetry of Cr3 with a tolerance window as 0.05 Å). The cell dimensions are 20 and 15 Å for a and c respectively. The model structure of the Cr3 LOM complex and its asymmetric unit with the atomic labeling are shown in Fig. 2. The fractional coordinates of the asymmetric unit in Cr3 structure are listed in Table 1.
Figure 2. The modeling structure of Cr33-dpa)4Cl2. (a) is the complete structure and (b)is its corresponding asymmetric unit with labeling.
Ijms 03 00038 g002
Table 1. Fractional coordinates of the asymmetric unit in Cr3 structure
XYZ
Cr(1)0.500000.500000.50000
Cr(2)0.500000.500000.65704
Cl0.500000.500000.82880
N(1)0.398550.500000.50000
N(2)0.400970.536940.64496
C(1)0.366030.531560.56714
C(2)0.303200.560650.55925
C(3)0.276570.596590.63074
C(4)0.312130.600880.70924
C(5)0.373570.571250.71331
H(1)0.279780.560650.50578
H(2)0.234670.616480.62616
H(3)0.294700.623400.75825
H(4)0.397830.574900.76597
The modeling unit cells of Cr55-tpda)4Cl2 and Cr77-teptra)4Cl2, which are simplified as Cr5 [17] and Cr7 [15] respectively, are generated with a similar procedure as that for Cr3 case. In the light of D4 symmetry of the LOM complexes, the Cr HILOM nanowire model, can be constructed from the crystal structure of [Cr99-peptea)4Cl2] [19], with [Cr44-dpda)4]n as the repeat unit, where dpda is dipyridyldiamido moiety. The direction of the Cr HILOM nanowire, further simplified as Cr∞;, is set along c axis.  The unit cell information of all the models is summed up in Table 2 and their corresponding asymmetric unit labelings are shown in Figure 3.
Table 2. Unit cell information of the modeling structures
ModelSpace groupa axis (Å)c axis (Å)Atoms in cell
Cr3P422201589
Cr5P4222020131
Cr7P4222025173
CrP422208.926384
Figure 3. Labels of asymmetric unit. (a) is for Cr3; (b) is for Cr5; (c) is for Cr7; and (d) is for Cr.
Ijms 03 00038 g003

III. The Topological Analysis of the Electronic Density

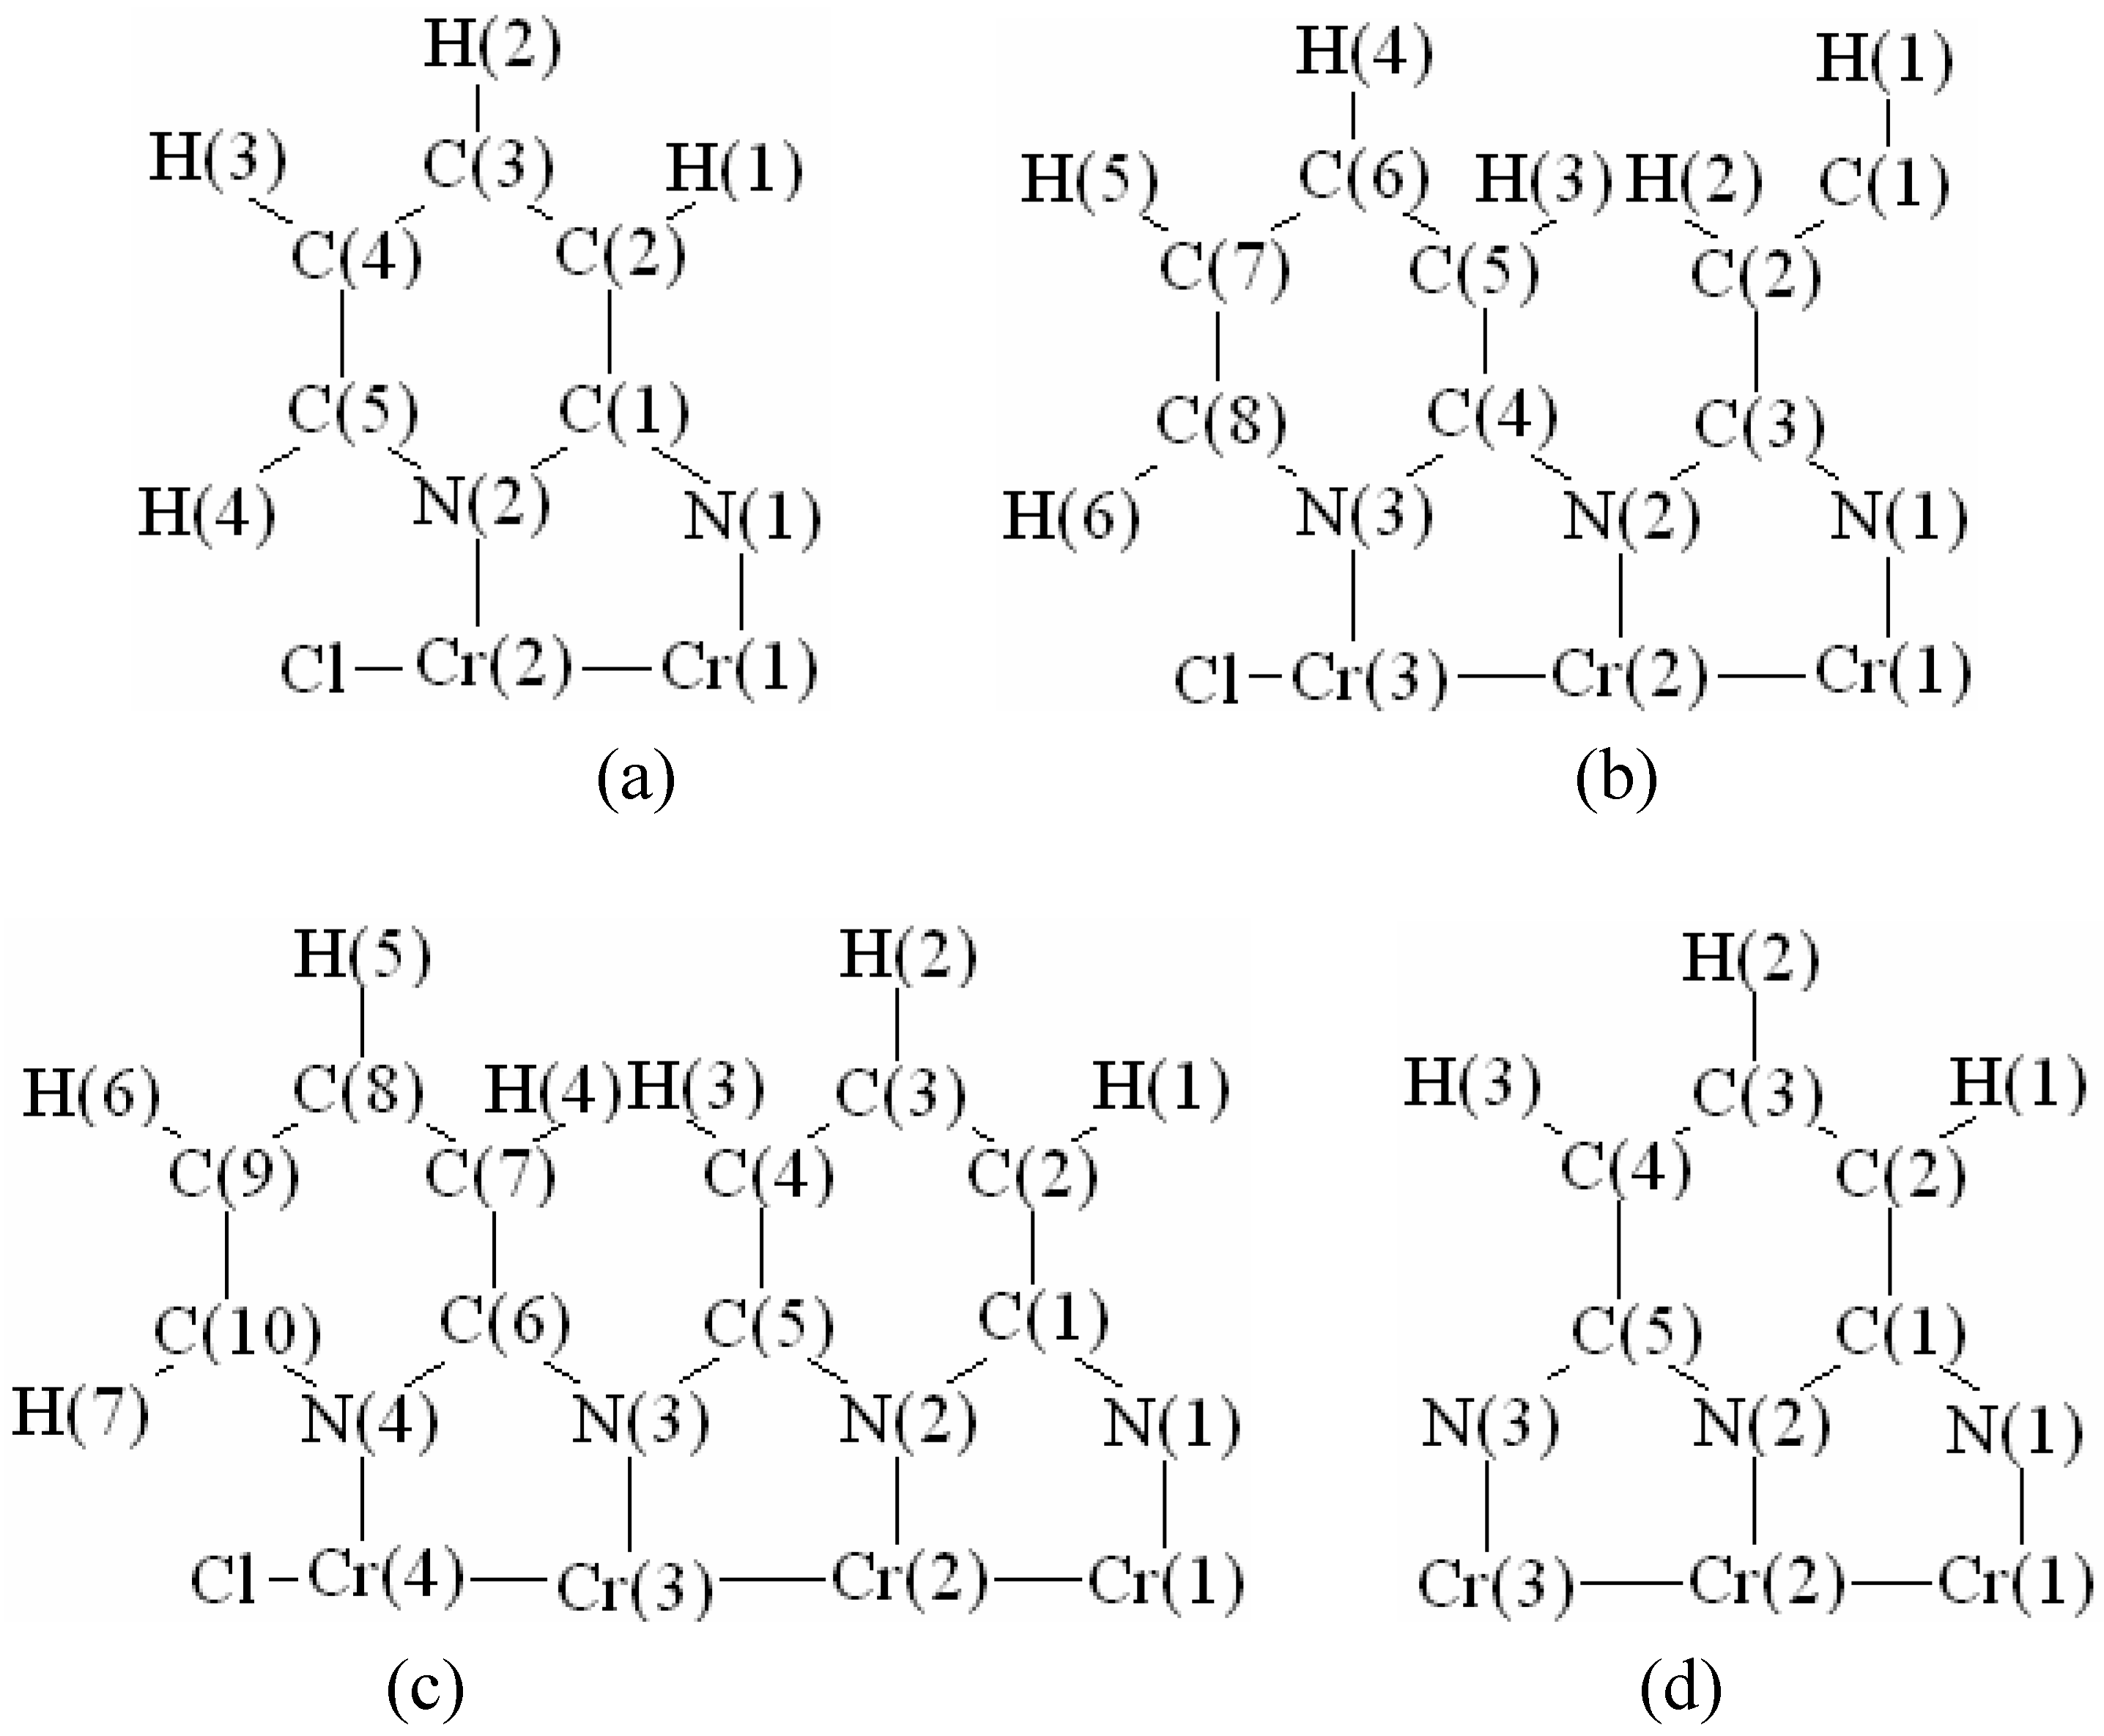
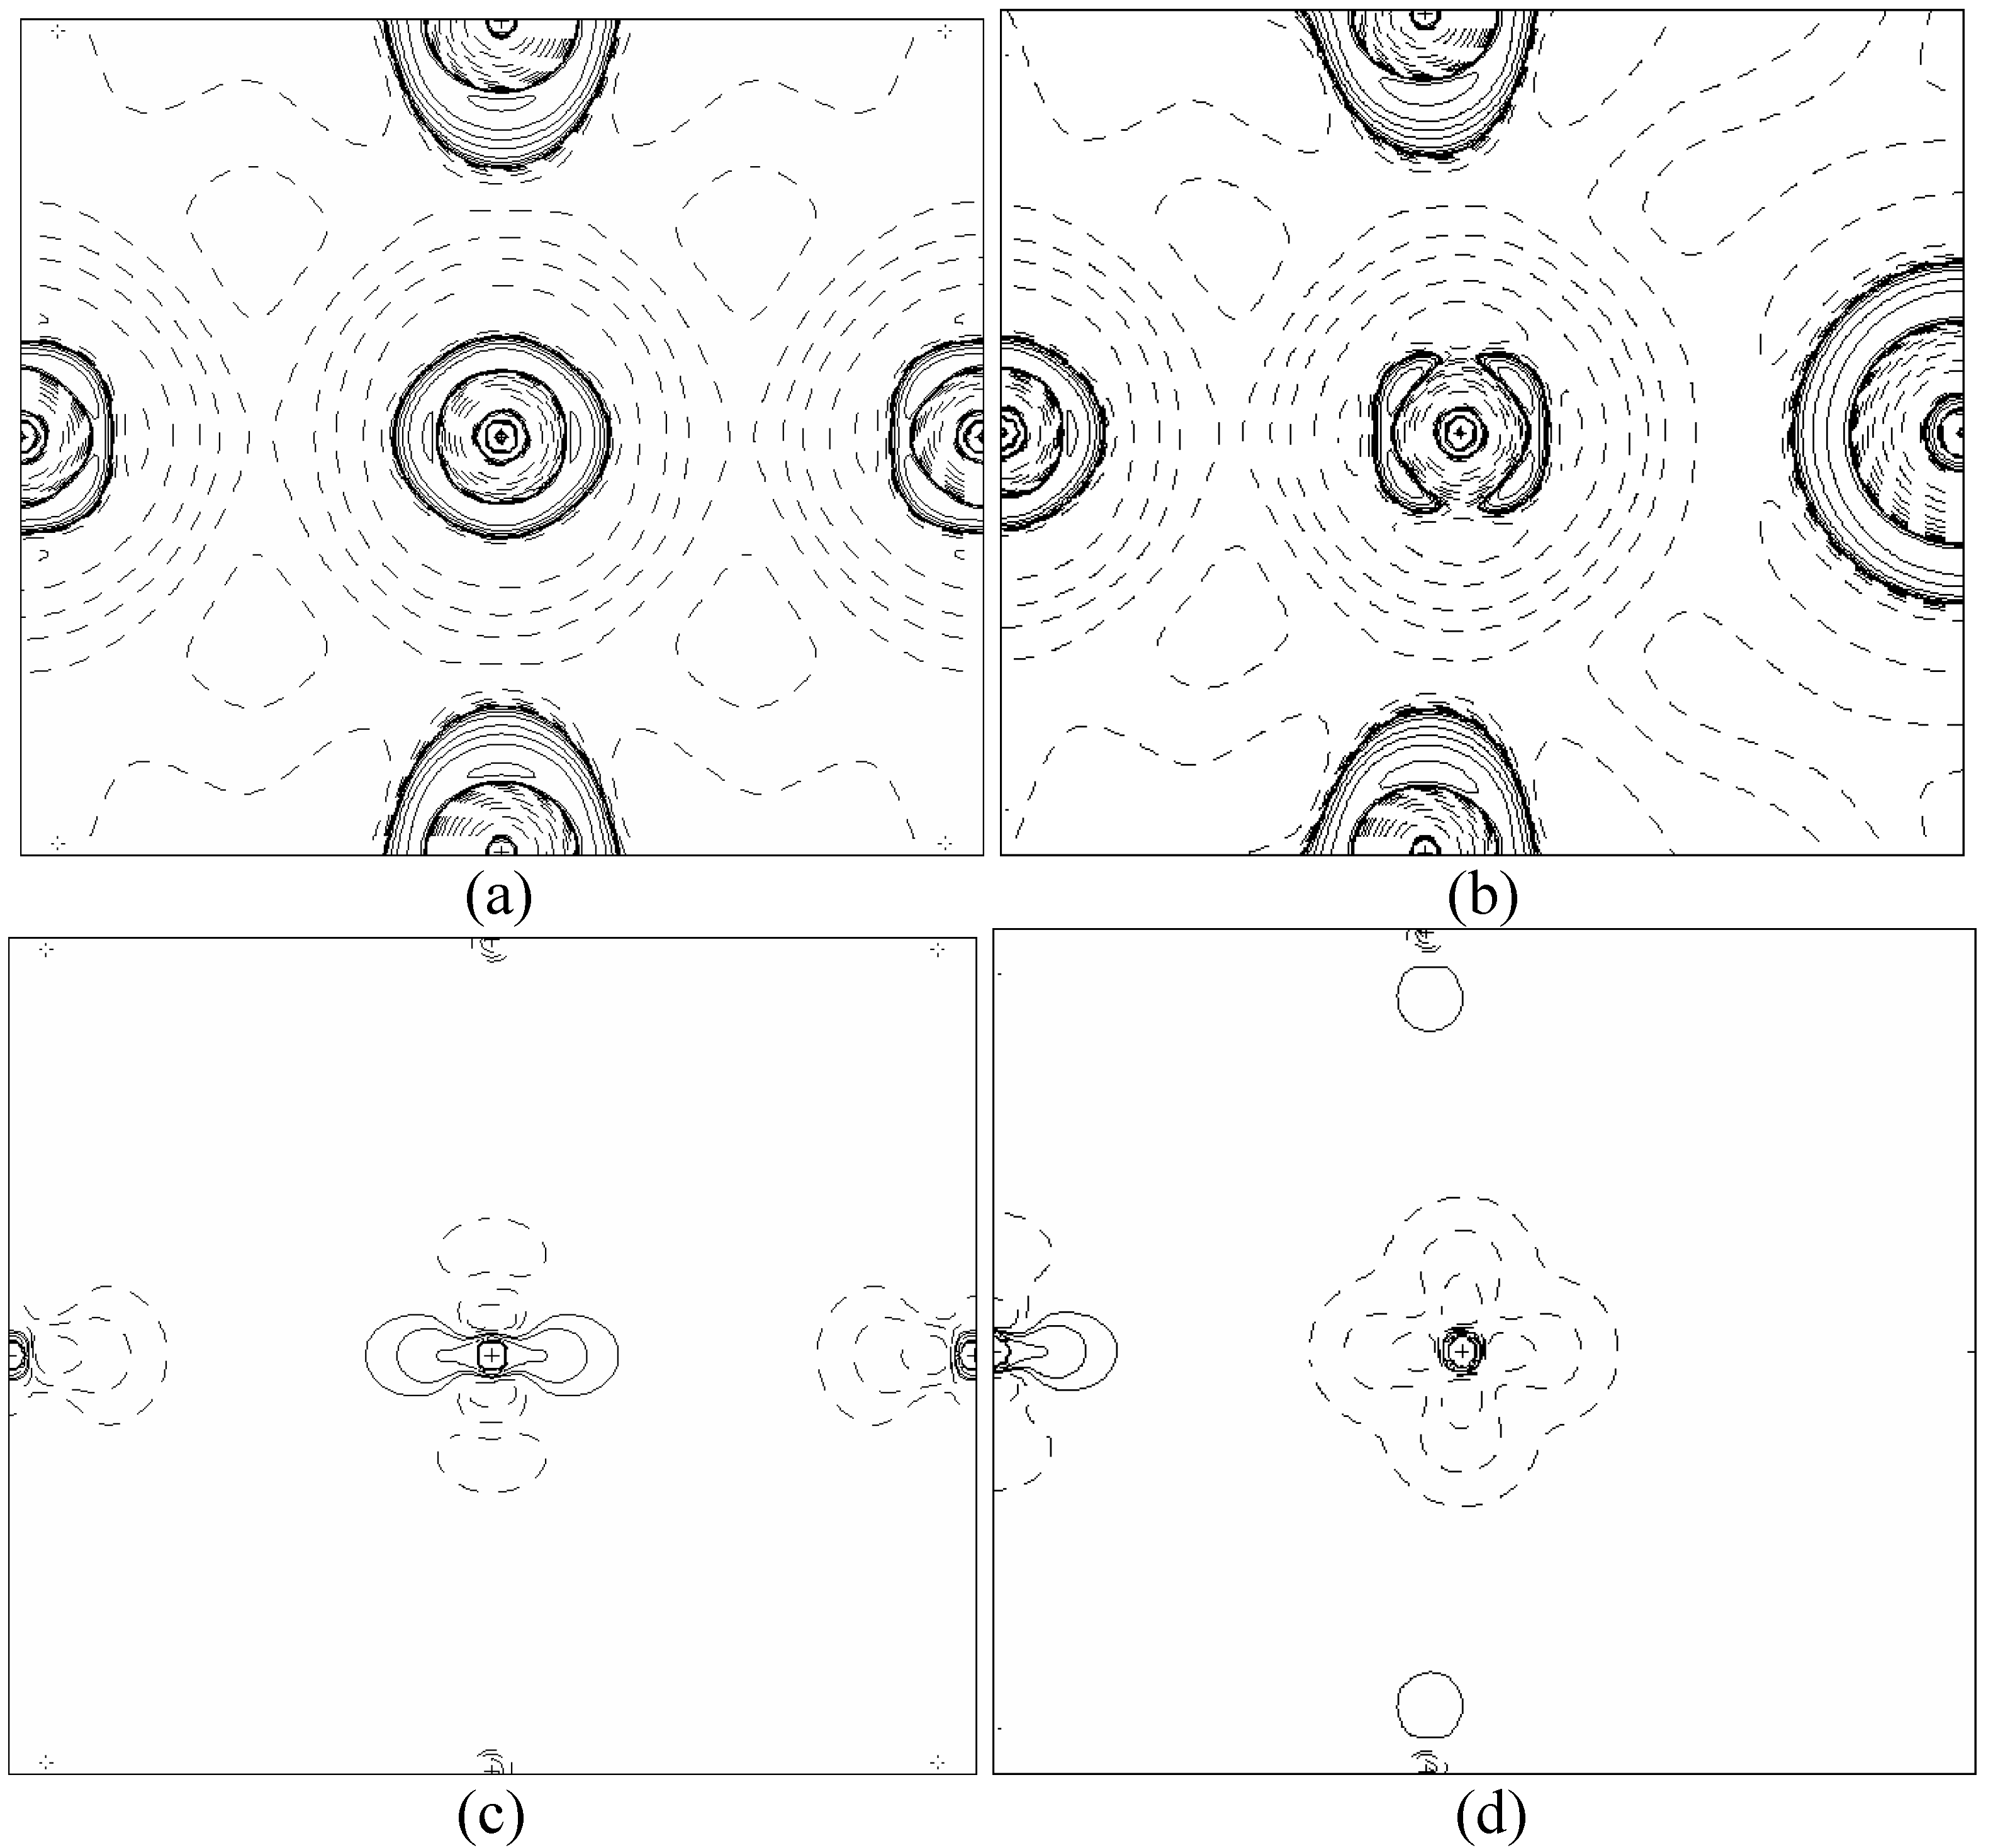
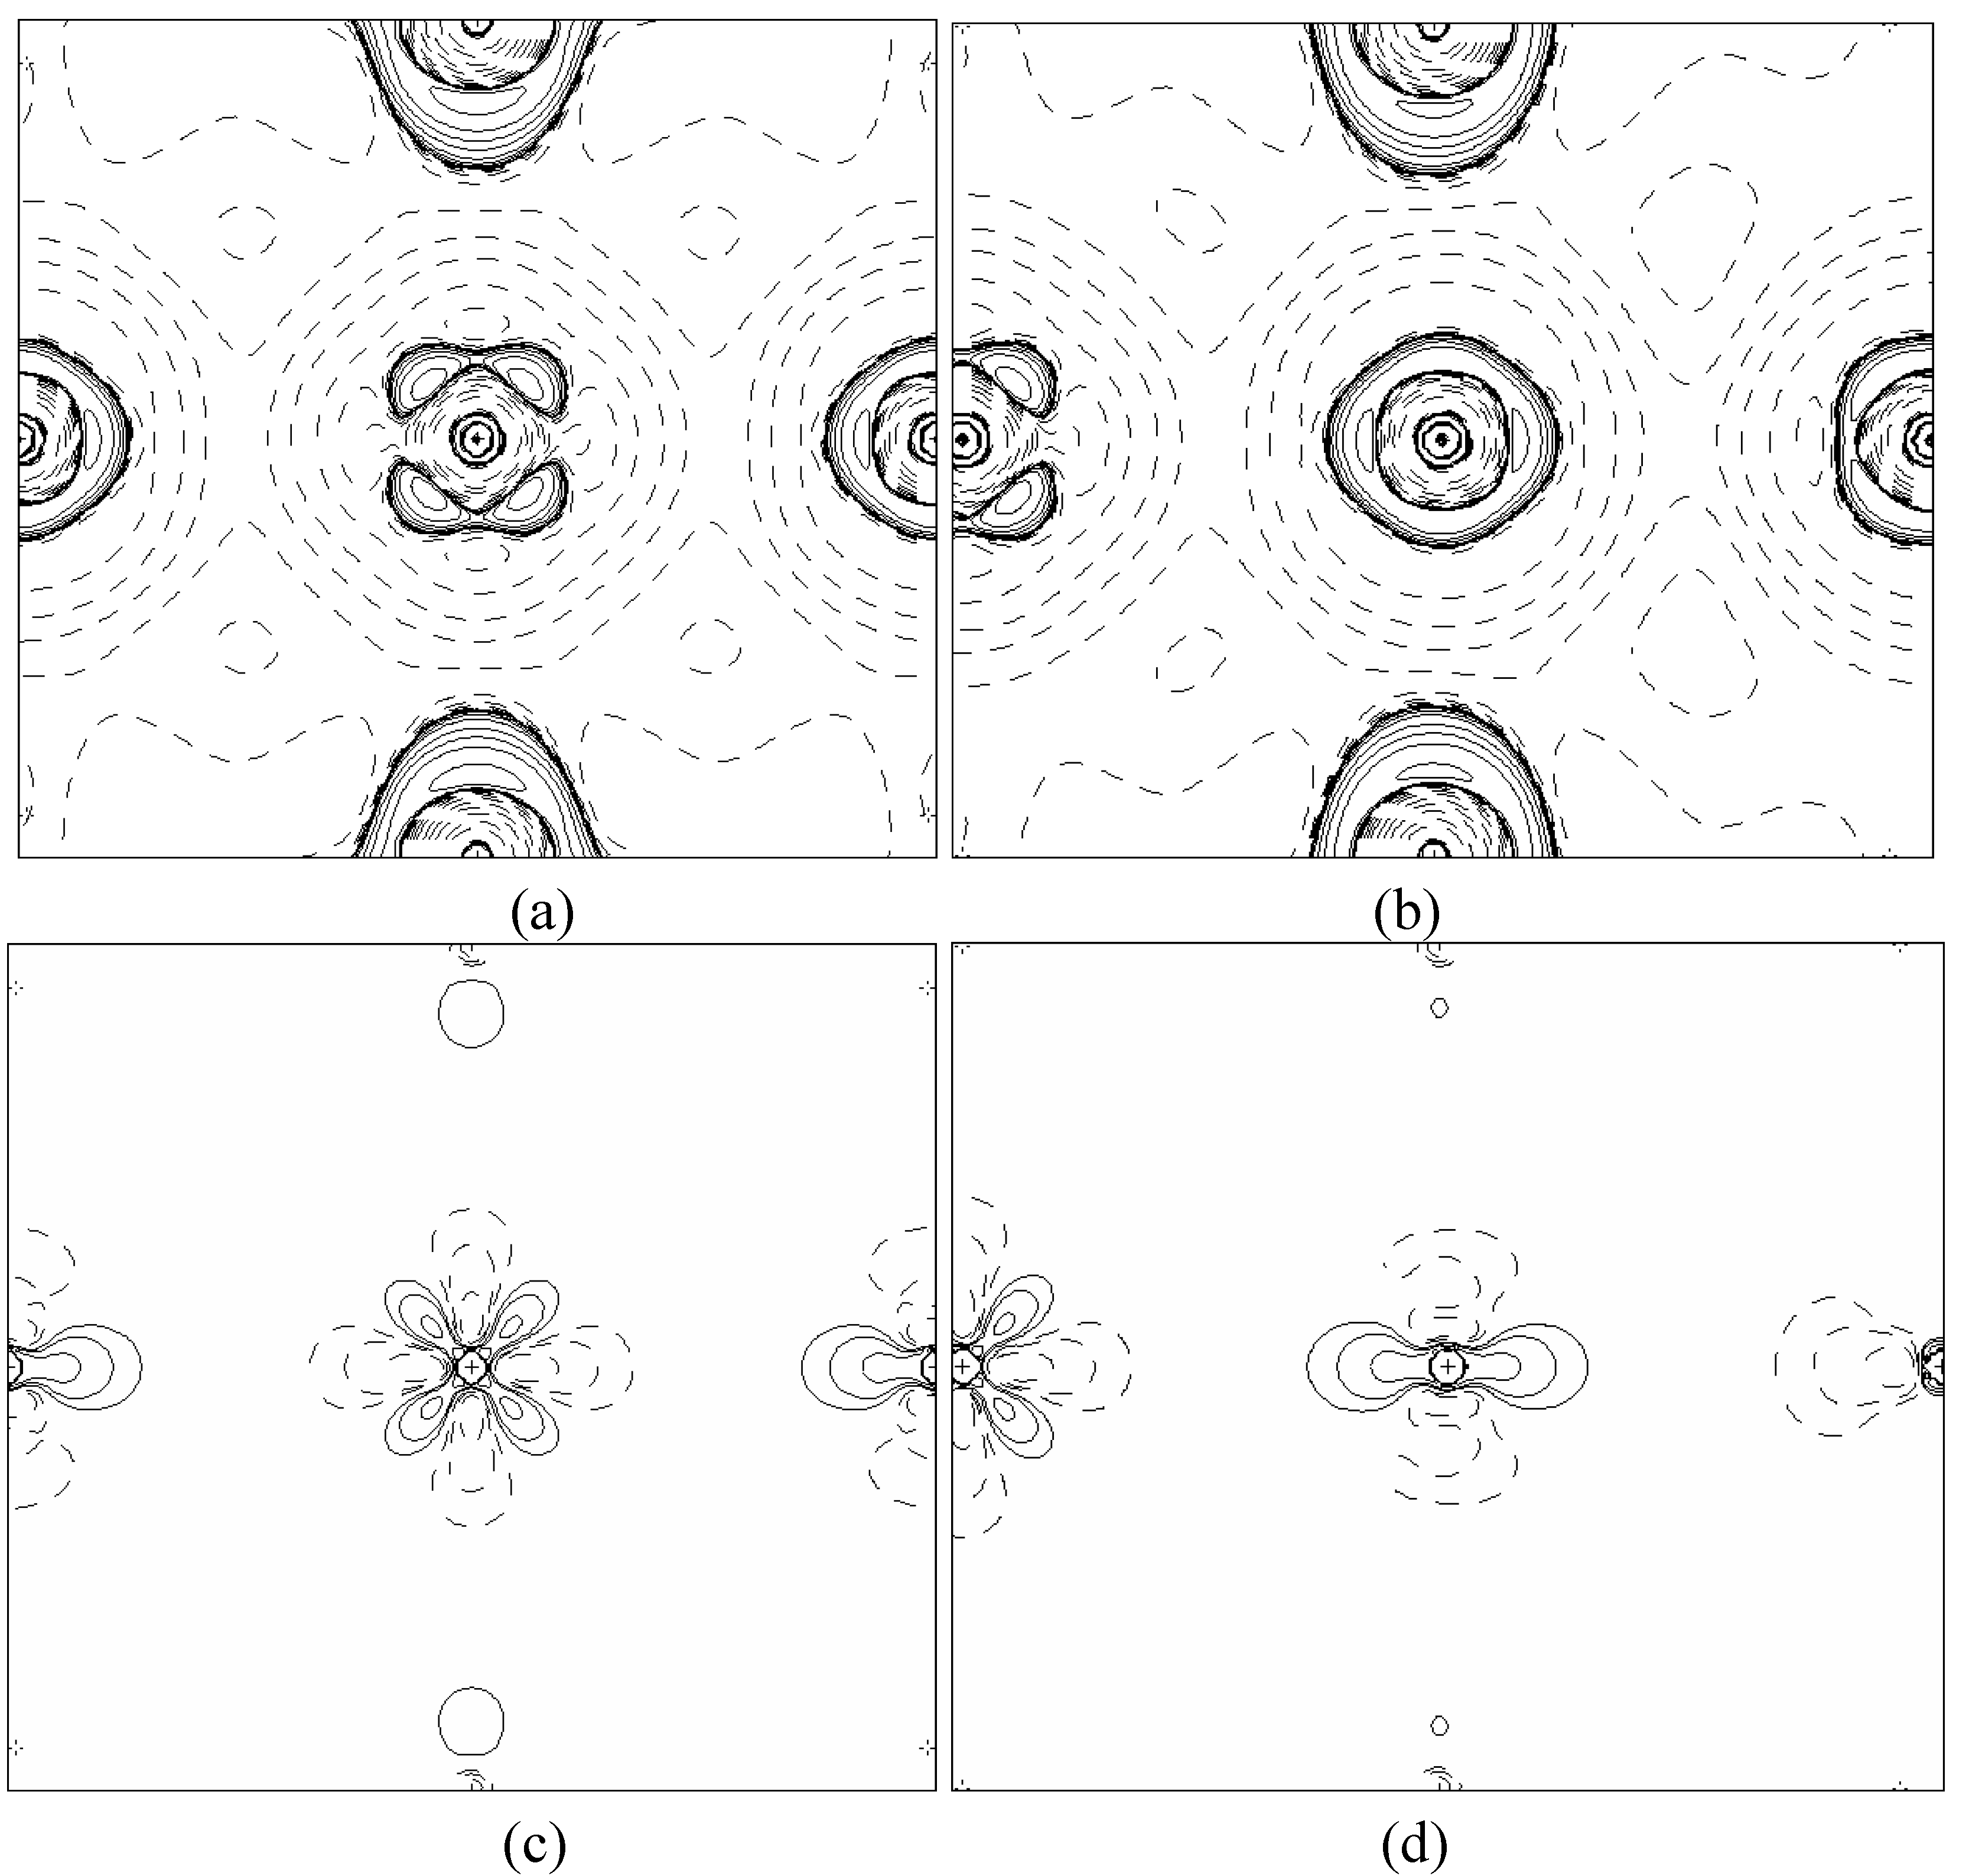
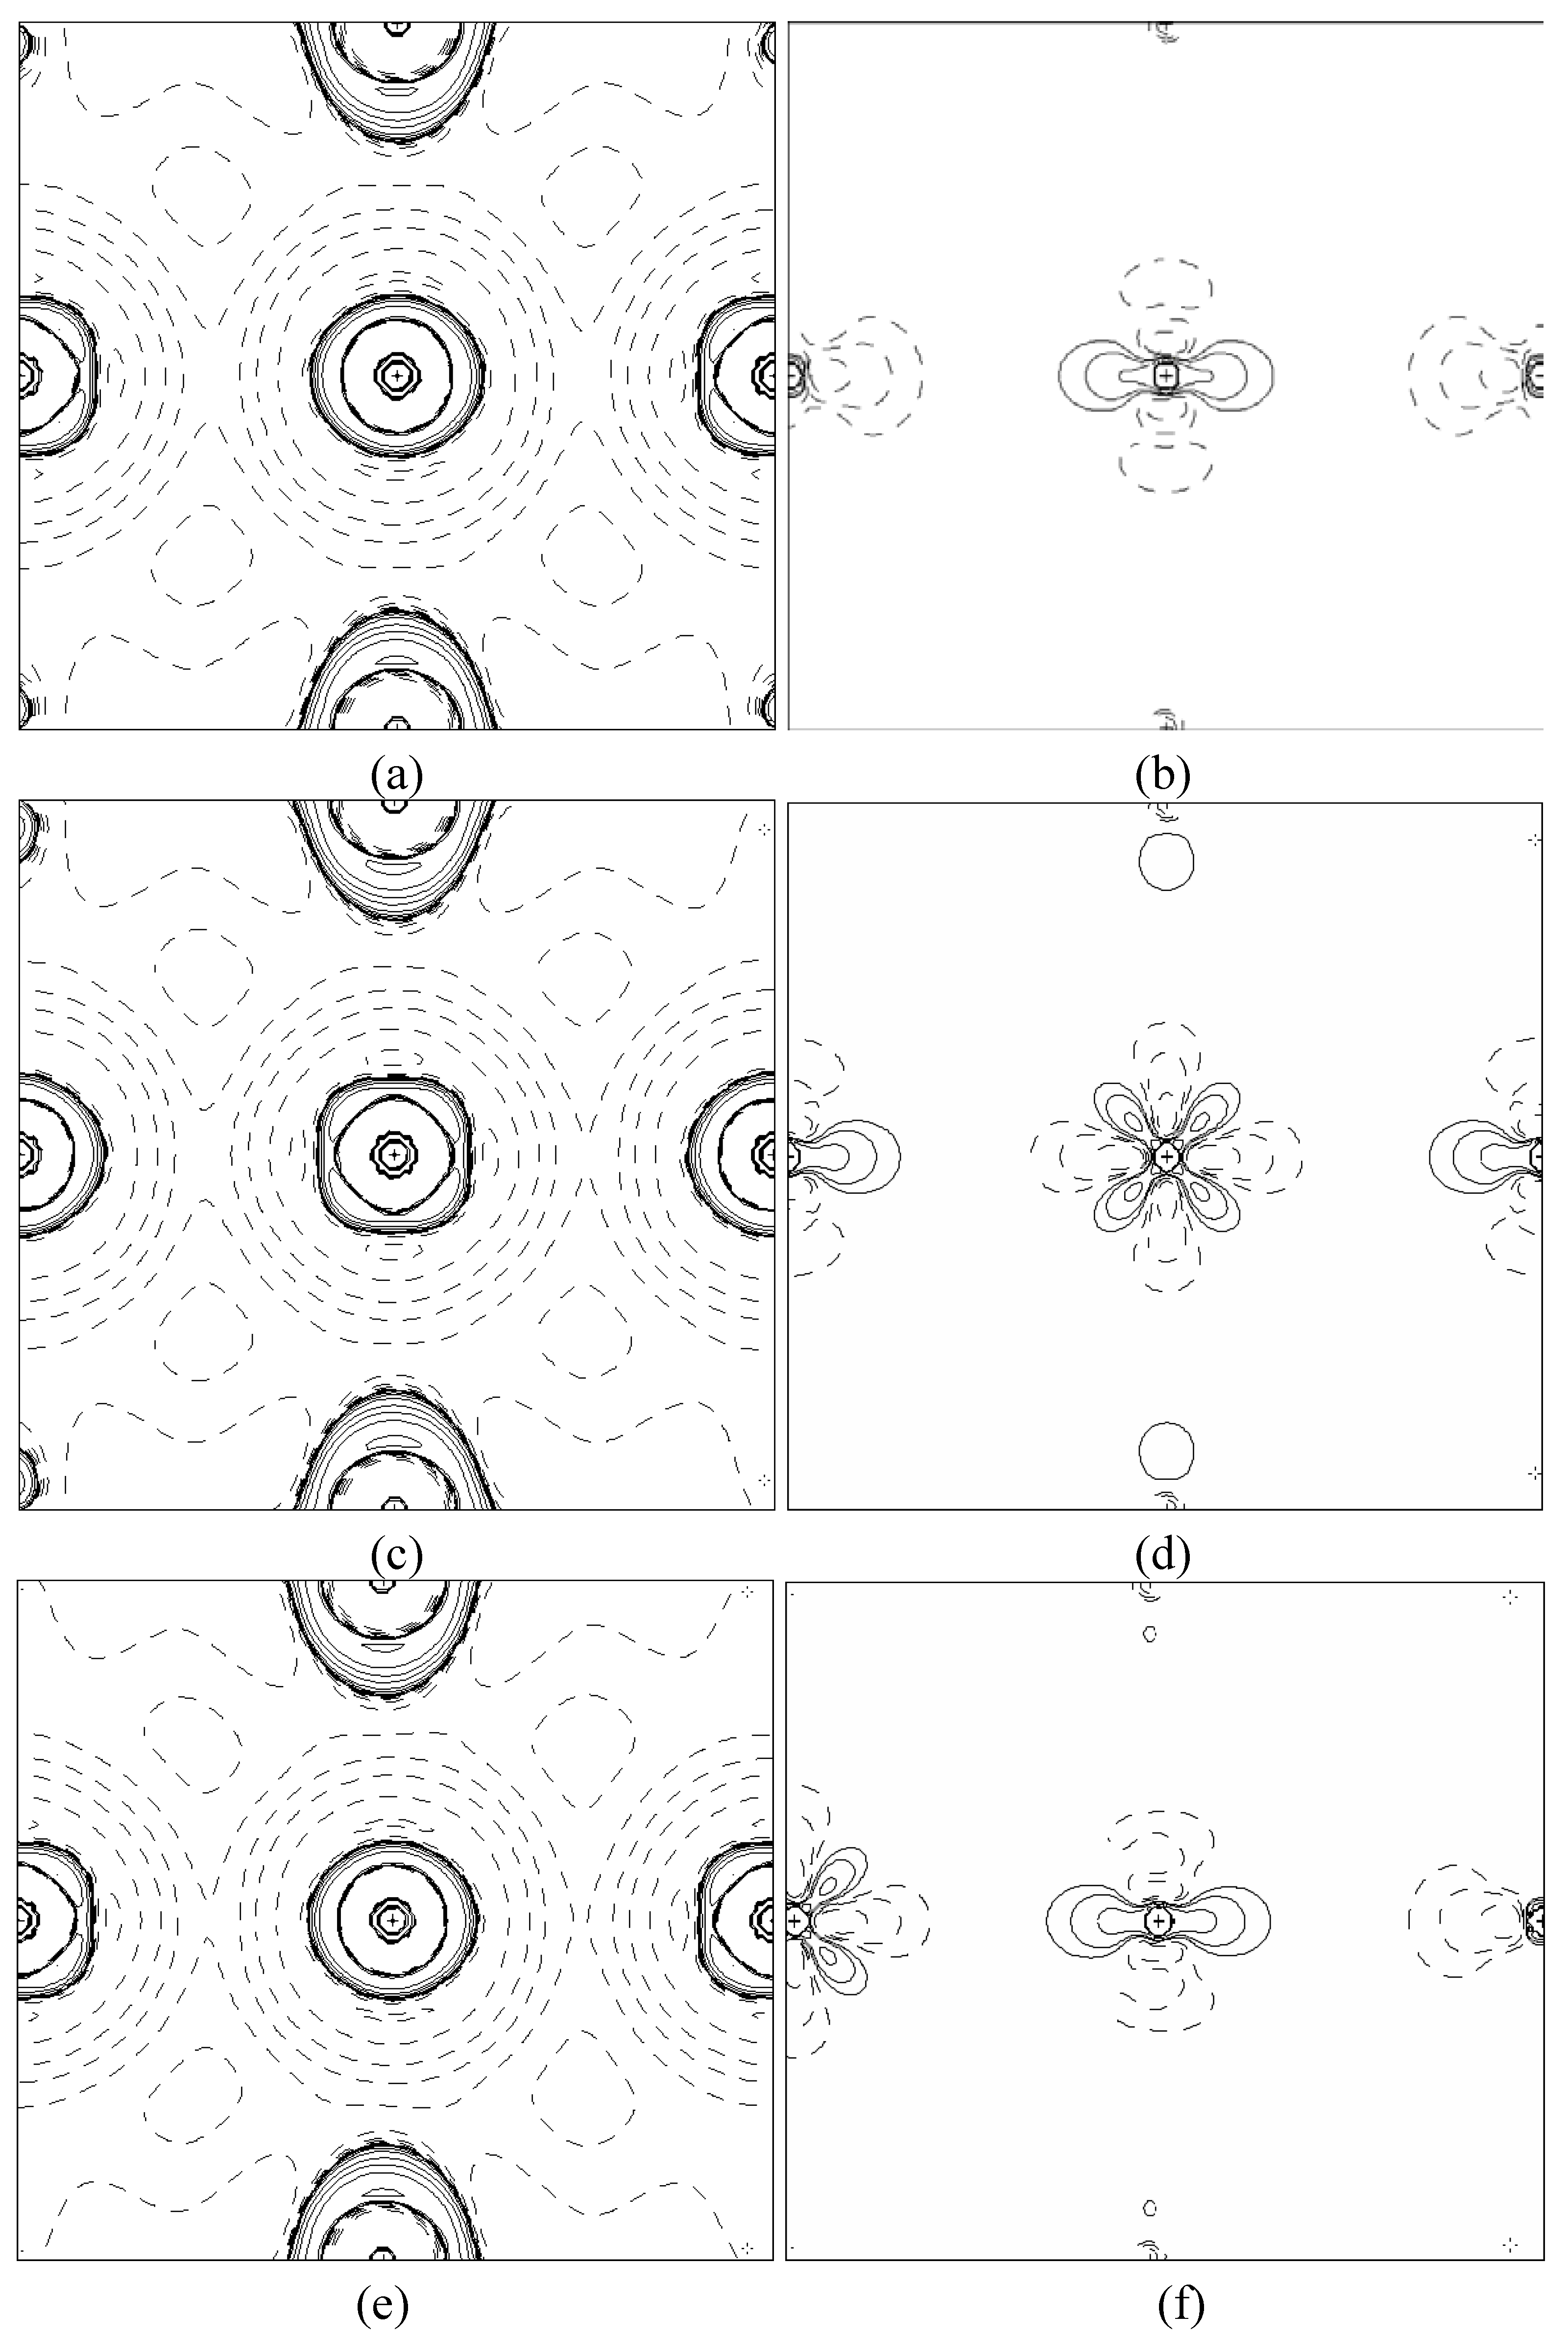
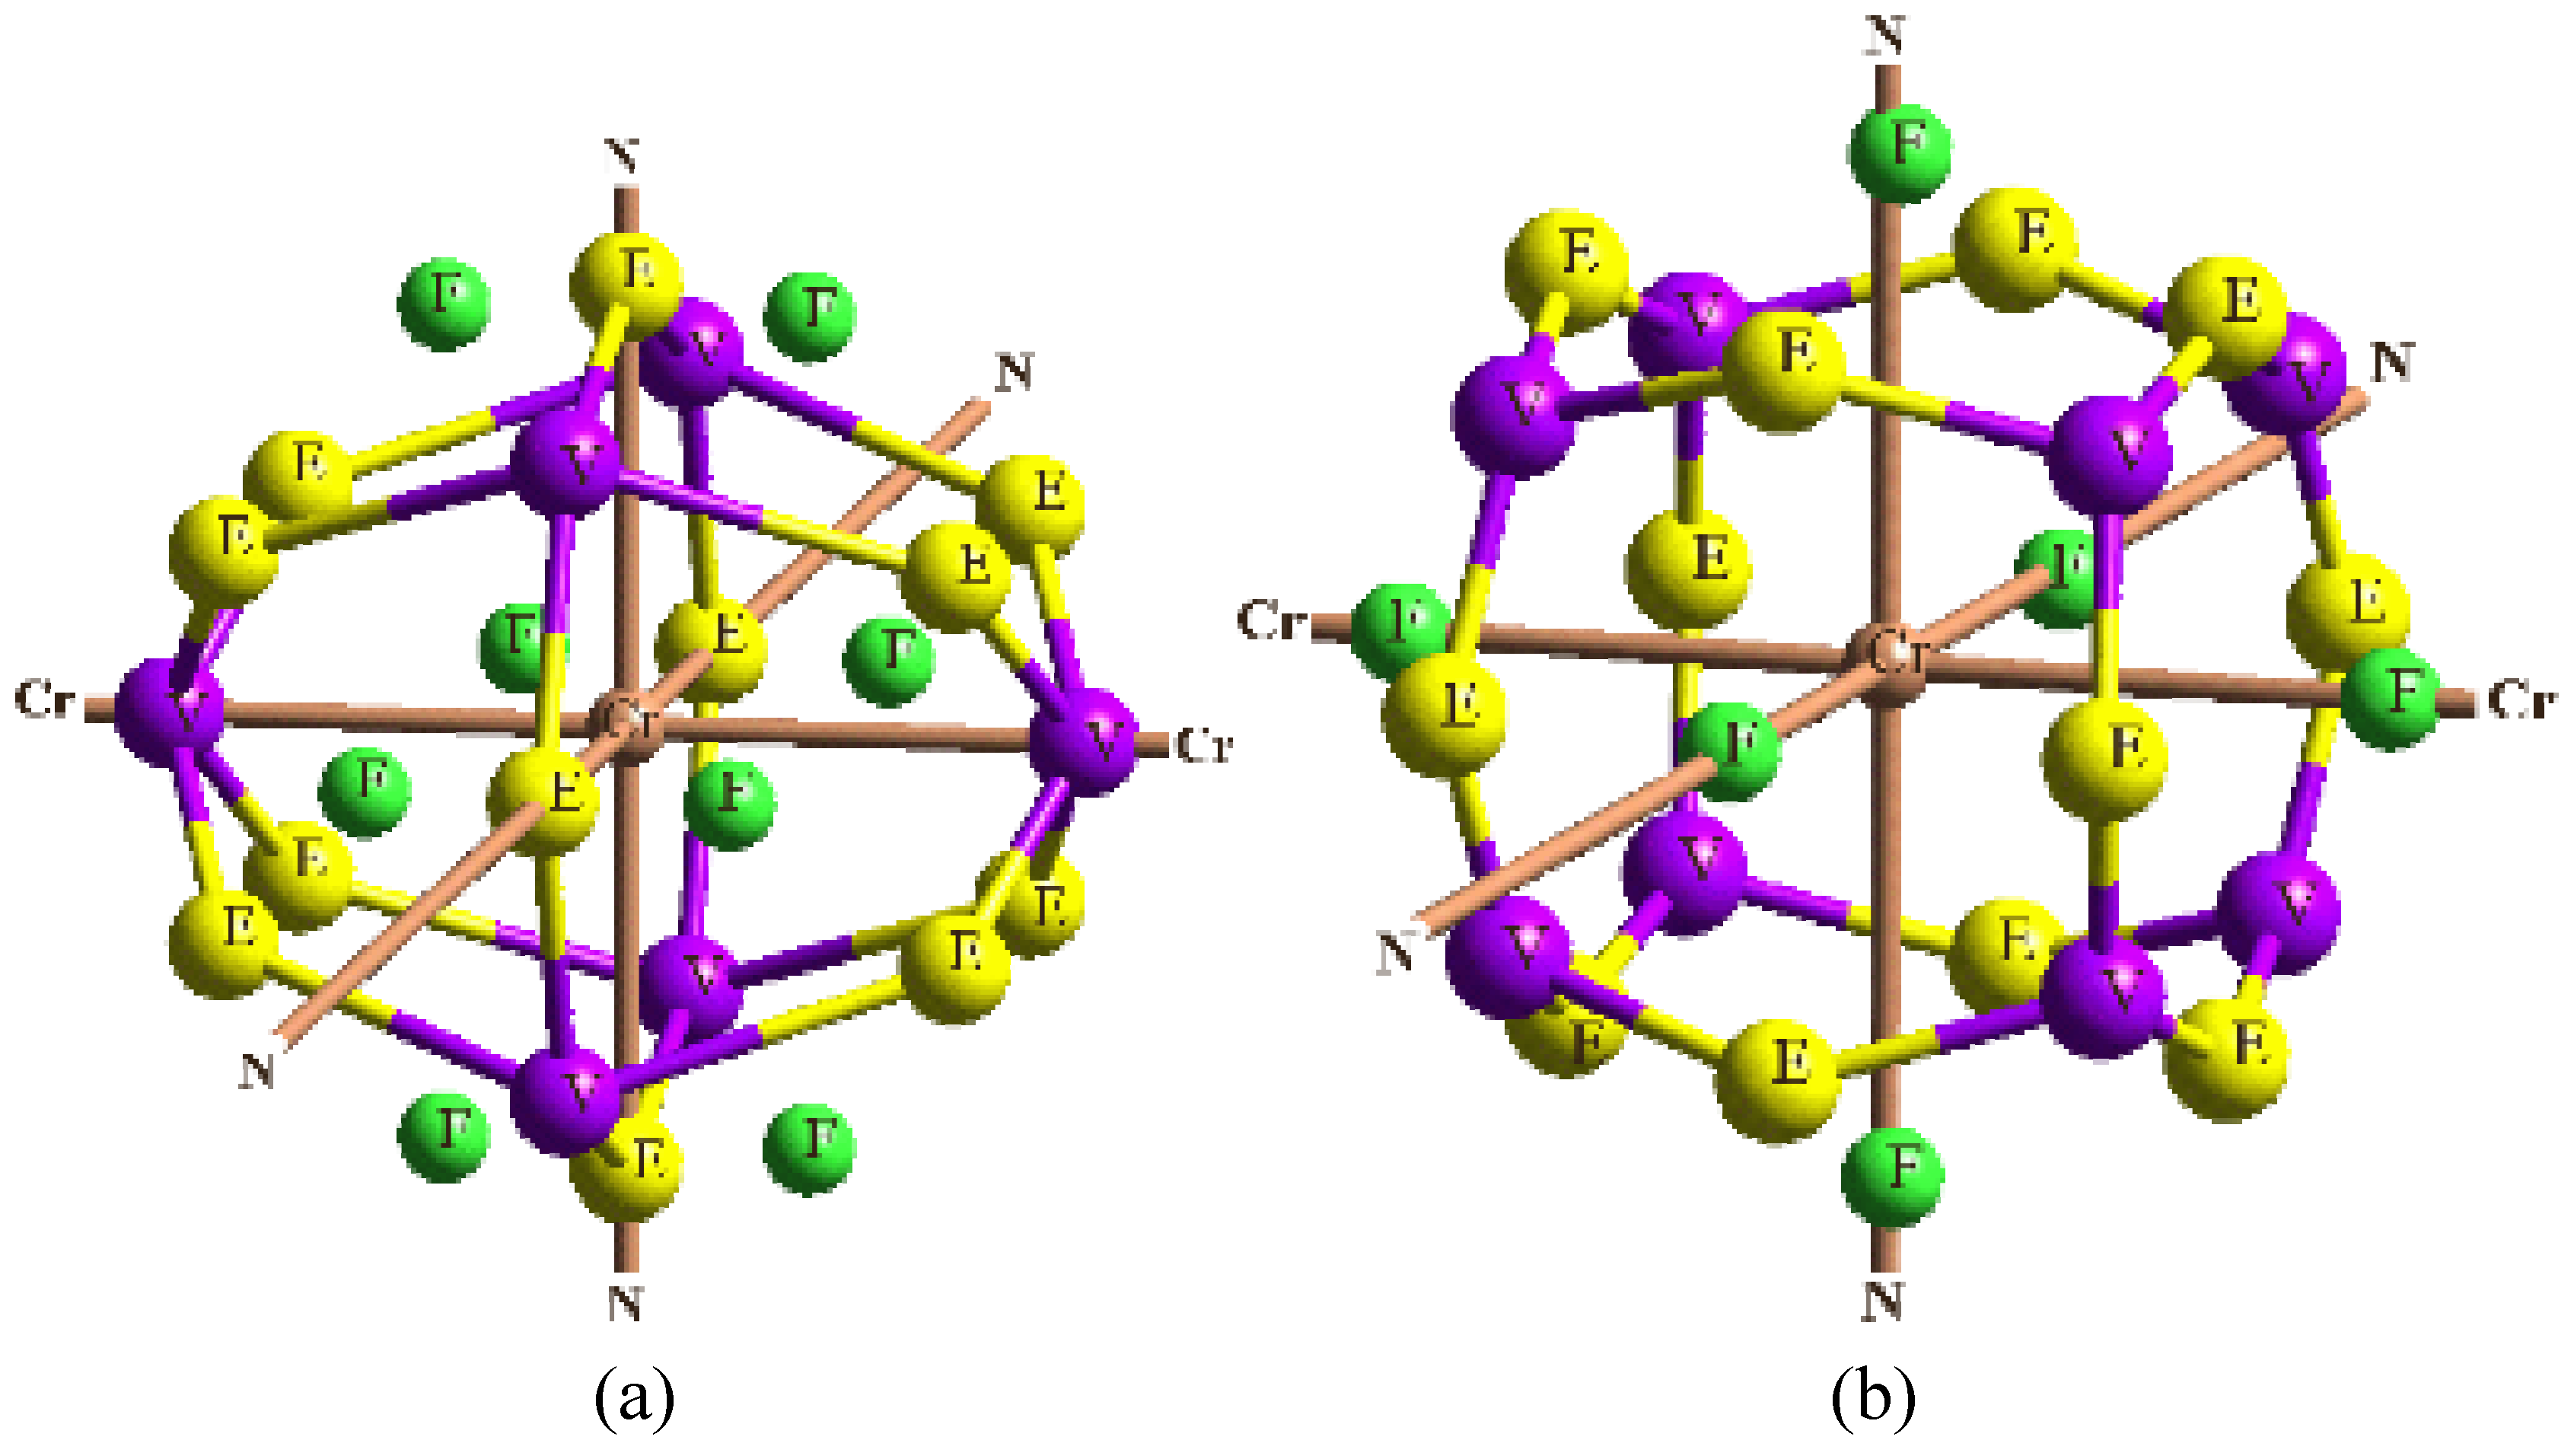
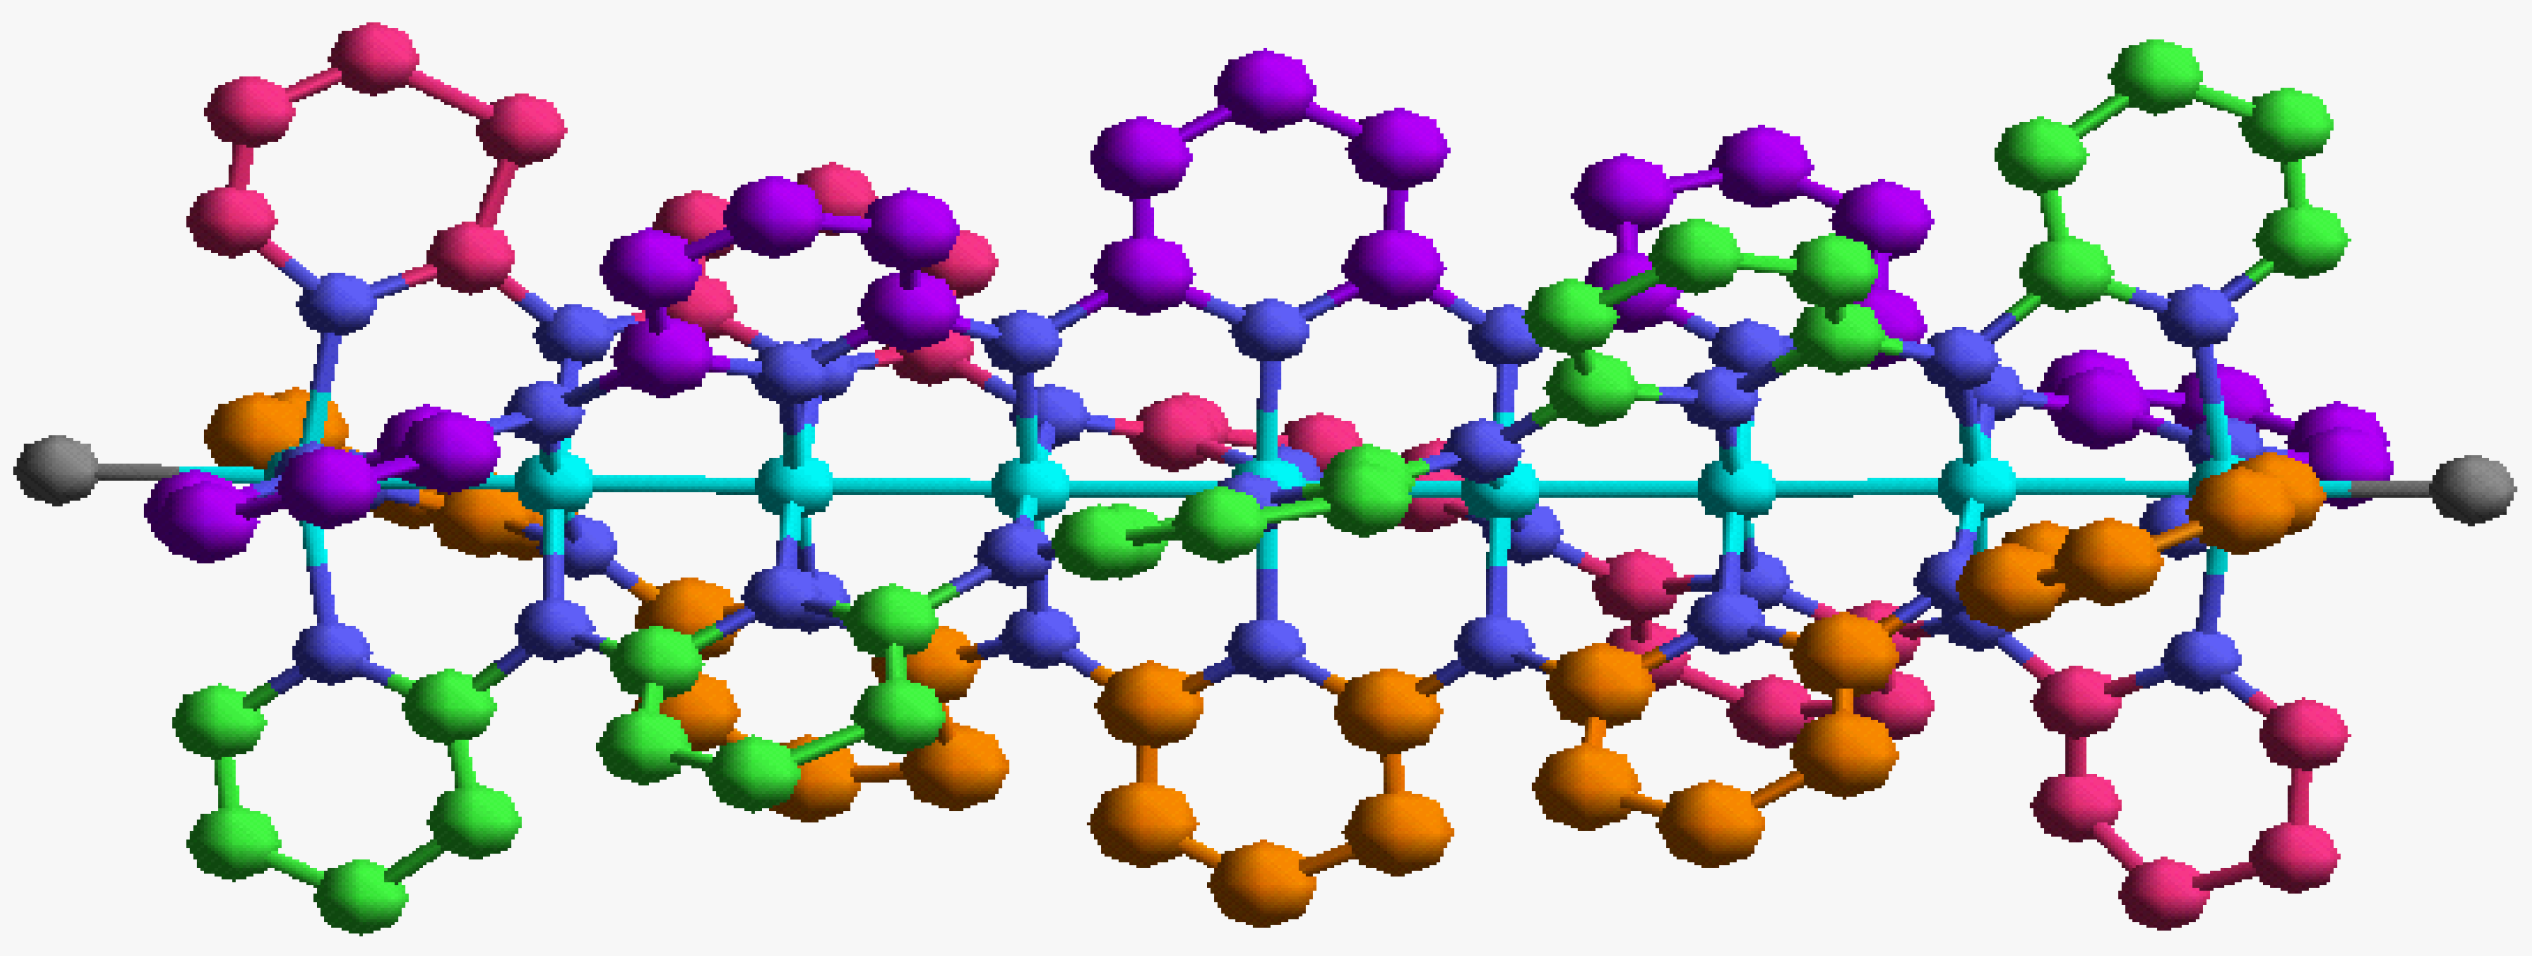
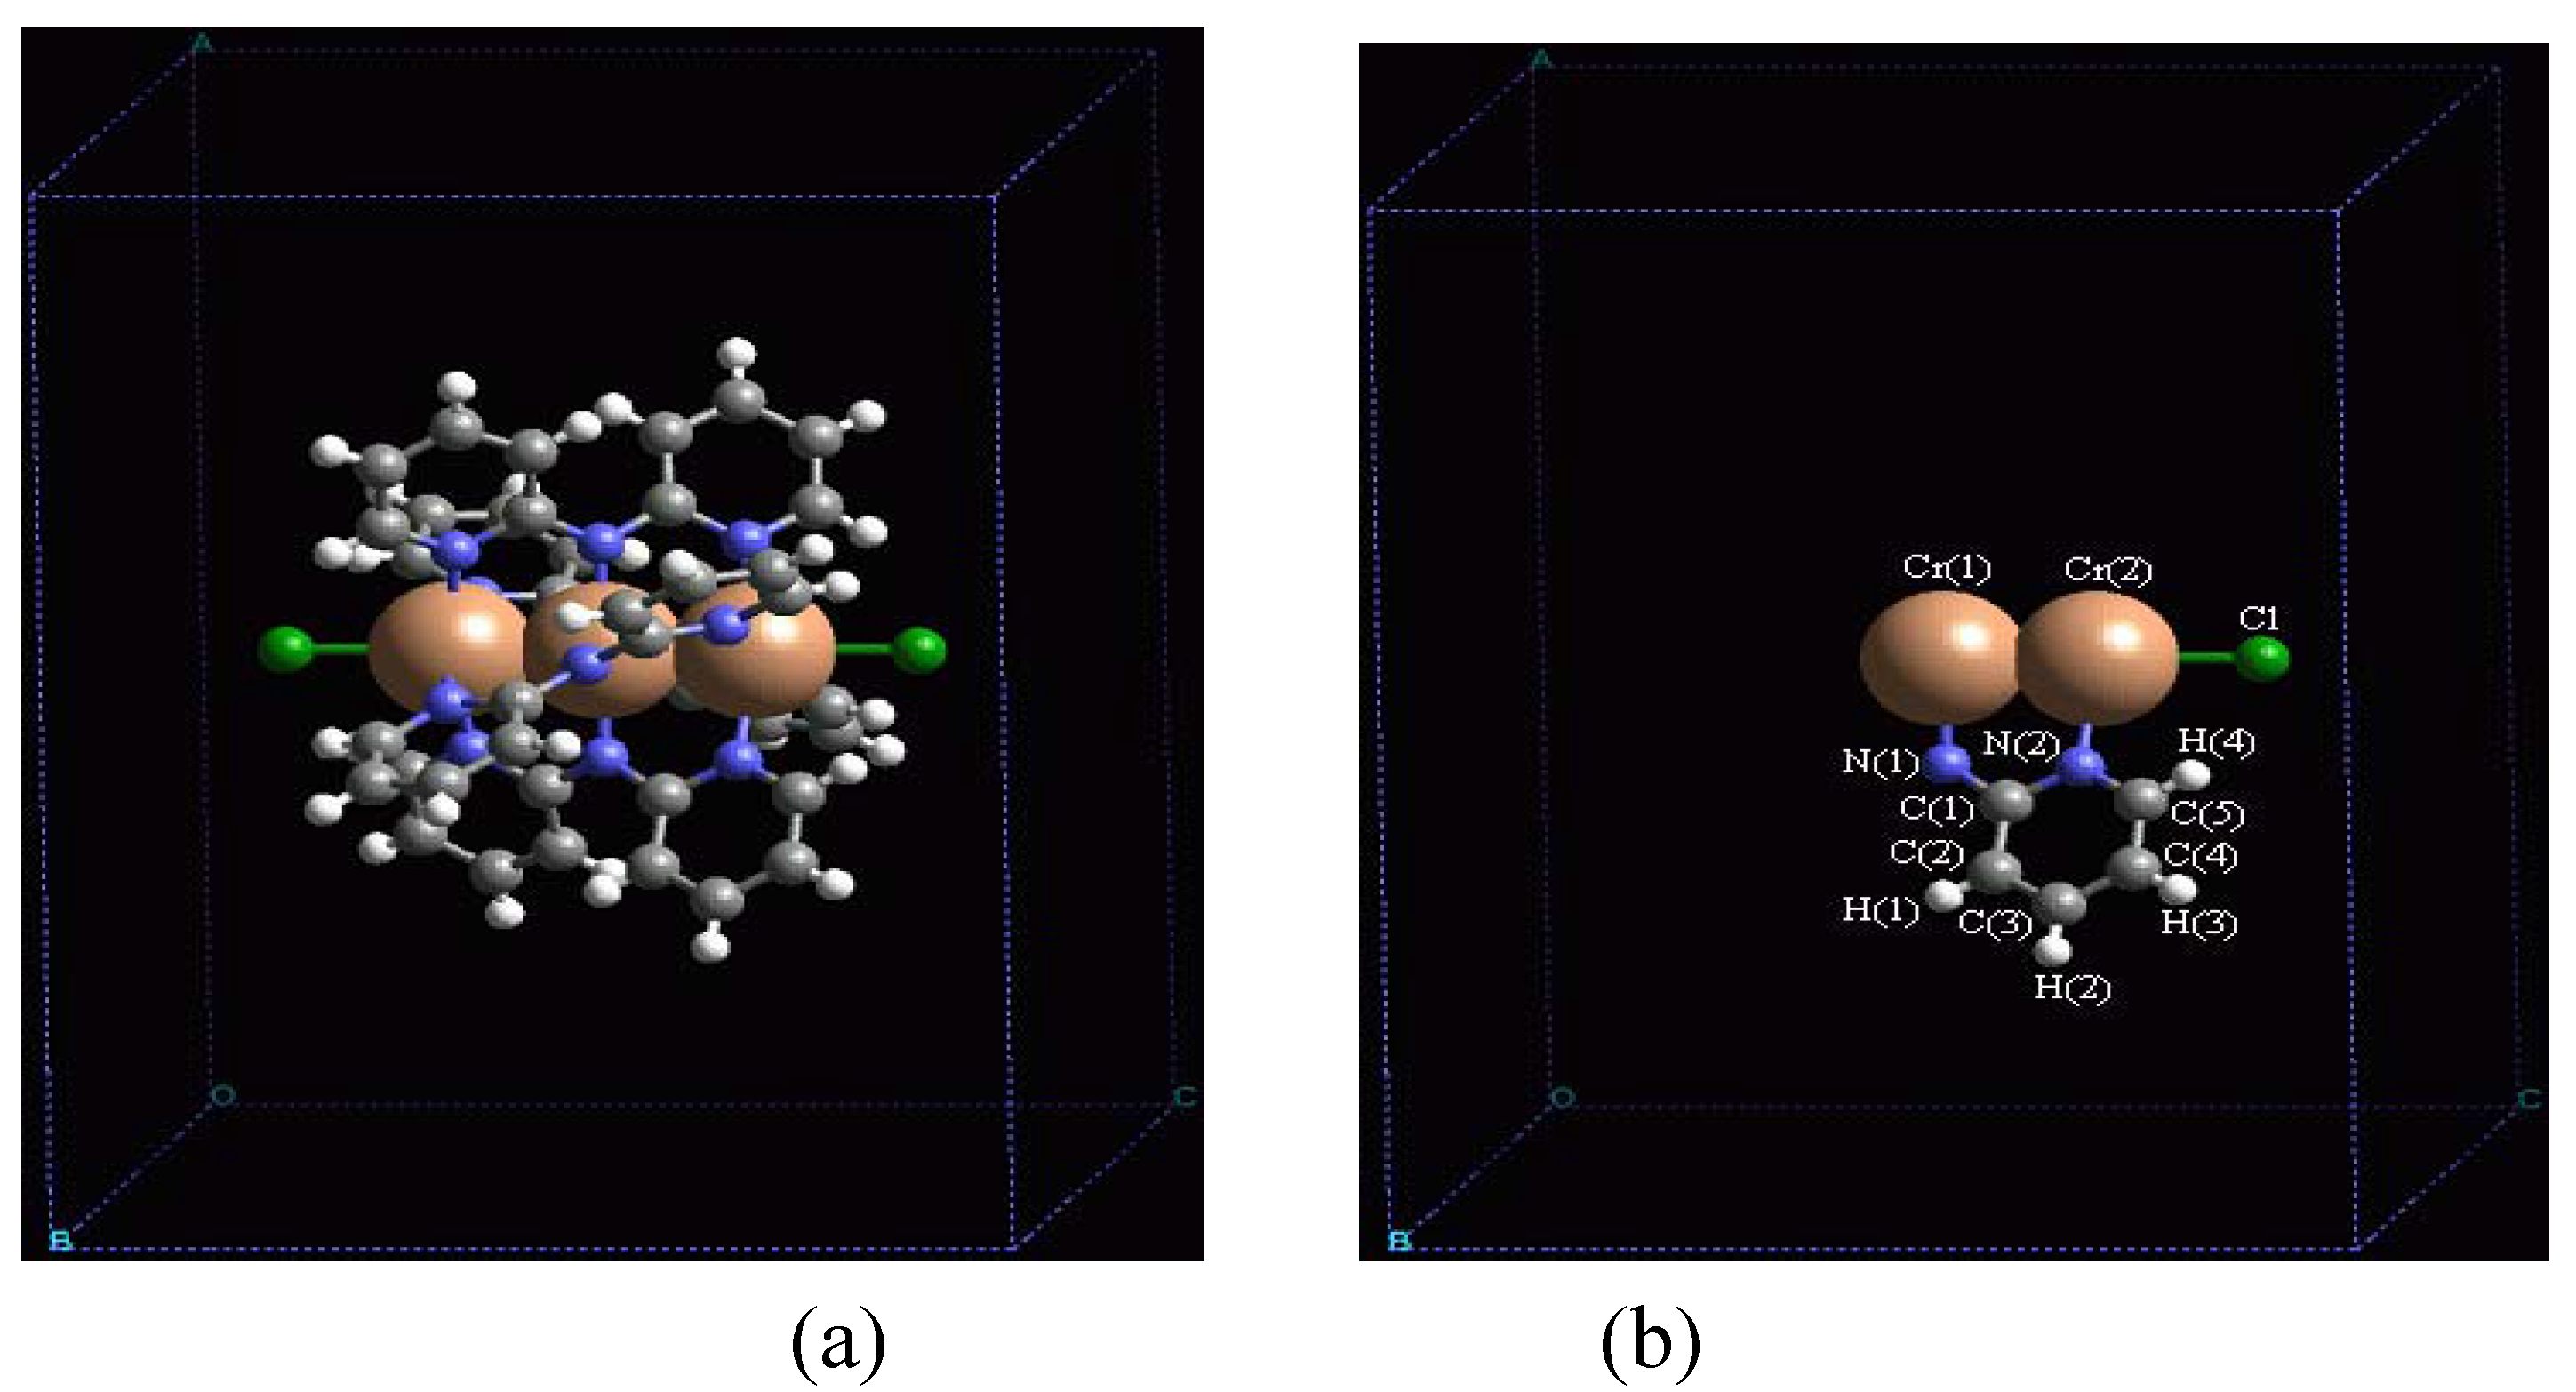
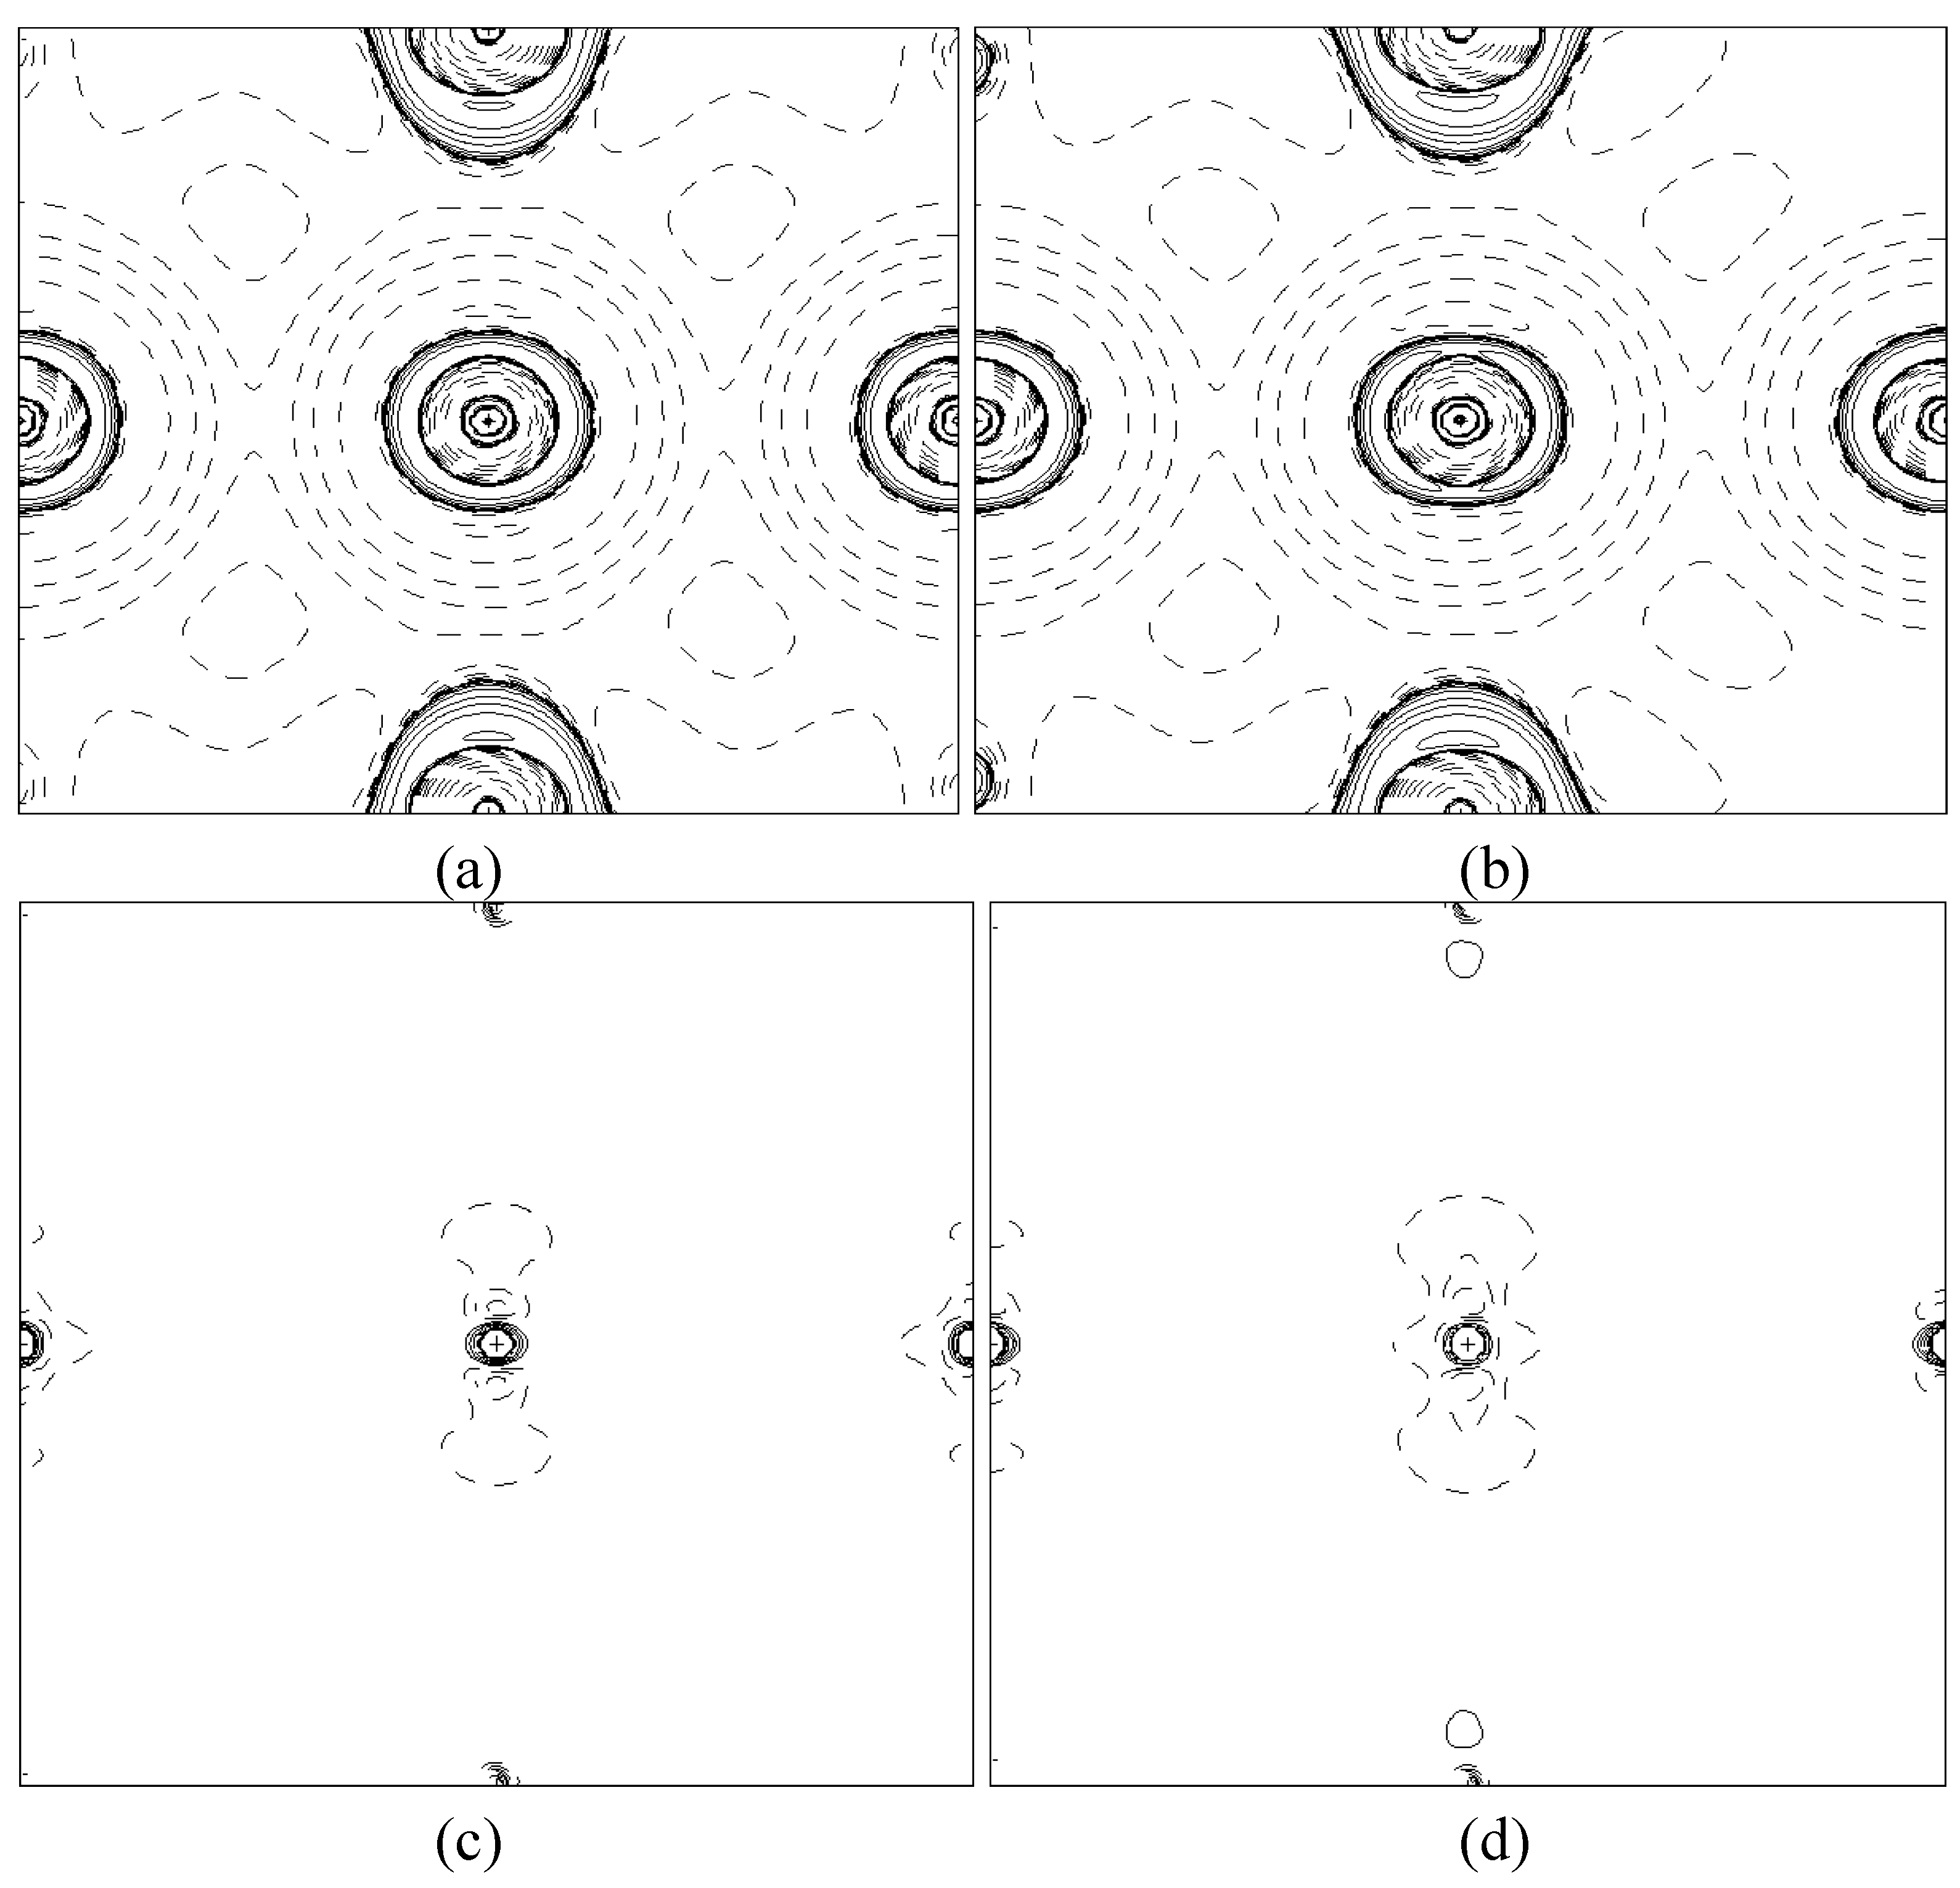
In order to validate our model-construction of the HILOM nanowire, we employ the topological analysis of the electron density to investigate the general pattern of the electron density shared by the Cr LOM complexes with various number of Cr ions. This tool is based on the atoms in molecules (AIM) theory developed by Bader [20,21,22]. The topological properties of the electron distribution of a molecular or crystalline system are based on the gradient vector field of the electron density ∇ρ(r), and on the Laplacian of the electron density ∇2ρ(r). The electron density distribution of the HILOM nanowires is described by ρ(r), where r is a vector in ordinary three-dimensional space and X represents a particular set of the nuclear coordinates in space corresponding to the nuclear configurations of the HILOM nanowires. An Atom in molecule is defined as region of real three-dimensional space bounded by a zero-flux surface. The points on this surface satisfy ∇ρ(r)∇n(r)=0 where n(r) is the unit vector normal to this surface at r. Two interacting atoms in a molecule form a critical point in the electron density, where ∇ρ(r)=0, called a bond critical point (BCP) and abbreviated as rb. The pairs of gradient paths, which originate at a BCP and terminate at neighboring nuclei, define a line, through which electron distribution, ρ(r), is a maximum with respect to any lateral displacement. Linking two nuclei in a molecule with a nuclear equilibrium configuration, this kind of lines are called atomic interaction lines implying that two atoms are bonded to one another and in this instance this line is called a bond path. The network of bond paths for a molecule in a given nuclear configuration X defines the molecular graph. Such a topological graph usually corresponds to the commonly drawn chemical bond network. The electron density at the BCP, ρ(r b) ≡ρb, is related to the bond order and therefore the bond strength [23]. The eigenvalues (λi, i = 1,3) of the Hessian matrix of ρb, whose sum equals ∇2ρ(r), indicate how rapidly the electron density changes on moving away from the BCP and represent the curvatures of the electron density along the principal axes of curvature. The critical point is labeled by two values, rank and signature. The rank of a critical point, denoted by ω, is equal to the number of non-zero eigenvalues of ρ at the critical point. The signature, denoted by σ, is simply the algebraic sum of the signs of the eigenvalues. For a normal single bond, such as the C-C bond in ethane, the two negative curvatures (λ1 and λ2), which are perpendicular to bond line, are equal. However, in the case of a double bond, one curvature (in the direction of the π bond) will be much smaller than the other two. The difference may be described by the ellipticity, ε, of the bond which is defined as ε=(λ12)-1, in which λ2 is the curvature of smallest magnitude. For a single bond λ1 ≈ λ2 and therefore ε ≈ 0. For a double bond |λ1| > |λ2| and therefore ε > 0. For the CC bond in an aromatic system, in, general, ε is in between a typical single and typical double bond. For symmetrical triple bonds, since λ1 ≈ λ2, ε is equal or close to zero. One can also determine the regions of space wherein the electron density is locally concentrated or depleted by inspecting the Laplacian of the electron density, ∇2ρ(r). ρ(r) is greater than the average of its values over an infinitesimal sphere centered on r, where ∇2ρ(r) < 0, and ρ(r) is less than its average when ∇2ρ(r) > 0. The quantum shells of an atom are divided into an inner region (core) and outer one (valence). The portion of the valence shell over which ∇2ρ(r) < 0 is called the valence shell charge concentration (VSCC). Within this shell is the sphere over whose surface the valence electronic charge is maximally and uniformly concentrated. The structure of the Laplacian of charge density for atoms in molecules is most easily visualized in terms of the minimum in ∇2ρ(r), a polyhedron whose numbers of vertexes (V), edges (E), faces (F) and the only cage critical point within the sphere obey the Poincare-Hopf relationship [24]. As a peculiar case, this is easily transformed into Euler’s polyhedral formula [25] V-E+F=2. Extrema in the Lapacian of ρ are classified by rank and signature in the same way as are critical points in the charge density. The local minimum (charge concentration, CC) in valence shell of an atom defines the vertexes, V. The unique pair of trajectories of the gradient of ∇2ρ(r) that originate at a (3,-1) critical point or saddle point between two minima and terminate at neighboring vertexes defines E of the polyhedron. The set of trajectories that arise at a (3,+1) critical point define the faces F of the polyhedron. The face critical points are where ∇2ρ(r) attains a local maximum (charge depletion). This is called an atomic graph. [26]  Another important parameter to characterize the atomic interaction is the total energy density H(r), which is defined as H(r)= G(r)+ V(r) where G(r) is a local kinetic energy density and V(r) is the average field experienced by one electron in a many-particle system (or the local potential energy density). The sign of H(r) determines whether the accumulation of charge at a point r is stabilization [H(r)<0] or destabilization [H(r) >0]. Investigation of a variety of chemical bonds revealed [27,28] that the covalent bonding feature (shared interaction) also can be characterized by a predominance of local potential energy density V(r) at the BCP reflected by H(rb)≡Hb <0. The larger the minus Hb value is, the stronger the covalent bond is. On the other hand, the closed shell interactions, van der Waals interactions or ionic bonds are characterized by a positive Hb.[21,27,28] Therefore, it is reasonable to say that the sign of Hb can provide bonding characterization in addition to the properties of ρb, ∇2ρb and ε. We choose TOPOND98 [29] because it takes molecular symmetry and periodicity in proper account, at variance with other software packages for the electron density topological analysis. This peculiarity makes TOPOND98 a unique tool to perform the topological analysis of the electron density in crystals and in large molecular systems.  

IV. Result And Discussion

Selection of optimum basis set
We employed CRYSTAL98 package [30,31], which implements ab initio calculations with periodic condition, to investigate the total electron density of Cr LOM complexes with various numbers of Cr ions and the Cr. In order to obtain a good description of Cr electronic properties, we choose 86-411d41G for Cr’s basis set as used in ref. [32].  Four basis set levels, STO-3G, 6-31G, 6-31G** and 6-311G, have been considered for the remaining elements, namely Cl, N, C and H. To facilitate the computation, Cr3 is used as our test case to find out the appropriate basis set. The total electron density is obtained by using density functional theory with level B3LYP.  In the case of Cr3, the K point sampling along the reciprocal axis a*, b*, c* were set as 6, 6, 9 accordingly. We employed B3LYP Hamiltonian with 12 s-type auxiliary basis set combined with 95% Fock exchange percentage in the hybrid functional. The test results are listed in Table 3 and Table 4.
Table 3. The test results of the comparable basis sets for Cl, N, C and H atoms
Total Energy (KeV)CPU time (hour)Converge cycles
STO-3G-157.79914.469
6-31G-158.79885.398
6-31G**-158.810278.897
6-311G-158.812288.694
Judging from Table 3 and Table 4, we find that 6-31G is the most efficient basis set considering among the topological properties of electron density, the computational resource and the convergence of the unit cell total energy, even though the values of ∇2ρb and three λ‘s in 6-311G are slight smaller than those in 6-31G and 6-31G**. We used 86-411d41G for Cr and 6-31G for the rest of the elements to evaluate the energy and electronic properties for the other models.
Table 4. Topological properties associated with the bond critical point in the bonding of Cr3 along c axis direction for the different basis sets, where λ1, λ2 and λ3 are the eigenvalues of the hessian matrix of ρ; ρb, Hb, Gb and ∇2ρb are the electron density, the total energy density and the Laplacian at the BCP accordingly. The units for Gb and Hb are Hartree/ Å3.
ρb(e/Å3)2ρb(e/Å5)λ12 (e/Å5)λ3(e/Å5)| λ1|/ λ3GbHb
Cr(1)-Cr(2)
 STO-3G0.3884.070-1.4576.9850.2090.057-0.098
 6-31G0.3923.485-1.4056.2950.2230.051-0.103
 6-31G**0.3943.492-1.4116.3130.2230.052-0.105
6-311G0.3903.464-1.3776.2170.2210.051-0.102
Cr(2)-Cl
 STO-3G0.2672.669-1.0344.7360.2180.029-0.012
 6-31G0.2602.483-0.8074.0980.1970.030-0.027
 6-31G**0.2642.564-0.8334.2310.1970.030-0.024
 6-311G0.2582.370-0.8113.9920.2030.029-0.028
Topological Analysis of the Electron Density
Topological properties at BCPs for all the calculated models and for the bonding along Cr chain are summarized in Table 5. Judging from the negative Hb values and small kinetic energy density (Gb/ρb <1), the bonding between any two neighboring Cr atoms is an open-shell type [28] for all the calculated models. The position of rb is always shifted to one side between any two neighboring Cr atoms, even in the Cr model. This indicates that Cr-Cr bond is polarized, and the polarization can
Table 5. Topological properties at BCPs for all the calculated models and for the bonding along Cr chain. d1-BCP and d2-BCP are the distances from atoms to BCP while the other symbols have the same meaning as in Table 4.
d1 (Å)d2 (Å)ρb2ρbλ1λ31|/λ3GbGb/ρbΗb
Cr3
Cr(1)-Cr(2)1.2341.1120.3923.485-1.4056.2950.2230.0510.130-0.103
Cr(2)-Cl1.1651.4120.2602.483-0.8074.0980.1970.0300.115-0.027
Cr5
Cr(1)-Cr(2)1.0771.1620.5125.602-1.8729.3470.2000.0830.162-0.165
Cr(2)-Cr(3)1.1981.0850.4575.115-1.3837.8810.1750.0730.160-0.133
Cr(3)-Cl1.1611.4110.2582.790-0.6794.1470.1640.0330.128-0.025
Cr7
Cr(1)-Cr(2)1.1441.0740.5336.047-2.02710.1010.2010.0880.165-0.173
Cr(2)-Cr(3)1.0861.1570.5085.242-2.0759.3920.2210.0780.154-0.160
Cr(3)-Cr(4)1.1921.0880.4585.066-1.4698.0040.1840.0720.157-0.132
Cr(4)-Cl1.1531.3910.2782.880-0.8004.4800.1780.0350.126-0.032
Cr
Cr(1)-Cr(2)1.1371.0940.5375.182-2.3169.8140.2360.0800.149-0.180
Cr(2)-Cr(3)1.0931.1370.5375.160-2.3659.8900.2390.0800.149-0.178
only come from the influence of the ligands. There are only three kinds of ligands, which are Cl atoms, pyridines and amides, and each of them influences the electron density of the Cr LOM complexes and Cr differently. We found that the values of ρb, ∇2ρb and |λ1|/λ3 decrease as the Cr chain approaches Cl atom. This shows that the electron-withdrawing effect of Cl atom influences the electron density distribution of Cr atoms. Unlike the Cr LOM complexes, the Cr has almost the same values of ρb, ∇2ρb and |λ1|/λ3 for different Cr-Cr bonds. This different behavior between the Cr LOM complexes and Cr indicates the size effect of the LOM complexes and this difference should decrease as the number of Cr ions in the complex increases. Examination of the values of d1 and d2 in the models shows that the location of the BCP’s between two neighboring Cr ions is not at the middle. The alternate d values along the Cr chain and found in Cr5, Cr7 complexes, and Cr. The difference between the d values of two neighboring Cr atoms in the Cr LOM complexes seem strongly related to the chain length and the presence of the Cl atom at the termini of the Cr chain. First, the difference between the d values of the Cr pair next to the Cl atom is larger than those of the other Cr pairs as found in the Cr5 and Cr7 models. Secondly, the difference between the d values of the Cr pair next to the Cl atom decreases as the Cr chain length increases. These two findings both indicate that electron-withdrawing effect of Cl atom polarizes the Cr-Cr bonds strongly but it is not the main cause to induce the alternate d values along the Cr chain since Cr without the terminal Cl atoms still shows the same phenomenon. The cause for the alternate d values along the Cr chain can be easily explained by observing the contour maps of Laplacian distribution and the corresponding deformation density maps (shown in Figure 4, Figure 5, Figure 6 and Figure 7). As described previously that the types of any Cr-Cr bonds are polarized open-shell interaction, it is again shown in the deformation density maps. Charge depletion and concentration alternate with each other along the Cr chain. In all the Cr LOM complexes and Cr, those Cr ions with local charge concentration have larger d values to BCP along the interatomic axis than those of Cr ions with charge depletion along this direction. The corresponding deformation density maps also demonstrate the similar feature. There is positive deformation density along the chain for those Cr ions, which are farther from the BCP. On the other hand, there is also negative deformation density along the chain for those Cr ions, which are closer to the BCP. These phenomena are consistent with the fact that the BCP should be closer to the atom with lower electronegtivity values between two bonded atoms. The topological analysis of the laplacian for all the calculated models along the Cr chain is summarized in Table 6. Two typical atomic graphs are shown in Figure 8. There are several general features found in these atomic graphs. The Laplacian at the Cr ions bonded to amide nitrogen atoms shows local CC towards a saddle point of the neighboring Cr ions bonded to pyridine nitrogen atoms. Generally, the ligands avoid the vertexes formed by CCs in the valence shell of a metal but are inserted to the face the polyhedron. It is interesting that all the nitrogen atoms of amide in Cr5 and Cr7 are capped to the edges of the polyhedron. The nitrogen atoms of amide in Cr3 and Cr, like regular ligands, are inserted to the face of polyhedron. The Laplacian portraits of Cr(1) in Cr3 and Cr(1) and Cr(3) in Cr can be considered as distorted polyhedrons of amide-bonded Cr ions in Cr5 and Cr7. The Laplacian portraits of Cr(2) in both Cr3 and Cr can be treated as distorted polyhedrons of pyridine-bonded Cr ions in Cr5 and Cr7.
Combined with results from topologies of electron density and Laplacian, there are two types of Cr ions in all of the calculated models. The less electron withdrawing Cr ions are always bonded to the pyridine nitrogen atoms whereas the more electronegative Cr ions are bonded to the amide nitrogen atoms. Therefore the organic ligands do influence the electron density of the Cr chain and can be used
Figure 4. Contour maps of -∇2ρ(r) and deformation density maps for Cr3. (a) and (b) are contour maps of -∇2ρ(r) with Cr(1) and Cr(2) as the center respectively. (c) and (d) are the corresponding deformation density maps. The planes presented in the figures are through the Cr chain and the Cr-N bond of the center Cr ion. The contours are drawn in the order 2x10n, 4x10n , 8x10n with n beginning at –2 and increasing in step of 1. This geometric progression also defined the contour values of -∇2ρ(r), positive values being denoted by solid lines and negative values by dashed lines. In the deformation density maps, the solid lines are charge concentration, and the broken lines are charge depletion.
Ijms 03 00038 g004
Figure 5. Contour maps of -∇2ρ(r) and deformation density maps for Cr5. (a) and (b) are contour maps of -∇2ρ(r) with Cr(1) and Cr(2) as the center respectively. (c) and (d) are the corresponding deformation density maps. The rest are the same as those found in Figure 4.
Ijms 03 00038 g005
Figure 6. Contour maps of -∇2ρ(r) and deformation density maps for Cr7. (a), (c) and (e) are contour maps of -∇2ρ(r) with Cr(1), Cr(2) and Cr(3) as the center respectively. (b), (d) and (f) are the corresponding deformation density maps. The rest are the same as those found in Figure 4.
Ijms 03 00038 g006
Figure 7. Contour maps of -∇2ρ(r) and deformation density maps for the Cr. (a) and (b) are contour maps of -∇2ρ(r) with Cr(1) and Cr(2) as the center respectively. (c) and (d) are the corresponding deformation density maps. The rest are the same as those found in Figure 4.
Ijms 03 00038 g007
as indices to characterize the electron density of the Cr chain. The reason why the Cr ions bonded to the pyridine nitrogen atoms are less electron withdrawing is unclear and is a subject for future study. There is one more interesting phenomenon worth knowing. The contour map of charge concentration in Cr has quite different shape from that found in Cr LOM complexes, even though it does show the same pattern. We also perform band structure calculation on Cr and the results are shown in Figure 9. The calculation method is almost the same as that used in the case of the LOM complexes except a slight difference in the k point sampling that was now 5,5, and 10 points, respectively, along the reciprocal axes a*, b*, c*.  There are 940 bands involved and the Fermi level is at –0.108 e/au. With a small band gap, 0.0044 e/au, between HOMO and LUMO bands, the Cr can be considered as metal or semi-metal.
Table 6. Atomic graphs of all the calculated models along the Cr chain. The third column indicates the type of nitrogen atom, which the Cr ion in the second column connects to. The type of the critical points around a Cr ion is indicated in the fourth column and the locations of the critical points are shown from the fifth to seventh column in fractional coordinate. The electron density of the critical point is shown in the eighth column. The ninth column shows the displacement of the critical point from the Cr ion. The last column indicates the multiplicity of the critical points in the unit cell. The shade rows are those critical points facing neighboring Cr ions. The Euler’s polyhedral formula V + F - E = 2 is satisfied in each Cr ion.
AtomligandtypeXYZρ (e/Å3)D (Å)Multiplicity
Cr3Cr(1)amideV0.5000.5000.47614.7770.3652
V0.4870.4870.50015.1720.3604
E0.4930.4930.47914.5070.3668
F0.4820.5000.50013.6420.3684
Cr(2)pyridineV0.4840.4920.33916.3370.3564
E0.4890.4960.36114.2250.3664
E0.4890.4960.32514.3330.3654
F0.4820.4940.34311.9040.3804
F0.5000.5000.36812.4740.3751
F0.5000.5000.31812.7410.3741
Cr5Cr(1)pyridineV0.4870.5000.48815.7950.3598
E0.4810.5000.50013.1250.3704
E0.4870.5000.4793.7950.6118
F0.4870.4870.50012.7740.3724
F0.5000.5000.48112.3960.3812
Cr(2)amideV0.5000.5000.40615.1700.3631
V0.5000.5000.37015.1260.3631
V0.4830.4940.38815.5320.3584
E0.489 0.4960.37414.2920.3664
E0.4890.4960.40214.3380.3664
E0.4840.4920.38813.8660.3674
F0.4860.4930.37813.7230.3684
F0.4860.4930.39813.7620.3684
Cr(3)pyridineV0.4890.4910.28515.9270.3574
V0.4900.4910.26315.9330.3584
E0.4870.4990.28615.2620.3614
E0.4870.4990.26115.3650.3614
E0.4860.4880.27414.2310.3654
F0.4810.4990.27412.1260.3774
F0.5000.5000.29311.9200.3811
F0.5000.5000.25512.2670.3801
Cr7Cr(1)amideV0.5000.5000.48515.0370.3642
V0.4870.4870.50015.7380.3574
E0.4920.4920.48814.3480.3668
E0.4820.5000.50013.5570.3694
F0.4830.5000.49413.5470.3698
Cr(2)pyridineV0.4930.4880.42015.5850.3594
V0.4880.4930.40215.6200.3594
E0.4870.4960.42115.2370.3614
E0.4870.4960.40115.2740.3614
E0.4910.4840.41113.9040.3664
F0.4820.4950.41112.6960.3734
F0.5000.5000.42612.6830.3781
F0.5000.5000.39612.7310.3781
Cr(3)amideV0.5000.5000.33615.0520.3641
V0.5000.5000.30714.9790.3641
V0.4820.4970.32215.5120.3584
E0.4890.4980.31014.3490.3664
E0.4890.4980.33314.4210.3664
E0.4850.4900.32213.6520.3684
F0.4910.4860.32813.6790.3684
F0.4860.4910.31513.6350.3694
Cr(4)pyridineV0.4860.4980.23915.7770.3584
V0.4860.4980.22215.8340.3584
E0.4890.4930.24114.9320.3624
E0.4900.4930.22015.0530.3624
E0.4820.4970.23014.7530.3634
F0.4850.4890.23012.2280.3774
F0.5000.5000.24612.2000.3791
F0.5000.5000.21512.6060.3771
CrCr(1)amideV0.5000.5000.45914.5410.3672
V0.4870.4870.50015.0890.3604
E0.5000.4930.46214.4980.3668
F0.4820.5000.50013.4680.3694
Cr(2)pyridineV0.4840.4920.25016.4180.3554
E0.4900.4970.28414.0250.3674
E0.4900.4970.21614.0300.3674
F0.4820.4940.25012.5210.3764
F0.5000.5000.29113.5900.3701
F0.5000.5000.20913.5880.3701
Cr(3)amideV0.5000.5000.04114.9500.3652
E0.4820.5000.00014.2410.3644
F0.5000.4710.0003.8020.5894
Figure 8. Atomic graphs of the Cr ion. (a) is the atomic graph of Cr(1) ion in Cr7 to represent the topology of the Laplacian for the Cr ions bonded to amide nitrogen atoms. (b) is the atomic graph of Cr(1) ion in Cr7 to show that for the Cr ions bonded to pyridine nitrogen atoms. The nitrogen atoms of amides are capped to the edge of the polyhedron formed by the valence shell of the Cr ion, but the nitrogen atoms of pyridines are inserted to the face of the polyhedron.
Ijms 03 00038 g008
Figure 9. The band structure of the Cr along c* direction near the Fermi level. There are 940 bands involved. The red line in the figure is the Fermi level, which is at –0.108 e/au. The band gap between HOMO and LUMO bands is 0.0044 e/au.
Ijms 03 00038 g009

V. Conclusion

We have shown that the topologies of electron density and Laplacian of the Cr ions found in Cr share the similar features with those found in the Cr LOM complexes. All of the Cr-Cr bonds are essentially polarized open shell interaction. There are two types of Cr ions, namely the relatively higher and lower in electronegativity, which are correlated with the type of the bonding nitrogen atoms. The ρb values of central Cr-Cr bond are always higher than those close to the terminal ones. This indicates that Cr is the limiting case of the Cr LOM complexes free from the axial ligand like Cl ions. From the band structure calculation, we predict that Cr is an either metal or a semi-metal and could be a potential candidate of molecular metalwire in future nanomachinery applications. We are aware of the molecular wire with alternating Cr-Cr distances proposed by Cotton et al. [33], contrast to the present equal distance model. A study to compare the difference between these two models is in progress.

Acknowledgement

This work is supported by the National Science Council of Taiwan.

Reference

  1. Korotkov, A.N. Molecular Electronics; Jortner, J., Ratner, M., Eds.; Blackwell Science: Oxford, 1997. [Google Scholar]
  2. Klein, D. L.; Roth, R.; Lim, A. K. L.; Alivisatos, A. P.; McEuen, P. L. Nature 1997, 389, 699.
  3. Goldhaber-Gordon, D.; Shtrikman, H.; Mahalu, D.; Abusch-Magder, D.; Meirav, U.; Kastner, M. A. Nature 1998, 391, 156.
  4. Iijima, S.; Ichhashi, T. Nature 1993, 363, 603.
  5. Hamada, N.; Sawada, S.-I.; Oshiyama, A. Phys. Rev. Lett. 1992, 68, 1579. [CrossRef]
  6. Krans, J. M.; van Ruitenbeek, J.M.; Fisun, V. V.; Yanson, I. K.; de Jongh, L. J. Nature 1995, 375, 767.
  7. Pascual, J. I.; Mendez, J.; Gomez-Herrero, J.; Baro, A. M.; Garcia, N.; Landman, U.; Leuedtke, W. D.; Bogachek, E. N.; Cheng, H.-P. Science 1995, 267, 1793.
  8. Rubio, G.; Agrait, N.; Vieeira, S. Phys. Rev. Lett. 1996, 76, 2302. [CrossRef]
  9. Oleson, L.; Lagsgaard, E.; Stensgaad, I.; Besenbacher, F.; Schiotz, J.; Stoltze, P.; Jacobsen, K. W.; Norskov, J. K. Phys. Rev. Lett. 1994, 72, 2251. [CrossRef]
  10. Costa-Kramer, J. L.; Garcia, N.; Garcia-Mochales, P.; Serena, P. A. Surf. Sci. 1995, 342, L1144.
  11. Snow, E. S.; Park, D.; Campbell, P. M. Appl. Phys. Lett. 1996, 69, 269.
  12. Li, C. Z.; Tao, N. J. Appl. Phys. Lett. 1998, 72, 894.
  13. Braun, E.; Eichen, Y.; Sivan, U.; Ben-Yoseph, G. Nature 1998, 391, 775.
  14. Shieh, S. J.; Chou, C. C.; Lee, G. H.; Wang, C. C.; Peng, S. M. Angew. Chem. Int. Ed. Engl. 1997, 36, 56. [CrossRef]
  15. Chen, Y. H.; Lee, C. C.; Wang, C. C.; Lee, G. H.; Lai, S. Y.; Li, F. Y.; Mou, C. Y.; Peng, S. M. Chem. Commun. 1999, 1667.
  16. Wang, C. C.; Lo, W. C.; Chou, C.C.; Lee, G. H.; Chen, J. M.; Peng, S. M. Inorg. Chem. 1998, 37, 4059.
  17. Cotton, F. A.; Daniels, L. M.; Murillo, C. A.; Wang, X. J. Chem. Soc. Dalton Trans. 1999, 517. [CrossRef]
  18. Cotton, F. A.; Daniels, L. M.; Murillo, C. A.; Pascual, I. J. Chem. Soc. 1999, 119, 10223.
  19. Peng, S. M. unpublisher reslt.
  20. Bader, R. F. W. Chem. Rev. 1991, 91, 893.
  21. Bader, R. F. W. Atoms in Molecules: a Quantum Theory; Clarendon Press: Oxford, 1990. [Google Scholar]
  22. Bader, R. F. W. Acc. Chem. Res. 1985, 18, 9. [CrossRef]
  23. Bader, R. F. W.; Tang, T. H.; Tal, Y.; Biegler-Konig, F. W. J. Am. Chem. Soc. 1982, 104, 940.
  24. Collard, K.; Hall, G.G. Int. J. Quantum Chem. 1977, 12, 623. [CrossRef]
  25. Bader, R. F. W.; Popelier, P. L. A.; Chomg, C. J. Mol. Struct. (THEOCHEM) 1992, 255, 145. [CrossRef]
  26. Bader, R. F. W.; MacDougall, P. J. J. Am. Chem. Soc. 1985, 107, 6788.
  27. Cremer, D.; Kraka, E. Angew. Chem. Int. Ed. Engl. 1984, 23, 627. [CrossRef]
  28. Macchi, P.; Proserpio, D. M.; Siroui, A. J. Am. Chem.Soc. 1998, 120, 13429.
  29. Gatti, C. TOPOND98 User’s Mannual; CNR-CSRSRC: Milano, Italy, 1999. [Google Scholar]
  30. Zicovich-Wilson, C.M.; Dovesi, R. Int. J. Quantum Chem. 1998, 67, 299. [CrossRef]
  31. Zicovich-Wilson, C.M.; Dovesi, R. Int. J. Quantum Chem. 1998, 67, 311. [CrossRef]
  32. Towler, M.D.; Catti, M. Phys. Chem. Solids 1996, 57, 1735. [CrossRef]
  33. Cotton, F. A.; Daniels, L. M.; Murillo, C. A.; Wang, X. Chem. Commun. 1999, 2461.

