Article

Carbonic Anhydrase 2 Deletion Delays the Growth of Kidney Cysts Whereas Foxi1 Deletion Completely Abrogates Cystogenesis in TSC

by
Sharon Barone
1,2,†,
Kamyar Zahedi
1,2,†,
Marybeth Brooks
1,2 and
Manoocher Soleimani
1,2,*
1
Research Services, New Mexico Veterans Health Care System, Albuquerque, NM 87108, USA
2
Department of Medicine, Division of Nephrology, University of New Mexico Health Sciences Center, Albuquerque, NM 87131, USA
*
Author to whom correspondence should be addressed.
These authors contributed equally to this work.
Int. J. Mol. Sci. 2024, 25(9), 4772; https://doi.org/10.3390/ijms25094772
Submission received: 15 March 2024 / Revised: 17 April 2024 / Accepted: 23 April 2024 / Published: 27 April 2024
(This article belongs to the Special Issue A Molecular Perspective on the Genetics of Kidney Diseases)

Abstract

:
Tuberous sclerosis complex (TSC) presents with renal cysts and benign tumors, which eventually lead to kidney failure. The factors promoting kidney cyst formation in TSC are poorly understood. Inactivation of carbonic anhydrase 2 (Car2) significantly reduced, whereas, deletion of Foxi1 completely abrogated the cyst burden in Tsc1 KO mice. In these studies, we contrasted the ontogeny of cyst burden in Tsc1/Car2 dKO mice vs. Tsc1/Foxi1 dKO mice. Compared to Tsc1 KO, the Tsc1/Car2 dKO mice showed few small cysts at 47 days of age. However, by 110 days, the kidneys showed frequent and large cysts with overwhelming numbers of A-intercalated cells in their linings. The magnitude of cyst burden in Tsc1/Car2 dKO mice correlated with the expression levels of Foxi1 and was proportional to mTORC1 activation. This is in stark contrast to Tsc1/Foxi1 dKO mice, which showed a remarkable absence of kidney cysts at both 47 and 110 days of age. RNA-seq data pointed to profound upregulation of Foxi1 and kidney-collecting duct-specific H+-ATPase subunits in 110-day-old Tsc1/Car2 dKO mice. We conclude that Car2 inactivation temporarily decreases the kidney cyst burden in Tsc1 KO mice but the cysts increase with advancing age, along with enhanced Foxi1 expression.

1. Introduction

Tuberous sclerosis complex (TSC) is a rare autosomal dominant genetic disease that affects over two million individuals worldwide [1,2]. It is a multi-system disease that is caused by mutations in either the Tsc1 or Tsc2 genes and damages various organs such as the kidneys, lungs, and brain [3]. In the kidneys, TSC presents with the enlargement of benign tumors (angiomyolipomata) and cysts, which eventually leads to kidney failure [3,4,5,6]. Although the genetic basis of TSC disease is well worked out, the factors that promote cyst formation and tumor growth in TSC are poorly understood. Previous investigations examining various mouse models of TSC have revealed that the epithelia of renal cysts maintain the integrity of their Tsc loci and that the loss of heterozygosity was observed in only a small number of cystic epithelial cells [7,8,9,10]. These observations are similar to those in human TSC renal cystic disease, where cells lining the cysts express both Tsc1 and Tsc2 proteins [11].
The unregulated activation of mammalian target of rapamycin complex 1 (mTORC1) is the primary factor that promotes cell proliferation, benign tumor (angiomyolipomata) development, and cystogenesis in TSC kidneys [12,13,14]. mTORC1 is a serine/threonine protein kinase complex that regulates cell growth in response to environmental factors, and its dysregulation contributes to many pathophysiologic states [15,16,17]. The activity of mTORC1 is mediated through the phosphorylation of its substrates, including the ribosomal protein S6K and eIF4E-binding proteins (4-EBP) [18].
A number of studies indicate the preponderance of A-intercalated (A-IC) cells in kidney cyst epithelia in mouse models of TSC, as well as in TSC patients [7,9,10,11]. The latter was verified by the expression of apical H+-ATPase, and the basolateral Cl/HCO3 exchanger AE1 (SLC4A1) via immunofluorescence labeling [7,9,10,11]. The increased expression of H+-ATPase in the cystic epithelium is of great interest since it is involved in the activation of mTORC1 and cell proliferation [19,20,21,22], and is most likely mediated via amino acid-sensitive interactions with Ragulator, a scaffolding complex that anchors Rag GTPases to the lysosome [19,20,21,22].
H+-ATPase is a multi-subunit complex composed of V0 (membrane-spanning) and V1 (catalytic) complexes that couple the energy of ATP hydrolysis to H+ translocation across the plasma and intracellular membranes [23,24]. The inward translocation of H+ causes the acidification of the intracellular compartments of secretory vesicles, endosomes, and lysosomes [23,24]. Chemical inhibition of H+-ATPase alkalinizes the pH of the lysosomal lumen and inactivates mTORC1 [25]. At the plasma membrane of A-IC cells, H+-ATPase is responsible for pumping H+ into the lumen of the collecting duct, thus regulating the systemic acid/base balance [26,27,28].
RNA sequencing (RNA-seq) and confirmatory expression studies in our laboratories demonstrated robust expression of Forkhead box I1 (Foxi1) transcription factor and its downstream targets, including apical H+-ATPase transmembrane (V0) and catalytic (V1) components, in the cyst epithelia of Tsc1 as well as Tsc2 knockout mice, but not in mice with the Pkd1 gene mutation [9].
The electrogenic 2Cl/H+ exchanger, CLC-5, is significantly up-regulated and shows remarkable co-localization with H+-ATPase on the apical membrane of cyst epithelia in various TSC mouse models, but not in Pkd1 mutant mice [29]. The deletion of Foxi1, a protein that is vital to H+-ATPase expression and IC cell viability, completely inhibited mTORC1 activation and abrogated the cyst burden in 47-day-old Tsc1/Foxi1 dKO mice [9]. These results unequivocally demonstrate the critical role that Foxi1 and IC cells, along with H+-ATPase, play in kidney cystogenesis in TSC.
In this present study, we sought to examine the ontogeny of kidney cysts in Tsc1/Car2 dKO and Tsc1/Foxi1 dKO mice. Tsc1/Car2 dKO animals similar to Tsc1/Foxi1 dKO mice show either very few or no cysts compared to age-matched Tsc1 KO mice [9]. However, unlike the Tsc1/Foxi1 dKO mice, the Tsc1/Car2 dKO animals develop severe renal cystic disease as they age [9,10]. Compared to Tsc1 KO mice, which usually die before the age of 55 days, both Tsc1/Car2 dKO and Tsc1/Foxi1 dKO mice survive [9].

2. Results

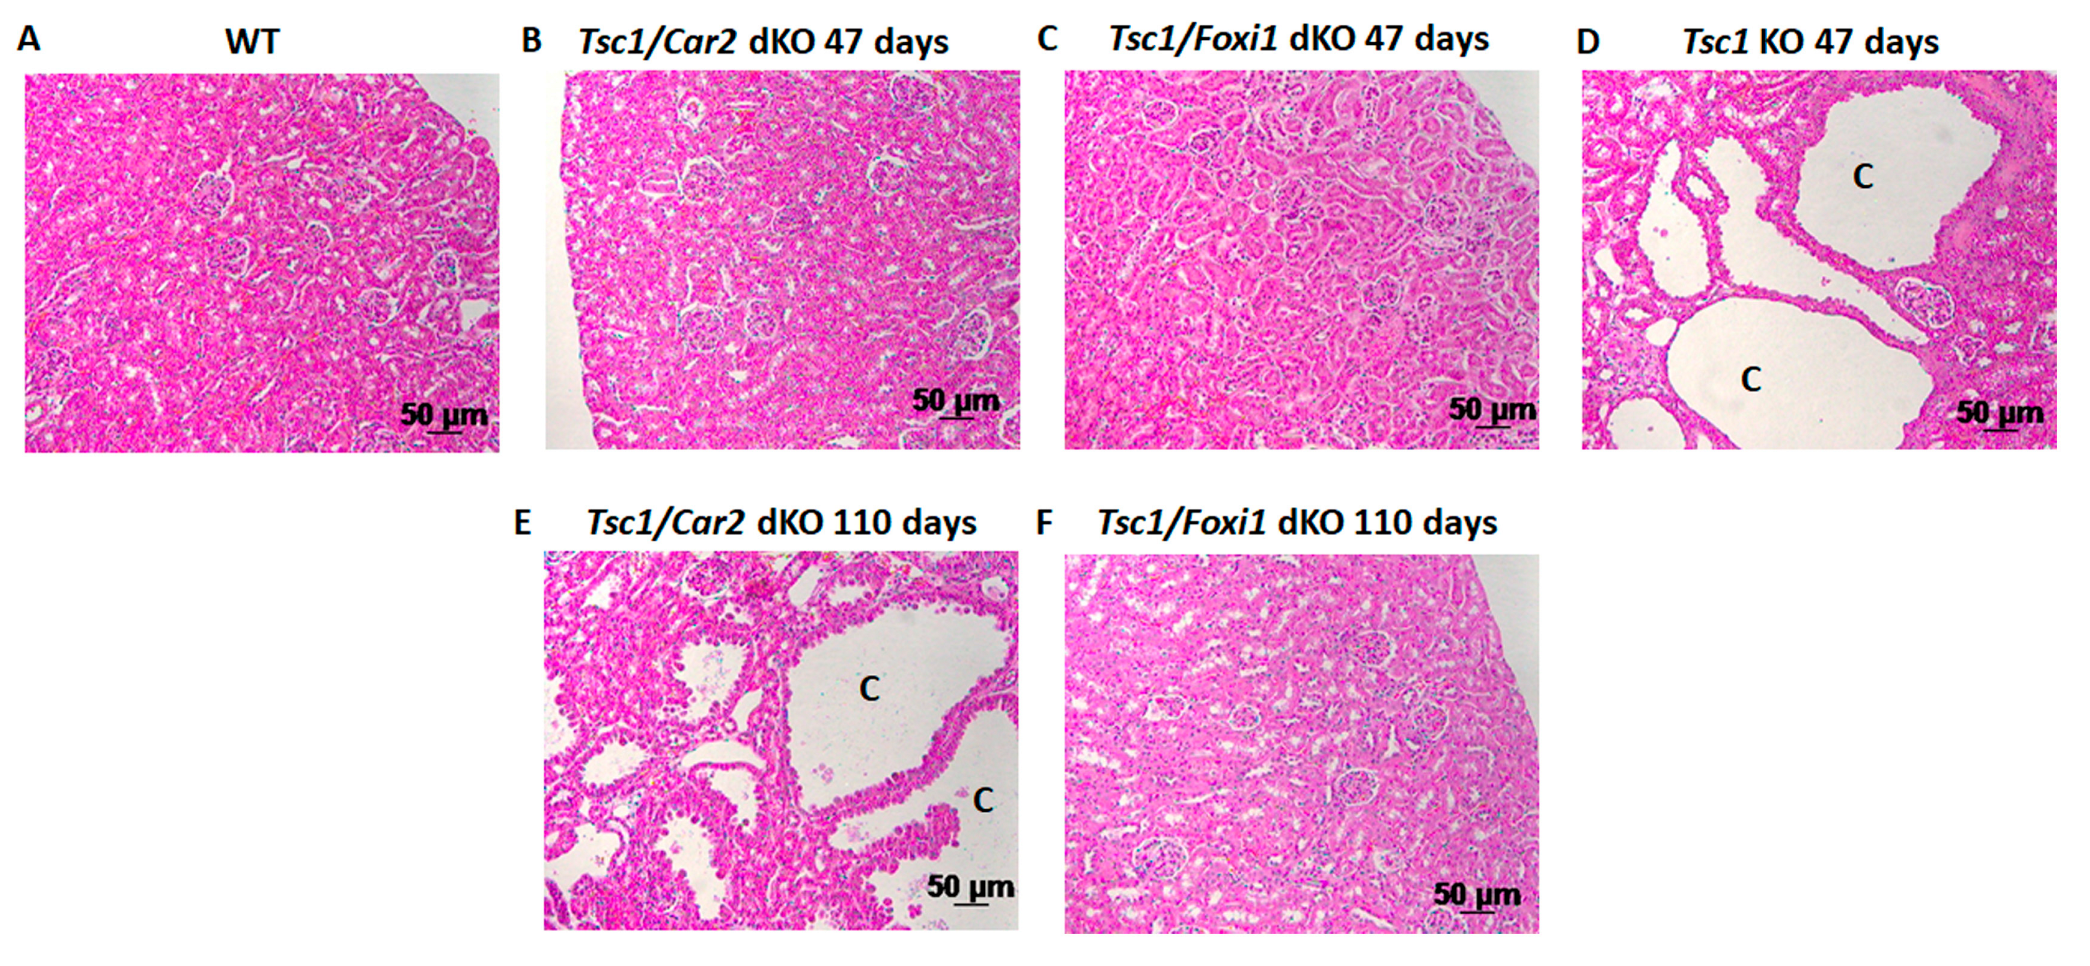
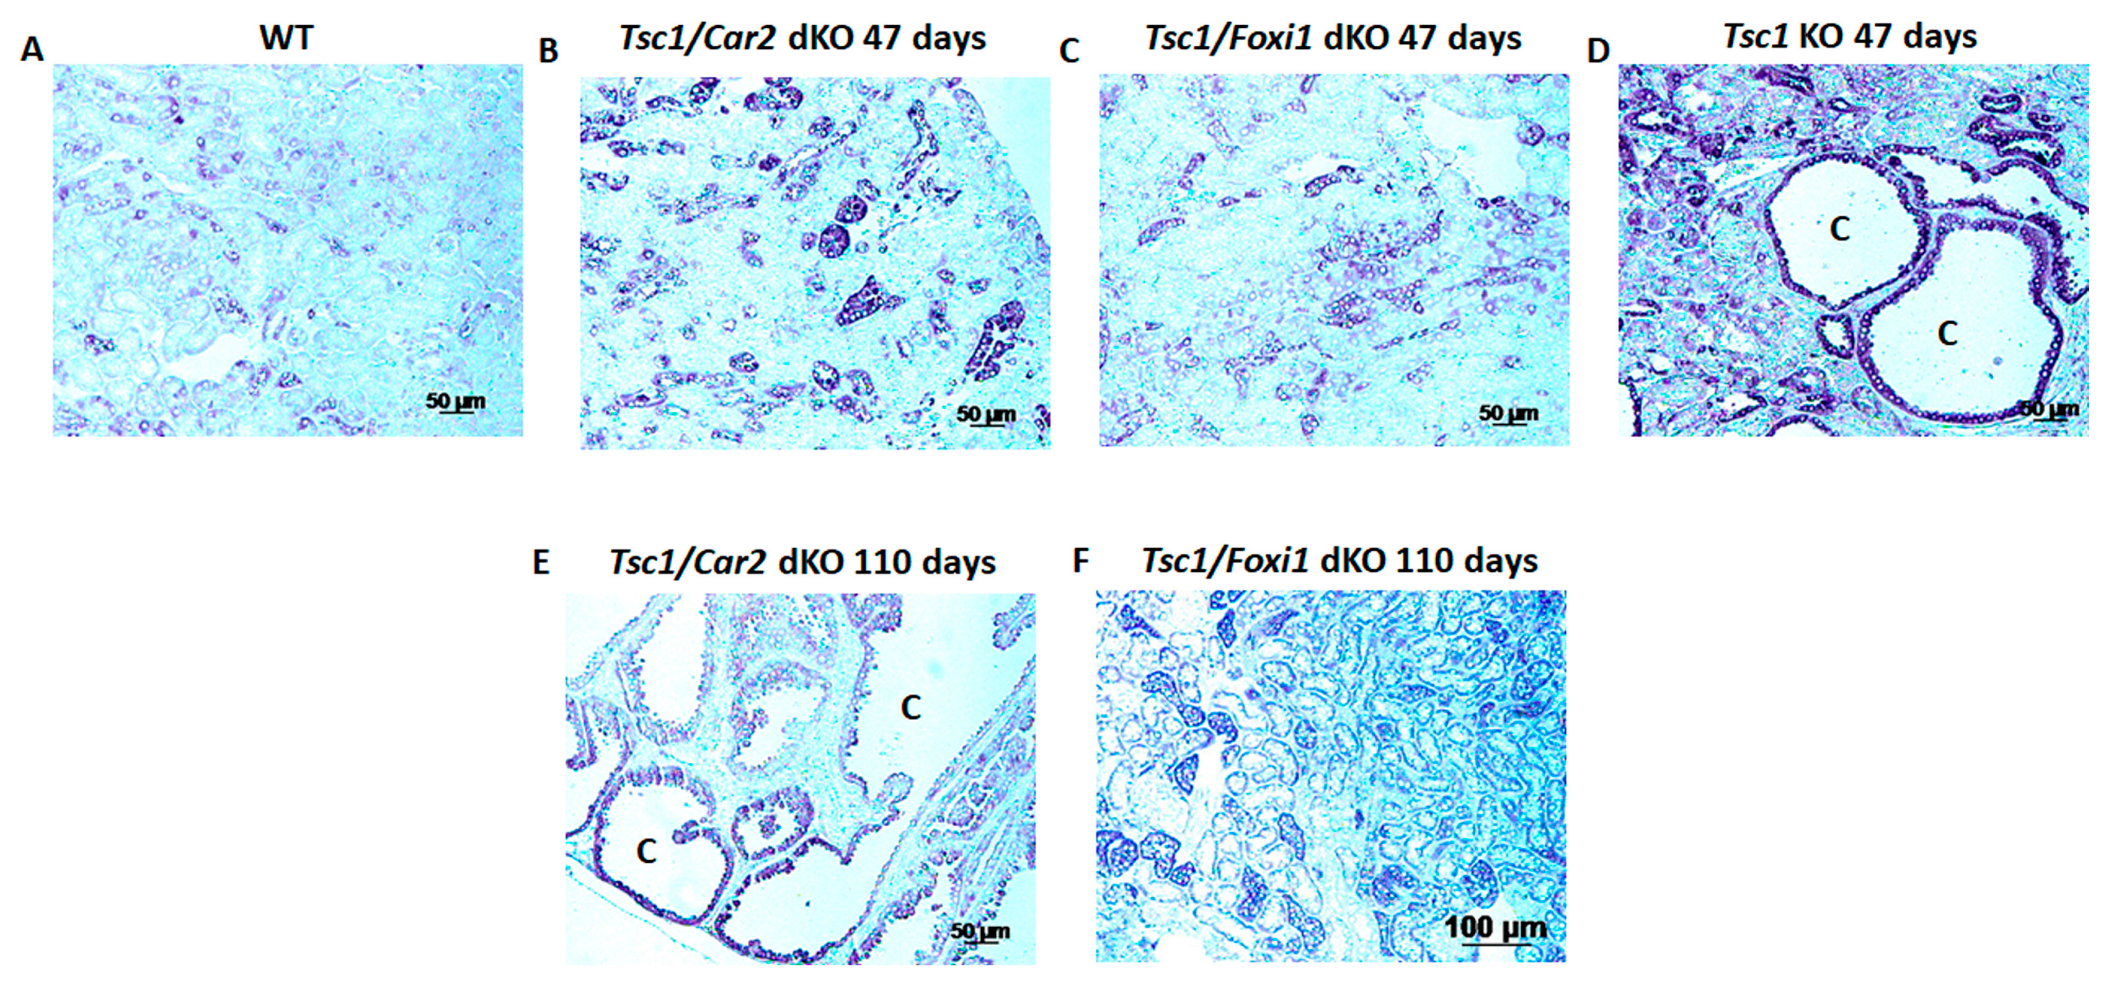
2.1. Effect of Car2 Deficiency on Renal Cystogenesis in Tsc1 KO Mice

The number of A-IC cells decreases significantly in the kidneys of Car2-deficient mice [30,31]. This was confirmed by significant reductions in the expression levels of markers of both A-IC and B-IC cells (e.g., SLC26A4, SLC26A7, and H+-ATPase) [30,31,32]. In contrast, the ablation of Tsc1 in the principal cells (PCs) of the renal-collecting duct leads to substantial expansion of A-IC cells in the epithelium of renal cysts [9,10]. Based on the above, we generated Tsc1/Car2 dKO mice, which showed a significant reduction in the cyst burden at 47 days of age [9]. In this present study, we examined the impact of aging on the kidney cyst burden in Tsc1/Car2 dKO mice and included age-matched Tsc1/Foxi1 dKO mice. The histology of kidneys of WT, Tsc1/Car2 dKO, Tsc1/Foxi1 dKO, and Tsc1 KO mice at 47 days of age are shown in Figure 1A–D. The results were further compared to Tsc1/Foxi1 dKO mice at 110 days of age, as shown in Figure 1F. Our results indicate that the kidney cysts were significantly smaller and less frequent in 47-day-old Tsc1/Car2 dKO mice compared to age-matched Tsc1 KO mice. The Tsc1/Car2 dKO mice displayed significant cyst burden at 110 days of age when compared to 47-day-old Tsc1 KO mice (Figure 1B,D). In contrast, the Tsc1/Foxi1 dKO mice displayed a complete absence of cyst formation at both 47 and 110 days of age (Figure 1C,F). The life span of Tsc1 KO mice, which is less than 60 days, did not allow for direct comparison of cyst burden to that of 110-day-old Tsc1/Car2 dKO mice.

2.2. Comparison of the Markers of A-IC Cells and Principal Cells (PCs) in the Kidneys of Tsc1 KO and Tsc1/Car2 dKO Mice

The examination of renal cysts in Tsc1 KO mice revealed the predominance of proliferatively active A-IC cells in the cystic epithelium [9,10]. To determine if such an imbalance in favor of A-IC cells also occurs in the kidneys of Tsc1/Car2 dKO mice, we examined the renal expression and localization of A-IC cells and PC markers, H+-ATPase, and Aquaporin 2 (AQP2), respectively. The results of double immunofluorescence labeling with H+-ATPase and AQP2 antibodies in WT, Tsc1 KO, and Tsc1/Car2 dKO mice at 47 days and Tsc1/Car2 dKO mice at 110 days of age are depicted in Figure 2. The H+-ATPase and AQP2 double-labeling images in WT mice are depicted in Figure 2A–C. The tubular epithelium of renal cysts in Tsc1 KO mice showed a predominant and widespread labeling with H+-ATPase on their apical membrane and a paucity of AQP2 labeled cells (Figure 2D–F). The labeling at 47 days of age in Tsc1/Car2 dKO mice showed few nascent cysts, which, compared to WT collecting ducts, had a proportion of H+-ATPase staining cells (Figure 2G–I). The labeling in Tsc1/Car2 dKO mice at 110 days of age is shown in Figure 2J–L and demonstrates an almost universal labeling with H+-ATPase on the apical membrane of kidney cysts with a few cells that show basolateral staining with AQP2.

2.3. The Effect of Car2 Gene Ablation on the Activation of mTORC1 in Tsc1 KO Mice

The activation of mTORC1 is paramount to the pathology of the disease in TSC [1,14,33,34]. Therefore, we compared the activation of mTORC1 in the kidneys of WT, Tsc1/Car2 dKO, Tsc1/Foxi1 dKO, and Tsc1 KO mice (Figure 3). Phosphorylation of S6 was used as a measure of mTORC1 activation. The examination of kidneys of 47 and 110-day-old Tsc1/Car2 dKO mice revealed enhanced S6 kinase staining in Tsc1/Car2 dKO mice compared to those of WT mice (Figure 3A,B,E). Our results further indicate that the activation of mTORC1 becomes more widespread in the kidneys of 110-day-old Tsc1/Car2 dKO mice as the process of cystogenesis progresses (Figure 3E) when compared to Tsc1 KO mice (Figure 3D).
An additional comparison of kidneys from time-matched Tsc1/Foxi1 dKO and Tsc1/Car2 dKO mice for phospho-S6 levels revealed that while phospho-S6 staining remains comparably low in Tsc1/Foxi1 dKO mice at both 47 and 110 days of age, it showed a wider staining pattern in 110-day-old Tsc1/Car2 dKO mice (Figure 3C,E,F). These results confirm that the process of cystogenesis and associated hyperproliferation of A-IC cells in lining the cyst is significantly delayed when the Car2 gene is ablated in Tsc1 KO mice.

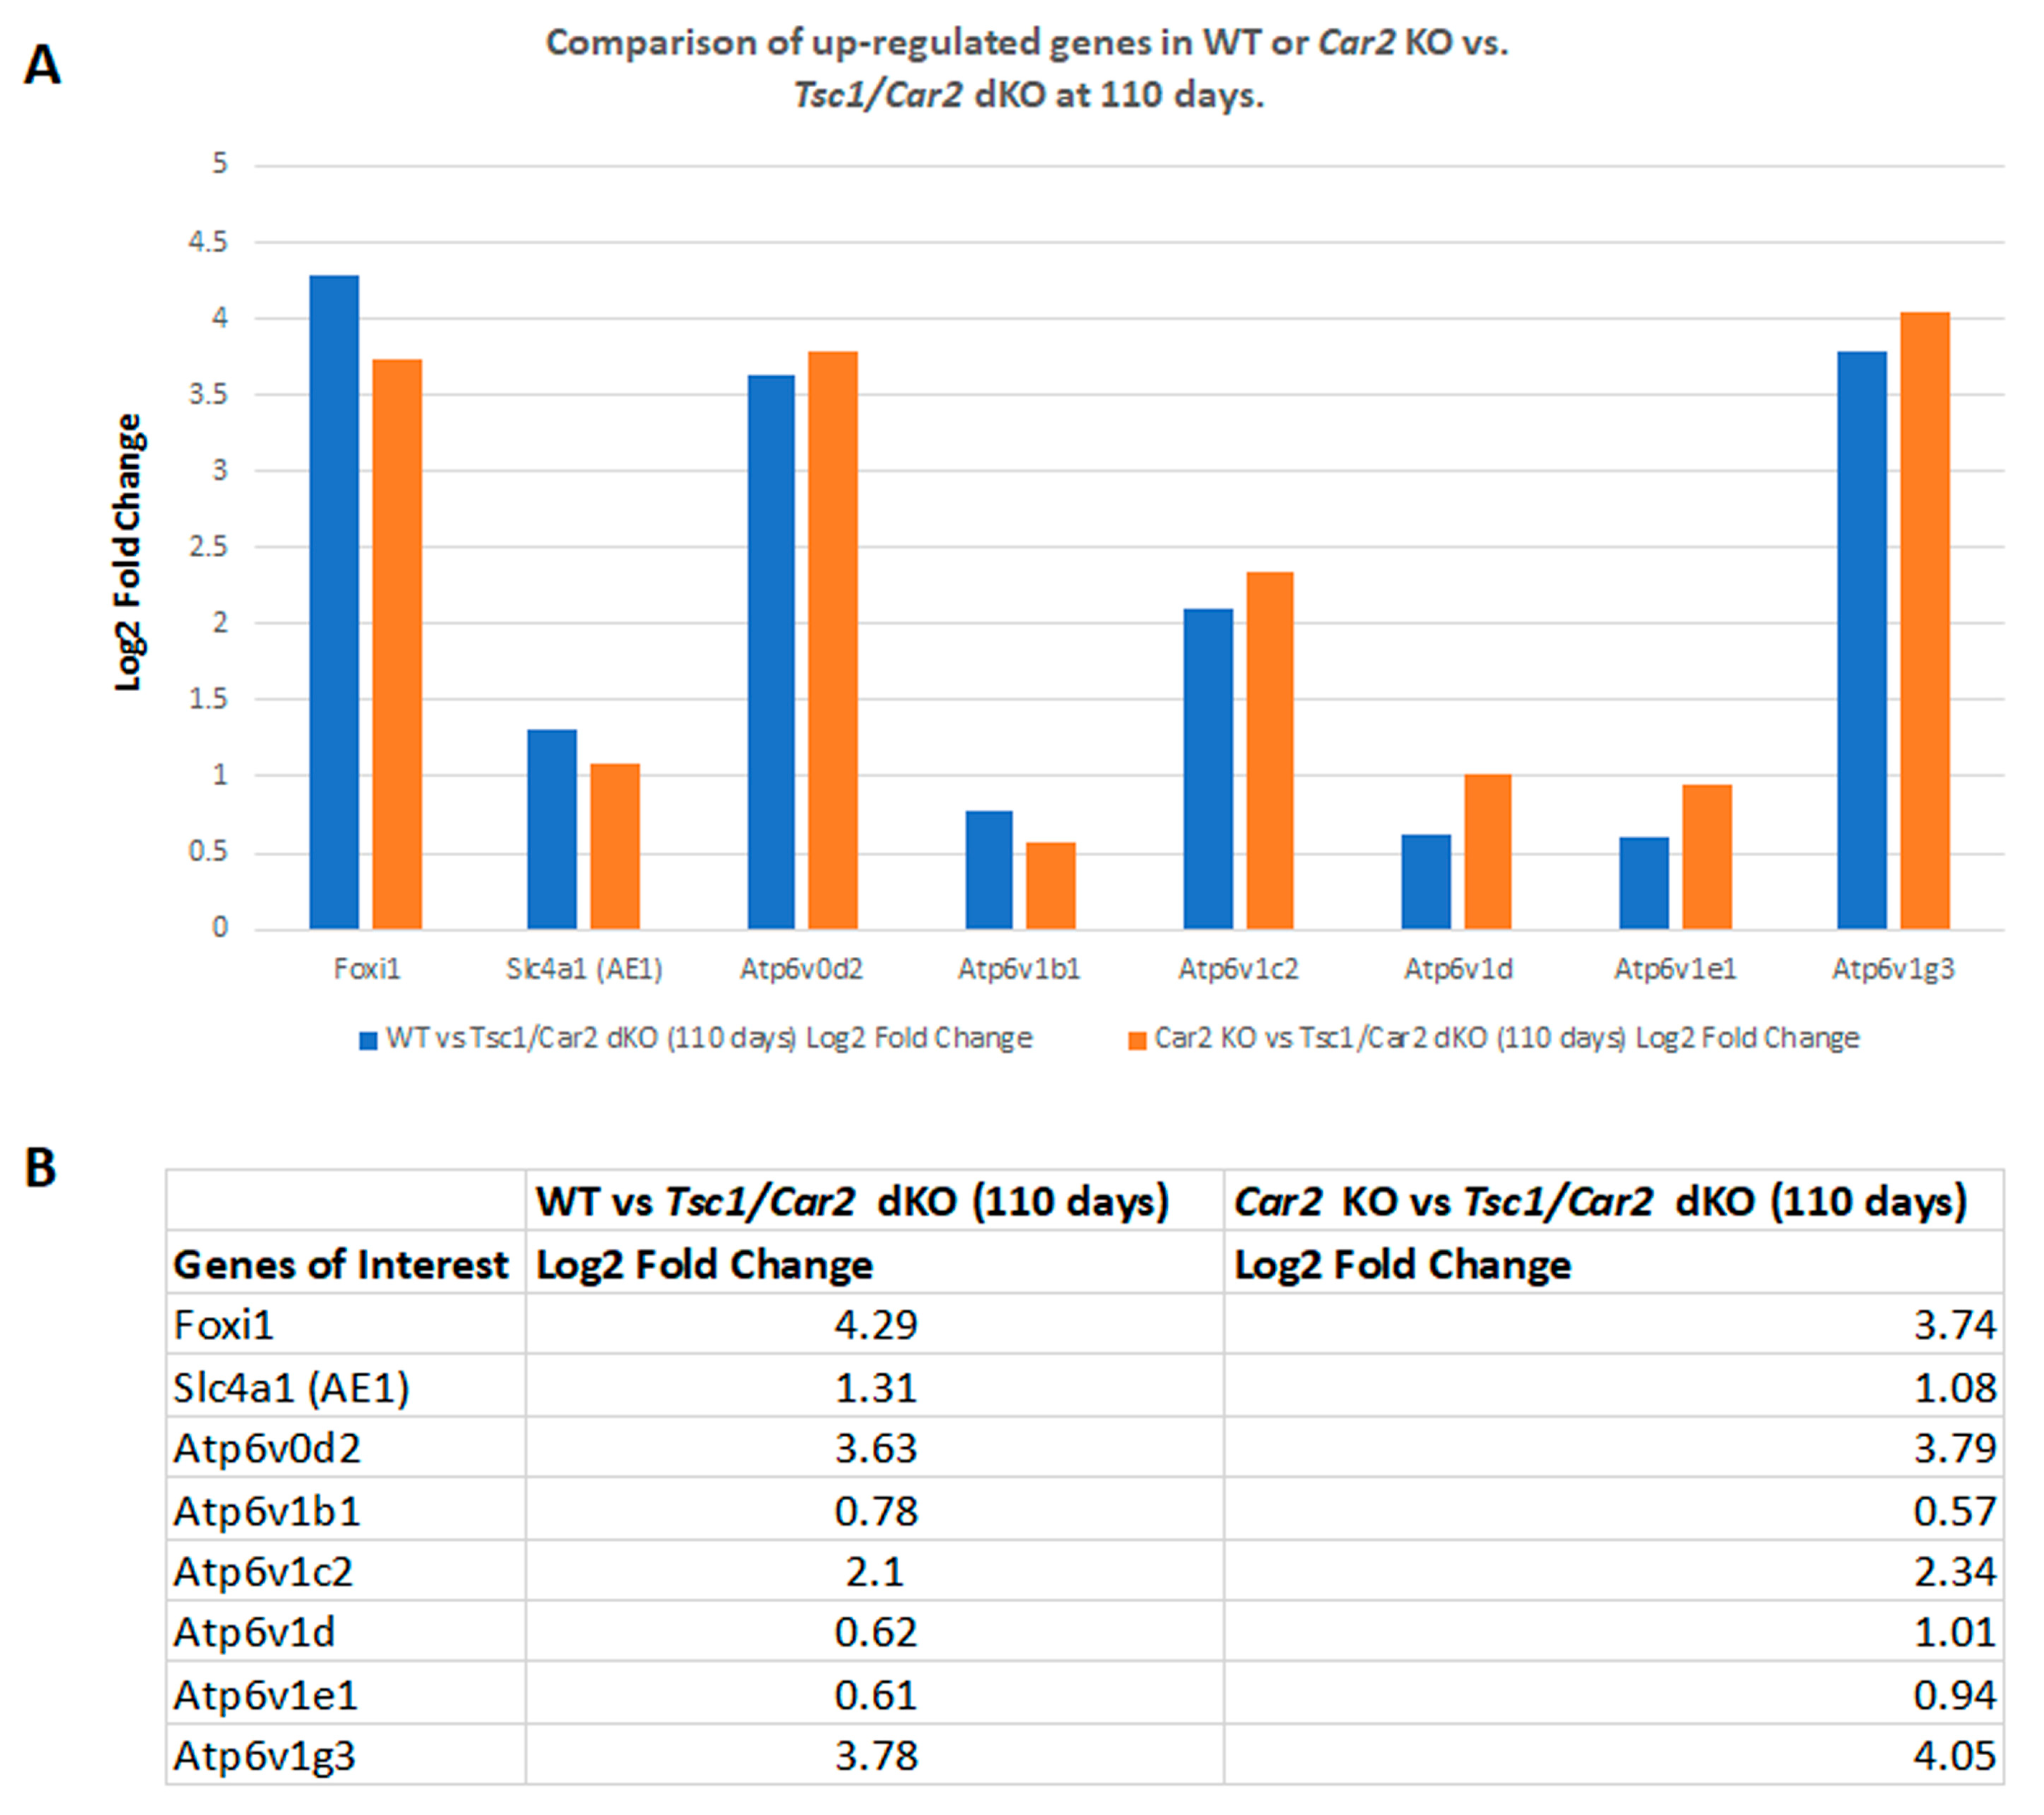
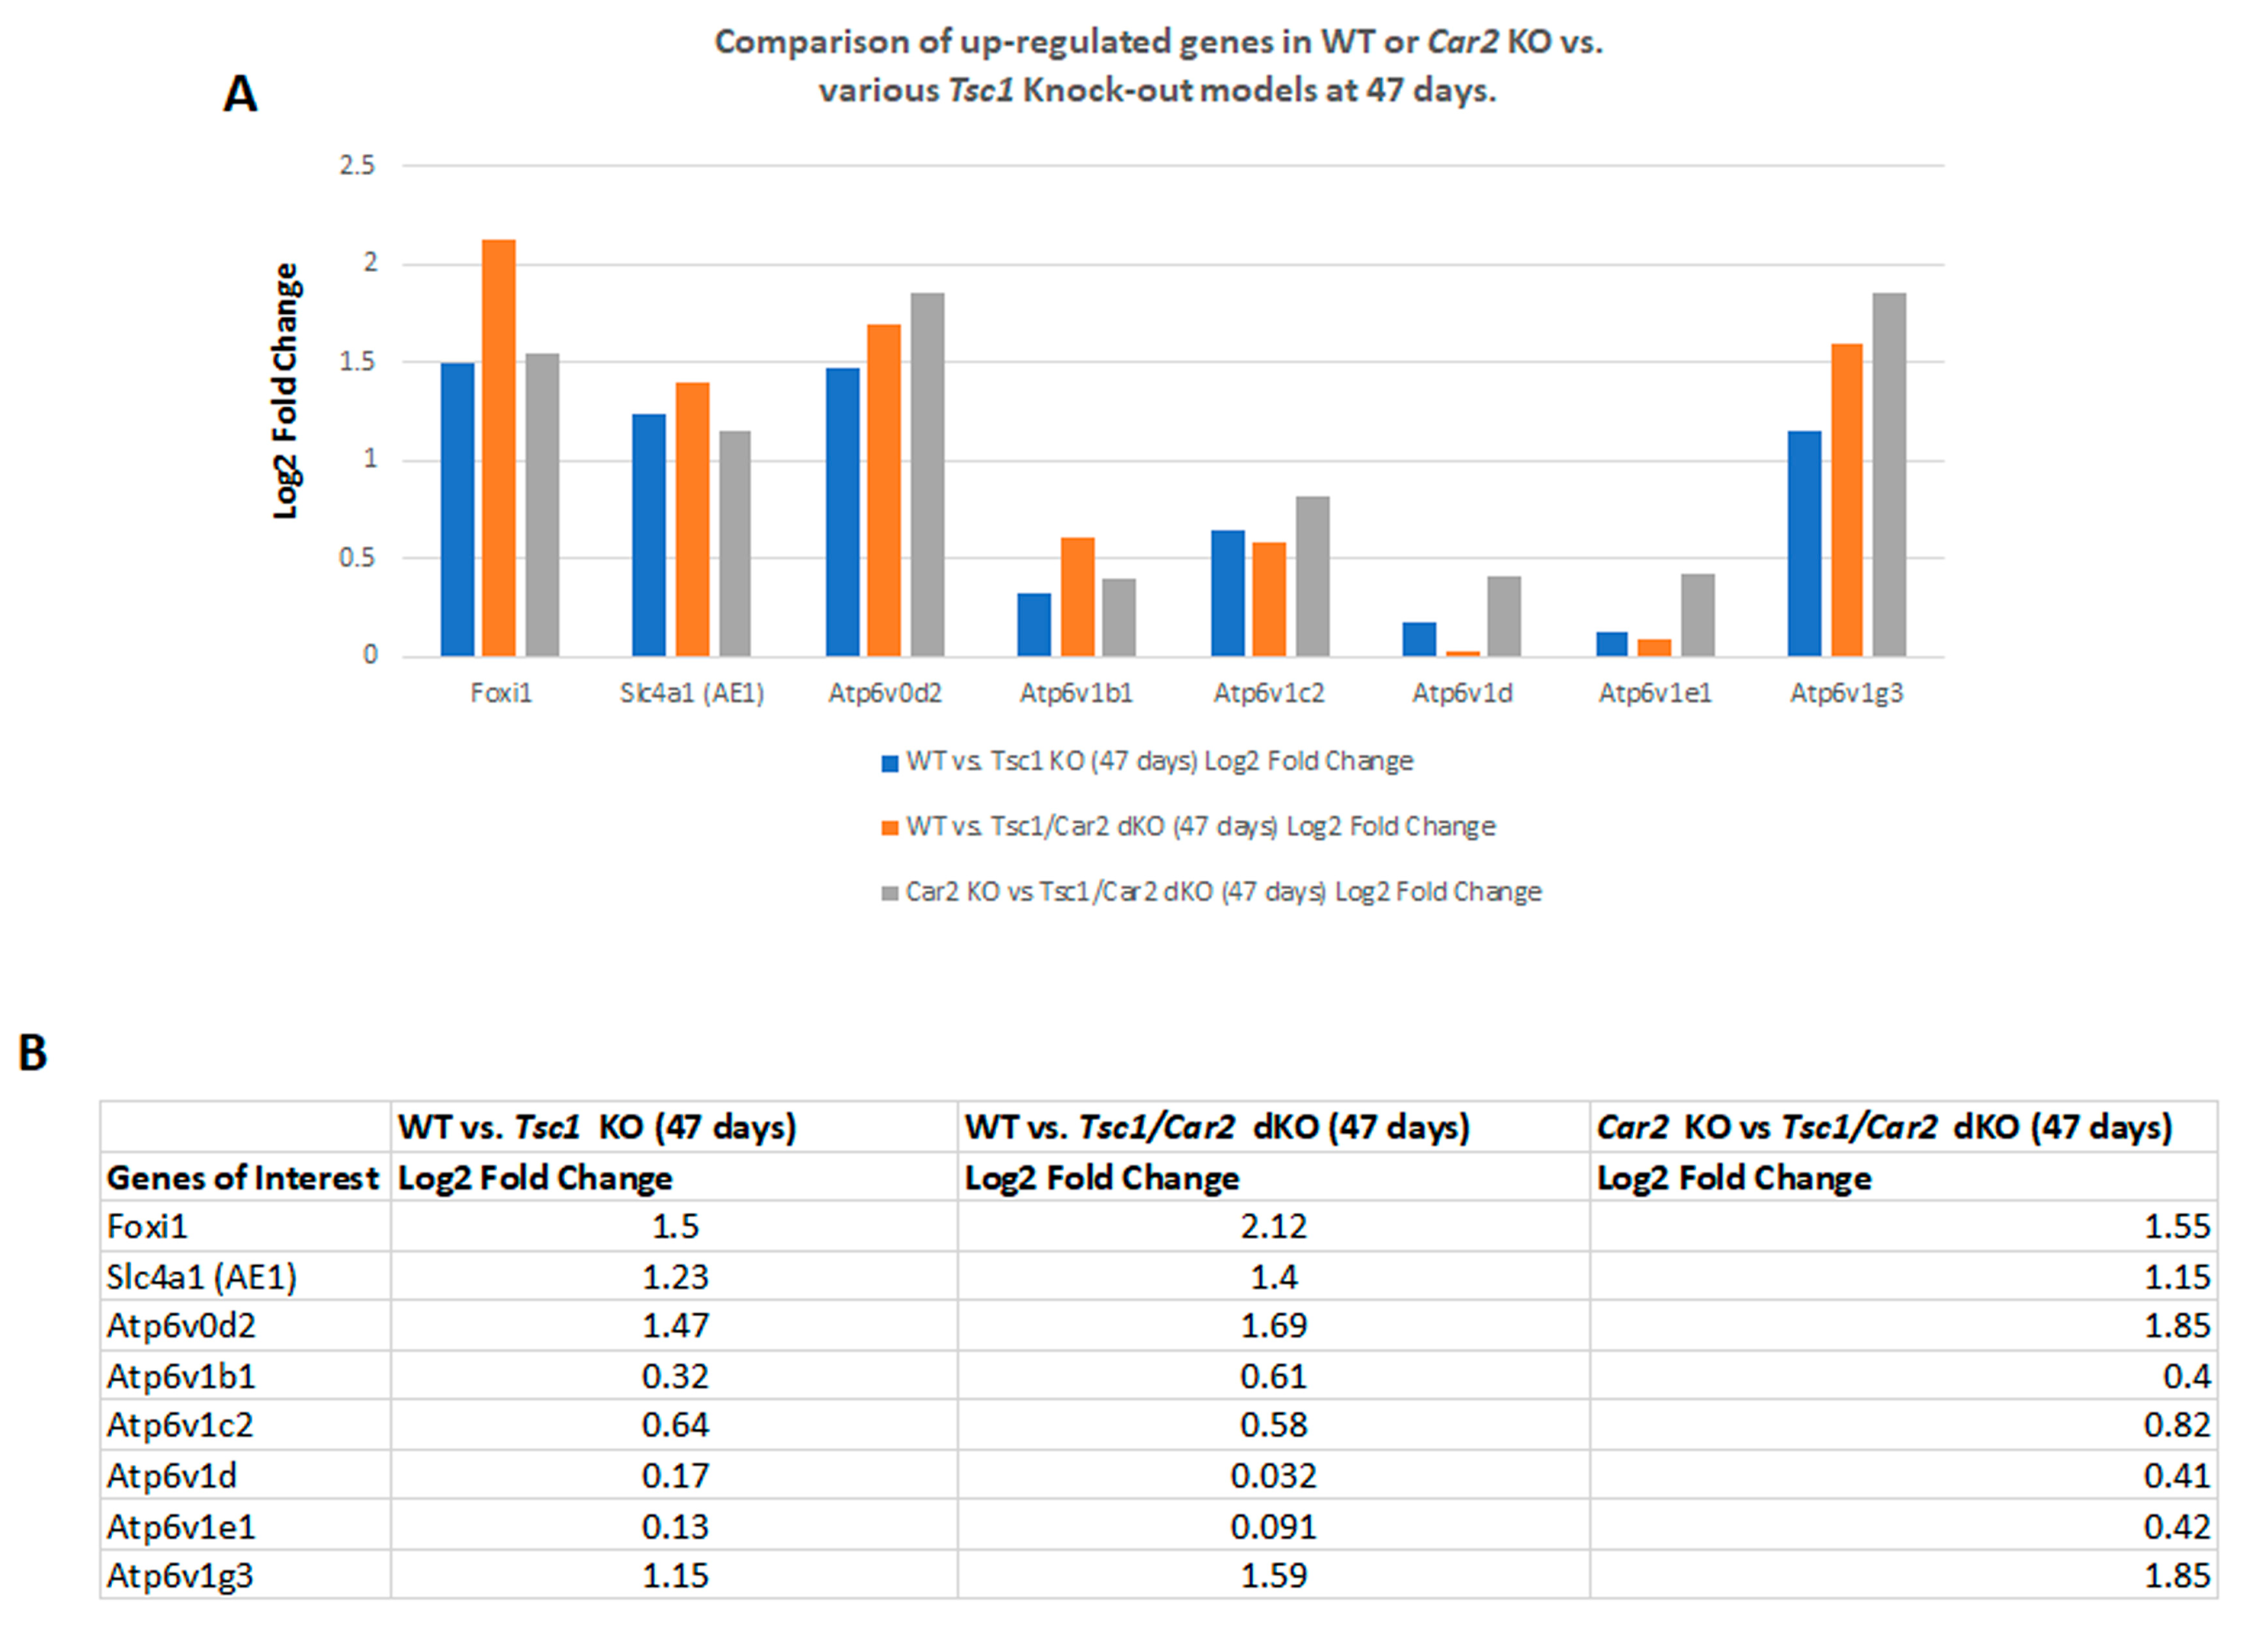
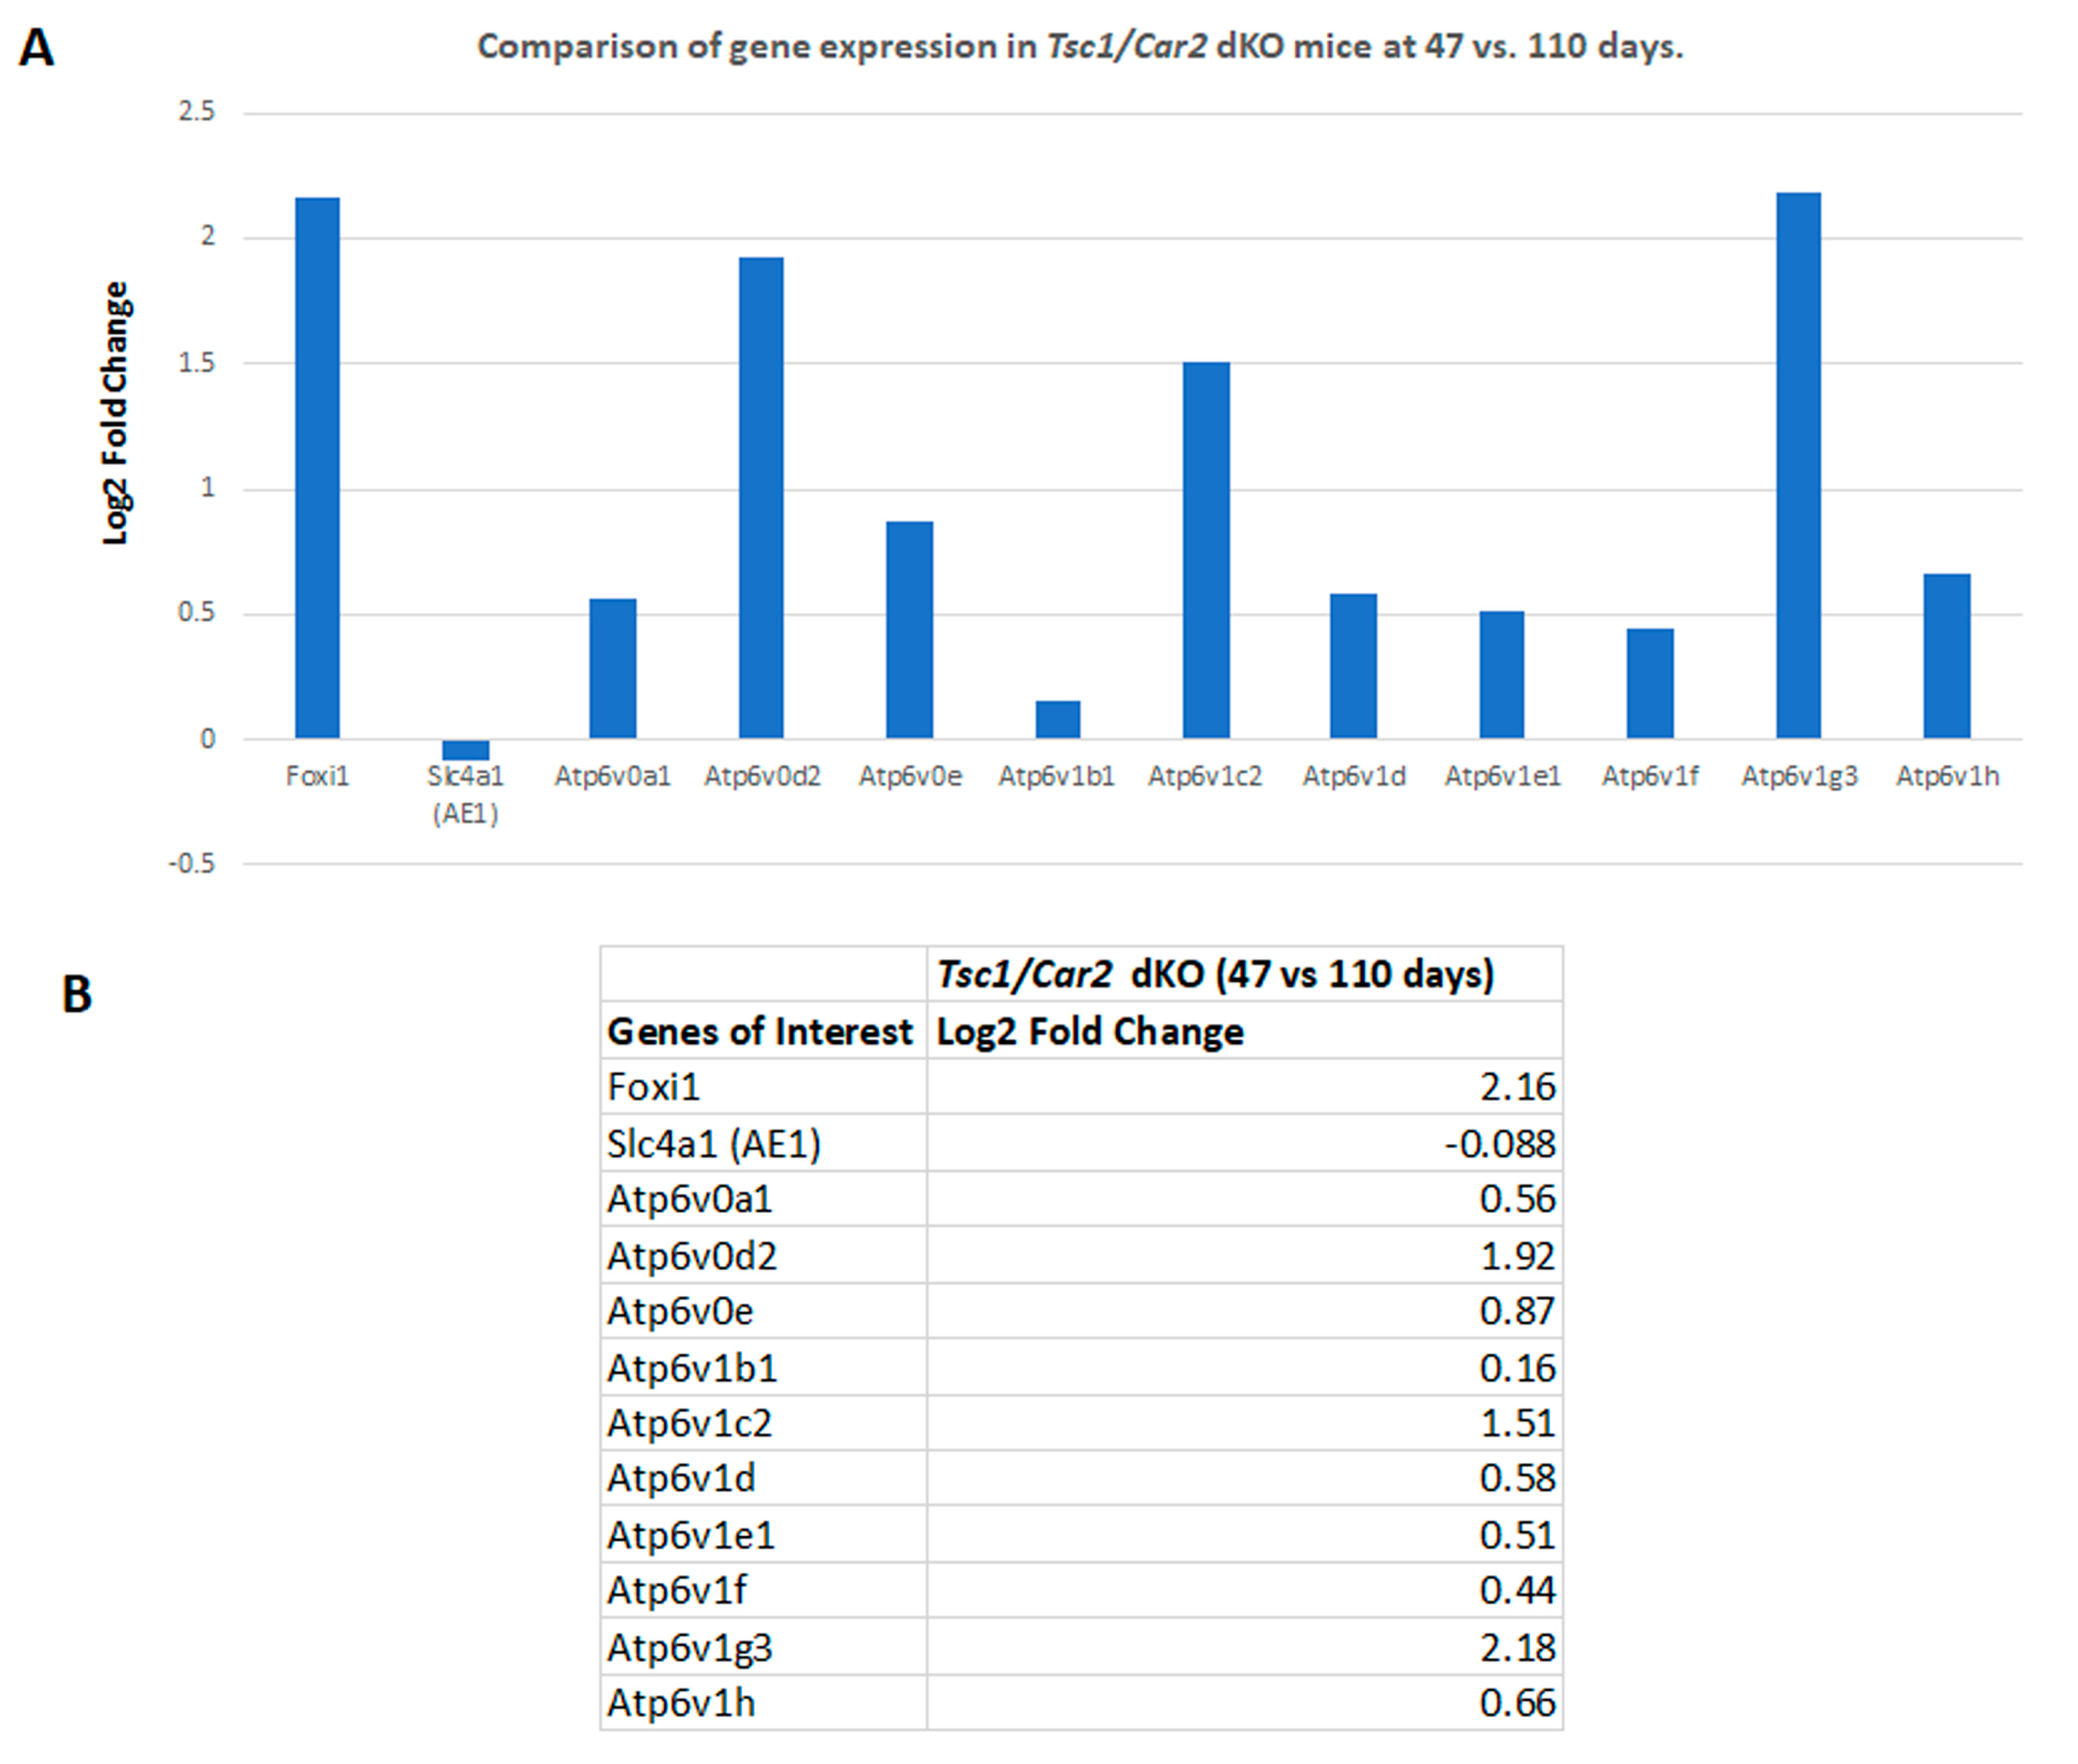
2.4. Changes in the Transcriptome of Tsc1/Car2 dKO Mice at 47 and 110 Days of Age

Our previous studies indicated that the process of cystogenesis in various mouse models of TSC is driven by the hyperproliferation of A-IC cells [9,10]. To determine the role of the reduction of A-IC expansion in the delayed cystogenic process in Tsc1/Car2 dKO mice, we compared the RNA-seq analysis results of WT mice to those of 47 and 110-day-old Tsc1/Car2 dKO mice. Comparison of WT and Tsc1/Car2 dKO mice gene expression profiles on days 47 and 110 (Figure 4 and Figure 5; Datasets S1 and S2) revealed that while the expression of A-IC cell-specific genes, such as Foxi1, Slc4a1, and certain subunits of H+-ATPase (e.g., Atp6v0d2, Atp6v1b1, and Atp6v1g3), are upregulated in the kidneys of both 47 and 110-day-old Tsc1/Car2 dKO mice, the magnitude of expression of Foxi1 along with several H+-ATPase subunits (e.g., Atp6v0a1, Atp6v0e, Atp6v1c2, Atp6v1d, and Atp6v1e1) are robustly elevated in the kidneys of 110-day-old Tsc1/Car2 dKO mice vs. 47-day-old Tsc1/Car2 dKO mice (Figure 6; Dataset S3). The comparison of the renal transcriptome of Car2 KO mice to those of the 47 and 110-day-old Tsc1/Car2 dKO mice (Dataset S4 and S5) also revealed an enhanced expression of transcripts that code for Foxi1, Slc4a1, and A-IC cell-associated H+-ATPase subunits (Figure 4 and Figure 5). In addition, the expression of Car12 and Car13 mRNA levels were significantly upregulated in 110-day-old Tsc1/Car2 dKO compared to time-matched Car2 KO mice. The most cogent point of these results is the progressive increase in the expression of A-IC cell-specific genes in the kidneys of Tsc1/Car2 dKO mice, as their cyst burden increases over time (day 47 vs. day 110 samples).

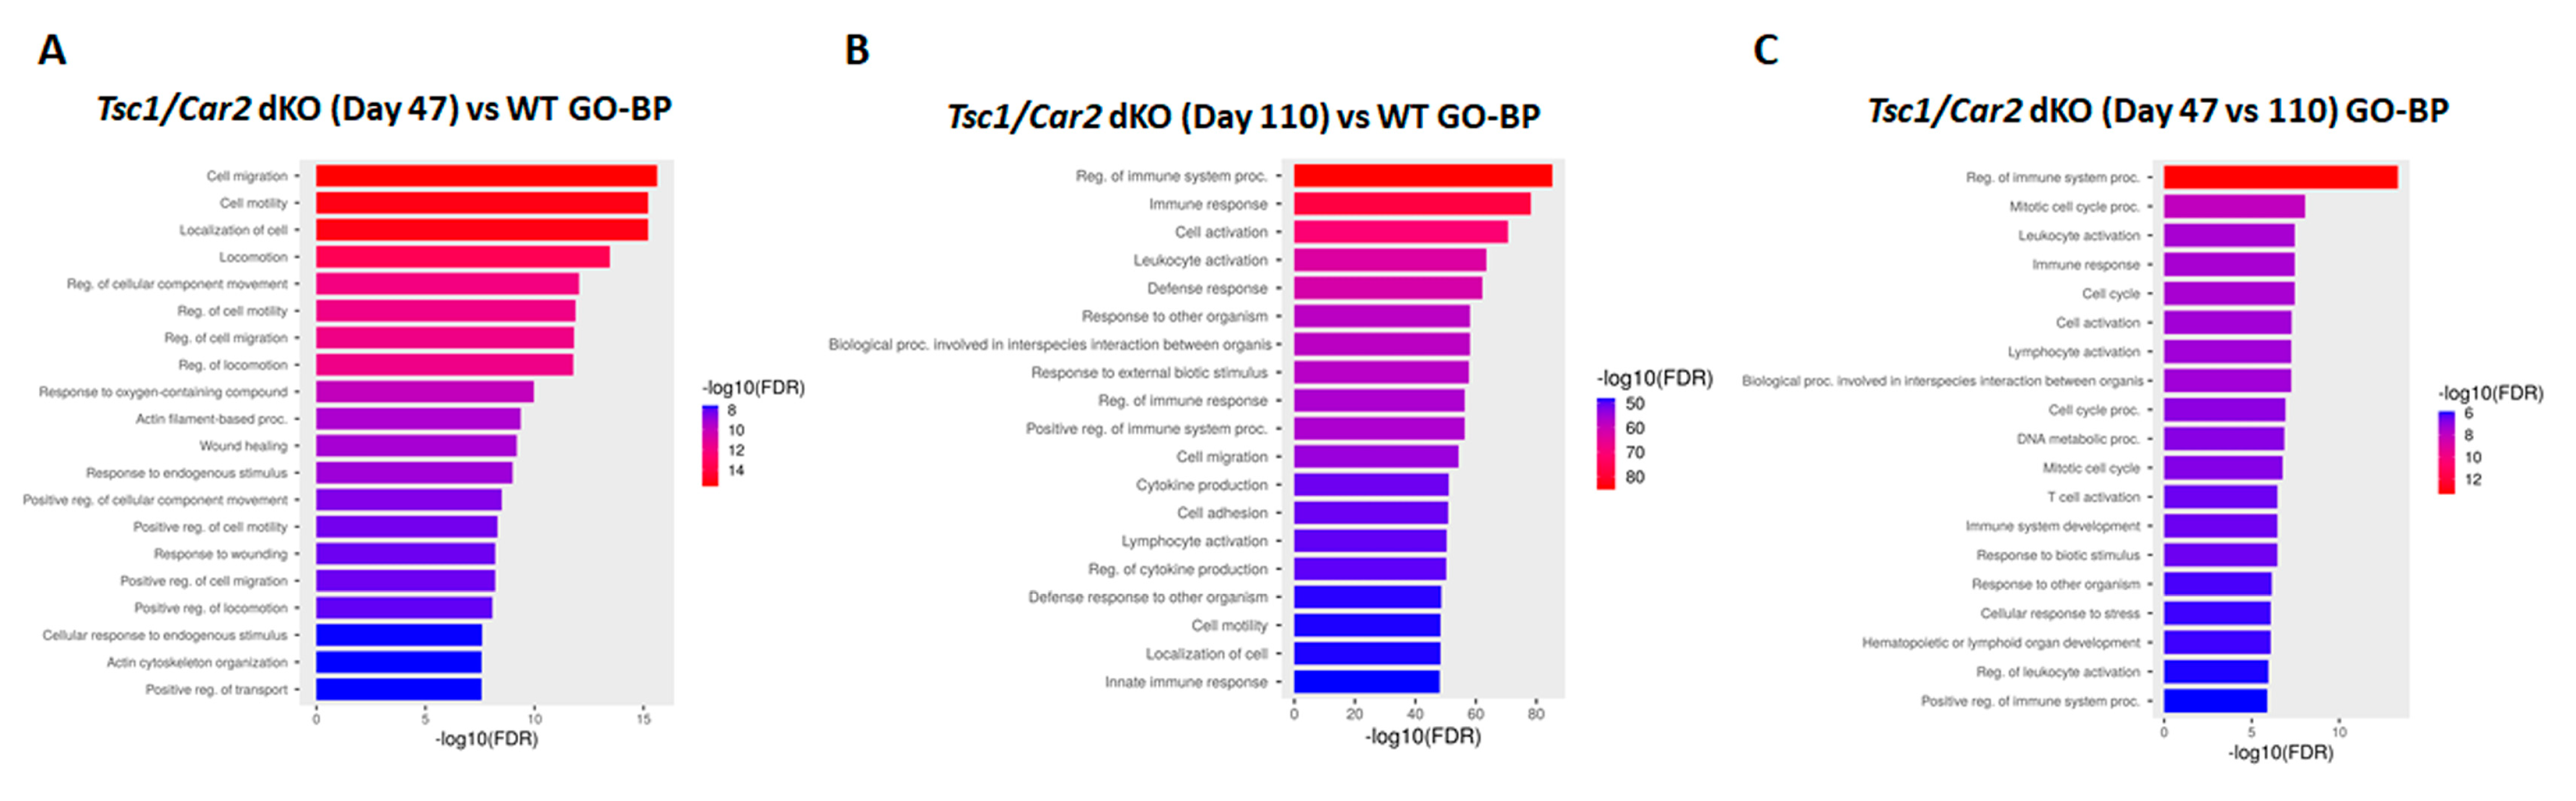
2.5. Enrichment Analysis of RNA-Seq Results

The results of RNA-seq studies were subjected to KEGG enrichment analysis, which examined differentially expressed transcripts (DET) and revealed the presence of 79, 156, and 23 enriched terms with a false discovery rate (FDR) of less than 0.05 for 47-day-old Tsc1/Car2 dKO vs. WT mice, 110-day-old Tsc1/Car2 dKO vs. WT mice, and 110-day-old dKO vs. 47-day-old dKO mice, respectively (Figure 7; Datasets S6–S8). The enriched terms included “collecting duct acid secretion, PI3K-AKT and MAPK signaling pathways” (Datasets S6–S8). The “cell cycle pathway” was only recognized as an enriched term in KEGG analyses of 110-day-old Tsc1/Car2 dKO vs. WT mice and 47-day-old vs. 110-day-old Tsc1/Car2 dKO mice (Datasets S6 and S9).
Gene ontology (GO) analyses revealed 939, 1000+, and 422 biological processes (GO-BP; Figure 8; Datasets S9–S11) and 128, 222, and 26 molecular function (GO-MF; Figure 9; Datasets S12–S14) terms for 47-day-old Tsc1/Car2 dKO vs. WT mice; 110-day-old Tsc1/Car2 dKO vs. WT mice, and 110-day-old dKO vs. 47-day-old dKO mice, respectively. The enrichment in cell cycle-associated terms was noticeable in both the 47 and 110-day-old Tsc1/Car2 dKO results. The GO-BP enrichment analysis revealed that the terms associated with cell cycle and autophagy were enriched in 110-day-old Tsc1/Car2 dKO mice compared to WT mice and 47-day-old Tsc1/Car2 dKO mice results (Figure 8; Datasets S9–S11). The GO-Molecular Function (GO-MF) analyses identified significant enrichment in terms associated with the regulation of growth factor receptor binding, kinase activity, and GTP-binding protein activity at both 47 days vs. WT and 110 days vs. WT (Figure 9; Datasets S12–S14).

3. Discussion

This current study investigates the ontogeny of kidney cysts in TSC by examining the role of A-IC cell expansion in this process. In this manuscript, we compare the alterations in the renal transcriptome of two mouse models of TSC cystogenesis that lead to the disappearance of A-IC cells and abrogated cyst formation (Tsc1/Foxi1I dKO) or significant reduction in A-IC cell numbers and delayed cystogenesis (Tsc1/Car2 dKO) to that of WT mice.
The mice with either Tsc1 or Tsc2 ablation in kidney PCs, Tsc1 inactivation in pericytes, or Tsc2+/KO exhibit numerous cortical cysts, which are overwhelmingly composed of hyperproliferating A-IC cells [7,9,10]. A similar cell phenotype in cystic epithelium was observed in humans with TSC, and in heterozygous Tsc2+/ko mice [9,10]. These observations point to the presence of a similar mechanism that drives the process of kidney cystogenesis in animal models of TSC, as well as in TSC patients. This cellular phenotype profoundly contrasts with kidney cysts in Autosomal Dominant Polycystic Kidney Disease (ADPKD), which do not show any evidence of A-IC cell presence in the cyst lining or their participation in cyst expansion. Rather, ADPKD mouse models or ADPKD patients demonstrate a cystogenic process that is entirely dependent on the expansion of principal cells [9,35].
Tsc1/Tsc2 with TCB1D7 are components of a trimolecular complex that regulates mTORC1 function by negatively regulating RHEB-GTPase, an activator of mTORC1 [4,36,37,38,39]. In the presence of mutations in Tsc1 or Tsc2 genes, RHEB-GTPase is no longer regulated by the TSC complex and can lead to mTORC1 hyperactivation [15,19,40]. In addition, the phosphorylation and inactivation of either Tsc1 or Tsc2 can mimic the phenotype exhibited because of mutations in Tsc1 or Tsc2 genes [38,41,42,43,44]. In our models, the hyperactivation of mTORC1, as evidenced by increased phospho-S6 levels, is prevalent in the cystic epithelium [9,10]. Furthermore, our results indicate that the phospho-S6 labeling in 47-day-old Tsc1/Car2 dKO mice is significantly reduced in comparison to time-matched WT mice, suggesting that Car2 deficiency and reduced A-IC cell numbers delay cyst formation in our model of TSC renal cystic disease. While distinct cell types (principal cells vs. A-IC cells) line the epithelium of ADPKD and TSC kidney cysts [9,35], in both cases, the cystic epithelia display significant mTORC1 activation [37,45,46,47]. However, the role of mTORC1 activation in cystogenesis in ADPKD remains uncertain [48]. In humans with TSC, the inhibition of mTORC1 blunts the overgrowth of kidney cells and the development of renal tumors and cysts in TSC [10,12,14,49]. However, the discontinuation of mTOR inhibitors causes the return of TSC cysts and tumors [50]. The inhibition of mTORC1 in humans with ADPKD did not show a significant beneficial impact on kidney function and cyst volume [48]. These results display contrasting effects of mTORC1 in cystogenesis in TSC vs. ADPKD. There are no therapeutic (druggable) molecular targets to alleviate kidney cysts or tumors in mice or humans with TSC.
The transcription factor Foxi1 is indispensable in the differentiation of collecting duct A-IC cells [51,52]. The expression of Foxi1 mRNA is significantly up-regulated in multiple mouse models of TSC [9,10]. Our published studies demonstrate that the knockout of Foxi1 in Tsc1 KO mice completely abrogates the development of renal cysts in these animals. Together, our studies suggest that the formation of renal cysts depends on the expansion of A-IC cells [9,10]. Previous studies indicate that Car2 deficiency in mice leads to significant reductions in the number of A-IC cells in mouse collecting ducts [30,31,32]. Based on the above, we examined if the severity of renal cystogenesis in TSC is moderated because of the absence of Car2 and the consequent reduction in the basal number of A-IC cells. Our data indicate that in Tsc1 KO mice, the ablation of Car2 delays but does not prevent renal cystogenesis (Figure 1). This is illustrated by progressively increased expression of Foxi1 and H+-ATPase components in the kidneys of 110-day-old vs. 47-day-old Tsc1/Car2 dKO mice when compared to their WT and Car2 KO counterparts. Enhanced expression of Car12 and Car13 in the kidneys of Tsc1/Car2 dKO mice raises the possibility that the compensatory upregulation of these carbonic anhydrase isoforms may have overcome the inhibitory impact of Car2 gene deletion on H+-ATPase function and A-IC cell proliferation.

4. Materials and Methods

4.1. Generation of Tsc1 KO, Car2 KO, Fox1 KO, Tsc1/Car2 dKO, and Tsc1/Foxi1 dKO Mice

The animal study protocols were approved by the Institutional Animal Care and Use Committees of both the University of New Mexico (protocol code 23-201353-HSC) and the Department of Veterans Affairs (protocol code 1621393-7).
All mice were housed and cared for in accordance with the Institutional Animal Care and Use Committees (IACUCs) at the University of New Mexico and Albuquerque Veterans Services. Lab personnel were IACUC-trained. Mice were housed in a 12 h light/dark cycle in temperature-controlled rooms with free access to food and water.
A variety of transgenic mice were utilized in this study. Details concerning generation and genotyping conditions for the following strains have been previously described: Tsc1 KO [9], Car2 KO [53], Foxi1 KO [51], Tsc1/Car2 dKO, Tsc1/Foxi1 dKO [9].

4.2. Immunohistochemical and Immunofluorescence Microscopy

Mice were euthanized at day 47 or day 110 with an overdose of pentobarbital sodium and kidneys were harvested and placed in 4% paraformaldehyde at 4 °C for 24 h. Kidneys were then switched to 70% ethanol, paraffin-embedded, placed on slides in 5 μm sections, and processed for H&E staining.
For pS6 staining, slides were heated for 2 h at 60 °C and underwent antigen retrieval utilizing R-Universal Epitope Recovery Buffer in a 2100 Retriever (EMS; Hatfield, PA, USA). Sections were blocked for 10 min with Bloxall blocking solution (Vector Labs; Newark, CA, USA) and incubated for 20 min at room temperature in 10% normal goat serum (Vector Labs). Slides were then incubated overnight in pS6 ribosomal protein (Ser235/236) antibody (Cell Signaling; Danvers, MA, USA) at 4 °C and stained with VIP utilizing the Vectastain Elite ABC kit according to directions (Vector Labs).
Similar to above, specimens undergoing immunofluorescence were subjected to antigen retrieval and blocked in a PBS solution containing 1% BSA, 0.2% powdered skim milk, and 0.3% Triton X-100 for at least 60 min at room temperature before incubation with primary antibodies overnight at 4 °C. Afterward, slides were washed in PBS 3 × 10 min, incubated in secondary Alexa Fluor antibodies (Invitrogen; Waltham, MA, USA) for 2 h at room temperature, and cover-slipped with Vectashield mounting media (Vector Labs).
Slides were examined and images obtained with a Zeiss LSM800 utilizing Zen software (version 3.4.91.00000).

4.3. RNA-Seq Analysis

The RNA-seq analyses were performed by Novogene Bioinformatics Technology Co., Ltd. (Beijing, China). Briefly, total RNA was isolated from kidneys of WT, Tsc1 KO, Car2 KO, Tsc1/Car2 dKO, Foxi1 KO, and Tsc1/Foxi1 dKO mice at 47 and 110 days of age. The isolated RNA samples were subjected to quality control analysis using an Agilent 2100 Bioanalyzer with RNA 6000 Nano Kits (Agilent, Santa Clara, CA, USA), subjected to poly A selection, fragmented, and reverse-transcribed to generate complementary DNA libraries that were utilized for sequencing analysis. Libraries were sequenced on the HiSeqTM 2500 system (Illumina, San Diego, CA, USA). Clean reads were aligned to a mouse reference genome using Hisat2 v2.0.4. Gene expression levels were determined using fragments per kilobase of transcript per million mapped fragments (FPKM) by HTSeq v0.9.1. The enrichment analysis of DET was performed using ShinyGO application (http://bioinformatics.sdstate.edu/go/, 19 February 2024).

4.4. Statistical Analysis

The significance of differences between the mean values +/− SD of multiple samples was examined using ANOVA. A “p” value of <0.05 was considered statistically significant.

5. Conclusions

These studies point out the importance of hyperproliferating A-IC cells that express both Tsc1 and Tsc2 proteins and therefore should have a functional TSC-RHEB-mTORC1 axis in TSC cystogenesis [9,10], a pattern that is also observed in the epithelium of renal cysts in TSC patients [11]. These studies focus on the process of renal cystogenesis in a mouse model of TSC renal cystic disease; however, additional TSC disease models that are available, such as heterozygote Tsc2 KO (Tsc2+/−) and other cell-specific knockout models, need to be examined in order to confirm the role of Car2 in TSC renal cystogenesis. These studies are underway; however, due to the prolonged duration of cyst development, they could not be included in this current study. The most pertinent point of this study is the confirmation of the role of A-IC cells in TSC cystogenesis. The observation that genetic manipulations reduce the number of intercalated cells, for example, the ablation of the Car2 gene, suggests a new approach that can complement the current mTORC1 inhibition approach that is used for the treatment of TSC renal cystic disease. The role of Car2 inhibitors in combination with mTORC1 inhibitors (Rapamycin analogs) or as a standalone therapy needs to be further examined. These studies need to be conducted in both the Tsc1 KO as well as other TSC models, such as Tsc2+/− mice.

Supplementary Materials

The following supporting information can be downloaded at: https://www.mdpi.com/article/10.3390/ijms25094772/s1.

Author Contributions

Conceptualization, M.S. and K.Z.; methodology, S.B., K.Z. and M.B.; validation, S.B., K.Z. and M.S.; formal analysis, S.B., K.Z. and M.S.; investigation, S.B., K.Z. and M.S.; writing—original draft preparation, M.S.; writing—review and editing, K.Z. and S.B.; visualization, S.B. and K.Z.; supervision, M.S.; funding acquisition, M.S. All authors have read and agreed to the published version of the manuscript.

Funding

This research was funded by the United States Veterans Administration Department Merit Review Award (grant number 2I01BX001000-10), Dialysis Clinic Inc. (grant number DCI C-4149), and the National Institutes of Health (grant number NIH/NHLBIT32HL007736). Manoocher Soleimani is a Senior Clinician Scientist Investigator with the Department of Veterans Health Administration. This research made use of the Fluorescence Microscopy and Cell Imaging Shared Resource, which is supported partially by University of New Mexico (UNM) Comprehensive Cancer Center Support Grant NCI P30CA118100.

Institutional Review Board Statement

The animal study protocol was approved by the Institutional Animal Care and Use Committee of the University of New Mexico (protocol code 23-201353-HSC) and date of approval was 15 December 2023).

Data Availability Statement

All datasets are included in the Supplementary Materials and described in the text of the manuscript.

Conflicts of Interest

The authors declare no conflicts of interest. The funders had no role in the design of this study; in the collection, analyses, or interpretation of the data; in the writing of the manuscript; or in the decision to publish the results.

References

  1. Crino, P.B.; Nathanson, K.L.; Henske, E.P. The tuberous sclerosis complex. N. Engl. J. Med. 2006, 355, 1345–1356. [Google Scholar] [CrossRef] [PubMed]
  2. Sampson, J.R.; Harris, P.C. The molecular genetics of tuberous sclerosis. Hum. Mol. Genet. 1994, 3, 1477–1480. [Google Scholar] [CrossRef] [PubMed]
  3. Lam, H.C.; Siroky, B.J.; Henske, E.P. Renal disease in tuberous sclerosis complex: Pathogenesis and therapy. Nat. Rev. Nephrol. 2018, 14, 704–716. [Google Scholar] [CrossRef] [PubMed]
  4. Henske, E.P.; Jozwiak, S.; Kingswood, J.C.; Sampson, J.R.; Thiele, E.A. Tuberous sclerosis complex. Nat. Rev. Dis. Primers 2016, 2, 16035. [Google Scholar] [CrossRef] [PubMed]
  5. Rakowski, S.K.; Winterkorn, E.B.; Paul, E.; Steele, D.J.; Halpern, E.F.; Thiele, E.A. Renal manifestations of tuberous sclerosis complex: Incidence, prognosis, and predictive factors. Kidney Int. 2006, 70, 1777–1782. [Google Scholar] [CrossRef] [PubMed]
  6. Bissler, J.J.; Batchelor, D.; Kingswood, J.C. Progress in Tuberous Sclerosis Complex Renal Disease. Crit. Rev. Oncog. 2022, 27, 35–49. [Google Scholar] [CrossRef] [PubMed]
  7. Onda, H.; Lueck, A.; Marks, P.W.; Warren, H.B.; Kwiatkowski, D.J. Tsc2(+/-) mice develop tumors in multiple sites that express gelsolin and are influenced by genetic background. J. Clin. Investig. 1999, 104, 687–695. [Google Scholar] [CrossRef] [PubMed]
  8. Wilson, C.; Bonnet, C.; Guy, C.; Idziaszczyk, S.; Colley, J.; Humphreys, V.; Maynard, J.; Sampson, J.R.; Cheadle, J.P. Tsc1 haploinsufficiency without mammalian target of rapamycin activation is sufficient for renal cyst formation in Tsc1+/− mice. Cancer Res. 2006, 66, 7934–7938. [Google Scholar] [CrossRef]
  9. Barone, S.; Zahedi, K.; Brooks, M.; Henske, E.P.; Yang, Y.; Zhang, E.; Bissler, J.J.; Yu, J.J.; Soleimani, M. Kidney intercalated cells and the transcription factor FOXi1 drive cystogenesis in tuberous sclerosis complex. Proc. Natl. Acad. Sci. USA 2021, 118, e2020190118. [Google Scholar] [CrossRef]
  10. Bissler, J.J.; Zadjali, F.; Bridges, D.; Astrinidis, A.; Barone, S.; Yao, Y.; Redd, J.R.; Siroky, B.J.; Wang, Y.; Finley, J.T.; et al. Tuberous sclerosis complex exhibits a new renal cystogenic mechanism. Physiol. Rep. 2019, 7, e13983. [Google Scholar] [CrossRef]
  11. Bonsib, S.M.; Boils, C.; Gokden, N.; Grignon, D.; Gu, X.; Higgins, J.P.; Leroy, X.; McKenney, J.K.; Nasr, S.H.; Phillips, C.; et al. Tuberous sclerosis complex: Hamartin and tuberin expression in renal cysts and its discordant expression in renal neoplasms. Pathol. Res. Pract. 2016, 212, 972–979. [Google Scholar] [CrossRef] [PubMed]
  12. Bissler, J.J.; Christopher Kingswood, J. Renal manifestation of tuberous sclerosis complex. Am. J. Med. Genet. C Semin. Med. Genet. 2018, 178, 338–347. [Google Scholar] [CrossRef] [PubMed]
  13. Gallo-Bernal, S.; Kilcoyne, A.; Gee, M.S.; Paul, E. Cystic kidney disease in tuberous sclerosis complex: Current knowledge and unresolved questions. Pediatr. Nephrol. 2023, 38, 3253–3264. [Google Scholar] [CrossRef] [PubMed]
  14. Henske, E.P.; Rasooly, R.; Siroky, B.; Bissler, J. Tuberous sclerosis complex, mTOR, and the kidney: Report of an NIDDK-sponsored workshop. Am. J. Physiol. Renal Physiol. 2014, 306, F279–F283. [Google Scholar] [CrossRef]
  15. Fingar, D.C.; Blenis, J. Target of rapamycin (TOR): An integrator of nutrient and growth factor signals and coordinator of cell growth and cell cycle progression. Oncogene 2004, 23, 3151–3171. [Google Scholar] [CrossRef]
  16. Schmelzle, T.; Hall, M.N. TOR, a central controller of cell growth. Cell 2000, 103, 253–262. [Google Scholar] [CrossRef] [PubMed]
  17. Yang, Q.; Guan, K.L. Expanding mTOR signaling. Cell Res. 2007, 17, 666–681. [Google Scholar] [CrossRef] [PubMed]
  18. Fingar, D.C.; Salama, S.; Tsou, C.; Harlow, E.; Blenis, J. Mammalian cell size is controlled by mTOR and its downstream targets S6K1 and 4EBP1/eIF4E. Genes Dev. 2002, 16, 1472–1487. [Google Scholar] [CrossRef] [PubMed]
  19. Ogmundsdottir, M.H.; Heublein, S.; Kazi, S.; Reynolds, B.; Visvalingam, S.M.; Shaw, M.K.; Goberdhan, D.C. Proton-assisted amino acid transporter PAT1 complexes with Rag GTPases and activates TORC1 on late endosomal and lysosomal membranes. PLoS ONE 2012, 7, e36616. [Google Scholar] [CrossRef]
  20. Sancak, Y.; Bar-Peled, L.; Zoncu, R.; Markhard, A.L.; Nada, S.; Sabatini, D.M. Ragulator-Rag complex targets mTORC1 to the lysosomal surface and is necessary for its activation by amino acids. Cell 2010, 141, 290–303. [Google Scholar] [CrossRef]
  21. Zoncu, R.; Bar-Peled, L.; Efeyan, A.; Wang, S.; Sancak, Y.; Sabatini, D.M. mTORC1 senses lysosomal amino acids through an inside-out mechanism that requires the vacuolar H(+)-ATPase. Science 2011, 334, 678–683. [Google Scholar] [CrossRef] [PubMed]
  22. Bar-Peled, L.; Sabatini, D.M. Regulation of mTORC1 by amino acids. Trends Cell Biol. 2014, 24, 400–406. [Google Scholar] [CrossRef]
  23. Forgac, M. Vacuolar ATPases: Rotary proton pumps in physiology and pathophysiology. Nat. Rev. Mol. Cell Biol. 2007, 8, 917–929. [Google Scholar] [CrossRef] [PubMed]
  24. Hinton, A.; Bond, S.; Forgac, M. V-ATPase functions in normal and disease processes. Pflügers Arch. Eur. J. Physiol. 2009, 457, 589–598. [Google Scholar] [CrossRef] [PubMed]
  25. Chung, C.Y.; Shin, H.R.; Berdan, C.A.; Ford, B.; Ward, C.C.; Olzmann, J.A.; Zoncu, R.; Nomura, D.K. Covalent targeting of the vacuolar H(+)-ATPase activates autophagy via mTORC1 inhibition. Nat. Chem. Biol. 2019, 15, 776–785. [Google Scholar] [CrossRef] [PubMed]
  26. Brown, D.; Paunescu, T.G.; Breton, S.; Marshansky, V. Regulation of the V-ATPase in kidney epithelial cells: Dual role in acid-base homeostasis and vesicle trafficking. J. Exp. Biol. 2009, 212, 1762–1772. [Google Scholar] [CrossRef]
  27. Gong, F.; Alzamora, R.; Smolak, C.; Li, H.; Naveed, S.; Neumann, D.; Hallows, K.R.; Pastor-Soler, N.M. Vacuolar H+-ATPase apical accumulation in kidney intercalated cells is regulated by PKA and AMP-activated protein kinase. Am. J. Physiol. Renal Physiol. 2010, 298, F1162–F1169. [Google Scholar] [CrossRef] [PubMed]
  28. Soleimani, M.; Rastegar, A. Pathophysiology of Renal Tubular Acidosis: Core Curriculum 2016. Am. J. Kidney Dis. 2016, 68, 488–498. [Google Scholar] [CrossRef]
  29. Barone, S.; Brooks, M.; Zahedi, K.; Holliday, L.S.; Bissler, J.; Yu, J.J.; Soleimani, M. Identification of an Electrogenic 2Cl(−)/H(+) Exchanger, ClC5, as a Chloride-Secreting Transporter Candidate in Kidney Cyst Epithelium in Tuberous Sclerosis. Am. J. Pathol. 2023, 193, 191–200. [Google Scholar] [CrossRef]
  30. Breton, S.; Alper, S.L.; Gluck, S.L.; Sly, W.S.; Barker, J.E.; Brown, D. Depletion of intercalated cells from collecting ducts of carbonic anhydrase II-deficient (CAR2 null) mice. Am. J. Physiol. 1995, 269, F761–F774. [Google Scholar] [CrossRef]
  31. Brion, L.P.; Suarez, C.; Saenger, P. Postnatal disappearance of type A intercalated cells in carbonic anhydrase II-deficient mice. Pediatr. Nephrol. 2001, 16, 477–481. [Google Scholar] [CrossRef] [PubMed]
  32. Sun, X.; Soleimani, M.; Petrovic, S. Decreased expression of Slc26a4 (Pendrin) and Slc26a7 in the kidneys of carbonic anhydrase II-deficient mice. Cell. Physiol. Biochem. 2008, 21, 95–108. [Google Scholar] [CrossRef] [PubMed]
  33. Kenerson, H.L.; Aicher, L.D.; True, L.D.; Yeung, R.S. Activated mammalian target of rapamycin pathway in the pathogenesis of tuberous sclerosis complex renal tumors. Cancer Res. 2002, 62, 5645–5650. [Google Scholar] [PubMed]
  34. Dixon, B.P.; Hulbert, J.C.; Bissler, J.J. Tuberous sclerosis complex renal disease. Nephron. Exp. Nephrol. 2011, 118, e15–e20. [Google Scholar] [CrossRef] [PubMed]
  35. Soleimani, M. Not all kidney cysts are created equal: A distinct renal cystogenic mechanism in tuberous sclerosis complex (TSC). Front. Physiol. 2023, 14, 1289388. [Google Scholar] [CrossRef] [PubMed]
  36. Dibble, C.C.; Elis, W.; Menon, S.; Qin, W.; Klekota, J.; Asara, J.M.; Finan, P.M.; Kwiatkowski, D.J.; Murphy, L.O.; Manning, B.D. TBC1D7 is a third subunit of the TSC1-TSC2 complex upstream of mTORC1. Mol. Cell 2012, 47, 535–546. [Google Scholar] [CrossRef] [PubMed]
  37. Garami, A.; Zwartkruis, F.J.; Nobukuni, T.; Joaquin, M.; Roccio, M.; Stocker, H.; Kozma, S.C.; Hafen, E.; Bos, J.L.; Thomas, G. Insulin activation of Rheb, a mediator of mTOR/S6K/4E-BP signaling, is inhibited by TSC1 and 2. Mol. Cell 2003, 11, 1457–1466. [Google Scholar] [CrossRef] [PubMed]
  38. Huang, J.; Manning, B.D. The TSC1-TSC2 complex: A molecular switchboard controlling cell growth. Biochem. J. 2008, 412, 179–190. [Google Scholar] [CrossRef] [PubMed]
  39. Inoki, K.; Li, Y.; Xu, T.; Guan, K.L. Rheb GTPase is a direct target of TSC2 GAP activity and regulates mTOR signaling. Genes Dev. 2003, 17, 1829–1834. [Google Scholar] [CrossRef]
  40. Kwiatkowski, D.J.; Manning, B.D. Tuberous sclerosis: A GAP at the crossroads of multiple signaling pathways. Hum. Mol. Genet. 2005, 14, R251–R258. [Google Scholar] [CrossRef]
  41. Inoki, K.; Li, Y.; Zhu, T.; Wu, J.; Guan, K.L. TSC2 is phosphorylated and inhibited by Akt and suppresses mTOR signalling. Nat. Cell Biol. 2002, 4, 648–657. [Google Scholar] [CrossRef] [PubMed]
  42. Ma, L.; Chen, Z.; Erdjument-Bromage, H.; Tempst, P.; Pandolfi, P.P. Phosphorylation and functional inactivation of TSC2 by Erk implications for tuberous sclerosis and cancer pathogenesis. Cell 2005, 121, 179–193. [Google Scholar] [CrossRef]
  43. Potter, C.J.; Pedraza, L.G.; Xu, T. Akt regulates growth by directly phosphorylating Tsc2. Nat. Cell Biol. 2002, 4, 658–665. [Google Scholar] [CrossRef]
  44. Roux, P.P.; Ballif, B.A.; Anjum, R.; Gygi, S.P.; Blenis, J. Tumor-promoting phorbol esters and activated Ras inactivate the tuberous sclerosis tumor suppressor complex via p90 ribosomal S6 kinase. Proc. Natl. Acad. Sci. USA 2004, 101, 13489–13494. [Google Scholar] [CrossRef] [PubMed]
  45. Bonucci, M.; Kuperwasser, N.; Barbe, S.; Koka, V.; de Villeneuve, D.; Zhang, C.; Srivastava, N.; Jia, X.; Stokes, M.P.; Bienaime, F.; et al. mTOR and S6K1 drive polycystic kidney by the control of Afadin-dependent oriented cell division. Nat. Commun. 2020, 11, 3200. [Google Scholar] [CrossRef] [PubMed]
  46. Castro, A.F.; Rebhun, J.F.; Clark, G.J.; Quilliam, L.A. Rheb binds tuberous sclerosis complex 2 (TSC2) and promotes S6 kinase activation in a rapamycin- and farnesylation-dependent manner. J. Biol. Chem. 2003, 278, 32493–32496. [Google Scholar] [CrossRef]
  47. Shillingford, J.M.; Murcia, N.S.; Larson, C.H.; Low, S.H.; Hedgepeth, R.; Brown, N.; Flask, C.A.; Novick, A.C.; Goldfarb, D.A.; Kramer-Zucker, A.; et al. The mTOR pathway is regulated by polycystin-1, and its inhibition reverses renal cystogenesis in polycystic kidney disease. Proc. Natl. Acad. Sci. USA 2006, 103, 5466–5471. [Google Scholar] [CrossRef]
  48. Serra, A.L.; Poster, D.; Kistler, A.D.; Krauer, F.; Raina, S.; Young, J.; Rentsch, K.M.; Spanaus, K.S.; Senn, O.; Kristanto, P.; et al. Sirolimus and kidney growth in autosomal dominant polycystic kidney disease. N. Engl. J. Med. 2010, 363, 820–829. [Google Scholar] [CrossRef]
  49. Bissler, J.J.; McCormack, F.X.; Young, L.R.; Elwing, J.M.; Chuck, G.; Leonard, J.M.; Schmithorst, V.J.; Laor, T.; Brody, A.S.; Bean, J.; et al. Sirolimus for angiomyolipoma in tuberous sclerosis complex or lymphangioleiomyomatosis. N. Engl. J. Med. 2008, 358, 140–151. [Google Scholar] [CrossRef]
  50. Bissler, J.J.; Budde, K.; Sauter, M.; Franz, D.N.; Zonnenberg, B.A.; Frost, M.D.; Belousova, E.; Berkowitz, N.; Ridolfi, A.; Christopher Kingswood, J. Effect of everolimus on renal function in patients with tuberous sclerosis complex: Evidence from EXIST-1 and EXIST-2. Nephrol. Dial. Transplant. 2019, 34, 1000–1008. [Google Scholar] [CrossRef]
  51. Blomqvist, S.R.; Vidarsson, H.; Fitzgerald, S.; Johansson, B.R.; Ollerstam, A.; Brown, R.; Persson, A.E.; Bergstrom, G.G.; Enerback, S. Distal renal tubular acidosis in mice that lack the forkhead transcription factor Foxi1. J. Clin. Investig. 2004, 113, 1560–1570. [Google Scholar] [CrossRef] [PubMed]
  52. Kui, M.; Pluznick, J.L.; Zaidman, N.A. The transcription factor Foxi1 promotes expression of V-ATPase and Gpr116 in M-1 cells. Am. J. Physiol. Renal Physiol. 2023, 324, F267–F273. [Google Scholar] [CrossRef] [PubMed]
  53. Lewis, S.E.; Erickson, R.P.; Barnett, L.B.; Venta, P.J.; Tashian, R.E. N-ethyl-N-nitrosourea-induced null mutation at the mouse Car-2 locus: An animal model for human carbonic anhydrase II deficiency syndrome. Proc. Natl. Acad. Sci. USA 1988, 85, 1962–1966. [Google Scholar] [CrossRef] [PubMed]
Figure 1. Comparison of cystogenesis and cyst progression in Tsc1 KO and Tsc1/Car2 dKO mice. H&E images were taken of 47 days old wild-type (WT; A) and Tsc1 KO mice (D). These were then compared to 47- and 110-day-old Tsc1/Car2 dKO (B,E) and Tsc1/Foxi1 dKO (C,F) mice. Notice the reductions in the number and size of the renal cysts in 47-day-old Tsc1/Car2 dKO compared to age-matched Tsc1 dKO mice (B,D). images of Tsc1/Car2 dKO mice taken at 110 days of age (E) show a significant increase in both cyst number and size. The life span of Tsc1 KO mice, which is less than 60 days, did not allow for direct comparison of cyst burden to that of 110-day-old Tsc1/Car2 dKO mice. Scale bar represents 50 μm. “C” designates cyst.
Ijms 25 04772 g001
Figure 2. Localization of H+-ATPase and AQP2 in Tsc1 KO and Tsc1/Car2 dKO mice. Double immunofluorescence images of H+-ATPase (red) and AQP2 (green) were acquired form kidney sections of WT (AC), Tsc1 KO (DF), 47-day-old Tsc1/Car2 dKO (GI), and 110-day-old Tsc1/Car2 dKO mice (JL). Tsc1 KO (DF) shows cyst formation at 47 days, while cystogenesis does not occur in Tsc1/Car2 dKO mice until 110 days of age (JL). However, both TSC mouse models show H+-ATPase-positive A-IC cells (red) lining the cyst epithelium, with few AQP2-positive principal cells (green). Scale bar equals 50 μm. “C” represents cysts.
Ijms 25 04772 g002
Figure 3. Comparison of mTORC1 activation in TSC mouse models. Immunohistochemical staining with anti-phosphorylated S6 (p-S6) antibody was used to determine the extent of mTORC1 activation. Both 47-day-old Tsc1 KO (D) and 110-day-old Tsc1/Car2 dKO mice (E) show extensive staining for pS6 along the luminal epithelium of the cyst. Age-matched Tsc1/Foxi1 dKO and Tsc1/Car2 dKO 47-day-old mice (B,C) display pS6-positive tubules but no cyst formation. The Tsc1/Foxi1 dKO mice at 110 days did not show any signs of cyst formation (F). Wild-type (WT) mice were included for comparison (A). Scale bar equals 50 μm. “C” represents cysts.
Ijms 25 04772 g003
Figure 4. RNA-seq analysis comparing the renal transcriptomes of WT or Car2 KO with 47-day-old mice of Tsc1 KO or Tsc1/Car2 dKO strains. (A) Graphic representation of changes in the expression of mRNAs associated with A-IC cells. Our data demonstrate that the expression of transcripts coding for Foxi1, Slc4a1, and A-IC cell-associated components of H+-ATPase were significantly up-regulated in the kidneys of Tsc1/Car2 dKO mice. (B) Tabulated presentation of the results in part A.
Ijms 25 04772 g004
Figure 5. RNA-seq analysis comparing the renal transcriptomes of WT or Car2 KO mice to those of 110-days old Tsc1/Car2 dKO mice. (A) Graphic representation of changes in the expression of mRNAs associated with A-IC cells. Our data demonstrate that the expression of transcripts coding for Foxi1, Slc4a1, and A-IC cell-associated components of H+-ATPase were significantly up-regulated in the kidneys of Tsc1/Car2 dKO mice. (B) Tabulated presentation of the results in part A. Tsc1 KO mice were not included in this analysis due to their short life-span (less than 65 days).
Ijms 25 04772 g005
Figure 6. RNA-seq analysis comparing the renal transcriptomes of 47 vs. 110-day-old Tsc1/Car2 dKO mice. (A) Graphic representation of changes in the expression of mRNAs associated with A-IC cells. Our data demonstrate that the expression of transcripts coding for Foxi1, Slc4a1, and A-IC cell-associated components of H+-ATPase were significantly up-regulated in the kidneys of Tsc1/Car2 dKO mice. (B) Tabulated presentation of the results in part A.
Ijms 25 04772 g006
Figure 7. KEGG enrichment analysis of RNA-seq results. The results of RNA-seq studies were subjected to KEGG enrichment analysis. The results revealed the presence of 79, 156, and 23 enriched terms with an FDR of less than 0.05 for 47-day-old Tsc1/Car2 dKO vs. WT mice; 110-day-old Tsc1/Car2 dKO vs. WT mice, and 110-day-old dKO vs. 47-day-old dKO mice, respectively (for complete results of all significantly enriched terms, please refer to Datasets S6–S8).
Ijms 25 04772 g007
Figure 8. GO-BP enrichment analysis of RNA-seq results. RNA-seq results were subjected to GO-BP enrichment analysis. The outcomes revealed the presence of 939, 1000+, and 422 enriched terms that had FDRs of less than 0.05 for 47-day-old Tsc1/Car2 dKO vs. WT mice; 110-day-old Tsc1/Car2 dKO vs. WT mice, and 110-day-old dKO vs. 47-day-old dKO mice, respectively (for complete results of all significantly enriched terms, please refer to Datasets S9–S11).
Ijms 25 04772 g008
Figure 9. GO-MF enrichment analysis of RNA-seq results. GO-BP enrichment analysis of RNA-seq results. RNA-seq results were subjected to GO-MF enrichment analysis. These analyses revealed the presence of 128, 222, and 26 enriched terms that had FDRs of less than 0.05 for 47-day-old Tsc1/Car2 dKO vs. WT mice, 110-day-old Tsc1/Car2 dKO vs. WT mice, and 110-day-old dKO vs. 47-day-old dKO mice, respectively (for complete results of all significantly enriched terms, please refer to Datasets S12–S14).
Ijms 25 04772 g009
Disclaimer/Publisher’s Note: The statements, opinions and data contained in all publications are solely those of the individual author(s) and contributor(s) and not of MDPI and/or the editor(s). MDPI and/or the editor(s) disclaim responsibility for any injury to people or property resulting from any ideas, methods, instructions or products referred to in the content.

