


Epi-Impute: Single-Cell RNA-seq Imputation via Integration with Single-Cell ATAC-seq

 , , , and
Abstract
:1. Introduction
2. Results
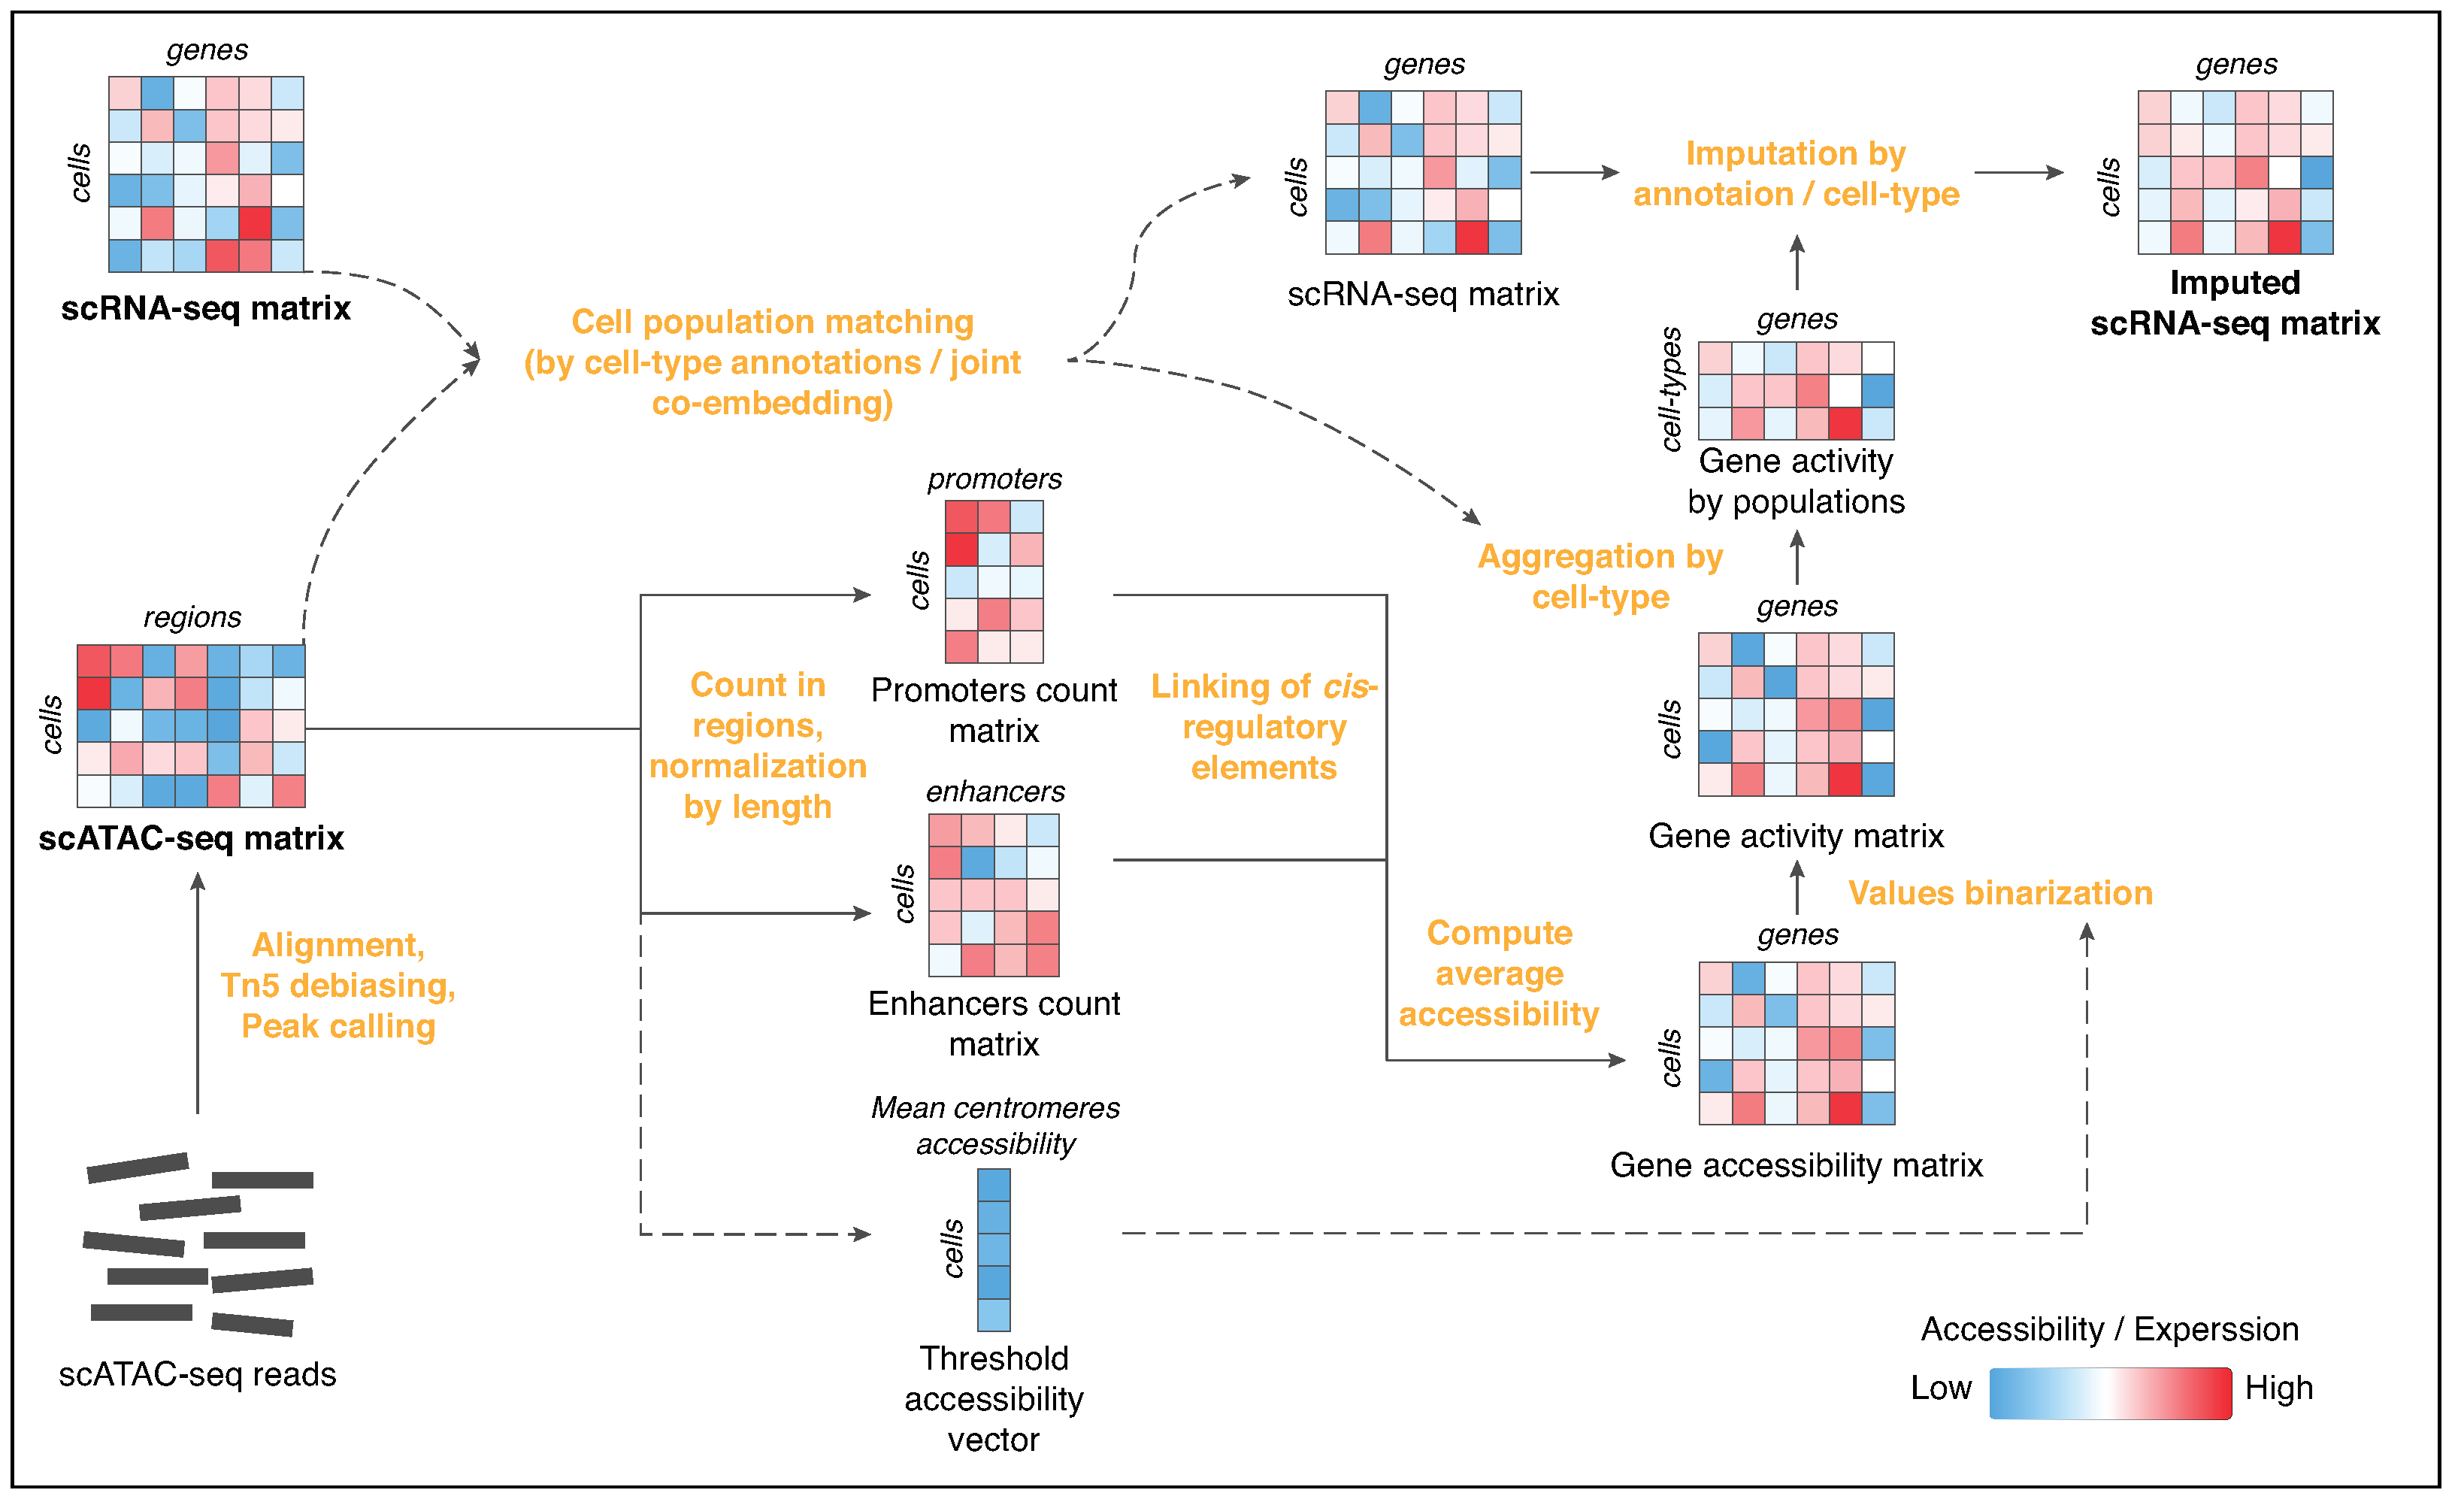
Epi-Impute Pipeline

3. Discussion
4. Materials and Methods
4.1. Datasets and Data Processing
4.2. Regulatory Regions
4.3. Methods Benchmarking
4.4. Downstream Analysis
Supplementary Materials
Author Contributions
Funding
Institutional Review Board Statement
Informed Consent Statement
Data Availability Statement
Conflicts of Interest
References
- Method of the Year 2013. Nat. Methods 2014, 11, 1. [CrossRef]
- Kharchenko, P.V.; Silberstein, L.; Scadden, D.T. Bayesian approach to single-cell differential expression analysis. Nat. Methods 2014, 11, 740–742. [Google Scholar] [CrossRef] [PubMed]
- Qiu, P. Embracing the dropouts in single-cell RNA-seq analysis. Nat. Commun. 2020, 11, 1169. [Google Scholar] [CrossRef] [PubMed]
- Lähnemann, D.; Köster, J.; Szczurek, E.; McCarthy, D.J.; Hicks, S.C.; Robinson, M.D.; Vallejos, C.A.; Campbell, K.R.; Beerenwinkel, N.; Mahfouz, A.; et al. Eleven grand challenges in single-cell data science. Genome Biol. 2020, 21, 31. [Google Scholar] [CrossRef] [PubMed]
- Hicks, S.C.; Townes, F.W.; Teng, M.; Irizarry, R.A. Missing data and technical variability in single-cell RNA-sequencing experiments. Biostatistics 2017, 19, 562–578. [Google Scholar] [CrossRef]
- Haque, A.; Engel, J.; Teichmann, S.A.; Lönnberg, T. A practical guide to single-cell RNA-sequencing for biomedical research and clinical applications. Genome Med. 2017, 9, 75. [Google Scholar] [CrossRef]
- Elowitz, M.B.; Levine, A.J.; Siggia, E.D.; Swain, P.S. Stochastic Gene Expression in a Single Cell. Science 2002, 297, 1183–1186. [Google Scholar] [CrossRef]
- Xu, J.; Cui, L.; Zhuang, J.; Meng, Y.; Bing, P.; He, B.; Tian, G.; Pui, C.K.; Wu, T.; Wang, B.; et al. Evaluating the performance of dropout imputation and clustering methods for single-cell RNA sequencing data. Comput. Biol. Med. 2022, 146, 105697. [Google Scholar] [CrossRef] [PubMed]
- AlJanahi, A.A.; Danielsen, M.; Dunbar, C.E. An Introduction to the Analysis of Single-Cell RNA-Sequencing Data. Mol. Ther. Methods Clin. Dev. 2018, 10, 189–196. [Google Scholar] [CrossRef]
- van Dijk, D.; Sharma, P.; Nainys, J.; Yim, K.; Kathail, P.; Carr, A.J.; Burdziak, C.; Moon, K.R.; Chaffer, C.L.; Pattabiraman, D.; et al. Recovering Gene Interactions from Single-Cell Data Using Data Diffusion. Cell 2018, 174, 716–729. [Google Scholar] [CrossRef]
- Li, W.V.; Li, J.J. An accurate and robust imputation method scImpute for single-cell RNA-seq data. Nat. Commun. 2018, 9, 997. [Google Scholar] [CrossRef] [PubMed]
- Peng, T.; Zhu, Q.; Yin, P.; Tan, K. SCRABBLE: Single-cell RNA-seq imputation constrained by bulk RNA-seq data. Genome Biol. 2019, 20, 88. [Google Scholar] [CrossRef] [PubMed]
- Lun, A.T.; Bach, K.; Marioni, J.C. Pooling across cells to normalize single-cell RNA sequencing data with many zero counts. Genome Biol. 2016, 17, 75. [Google Scholar] [CrossRef] [PubMed]
- Huang, M.; Wang, J.; Torre, E.; Dueck, H.; Shaffer, S.; Bonasio, R.; Murray, J.I.; Raj, A.; Li, M.; Zhang, N.R. SAVER: Gene expression recovery for single-cell RNA sequencing. Nat. Methods 2018, 15, 539–542. [Google Scholar] [CrossRef]
- Gong, W.; Kwak, I.-Y.; Pota, P.; Koyano-Nakagawa, N.; Garry, D.J. DrImpute: Imputing dropout events in single cell RNA sequencing data. BMC Bioinform. 2018, 19, 220. [Google Scholar] [CrossRef]
- Eraslan, G.; Simon, L.M.; Mircea, M.; Mueller, N.S.; Theis, F.J. Single-cell RNA-seq denoising using a deep count autoencoder. Nat. Commun. 2019, 10, 390. [Google Scholar] [CrossRef]
- Andrews, T.S.; Hemberg, M. False signals induced by single-cell imputation. F1000Research 2019, 7, 1740. [Google Scholar] [CrossRef]
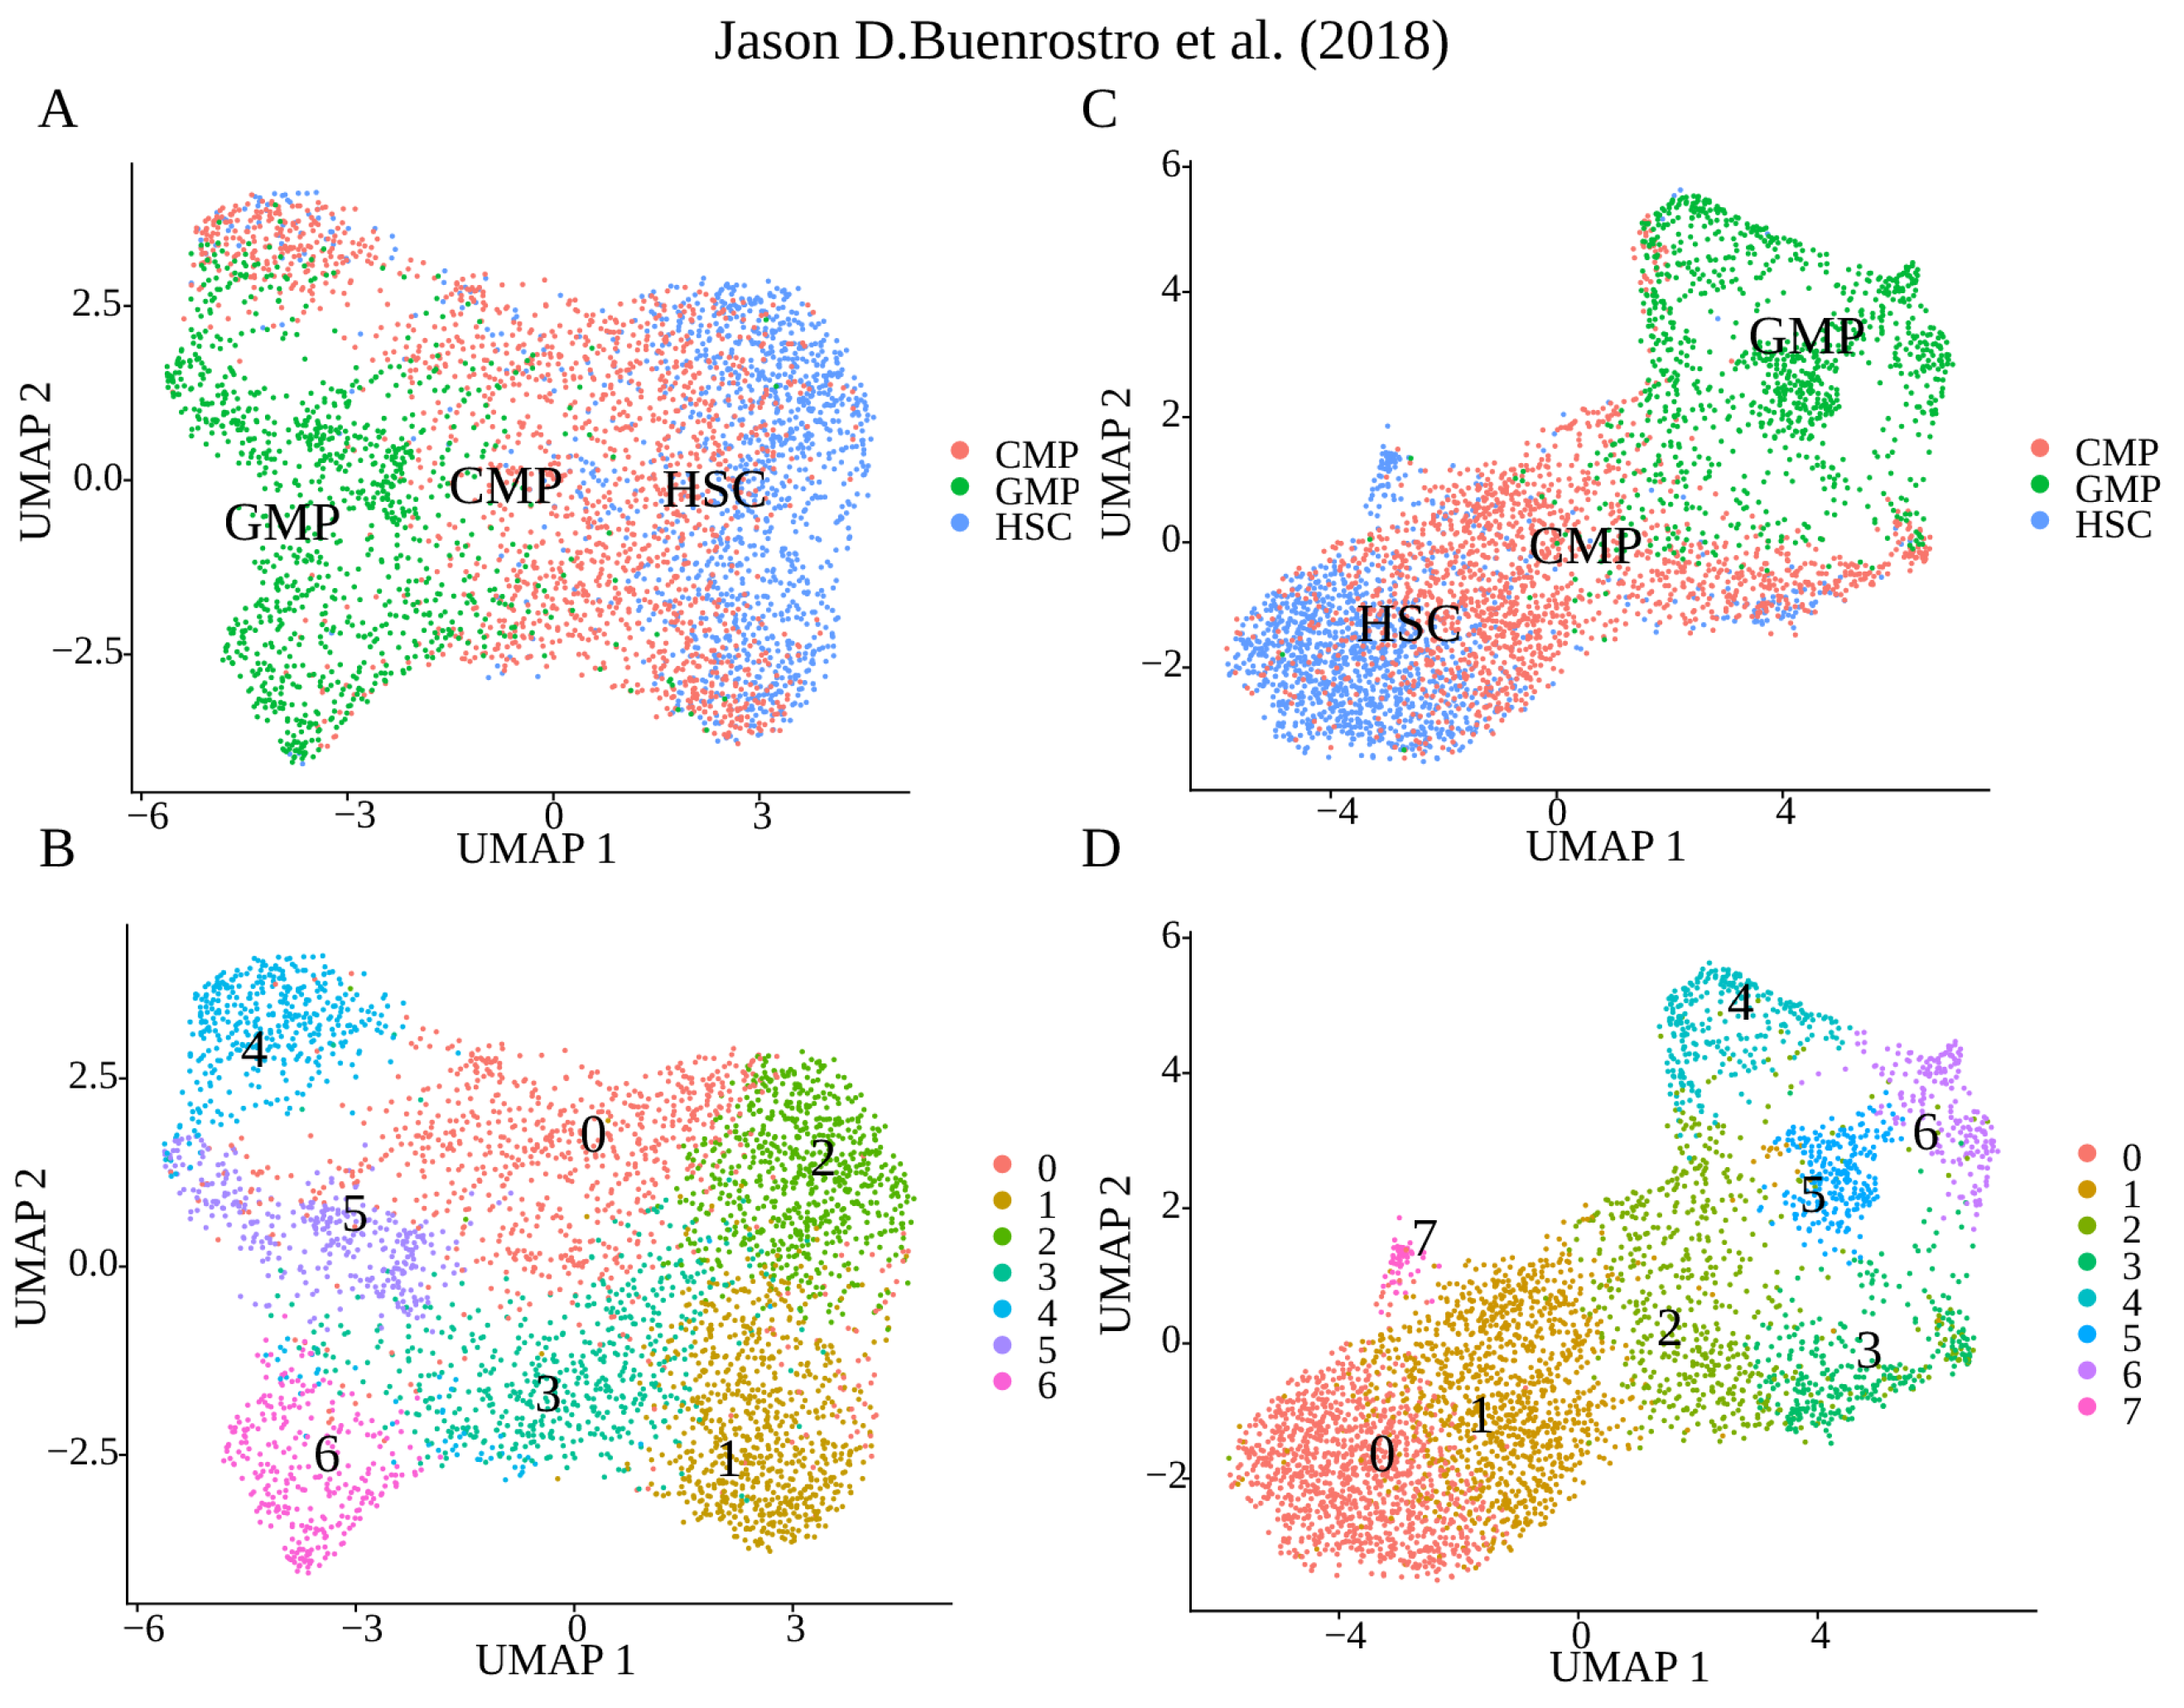
- Buenrostro, J.D.; Corces, M.C.; Lareau, C.A.; Wu, B.; Schep, A.N.; Aryee, M.J.; Majeti, R.; Chang, H.Y.; Greenleaf, W.J. Integrated Single-Cell Analysis Maps the Continuous Regulatory Landscape of Human Hematopoietic Differentiation. Cell 2018, 173, 1535–1548. [Google Scholar] [CrossRef]
- Buenrostro, J.D.; Wu, B.; Litzenburger, U.M.; Ruff, D.; Gonzales, M.L.; Snyder, M.P.; Chang, H.Y.; Greenleaf, W.J. Single-cell chromatin accessibility reveals principles of regulatory variation. Nature 2015, 523, 486–490. [Google Scholar] [CrossRef]
- Orchard, P.; Kyono, Y.; Hensley, J.; Kitzman, J.O.; Parker, S.C. Quantification, Dynamic Visualization, and Validation of Bias in ATAC-Seq Data with ataqv. Cell Syst. 2020, 10, 298–306.e4. [Google Scholar] [CrossRef]
- Amemiya, H.M.; Kundaje, A.; Boyle, A.P. The ENCODE Blacklist: Identification of Problematic Regions of the Genome. Sci. Rep. 2019, 9, 9354. [Google Scholar] [CrossRef] [PubMed]
- Hicks, S.C.; Okrah, K.; Paulson, J.N.; Quackenbush, J.; Irizarry, R.A.; Bravo, H.C. Smooth quantile normalization. Biostatistics 2018, 19, 185–198. [Google Scholar] [CrossRef]
- Hansen, K.D.; Irizarry, R.A.; Wu, Z. Removing technical variability in RNA-seq data using conditional quantile normalization. Biostatistics 2012, 13, 204–216. [Google Scholar] [CrossRef] [PubMed]
- Bass, A.J.; Robinson, D.G.; Storey, J.D. Determining sufficient sequencing depth in RNA-Seq differential expression studies. bioRxiv 2019, 635623. [Google Scholar] [CrossRef]
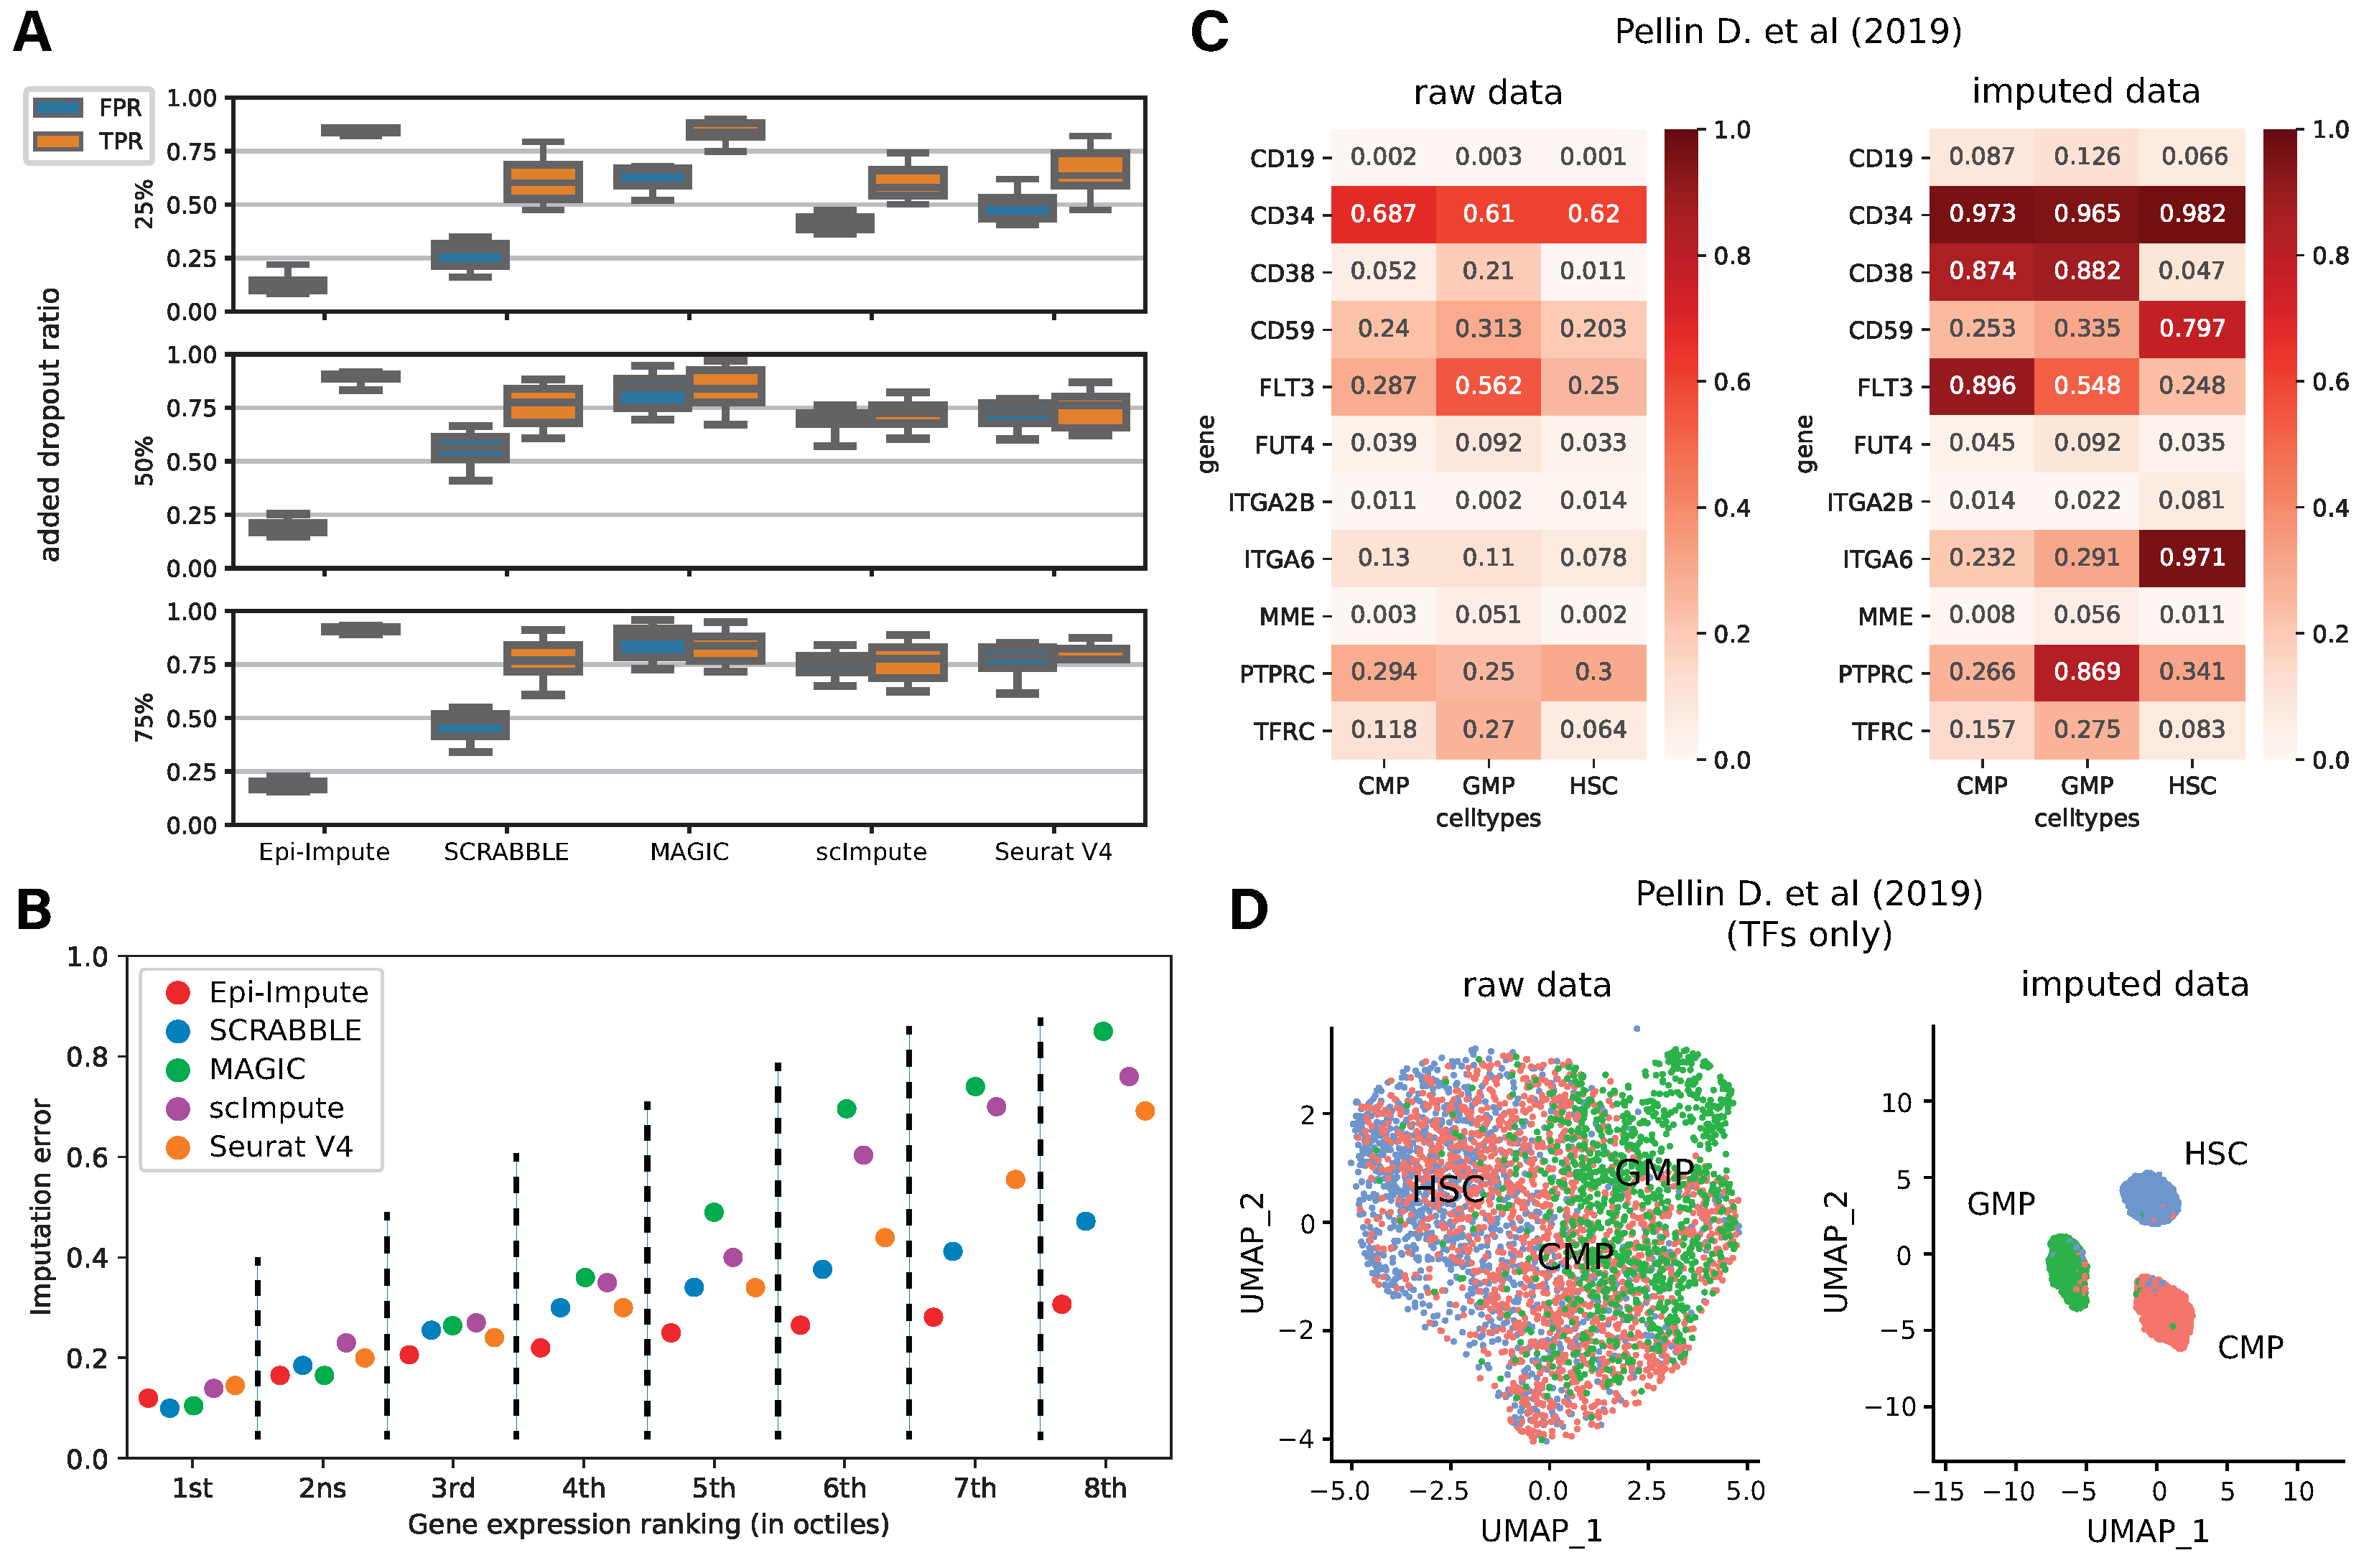
- Pellin, D.; Loperfido, M.; Baricordi, C.; Wolock, S.L.; Montepeloso, A.; Weinberg, O.K.; Biffi, A.; Klein, A.M.; Biasco, L. A comprehensive single cell transcriptional landscape of human hematopoietic progenitors. Nat. Commun. 2019, 10, 2395. [Google Scholar] [CrossRef]
- Kiselev, V.Y.; Andrews, T.S.; Hemberg, M. Challenges in unsupervised clustering of single-cell RNA-seq data. Nat. Rev. Genet. 2019, 20, 273–282. [Google Scholar] [CrossRef] [PubMed]
- Feng, C.; Liu, S.; Zhang, H.; Guan, R.; Li, D.; Zhou, F.; Liang, Y.; Feng, X. Dimension reduction and clustering models for single-cell RNA sequencing data: A comparative study. Int. J. Mol. Sci. 2020, 21, 2181. [Google Scholar] [CrossRef]
- Torre, E.; Dueck, H.; Shaffer, S.; Gospocic, J.; Gupte, R.; Bonasio, R.; Kim, J.; Murray, J.; Raj, A. Rare Cell Detection by Single-Cell RNA Sequencing as Guided by Single-Molecule RNA FISH. Cell Syst. 2018, 6, 171–179.e5. [Google Scholar] [CrossRef]
- Andersson, R.; Gebhard, C.; Miguel-Escalada, I.; Hoof, I.; Bornholdt, J.; Boyd, M.; Chen, Y.; Zhao, X.; Schmidl, C.; Suzuki, T.; et al. An atlas of active enhancers across human cell types and tissues. Nature 2014, 507, 455–461. [Google Scholar] [CrossRef]
- Arner, E.; Daub, C.O.; Vitting-Seerup, K.; Andersson, R.; Lilje, B.; Drabløs, F.; Lennartsson, A.; Rönnerblad, M.; Hrydziuszko, O.; Vitezic, M.; et al. Transcribed enhancers lead waves of coordinated transcription in transitioning mammalian cells. Science 2015, 347, 1010–1014. [Google Scholar] [CrossRef]
- Adey, A.; Morrison, H.G.; Asan; Xun, X.; Kitzman, J.O.; Turner, E.H.; Stackhouse, B.; MacKenzie, A.P.; Caruccio, N.C.; Zhang, X.; et al. Rapid, low-input, low-bias construction of shotgun fragment libraries by high-density in vitro transposition. Genome Biol. 2010, 11, R119. [Google Scholar] [CrossRef] [PubMed]
- The FANTOM Consortium and the RIKEN PMI and CLST (DGT). A promoter-level mammalian expression atlas. Nature 2014, 507, 462–470. [Google Scholar] [CrossRef]
- Dreos, R.; Ambrosini, G.; Périer, R.C.; Bucher, P. The Eukaryotic Promoter Database: Expansion of EPDNew and new promoter analysis tools. Nucleic Acids Res. 2015, 43, D92–D96. [Google Scholar] [CrossRef] [PubMed]
- Gao, T.; Qian, J. EnhancerAtlas 2.0: An updated resource with enhancer annotation in 586 tissue/cell types across nine species. Nucleic Acids Res. 2020, 48, D58–D64. [Google Scholar] [CrossRef] [PubMed]
- Hao, Y.; Hao, S.; Andersen-Nissen, E.; Mauck, W.M., III; Zheng, S.; Butler, A.; Lee, M.J.; Wilk, A.J.; Darby, C.; Zagar, M.; et al. Integrated analysis of multimodal single-cell data. Cell 2021, 184, 3573–3587. [Google Scholar] [CrossRef] [PubMed]
- Stuart, T.; Srivastava, A.; Lareau, C.; Satija, R. Multimodal single-cell chromatin analysis with Signac. bioRxiv 2020. [Google Scholar] [CrossRef]
- Wouters, J.; Kalender-Atak, Z.; Minnoye, L.; Spanier, K.I.; Waegeneer, M.D.; González-Blas, C.B.; Mauduit, D.; Davie, K.; Hulselmans, G.; Najem, A.; et al. Single-cell gene regulatory network analysis reveals new melanoma cell states and transition trajectories during phenotype switching. bioRxiv 2019. [Google Scholar] [CrossRef]
- Borisov, N.; Sorokin, M.; Garazha, A.; Buzdin, A. Quantitation of molecular pathway activation using RNA sequencing data. Methods Mol. Biol. 2019, 2063, 189–206. [Google Scholar] [CrossRef]


| Method | Raw * | 25% | 50% | 75% | 95% |
|---|---|---|---|---|---|
| Epi-Impute | 0.68 | 0.67 | 0.67 | 0.65 | 0.61 |
| SCRABBLE | 0.65 | 0.62 | 0.64 | 0.61 | 0.52 |
| MAGIC | 0.96 | 0.96 | 0.97 | 0.98 | 1.00 |
| scImpute | 0.33 | 0.27 | 0.22 | 0.23 | 0.26 |
| Seurat v4 | 0.67 | 0.68 | 0.66 | 0.72 | 0.73 |
| SAVER | 0.69 | 0.70 | 0.69 | 0.71 | 0.72 |
| DrImpute | 0.68 | 0.71 | 0.77 | 0.81 | 0.83 |
| coupledNMF | 0.66 | 0.69 | 0.55 | 0.52 | 0.59 |
| DCA | 0.64 | 0.65 | 0.74 | 0.89 | 0.91 |
Disclaimer/Publisher’s Note: The statements, opinions and data contained in all publications are solely those of the individual author(s) and contributor(s) and not of MDPI and/or the editor(s). MDPI and/or the editor(s) disclaim responsibility for any injury to people or property resulting from any ideas, methods, instructions or products referred to in the content. |
© 2023 by the authors. Licensee MDPI, Basel, Switzerland. This article is an open access article distributed under the terms and conditions of the Creative Commons Attribution (CC BY) license (https://creativecommons.org/licenses/by/4.0/).
Share and Cite
Raevskiy, M.; Yanvarev, V.; Jung, S.; Del Sol, A.; Medvedeva, Y.A. Epi-Impute: Single-Cell RNA-seq Imputation via Integration with Single-Cell ATAC-seq. Int. J. Mol. Sci. 2023, 24, 6229. https://doi.org/10.3390/ijms24076229
Raevskiy M, Yanvarev V, Jung S, Del Sol A, Medvedeva YA. Epi-Impute: Single-Cell RNA-seq Imputation via Integration with Single-Cell ATAC-seq. International Journal of Molecular Sciences. 2023; 24(7):6229. https://doi.org/10.3390/ijms24076229
Chicago/Turabian StyleRaevskiy, Mikhail, Vladislav Yanvarev, Sascha Jung, Antonio Del Sol, and Yulia A. Medvedeva. 2023. "Epi-Impute: Single-Cell RNA-seq Imputation via Integration with Single-Cell ATAC-seq" International Journal of Molecular Sciences 24, no. 7: 6229. https://doi.org/10.3390/ijms24076229