
The Analytical Possibilities of FT-IR Spectroscopy Powered by Vibrating Molecules
 , , and
Abstract
:1. Introduction
2. Basic Research
2.1. Hydrogen Bonds
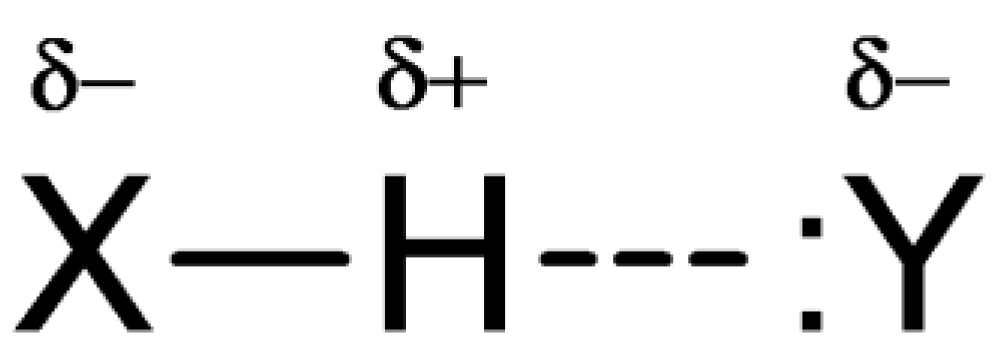
2.1.1. Foreword
- The νX–H bands with fine, strongly developed structures;
- Lowering the frequency (Δν) of the νX–H bands;
- Increases in the intensity of the νX–H bands in the extreme (Imax);
- Significant increases in the intensity of integral (I∞) bands νX–H;
- Significant increases in the value of the half-widths (Δν½) of the νX–H bands.
2.1.2. Interpretation of Infrared Spectra of Hydrogen Bonds
Qualitative Interpretation
Stepanov’s Theory
Bratož–Hadži–Sheppard Theory
Hadži’s Theory
Fermi Resonance Theory
Quantitative Interpretation
Maréchal–Witkowski Theory
Bratož’s Theory
Romanowski–Sobczyk Theory
Robertson–Yarwood Theory
Abramczyk Theory
Henri-Rousseau–Blaise’s Theory
2.1.3. Infrared Spectral Effects of Hydrogen Bonds
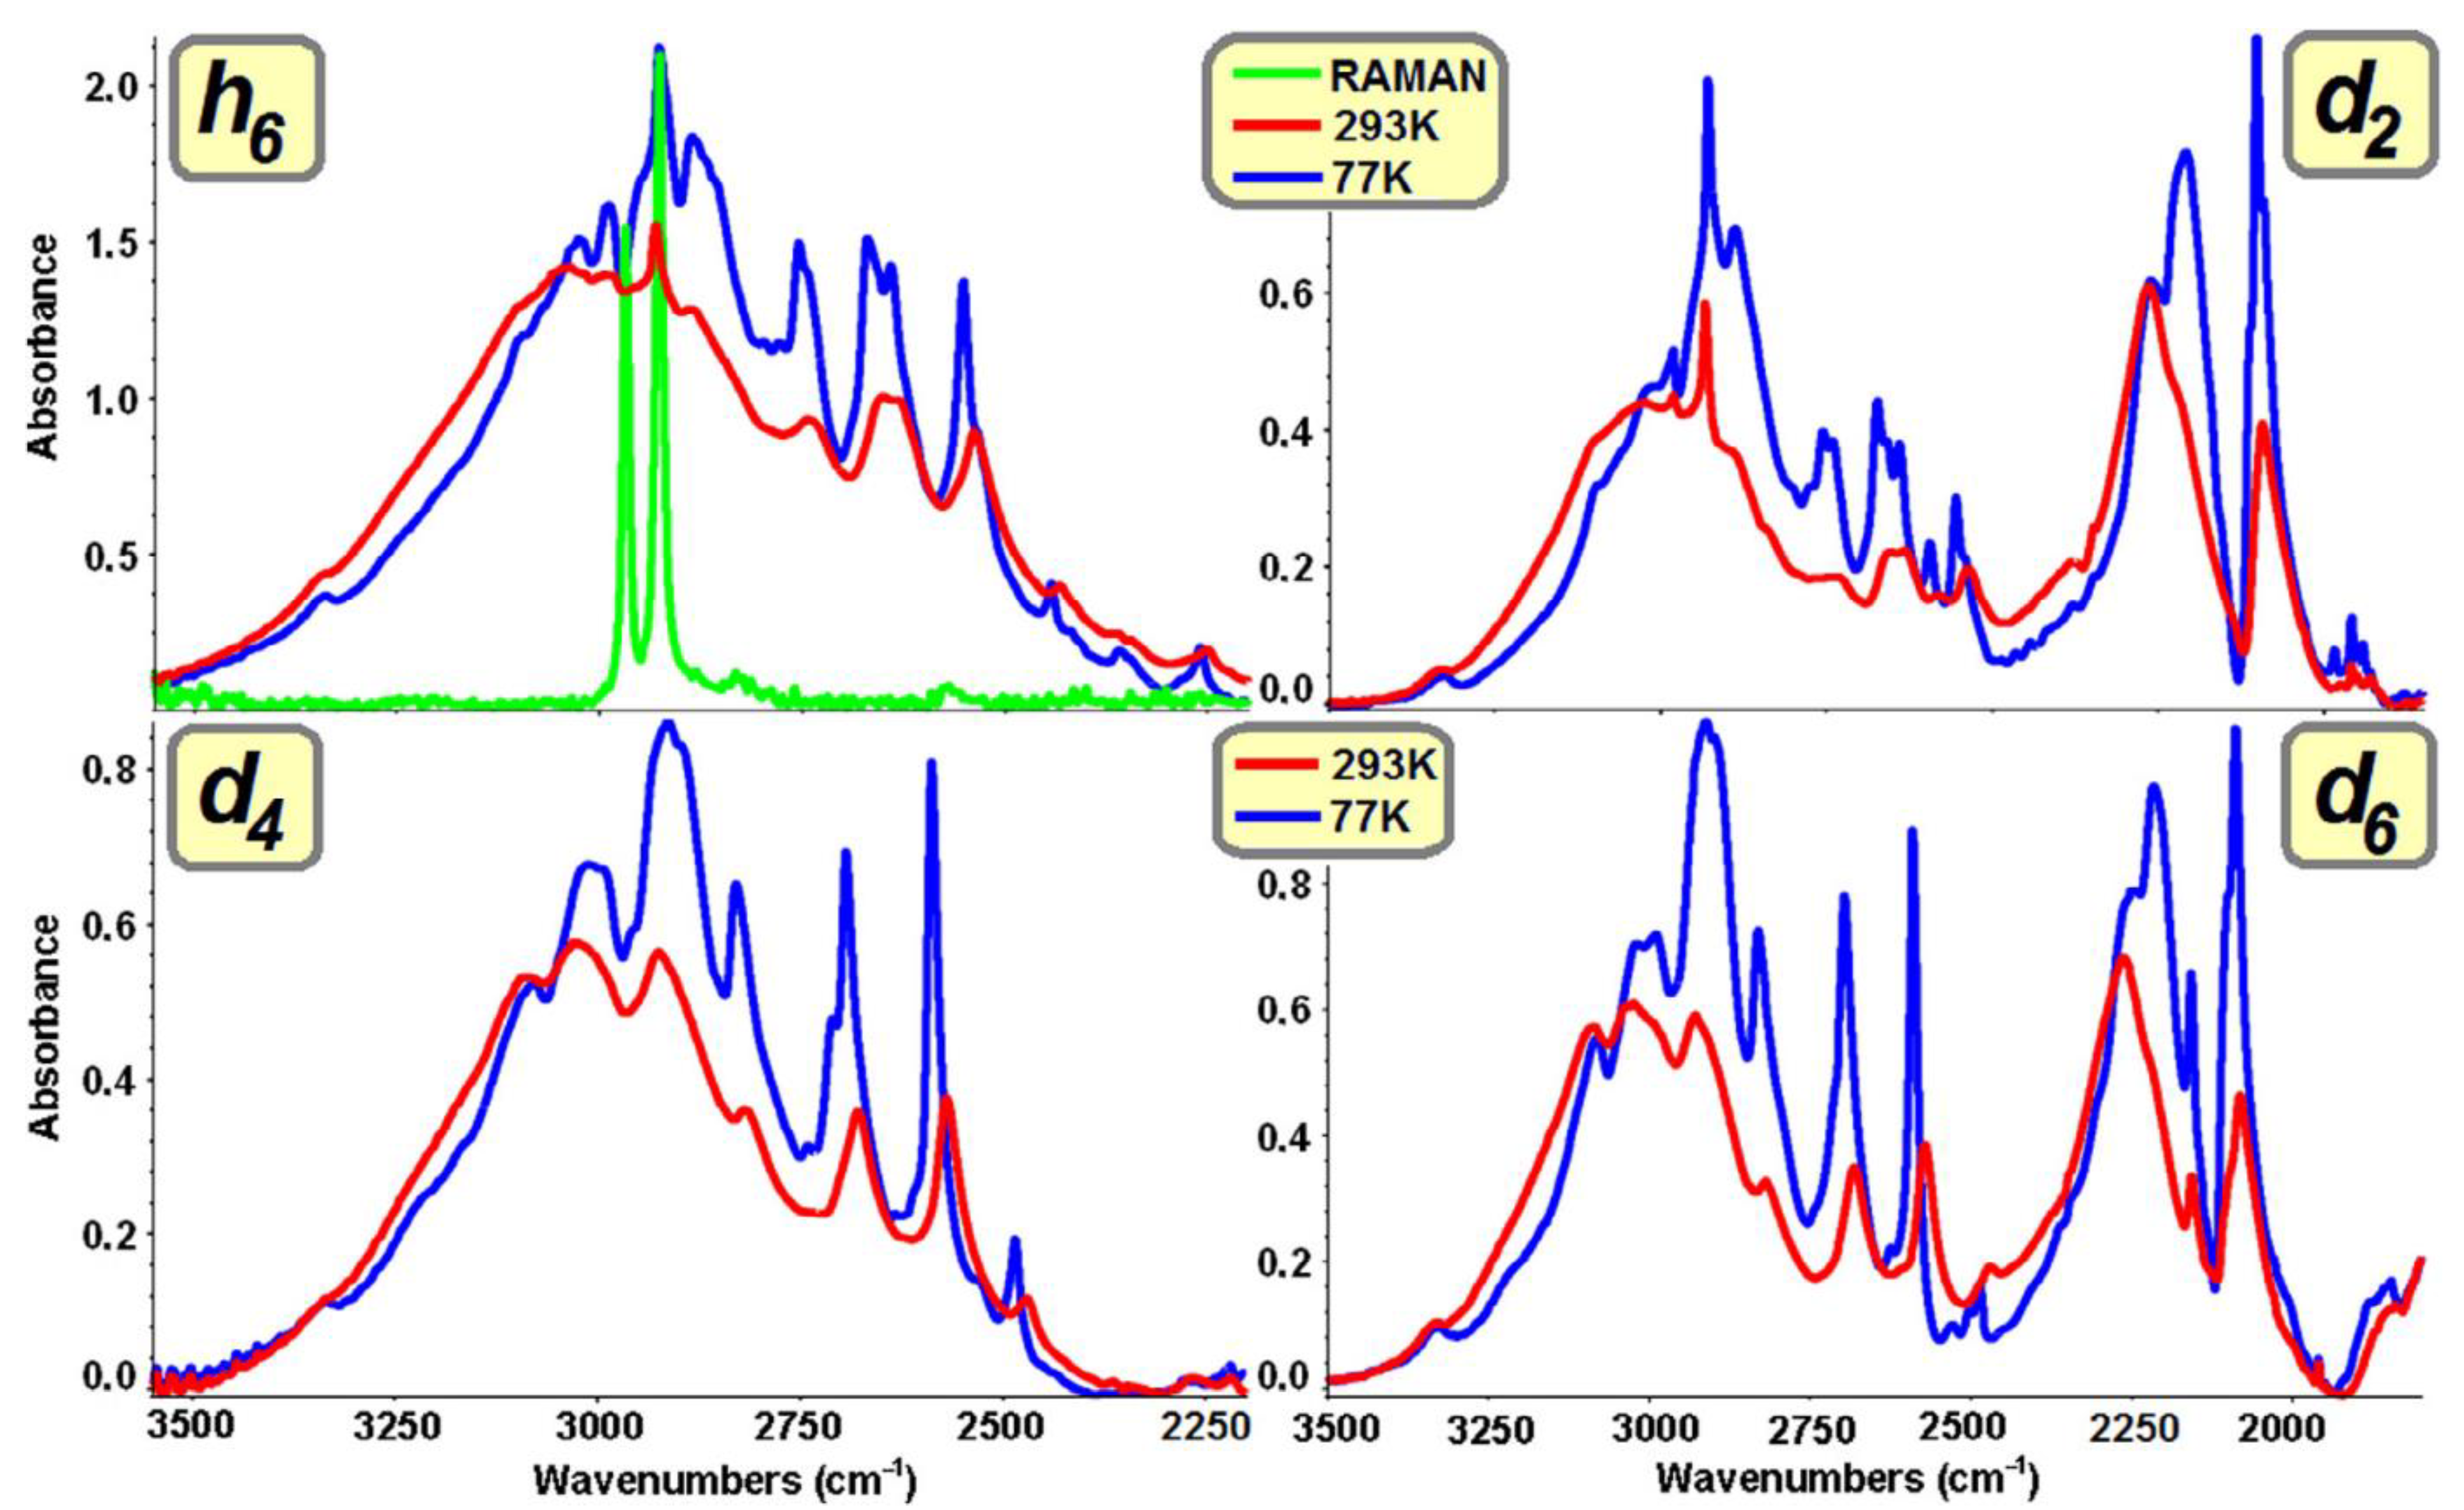
Isotopically Neat Molecular Systems
Breaking of Vibrational Selection Rules
Variability of Spectral Generation Mechanisms as a Function of Temperature
Hydrogen Bond Systems Isotopically Diluted with Deuterons
The Isotopic H/D “Self-Organisation” Effects
“Long-Range” H/D Isotopic Effects
2.2. Catalysis
3. Technological Processes
3.1. Product Quality Control
3.2. Installation Tightness Test
4. Medicine
5. Environmental Protection
5.1. Research of the Greenhouse Gas Fluxes
5.2. Flora and Fauna of Water Areas
6. Semiconductors
7. Food Industry
7.1. Food Adulteration
7.1.1. Adulteration of Fats
7.1.2. Adulteration of Coffee
7.1.3. Adulteration of Spices
7.1.4. Adulteration of Fruit Juices
7.1.5. Adulteration of Wheat
7.1.6. Adulteration of Sugar
7.1.7. Adulteration of Cow–Buffalo Milk
7.2. Quality Assessment of Meat Products Using FTIR
7.3. Microbial Quality Assessment of Minimally Processed Fruits Using FT-IR
7.3.1. Minimally Processed Pineapple
7.3.2. Minimally Processed Pomegranate
7.4. Microplastics
8. Criminalistics
9. Museology
10. Conclusions
Author Contributions
Funding
Institutional Review Board Statement
Informed Consent Statement
Data Availability Statement
Conflicts of Interest
References
- Koczoń, P.; Niemiec, T.; Bartyzel, B.J.; Gruczyńska, E.; Bzducha-Wróbel, A.; Koczoń, P. Chemical changes that occur in Jerusalem artichoke silage. Food Chem. 2019, 295, 172–179. [Google Scholar] [CrossRef] [PubMed]
- Latimer, W.M.; Rodebush, W.H. Polarity and ionization from the standpoint of the Lewis theory of valence. J. Am. Chem. Soc. 1920, 42, 1419–1433. [Google Scholar] [CrossRef] [Green Version]
- Pimentel, G.C.; McClellan, A.L. The Hydrogen Bond; W.H. Freeman and Co.: San Francisco, CA, USA, 1960. [Google Scholar]
- Schuster, P.; Zundel, G.; Sandorfy, C. The Hydrogen Bond: Recent Developments in Theory and Experiments; North-Holland Publishing Company: Amsterdam, The Netherlands, 1976. [Google Scholar]
- Ratajczak, H.; Orville-Thomas, W.J.; Redshaw, M. Molecular Interactions; John Wiley & Sons: Chichester, UK, 1981. [Google Scholar]
- Flakus, H.T. The effect of strong coupling between vibrations in hydrogen bonds on the polarized spectra of the mercaptobenzothiazole crystal: An “anomalous” isotopic effect. Chem. Phys. 1981, 62, 103–114. [Google Scholar] [CrossRef]
- Watson, J.D.; Crick, F.H.C. Molecular Structure of Nucleic Acids: A Structure for Deoxyribose Nucleic Acid. Nature 1953, 171, 737–738. [Google Scholar] [CrossRef] [PubMed]
- Maréchal, Y. The Hydrogen Bond and the Water Molecule: The Physics and Chemistry of Water, Aqueous and Bio Media; Elsevier: Amsterdam, The Netherlands, 2007. [Google Scholar]
- Aldrich, P.D.; Kukolich, S.G.; Campbell, E.J. The structure and molecular properties of the acetylene–HCN complex as determined from the rotational spectra. J. Chem. Phys. 1983, 78, 3521–3530. [Google Scholar] [CrossRef]
- Baev, A.K. Specific Intermolecular Interactions of Organic Compounds; Springer-Verlag: Berlin, Germany, 2012. [Google Scholar]
- Weast, R.C. CRC Handbook of Chemistry and Physics Data, 74th ed.; CRC Press: Boca Raton, FL, USA, 1993. [Google Scholar]
- Dawson, R.M.C.; Elliott, C.E.; Elliott, W.H.; Jones, K.M. Data for Biochemical Research; Clarendon Press: Oxford, UK, 1986. [Google Scholar]
- Kroto, H.W. Molecular Rotation Spectra; John Wiley & Sons: London, UK, 1975. [Google Scholar]
- Badger, R.M. The relation between the energy of a hydrogen bond and the frequencies of the O–H bands. J. Chem. Phys. 1940, 8, 288–289. [Google Scholar] [CrossRef]
- Badger, R.M.; Bauer, S.H. Spectroscopic studies of the hydrogen bond. II. The shift of the O–H vibrational frequency in the formation of the hydrogen bond. J. Chem. Phys. 1937, 5, 839–851. [Google Scholar] [CrossRef]
- Sobczyk, L. Metody Spektroskopii Oscylacyjnej; Państwowe Wydawnictwo Naukowe: Warsaw, Poland, 1979. [Google Scholar]
- Bratož, S.; Hadži, D. Infrared spectra of molecules with hydrogen bonds. J. Chem. Phys. 1957, 27, 991–997. [Google Scholar] [CrossRef]
- Auvert, G.; Maréchal, Y. H-bonds of adipic acid crystals at low temperature. Chem. Phys. 1979, 40, 51–59. [Google Scholar] [CrossRef]
- Chamma, D.; Henri-Rousseau, O. IR spectral density of weak H-bonded complexes involving damped Fermi resonances. II. Numerical experiments and physical discussion. Chem. Phys. 1998, 229, 51–73. [Google Scholar] [CrossRef]
- Romanowski, H.; Sobczyk, L. A stochastic approach to their IR spectra of the symmetrical OHO hydrogen bond. Chem. Phys. 1977, 19, 361–370. [Google Scholar] [CrossRef]
- Robertson, G.N.; Yarwood, J. A new method of measuring the hydrogen bond stretching frequency νσ of a complex in solution. Nature 1975, 257, 41–43. [Google Scholar]
- Yarwood, J.; Ackroyd, R.; Robertson, G.N. Vibrational relaxation of hydrogen-bonded species in solution. Il. Analysis of vs(XH) absorption bands. Chem. Phys. 1978, 32, 283–299. [Google Scholar] [CrossRef]
- Abramczyk, H. Profiles of the νs(X–H) mode in IR spectra of hydrogen-bonded complexes. Theoretical approach. Chem. Phys. 1985, 94, 91–98. [Google Scholar] [CrossRef]
- Abramczyk, H. IR νs(XH) Absorption band shape in H-bonded complex. I. Theory. Chem. Phys. 1990, 144, 305–318. [Google Scholar] [CrossRef]
- Blaise, P.; Wójcik, M.J.; Henri-Rousseau, O. Theoretical interpretation of the line shape of the gaseous acetic acid cyclic dimer. J. Chem. Phys. 2005, 122, 64306. [Google Scholar] [CrossRef] [PubMed]
- Chamma, D.; Henri-Rousseau, O. Infrared spectra of weak H-bonds: Beyond an adiabatic description of Fermi resonances. Chem. Phys. 1999, 248, 91–104. [Google Scholar] [CrossRef]
- Flakus, H.T.; Hachuła, B.; Hołaj-Krzak, J.T. Long-distance inter-hydrogen bond coupling effects in the polarized IR spectra of succinic acid crystals. Spectrochim. Acta A 2015, 142, 126–134. [Google Scholar] [CrossRef]
- Hołaj-Krzak, J.T.; Rekik, N.; Alsaif, N.A.M.; Lakshminarayana, G. Elucidating the Infrared Spectral Properties of Succinic Molecular Acid Crystals: Illustration of the Structure and the Hydrogen Bonds Energies of the Crystal and its Deuterated Analogs. J. Phys. Chem. A 2022, 126, 5604–5620. [Google Scholar] [CrossRef]
- Davydov, A.S. Theory of molecular excitons; McGraw-Hill Book Company: New York, NY, USA, 1962. [Google Scholar]
- Flakus, H.T.; Bańczyk, A. Abnormal distribution of protons and deuterons between the hydrogen bonds in cyclic centrosymmetric dimers in partially deuterated samples. J. Mol. Struct. 1999, 476, 57–68. [Google Scholar] [CrossRef]
- Flakus, H.T.; Pyzik, A.; Michta, A.; Kusz, J. “Reversal” exciton coupling effect in the IR spectra of the hydrogen bond cyclic dimers; polarized IR spectra of 3-hydroxy-4-methyl-2(3H)-thiazolethione crystals. Vib. Spectrosc. 2007, 44, 108–120. [Google Scholar] [CrossRef]
- Flakus, H.T.; Śmiszek-Lindert, W.; Stadnicka, K. Strong vibronic coupling effects in polarized IR spectra of the hydrogen bond in N-methylthioacetamide crystals. Chem. Phys. 2007, 335, 221–232. [Google Scholar] [CrossRef]
- Flakus, H.T. Strong dynamic coupling effects in the IR spectra of H-bonded 2-mercaptoquinoline. J. Mol. Struct. 1994, 318, 15–23. [Google Scholar] [CrossRef]
- Flakus, H.T. Vibronic model for H/D isotopic self-organization effects in centrosymmetric dimers of hydrogen bonds. J. Mol. Struct. 2003, 646, 15–23. [Google Scholar] [CrossRef]
- Hołaj-Krzak, J.T. Lack of the ’long-distance’ dynamical cooperative interactions due to low symmetry of hydrogen-bonded malonic acid aggregates in molecular crystals. Spectrochim. Acta A 2021, 246, 118993. [Google Scholar] [CrossRef]
- Flakus, H.T.; Hachuła, B.; Hołaj-Krzak, J.T.; Al-Agel, F.A.; Rekik, N. “Long-distance” H/D isotopic self-organization phenomena in scope of the infrared spectra of hydrogen-bonded terephthalic and phthalic acid crystals. Spectrochim. Acta A 2017, 173, 65–74. [Google Scholar] [CrossRef]
- Flakus, H.T. A new approach to the problem of the hydrogen bond spectra of the adipic acid crystal: The polarization and temperature effects. J. Mol. Struc. Theochem 1993, 285, 281–292. [Google Scholar] [CrossRef]
- Rekik, N.; Flakus, H.T.; Jarczyk-Jędryka, A.; Al-Agel, F.A.; Daouahi, M.; Jones, P.G.; Kusz, J.; Nowak, M. Elucidating the Davydov-coupling mechanism in hydrogen bond dimers: Experimental and theoretical investigation of the polarized IR spectra of 3-thiopheneacetic and 3-thiopheneacrylic acid crystals. J. Phys. Chem. Solids 2015, 77, 68–84. [Google Scholar] [CrossRef]
- Flakus, H.T.; Chełmecki, M. Infrared spectra of the hydrogen bond in benzoic acid crystals: Temperature and polarization effects. Spectrochim. Acta A 2002, 58, 179–196. [Google Scholar] [CrossRef]
- Dreimann, J.M.; Kohls, E.; Warmeling, H.F.W.; Stein, M.; Guo, L.F.; Garland, M.; Dinh, T.N.; Vorholt, A.J. In Situ Infrared Spectroscopy as a Tool for Monitoring Molecular Catalyst for Hydroformylation in Continuous Processes. ACS Catal. 2019, 9, 4308–4319. [Google Scholar] [CrossRef] [Green Version]
- Ryczkowski, J. IR spectroscopy in catalysis. Catal. 2001, 68, 263–381. [Google Scholar] [CrossRef]
- Mink, J. FT-IR spectroscopy in catalysis. Acta Phys. Hung. 1987, 61, 71–74. [Google Scholar] [CrossRef]
- Zhang, Y.; Peng, Y.; Li, K.; Liu, S.; Chen, J.; Li, J.; Gao, F.; Peden, C.H.F. Using Transient FTIR Spectroscopy to Probe Active Sites and Reaction Intermediates for Selective Catalytic Reduction of NO on Cu/SSZ-13 Catalysts. ACS Catal. 2019, 9, 6137–6145. [Google Scholar] [CrossRef]
- Zhang, C.C.; Gao, X.; Yilmaz, B. Development of FTIR Spectroscopy Methodology for Characterization of Boron Species in FCC Catalysts. Catalysts 2020, 10, 1327. [Google Scholar] [CrossRef]
- McCullagh, A.M.; Warringham, R.; Morisse, C.G.A.; Gilpin, L.F.; Brennan, C.; Mitchell, C.J.; Lennon, D. A Comparison of Experimental Procedures for the Application of Infrared Spectroscopy to Probe the Surface Morphology of an Alumina-Supported Palladium Catalyst. Top. Catal. 2021, 64, 1010–1020. [Google Scholar] [CrossRef]
- Salim, Y.S.; Chan, C.H.; Ong, C.H. Quality Control Tests and Matching Fourier-Transform Infrared Spectra for Raw and Intermediate Materials of 2-Pack Epoxy Paints. Macromol. Symp. 2016, 365, 209–222. [Google Scholar] [CrossRef]
- Sujka, K.; Koczoń, P.; Ceglińska, A.; Reder, M.; Ciemniewska-Żytkiewicz, H. The Application of FT-IR Spectroscopy for Quality Control of Flours Obtained from Polish Producers. J. Anal. Methods Chem. 2017, 2017, 4315678. [Google Scholar] [CrossRef] [PubMed]
- Van de Voort, F.R.; Sedman, J.; Ismail, A.A. A rapid FTIR quality-control method for determining fat and moisture in high-fat products. Food Chem. 1993, 48, 213–221. [Google Scholar] [CrossRef]
- Sun, S.; Chen, J.; Zhou, Q.; Lu, G.; Chan, K. Application of Mid-Infrared Spectroscopy in the Quality Control of Traditional Chinese Medicines. Planta Med. 2010, 76, 1987–1996. [Google Scholar] [CrossRef] [Green Version]
- Singh, S.K.; Jha, S.K.; Chaudhary, A.; Yadava, R.D.S.; Rai, S.B. Quality control of herbal medicines by using spectroscopic techniques and multivariate statistical analysis. Pharm. Biol. 2010, 48, 134–141. [Google Scholar] [CrossRef]
- Abdelkarim, O.; Abdellatif, M.H.; Khalil, D.; Bassioni, G. FTIR and UV in steel pipeline coating application. Int. J. GEOMATE 2020, 18, 130–135. [Google Scholar] [CrossRef]
- Kuang, D.; Cheng, Y.F. Study of cathodic protection shielding under coating disbondment on pipelines. Corros. Sci. 2015, 99, 249–257. [Google Scholar] [CrossRef]
- Suna, X.; Zhang, Q.; Wang, S.; Han, X.; Li, Y.; David, S.A. Effect of adhesive sealant on resistance spot welding of 301L stainless steel. J. Manuf. Process. 2020, 51, 62–72. [Google Scholar] [CrossRef]
- Suys, O.; Derenne, A.; Goormaghtigh, E. ATR-FTIR Biosensors for Antibody Detection and Analysis. Int. J. Mol. Sci. 2022, 23, 11895. [Google Scholar] [CrossRef] [PubMed]
- Santos, M.C.D.; Nascimento, Y.M.; Aráujo, J.M.G.; Lima, K.M.G. ATR-FTIR spectroscopy coupled with multivariate analysis techniques for the identification of DENV-3 in different concentrations in blood and serum: A new approach. RSC Adv. 2017, 7, 25640. [Google Scholar] [CrossRef] [Green Version]
- Zangi, M.; Donald, K.A.; Casals, A.G.; Franson, A.D.; Yu, A.J.; Marker, E.M.; Woodson, M.E.; Campbell, S.D.; Mottaleb, M.A.; Kumar, T.V.N.H.; et al. Synthetic derivatives of the antifungal drug ciclopirox are active against herpes simplex virus 2. Eur. J. Med. Chem. 2022, 238, 114443. [Google Scholar] [CrossRef]
- Silva, L.G.; Péres, A.F.S.; Freitas, D.L.D.; Morais, C.L.M.; Martin, F.L.; Crispim, J.C.O.; Lima, K.M.G. ATR-FTIR spectroscopy in blood plasma combined with multivariate analysis to detect HIV infection in pregnant women. Sci. Rep. 2020, 10, 20156. [Google Scholar] [CrossRef]
- Bryan, M.A.; Brauner, J.W.; Anderle, G.; Flach, C.R.; Brodsky, B.; Mendelsohn, R. FTIR Studies of Collagen Model Peptides: Complementary Experimental and Simulation Approaches to Conformation and Unfolding. J. Am. Chem. Soc. 2007, 129, 7877–7884. [Google Scholar] [CrossRef] [Green Version]
- Romo-Cárdenas, G.; Sánchez-López, J.d.D.; Luque, P.A.; Cosío-León, M.; Nieto-Hipólito, J.I.; Vázquez-Briseño, M. Insulin overlapping in whole blood FTIR spectroscopy in blood glucose measurements. Results Phys. 2017, 7, 1221–1222. [Google Scholar] [CrossRef]
- Griffith, D.W.T. FT-IR Measurements of Atmospheric Trace Gases and their Fluxes. In Handbook of Vibrational Spectroscopy; Chalmers, J.M., Griffiths, P.R., Eds.; John Wiley & Sons: London, UK, 2006; pp. 2823–2841. [Google Scholar]
- Lesmeister, L.; Koschorreck, M. A closed-chamber method to measure greenhouse gas fluxes from dry aquatic sediments. Atmos. Meas. Tech. 2017, 10, 2377–2382. [Google Scholar] [CrossRef] [Green Version]
- Denmead, O.T. Approaches to measuring fluxes of methane and nitrous oxide between landscapes and the atmosphere. Plant Soil 2008, 309, 5–24. [Google Scholar] [CrossRef]
- Livingston, G.P.; Hutchinson, G.L. Enclosure-based measurement of trace gas exchange: Applications and sources of error. In Biogenic Trace Gases: Measuring Emissions from Soil and Water; Matson, P.A., Harris, R.C., Eds.; Blackwell Scientific: Oxford, UK, 1995; pp. 14–51. [Google Scholar]
- Chojnicki, B.H.; Urbaniak, M.; Leśny, J.; Juszczak, R.; Olejnik, J. Nowoczesne metody pomiaru wymiany masy i energii pomiędzy podłożem a atmosferą. Przegląd Naukowy Inżynieria i Kształtowanie Środowiska 2008, 17, 91–97. [Google Scholar]
- Venterea, R.T.; Parkin, T.B. Quantifying biases in non-steady-state chamber measurements of soil-atmosphere gas exchange. In Managing Agricultural Greenhouse Gases: Coordinated Agricultural Research through GRACEnet to Address Our Changing Climate; Liebig, M.A., Franzluebbers, A.J., Follett, R.F., Eds.; Elsevier: Amsterdam, The Netherlands, 2012; pp. 327–343. [Google Scholar]
- Gunderson, C.A.; Sholtis, J.D.; Wullschleger, S.D.; Tissue, D.T.; Hanson, P.J.; Norby, R.J. Environmental and stomatal control of photosynthetic enhancement in the canopy of a sweetgum (Liquidambar styraciflua L.) plantation during 3 years of CO2 enrichment. Plant Cell Environ. 2002, 25, 379–393. [Google Scholar] [CrossRef]
- Acosta, M.; Janouš, D.; Marek, M.V. Soil surface CO2 fluxes in a Norway spruce stand. J. For. Sci. 2004, 50, 573–578. [Google Scholar] [CrossRef] [Green Version]
- Michalak-Galczewska, M. Dobowa i Sezonowa Zmienność Strumieni CO2 Torfowiska w Rzecinie. Ph.D. Thesis, Poznań University of Life Sciences, Poznań, Poland, 2011. [Google Scholar]
- Baran, M. Ocena Wybranych Składników Bilansu Ditlenku Węgla w Lesie Sosnowym z Wykorzystaniem Mikrometerologicznych Metod Pomiarowych. Ph.D. Thesis, Poznań University of Life Sciences, Poznań, Poland, 2015. [Google Scholar]
- Benedi, J.Á.; Muñoz-Carpena, R. Soil-Water-Solute Process Characterization: An Integrated Approach; CRC Press: Boca Raton, FL, USA, 2005; pp. 465–496. [Google Scholar]
- Koskinen, M.; Minkkinen, K.; Ojanen, P.; Kämäräinen, M.; Laurila, T.; Lohila, A. Measurements of CO2 exchange with an automated chamber system throughout the year: Challenges in measuring night-time respiration on porous peat soil. Biogeosciences 2014, 11, 347–363. [Google Scholar] [CrossRef] [Green Version]
- Pumpanen, J.; Longdoz, B.; Kutsch, L. Field measurements of soil respiration: Principles and constraints, potentials and limitations of different methods. In Soil Carbon Dynamics: An Integrated Methodology; Kutsch, W.L., Bahn, M., Heinemeyer, A., Eds.; Cambridge University Press: Cambridge, UK, 2009; pp. 16–33. [Google Scholar]
- Livingston, G.P.; Hutchinson, G.L.; Spartalian, K. Trace Gas Emission in Chambers A Non-Steady-State Diffusion Model. Soil Sci. Soc. Am. J. 2006, 70, 1459–1469. [Google Scholar] [CrossRef] [Green Version]
- Kutzbach, L.; Schneider, J.; Sachs, T.; Giebels, M.; Nykanen, H.; Shurpali, N.J.; Martikainen, P.J.; Alm, J.; Wilmking, M. CO2 flux determination by closed-chamber methods can be seriously biased by inappropriate application of linear regression. Biogeosciences 2007, 4, 1005–1025. [Google Scholar] [CrossRef]
- Rinne, J. Application and Development of Surface Layer Flux Techniques for Measurements of Volatile Organic Compound Emissions from Vegetation. Ph.D. Thesis, University of Helsinki, Helsinki, Finland, 2001. [Google Scholar]
- Kędziora, A.; Olejnik, J.; Tuchołka, S.; Leśny, J. Evapotranspiration within Wielkopolska and Cessičres landscapes. In L’eau de la Cellule au Paysage; Wicherek, S., Ed.; Elsevier: Amsterdam, The Netherlands, 1998; pp. 93–104. [Google Scholar]
- Olejnik, J.; Eulenstein, F.; Kędziora, A.; Werner, A. Evaluation of water balance model using data for bare soil and crop surfaces in Middle Europe. Agric. For. Meteorol. 2001, 106, 105–116. [Google Scholar] [CrossRef]
- Szeląg-Wasielewska, E. Picoplankton and other size groups of phytoplankton in various shallow lakes. Hydrobiologia 1997, 342/343, 79–85. [Google Scholar] [CrossRef]
- Pasztaleniec, A.; Poniewozik, M. Phytoplankton based assessment of the ecological status of four shallow lakes (Eastern Poland) according to Water Framework Directive–a comparison of approaches. Limnologica 2010, 40, 251–259. [Google Scholar] [CrossRef] [Green Version]
- Dods, W.K. Freshwater Ecology. Concepts and Environmental Applications, 1st ed.; Academic Press: San Diego, CA, USA, 2002; p. 569. [Google Scholar]
- Feng, G.-D.; Zhang, F.; Cheng, L.-H.; Xu, X.-H.; Zhang, L.; Chen, H.-L. Evaluation of FT-IR and Nile Red methods for microalgal lipid characterization and biomass composition determination. Bioresour. Technol. 2013, 128, 107–112. [Google Scholar] [CrossRef] [PubMed]
- Niemi, C.; Mortensen, A.M.; Rautenberger, R.; Matsson, S.; Gorzsas, A.; Gentili, F.G. Rapid and acurate determination of protein content in North Atlantic seaweed by NIR and FRIR spectroscopies. Food Chem. 2023, 404, 134700. [Google Scholar] [CrossRef]
- Stehfest, K.; Toepel, J.; Wilhelm, C. The application of micro-FTIR spectroscopy to analyze nutrient stress-related changes in biomass composition of phytoplankton algae. Plant Physiol. Biochem. 2005, 43, 717–726. [Google Scholar] [CrossRef] [PubMed]
- Xiong, Q.; Hu, L.-X.; Liu, Y.-S.; Wang, T.-T.; Ying, G.-G. New insight into the toxic effects of chloramphenicol and roxithromycin to algae using FTIR spectroscopy. Aquat. Toxicol. 2019, 207, 197–207. [Google Scholar] [CrossRef] [PubMed]
- Zhang, W.; Zhang, M.; Lin, K.; Sun, W.; Xiong, B.; Guo, M.; Cui, X.; Fu, R. Eco-toxicological effect of Carbamazepine on Scenedesmus obliquus and Chlorella pyrenoidosa. Environ. Toxicol. Pharmacol. 2012, 33, 344–352. [Google Scholar] [CrossRef] [PubMed]
- Lampert, W.; Sommer, U. Ecology of Freshwater, 1st ed.; PWN: Warszawa, Poland, 2001; p. 415. [Google Scholar]
- Carlson, C.A. Production and removal processes. In Biogeochemistry of Marine Dissolved Organic Matter, 1st ed.; Hansel, D.A., Carlson, C.A., Eds.; Academic Press: Cambridge, MA, USA, 2002; pp. 91–151. [Google Scholar]
- Berg, B.; McClaugherty, C. Plant Litter: Decomposition, Humus Formation, Carbon Sequestration, 4th ed.; Springer: Cham, Switzerland, 2020; p. 342. [Google Scholar] [CrossRef]
- Pengui, L.; Hur, J. Utilization of UV-Vis spectroscopy and related data analyses for dissolved organic matter (DOM) studies: A review. Crit. Rev. Environ. Sci. Technol. 2017, 47, 131–154. [Google Scholar] [CrossRef]
- Mielnik, L.; Kowalczuk, P. Optical characteristic of humic acids from lake sediments by excitation-emission matrix fluorescence with PARAFAC model. J. Soils Sediments 2018, 18, 2851–2862. [Google Scholar] [CrossRef] [Green Version]
- Weber, J.; Jamroz, E.; Kocowicz, A.; Debicka, M.; Bekier, J.; Ćwieląg-Piasecka, I.; Ukalska-Jaruga, A.; Mielnik, L.; Bejger, R.; Jerzykiewicz, M. Optimized isolation method of humin fraction from mineral soil material. Environ. Geochem. Health 2022, 44, 1289–1298. [Google Scholar] [CrossRef]
- Bińczycki, T.M.; Weber, J.; Mielnik, L.; Asensio, C. Lead isotope ratios in Podzol profiles as a tracer of pollution source in the subalpine zone of the Karkonosze National Park, Sudety Mts (south-western Poland). CATENA 2020, 189, 104476. [Google Scholar] [CrossRef]
- R: A Language and Environment for Statistical Computing. Available online: https://www.gbif.org/tool/81287/r-a-language-and-environment-for-statistical-computing (accessed on 17 November 2022).
- PARAFAC Analysis of EEM Data to Separate DOM Components in R. Available online: https://cran.r-project.org/web/packages/staRdom/vignettes/PARAFAC_analysis_of_EEM.html (accessed on 17 November 2022).
- Murphy, K.R.; Stedmon, C.A.; Graeber, D.; Bro, R. Fluorescence spectroscopy and multi-way techniques. PARAFAC. Anal. Methods 2013, 5, 6557. [Google Scholar] [CrossRef] [Green Version]
- Hermann, P.; Hoehl, A.; Ulrich, G.; Fleischmann, C.; Hermelink, A.; Kästner, B.; Patoka, P.; Hornemann, A.; Beckhoff, B.; Rühl, E.; et al. Characterization of semiconductor materials using synchrotron radiation-based near-field infrared microscopy and nano-FTIR spectroscopy. Opt. Express 2014, 22, 17948–17958. [Google Scholar] [CrossRef] [PubMed]
- Ayeshamariam, A.; Ramalingam, S.; Bououdina, M.; Jayachandran, M. Preparation and characterizations of SnO2 nanopowder and spectroscopic (FT-IR, FT-Raman, UV-Visible and NMR) analysis using HF and DFT calculations. Spectrochim. Acta A 2014, 118, 1135–1143. [Google Scholar] [CrossRef]
- Zahadiya, H.; Wijesundera, R.P.; Hettiarachchi, C.V.; Perera, I.R. Effect of Benzene Derivatives as Guest Molecules on Semiconductor Properties of MOF-199. ChemistrySelect 2021, 6, 425–429. [Google Scholar] [CrossRef]
- Kailasa, S.K.; Wu, H. Semiconductor cadmium sulphide nanoparticles as matrices for peptides and as co-matrices for the analysis of large proteins in matrix-assisted laser desorption/ionization reflectron and linear time-of-flight mass spectrometry. Rapid Commun. Mass Spectrom. 2011, 25, 271–280. [Google Scholar] [CrossRef] [PubMed]
- Kang, M.; Lee, J.H.; Lee, S.-H.; Chung, C.-H.; Yoon, K.J.; Ogino, K.; Miyata, S.; Choung, S.-J. Preparation of TiO2 film by the MOCVD method and analysis for decomposition of trichloroethylene using in situ FT-IR spectroscopy. J. Mol. Catal. A Chem. 2003, 193, 273–283. [Google Scholar] [CrossRef]
- Rajagopal, G.; Maruthamuthu, S.; Mohanan, S.; Palaniswamy, N. Biocidal effects of photocatalytic semiconductor TiO2. Colloids Surf. B 2006, 51, 107–111. [Google Scholar] [CrossRef]
- Rahnama, A.; Gharagozlou, M. Preparation and properties of semiconductor CuO nanoparticles via a simple precipitation method at different reaction temperatures. Opt. Quant. Electron. 2012, 44, 313–322. [Google Scholar] [CrossRef]
- Van de Voort, F.R.; Ismail, A.A. Proximate analysis of foods by mid-FTIR spectroscopy. Trends Food Sci. Technol. 1991, 2, 13–17. [Google Scholar] [CrossRef]
- Pei, X.; Tandon, A.; Alldrick, A.; Giorgi, L.; Huang, W.; Yang, R. The China melamine milk scandal and its implications for food safety regulation. Food Policy 2011, 36, 412–420. [Google Scholar] [CrossRef]
- Premanandh, J. Horse meat scandal—A wake-up call for regulatory authorities. Food Control 2013, 34, 568–569. [Google Scholar] [CrossRef]
- Food Quality & Safety. Available online: http://www.foodqualityandsafety.com/article/the-cumin-scandal-accidental-or-fraudulent/?singlepage=1 (accessed on 8 December 2022).
- Spink, J.; Moyer, D.C. Defining the Public Health Threat of Food Fraud. J. Food Sci. 2011, 76, R157–R163. [Google Scholar] [CrossRef]
- Cozzolino, D. Recent trends on the use of infrared spectroscopy to trace and authenticate natural and agricultural food products. Appl. Spectrosc. Rev. 2012, 47, 518–530. [Google Scholar] [CrossRef]
- Moore, J.C.; Spink, J.; Lipp, M. Development and Application of a Database of Food Ingredient Fraud and Economically Motivated Adulteration from 1980 to 2010. J. Food Sci. 2012, 77, R118–R126. [Google Scholar] [CrossRef] [PubMed]
- Nunes, K.M.; Andrade, M.V.O.; Filho, A.M.P.S.; Lasmar, M.C.; Sena, M.M. Detection and characterisation of frauds in bovine meat in natura by non-meat ingredient additions using data fusion of chemical parameters and ATR-FTIR spectroscopy. Food Chem. 2016, 205, 14–22. [Google Scholar] [CrossRef] [PubMed]
- Wielogorska, E.; Chevallier, O.; Black, C.; Galvin-King, P.; Delêtre, M.; Kelleher, C.T.; Haughey, S.A.; Elliott, C.T. Development of a comprehensive analytical platform for the detection and quantitation of food fraud using a biomarker approach. The oregano adulteration case study. Food Chem. 2018, 239, 32–39. [Google Scholar] [CrossRef] [PubMed] [Green Version]
- Amiry, S.; Esmaiili, M.; Alizadeh, M. Classification of adulterated honeys by multivariate analysis. Food Chem. 2017, 224, 390–397. [Google Scholar] [CrossRef] [PubMed]
- Georgouli, K.; Del Rincon, J.M.; Koidis, A. Continuous statistical modelling for rapid detection of adulteration of extra virgin olive oil using mid infrared and Raman spectroscopic data. Food Chem. 2017, 217, 735–742. [Google Scholar] [CrossRef] [PubMed] [Green Version]
- Reis, N.; Botelho, B.G.; Franca, A.S.; Oliveira, L.S. Simultaneous Detection of Multiple Adulterants in Ground Roasted Coffee by ATR-FTIR Spectroscopy and Data Fusion. Food Anal. Methods 2017, 10, 2700–2709. [Google Scholar] [CrossRef]
- Black, C.; Haughey, S.A.; Chevallier, O.P.; Galvin-King, P.; Elliott, C.T. A comprehensive strategy to detect the fraudulent adulteration of herbs: The oregano approach. Food Chem. 2016, 210, 551–557. [Google Scholar] [CrossRef] [Green Version]
- Sicherer, S.H.; Burks, A.W.; Sampson, H.A. Clinical features of acute allergic reactions to peanut and tree nuts in children. Pediatrics 1998, 102, e6. [Google Scholar] [CrossRef] [Green Version]
- Valand, R.; Tanna, S.; Lawson, G.; Bengtström, L. A review of Fourier Transform Infrared (FTIR) spectroscopy used in food adulteration and authenticity investigations. Food Addit. Contam.–Chem. Anal. Control Expo. Risk Assess. 2020, 37, 19–38. [Google Scholar] [CrossRef] [PubMed]
- World-food.net. The Use of FT-IR Spectroscopy in the Identification of Vegetable Oils Adulteration. Available online: www.world-food.net (accessed on 8 December 2022).
- Grošelj, N.; Vračko, M.; Pierna, J.A.F.; Baeten, V.; Novič, M. The use of FT-MIR spectroscopy and counter-propagation artificial neural networks for tracing the adulteration of olive oil. Acta Chim. Slov. 2008, 55, 935–941. [Google Scholar]
- Özdemir, D.; Öztürk, B. Near infrared spectroscopic determination of olive oil adulteration with sunflower and corn oil. J. Food Drug Anal. 2007, 15, 40–47. [Google Scholar] [CrossRef]
- Tay, A.; Singh, R.K.; Krishnan, S.S.; Gore, J.P. Authentication of olive oil adulterated with vegetable oils using Fourier transform infrared spectroscopy. LWT 2002, 35, 99–103. [Google Scholar] [CrossRef]
- Kasemsumran, S.; Kang, N.; Christy, A.; Ozaki, Y. Partial least squares processing of near-infrared spectra for discrimination and quantification of adulterated olive oils. Spectrosc. Lett. 2005, 38, 839–851. [Google Scholar] [CrossRef]
- Kaavya, R.; Pandiselvam, R.; Mohammed, M.; Dakshayani, R.; Kothakota, A.; Ramesh, S.V.; Cozzolino, D.; Ashokkumar, C. Application of infrared spectroscopy techniques for the assessment of quality and safety in spices: A review. Appl. Spectrosc. Rev. 2020, 55, 593–611. [Google Scholar] [CrossRef]
- Dasenaki, M.E.; Thomaidis, N.S. Quality and authenticity control of fruit juices–A review. Molecules 2019, 24, 1014. [Google Scholar] [CrossRef] [Green Version]
- Jha, S.N.; Gunasekaran, S. Authentication of sweetness of mango juice using Fourier transform infrared-attenuated total reflection spectroscopy. J. Food Eng. 2010, 101, 337–342. [Google Scholar] [CrossRef]
- Snyder, A.B.; Sweeney, C.F.; Rodriguez-Saona, L.E.; Giusti, M.M. Rapid authentication of concord juice concentration in a grape juice blend using Fourier-Transform infrared spectroscopy and chemometric analysis. Food Chem. 2014, 147, 295–301. [Google Scholar] [CrossRef] [Green Version]
- Vardin, H.; Tay, A.; Ozen, B.; Mauer, L. Authentication of pomegranate juice concentrate using FTIR spectroscopy and chemometrics. Food Chem. 2008, 108, 742–748. [Google Scholar] [CrossRef] [Green Version]
- Ellis, D.I.; Ellis, J.; Muhamadali, H.; Xu, Y.; Horn, A.B.; Goodacre, R. Rapid, high-throughput, and quantitative determination of orange juice adulteration by Fourier-transform infrared spectroscopy. Anal. Methods 2016, 8, 5581–5586. [Google Scholar] [CrossRef] [Green Version]
- Liu, H.Y.; Wadood, S.A.; Xia, Y.; Liu, Y.; Guo, H.; Guo, B.L.; Gan, R.Y. Wheat authentication: An overview on different techniques and chemometric methods. Crit. Rev. Food Sci. Nutr. 2023, 63, 33–56. [Google Scholar] [CrossRef] [PubMed]
- Iwuozor, K.O.; Anyanwu, V.U.; Olaniyi, B.O.; Mbamalu, P.S.; Adeniyi, A.G. Adulteration of Sugar: A Growing Global Menace. Sugar Tech. 2022, 24, 914–919. [Google Scholar] [CrossRef]
- Roosmayanti, F.; Rismiwindira, K.; Masithoh, R.E. Detection of coconut (Cocos nucivera) sugar adulteration in palm (Arenga pinnata Merrill) sugar by Fourier Transform Infrared (FT-IR) Spectroscopy. Food Res. 2021, 5, 31–36. [Google Scholar] [CrossRef]
- Chaiwanon, P.; Puwastien, P.; Nitithamyong, A.; Sirichakwal, P.P. Calcium fortification in soybean milk and in vitro bioavailability. J. Food Compos. Anal. 2000, 13, 319–327. [Google Scholar] [CrossRef]
- Rozenfeld, P.; Docena, G.H.; Añón, M.C.; Fossati, C.A. Detection and identification of a soy protein component that cross-reacts with caseins from cow’s milk. Clin. Exp. Immunol. 2002, 130, 49–58. [Google Scholar] [CrossRef]
- Jaiswal, P.; Jha, S.N.; Borah, A.; Gautam, A.; Grewal, M.K.; Jindal, G. Detection and quantification of soymilk in cow-buffalo milk using Attenuated Total Reflectance Fourier Transform Infrared spectroscopy (ATR-FTIR). Food Chem. 2015, 168, 41–47. [Google Scholar] [CrossRef]
- Candoğan, K.; Altuntas, E.G.; İğci, N. Authentication and Quality Assessment of Meat Products by Fourier-Transform Infrared (FTIR) Spectroscopy. Food Eng. Rev. 2021, 13, 66–91. [Google Scholar] [CrossRef]
- Troy, D.J.; Ojha, K.S.; Kerry, J.P.; Tiwari, B.K. Sustainable and consumer-friendly emerging technologies for application within the meat industry: An overview. Meat Sci. 2016, 120, 2–9. [Google Scholar] [CrossRef]
- Adiani, V.; Gupta, S.; Ambolikar, R.; Variyar, P.S. Development of rapid method to assess microbial quality of minimally processed pomegranate arils using FTIR. Sens. Actuators B Chem. 2018, 260, 800–807. [Google Scholar] [CrossRef]
- Adiani, V.; Gupta, S.; Variyar, P.S. Microbial quality assessment of minimally processed pineapple using GCMS and FTIR in tandem with chemometrics. Sci. Rep. 2020, 10, 6203. [Google Scholar] [CrossRef] [PubMed] [Green Version]
- Arthur, C.; Baker, J.; Bamford, H. Proceedings of the International Research Workshop on the Occurrence, Effects and Fate of Microplastic Marine Debris, September 9-11, 2008, University of Washington Tacoma, Tacoma, WA, USA.; National Oceanic and Atmospheric Administration: Silver Spring, MD, USA, January 2009. [Google Scholar]
- Bouwmeester, H.; Hollman, P.C.H.; Peters, R.J.B. Potential Health Impact of Environmentally Released Micro- and Nanoplastics in the Human Food Production Chain: Experiences from Nanotoxicology. Environ. Sci. Technol. 2015, 49, 8932–8947. [Google Scholar] [CrossRef] [PubMed]
- Botterell, Z.L.R.; Beaumont, N.; Dorrington, T.; Steinke, M.; Thompson, R.C.; Lindeque, P.K. Bioavailability and effects of microplastics on marine zooplankton: A review. Environ. Pollut. 2019, 245, 98–110. [Google Scholar] [CrossRef] [PubMed]
- Veerasingam, S.; Ranjani, M.; Venkatachalapathy, R.; Bagaev, A.; Mukhanov, V.; Litvinyuk, D.; Mugilarasan, M.; Gurumoorthi, K.; Guganathan, L.; Aboobacker, V.M.; et al. Contributions of Fourier transform infrared spectroscopy in microplastic pollution research: A review. Crit. Rev. Environ. Sci. Technol. 2021, 51, 2681–2743. [Google Scholar] [CrossRef]
- Mecozzi, M.; Pietroletti, M.; Monakhova, Y.B. FTIR spectroscopy supported by statistical techniques for the structural characterization of plastic debris in the marine environment: Application to monitoring studies. Mar. Pollut. Bull. 2016, 106, 155–161. [Google Scholar] [CrossRef]
- Chalmers, J.M. Infrared Spectroscopy in Analysis of Polymers and Rubbers. In Encyclopedia of Analytical Chemistry, 1st ed.; Meyers, R.A., Provder, T., Eds.; John Wiley & Sons: London, UK, 2006. [Google Scholar] [CrossRef]
- Cox, R.J.; Peterson, H.L.; Young, J.; Cusik, C.; Espinoza, E.O. The forensic analysis of soil organic by FTIR. Forensic Sci. Int. 2000, 108, 107–116. [Google Scholar] [CrossRef]
- Chophi, R.; Sharma, S.; Singh, R. Forensic analysis of red lipsticks using ATR-FTIR spectroscopy and chemometrics. Forensic Chem. 2020, 17, 100209. [Google Scholar] [CrossRef]
- Muehlethaler, C.; Massonnet, G.; Buzzini, P. Influence of the shaking time on the forensic analysis of FTIR and Raman spectra of spray paints. Forensic Sci. Int. 2014, 237, 78–85. [Google Scholar] [CrossRef]
- Materazzi, S.; Gregori, A.; Ripani, L.; Apriceno, A.; Risoluti, R. Cocaine profiling: Implementation of a predictive model by ATR-FTIR coupled with chemometrics in forensic chemistry. Talanta 2017, 166, 328–335. [Google Scholar] [CrossRef]
- Braz, A.; López-López, M.; García-Ruiz, C. Raman spectroscopy for forensic analysis of inks in questioned documents. Forensic Sci. Int. 2013, 232, 206–212. [Google Scholar] [CrossRef]
- Burnier, C.; Favre, V.; Massonnet, G. The use of an optimized DRIFTS-FTIR method for the forensic analysis and classification of silicone condom lubricants. Spectrochim. Acta A 2021, 261, 120025. [Google Scholar] [CrossRef]
- Capobianco, G.; Bracciale, M.P.; Sali, D.; Sbardella, F.; Belloni, P.; Bonifazi, G.; Serranti, S.; Santarelli, M.L.; Guidi, M.C. Chemometrics approach to FT-IR hyperspectral imaging analysis of degradation products in artwork cross-section. Microchem. J. 2017, 132, 69–76. [Google Scholar] [CrossRef]
- Pronti, L.; Romani, M.; Viviani, G.; Stani, C.; Gioia, P.; Cestelli-Guidi, M. Advanced methods for the analysis of Roman wall paintings: Elemental and molecular detection by means of synchrotron FT-IR and SEM micro-imaging spectroscopy. Rend. Lincei Sci. Fis. Nat. 2020, 31, 485–493. [Google Scholar] [CrossRef]
- Felix, V.S.; Mello, U.L.; Pereira, M.O.; Oliveira, A.L.; Ferreira, D.S.; Carvalho, C.S.; Silva, F.L.; Pimenta, A.R.; Garcia Diniz, M.; Freitas, R.P. Analysis of a European cupboard by XRF, Raman and FT-IR. Radiat. Phys. Chem. 2018, 151, 198–204. [Google Scholar] [CrossRef]
- Josepha, E.; Ricci, C.; Kazarian, S.G.; Mazzeo, R.; Prati, S.; Ioele, M. Macro-ATR-FT-IR spectroscopic imaging analysis of paint cross-sections. Vib. Spectrosc. 2010, 53, 274–278. [Google Scholar] [CrossRef]
- Simon, M.; Vianello, A.; Shashoua, Y.; Vollertsen, J. Accelerated weathering affects the chemical and physical properties of marine antifouling paint microplastics and their identification by ATRFTIR spectroscopy. Chemosphere 2021, 274, 129749. [Google Scholar] [CrossRef] [PubMed]


| Vibration | νX–H | νX···Y | δX–H | δX···Y | γX–H···Y |
|---|---|---|---|---|---|
| E [cm−1] | 1750 < E < 3700 | 50 < E < 650 | 1700 < E < 1800 | E < 50 | 450 < E < 950 |
| Chemical Class/Element | Wavenumbers [cm−1] |
|---|---|
| Carbohydrates | 880–1064 |
| Phosphorus | 1190–1350 |
| Amida II | 1480–1575 |
| Amida I | 1575–1705 |
| Lipids | 1708–1780 |
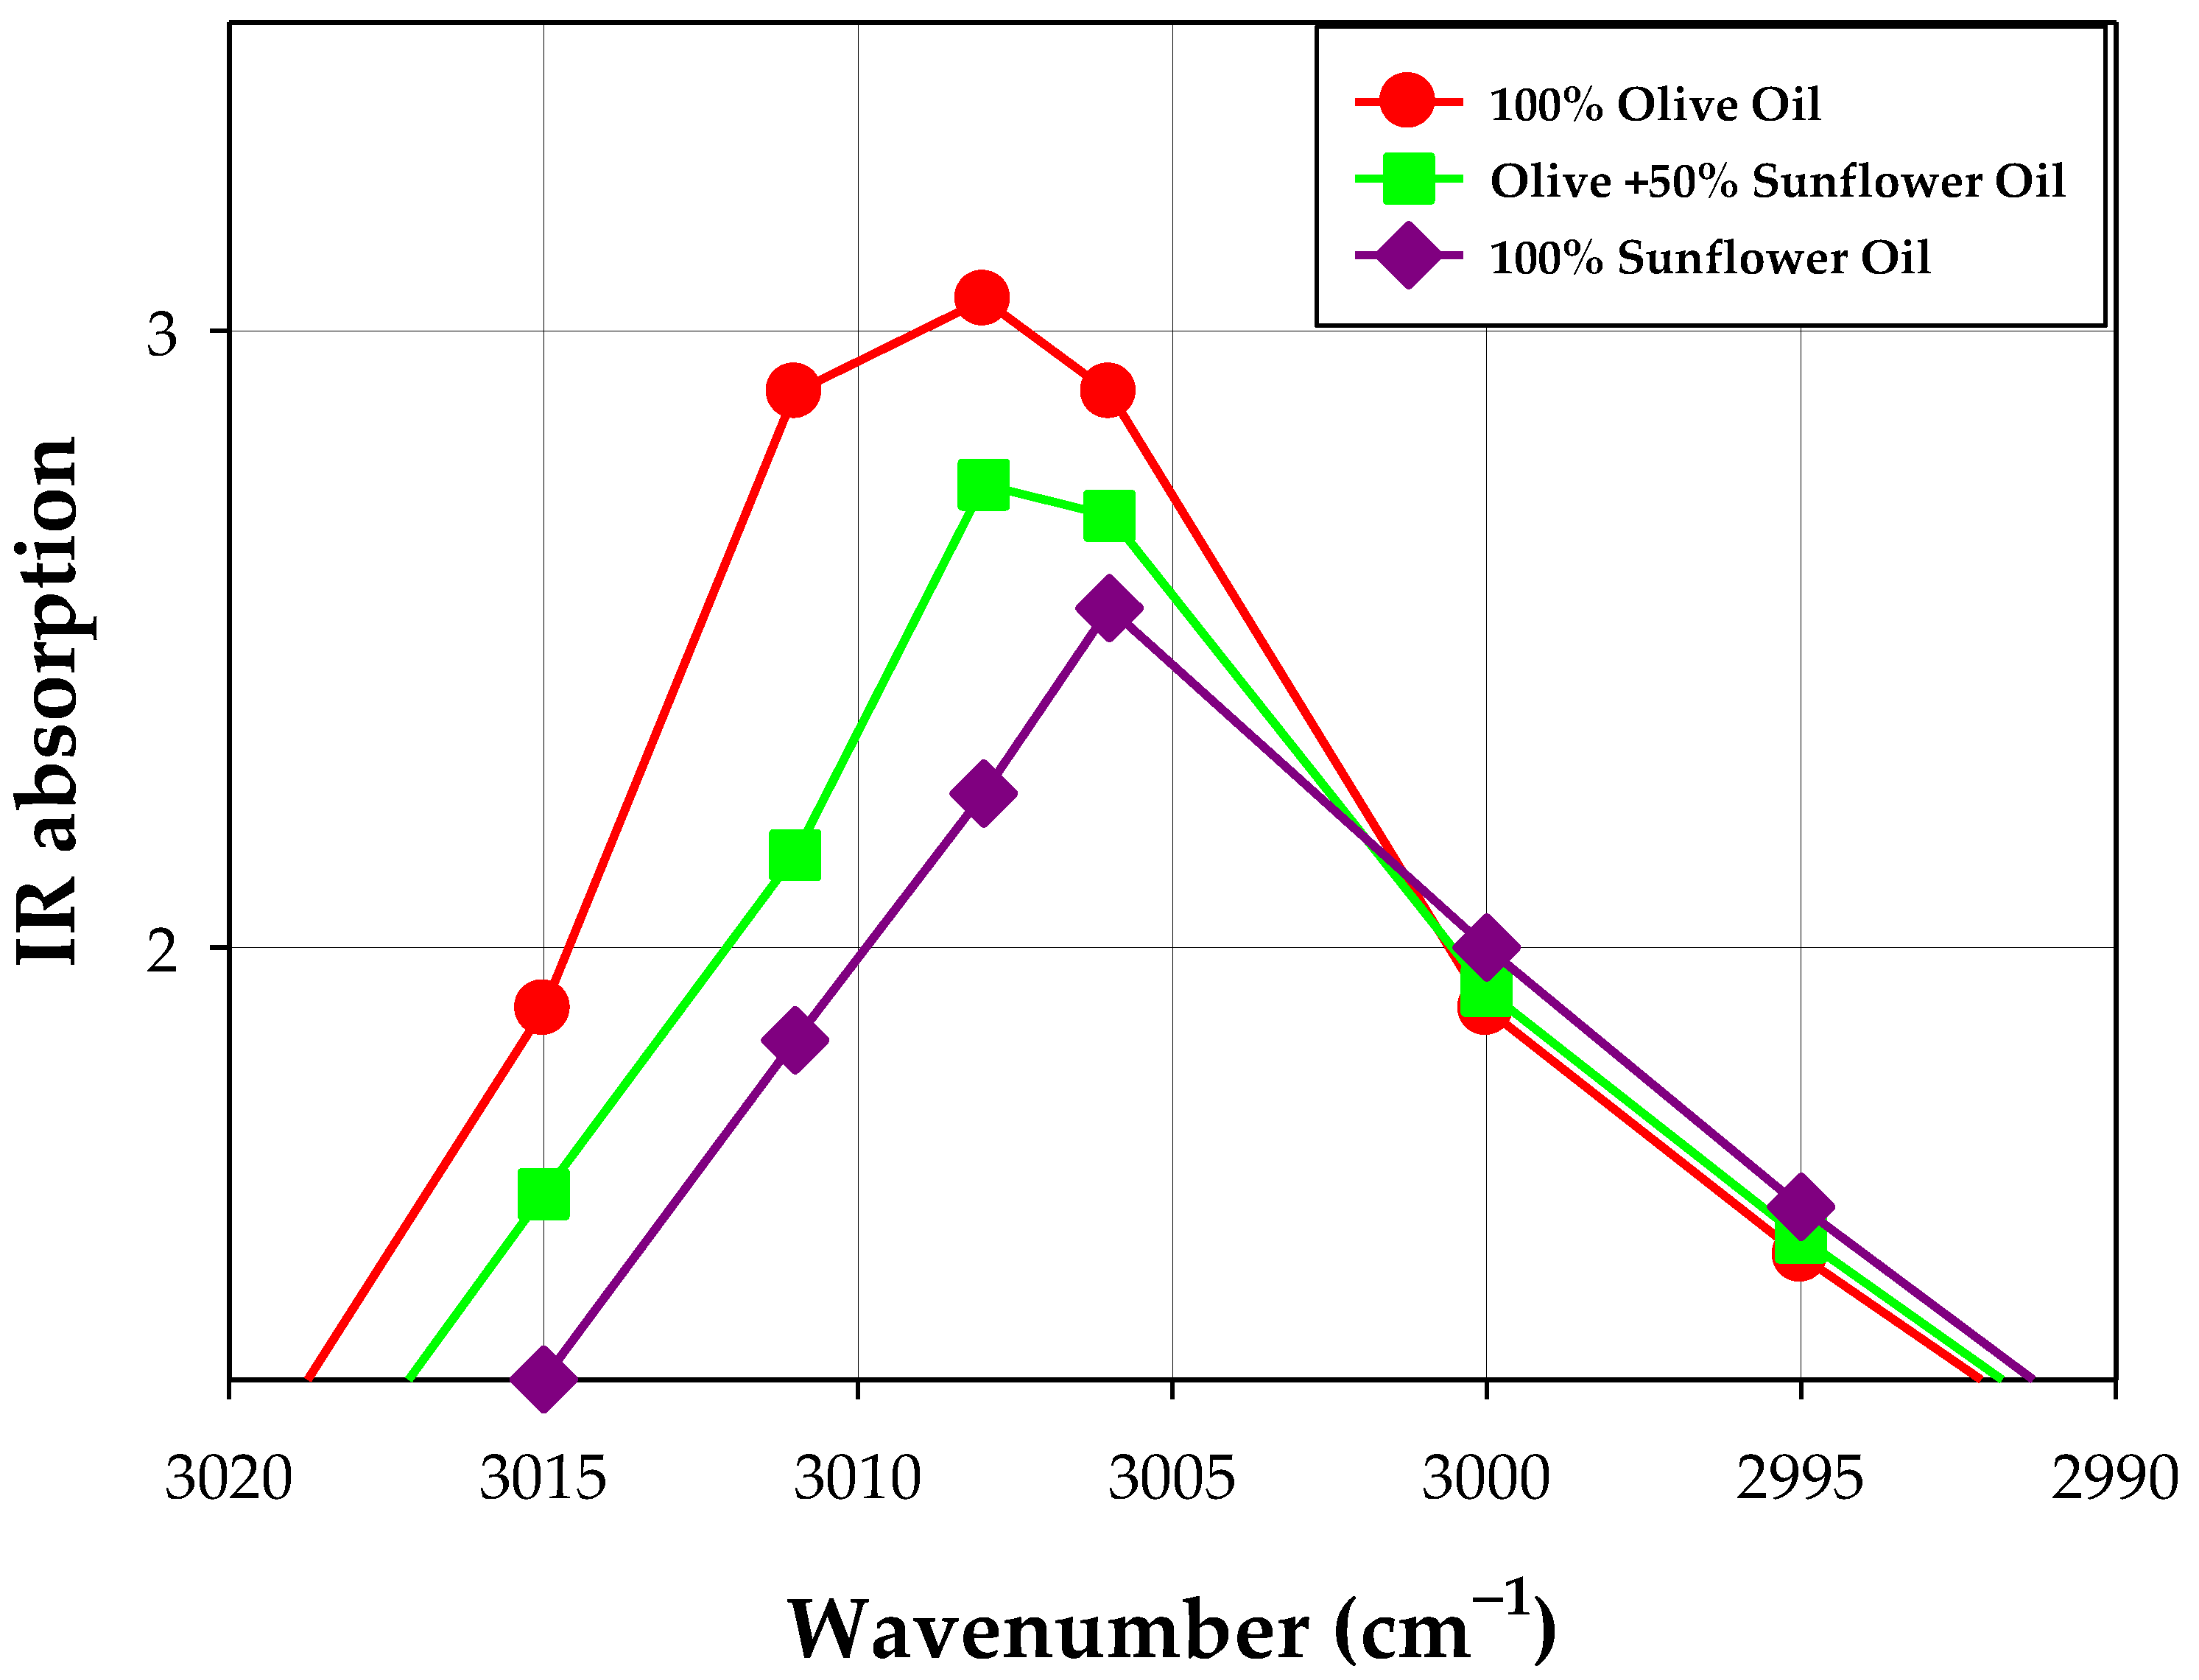
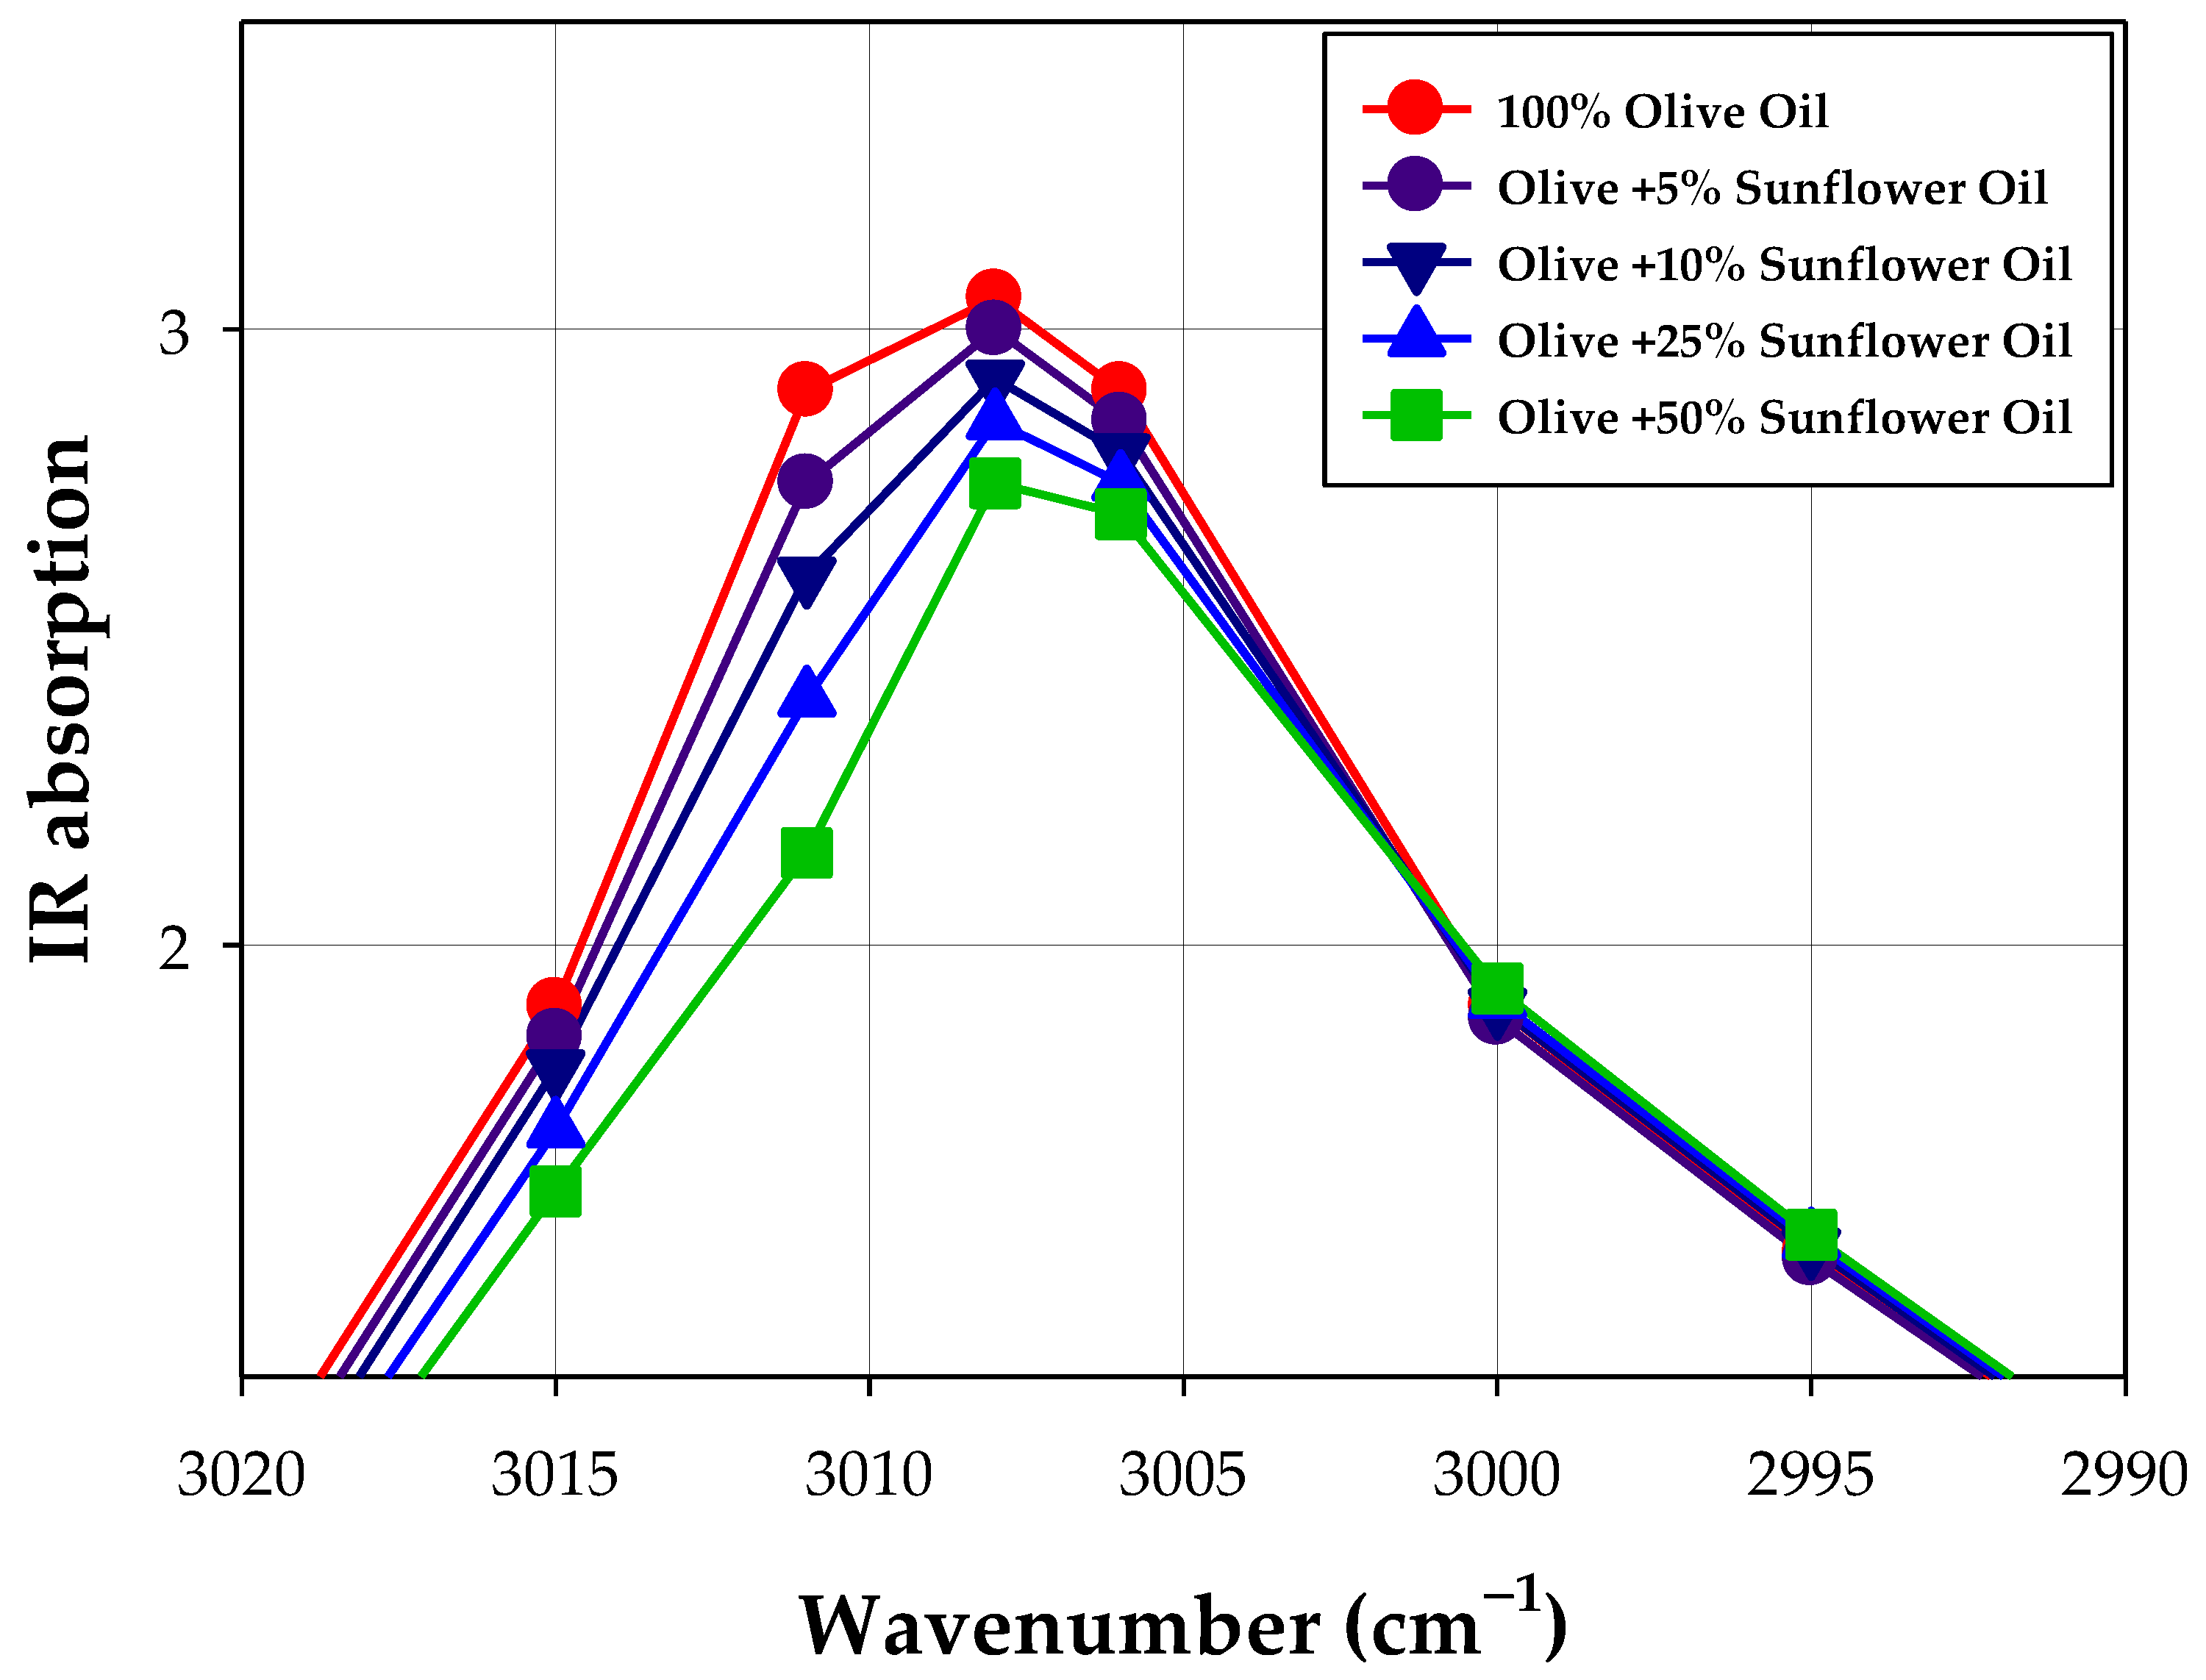
| Sample | Wavenumber [cm−1] | ||||||||
|---|---|---|---|---|---|---|---|---|---|
| 1753 | 2990 | 2995 | 3000 | 3006 | 3008 | 3011 | 3015 | 3020 | |
| Olive oil | 3.83 | 1.15 | 1.50 | 1.90 | 2.71 | 2.38 | 1.64 | 1.90 | 1.10 |
| Olive + 5% sunflower oil | 3.16 | 1.14 | 1.49 | 1.88 | 2.29 | 2.44 | 1.67 | 1.85 | 1.05 |
| Olive + 10% sunflower oil | 3.56 | 1.15 | 1.51 | 1.90 | 2.45 | 2.56 | 1.71 | 1.80 | 1.00 |
| Olive + 25% sunflower oil | 3.58 | 1.16 | 1.52 | 1.91 | 3.13 | 2.74 | 2.21 | 1.70 | 0.95 |
| Olive + 50% sunflower oil | 3.54 | 1.17 | 1.53 | 1.93 | 3.33 | 2.96 | 2.61 | 1.60 | 0.90 |
| Sunflower oil | 3.47 | 1.20 | 1.58 | 2.00 | 2.20 | 2.35 | 2.75 | 1.30 | 0.70 |
Disclaimer/Publisher’s Note: The statements, opinions and data contained in all publications are solely those of the individual author(s) and contributor(s) and not of MDPI and/or the editor(s). MDPI and/or the editor(s) disclaim responsibility for any injury to people or property resulting from any ideas, methods, instructions or products referred to in the content. |
© 2023 by the authors. Licensee MDPI, Basel, Switzerland. This article is an open access article distributed under the terms and conditions of the Creative Commons Attribution (CC BY) license (https://creativecommons.org/licenses/by/4.0/).
Share and Cite
Koczoń, P.; Hołaj-Krzak, J.T.; Palani, B.K.; Bolewski, T.; Dąbrowski, J.; Bartyzel, B.J.; Gruczyńska-Sękowska, E. The Analytical Possibilities of FT-IR Spectroscopy Powered by Vibrating Molecules. Int. J. Mol. Sci. 2023, 24, 1013. https://doi.org/10.3390/ijms24021013
Koczoń P, Hołaj-Krzak JT, Palani BK, Bolewski T, Dąbrowski J, Bartyzel BJ, Gruczyńska-Sękowska E. The Analytical Possibilities of FT-IR Spectroscopy Powered by Vibrating Molecules. International Journal of Molecular Sciences. 2023; 24(2):1013. https://doi.org/10.3390/ijms24021013
Chicago/Turabian StyleKoczoń, Piotr, Jakub T. Hołaj-Krzak, Bharani K. Palani, Tymoteusz Bolewski, Jarosław Dąbrowski, Bartłomiej J. Bartyzel, and Eliza Gruczyńska-Sękowska. 2023. "The Analytical Possibilities of FT-IR Spectroscopy Powered by Vibrating Molecules" International Journal of Molecular Sciences 24, no. 2: 1013. https://doi.org/10.3390/ijms24021013