
Highly Porous Carbon Materials Derived from Silicon Oxycarbides and Effect of the Pyrolysis Temperature on Their Electrochemical Response

Abstract
:1. Introduction
2. Results and Discussion
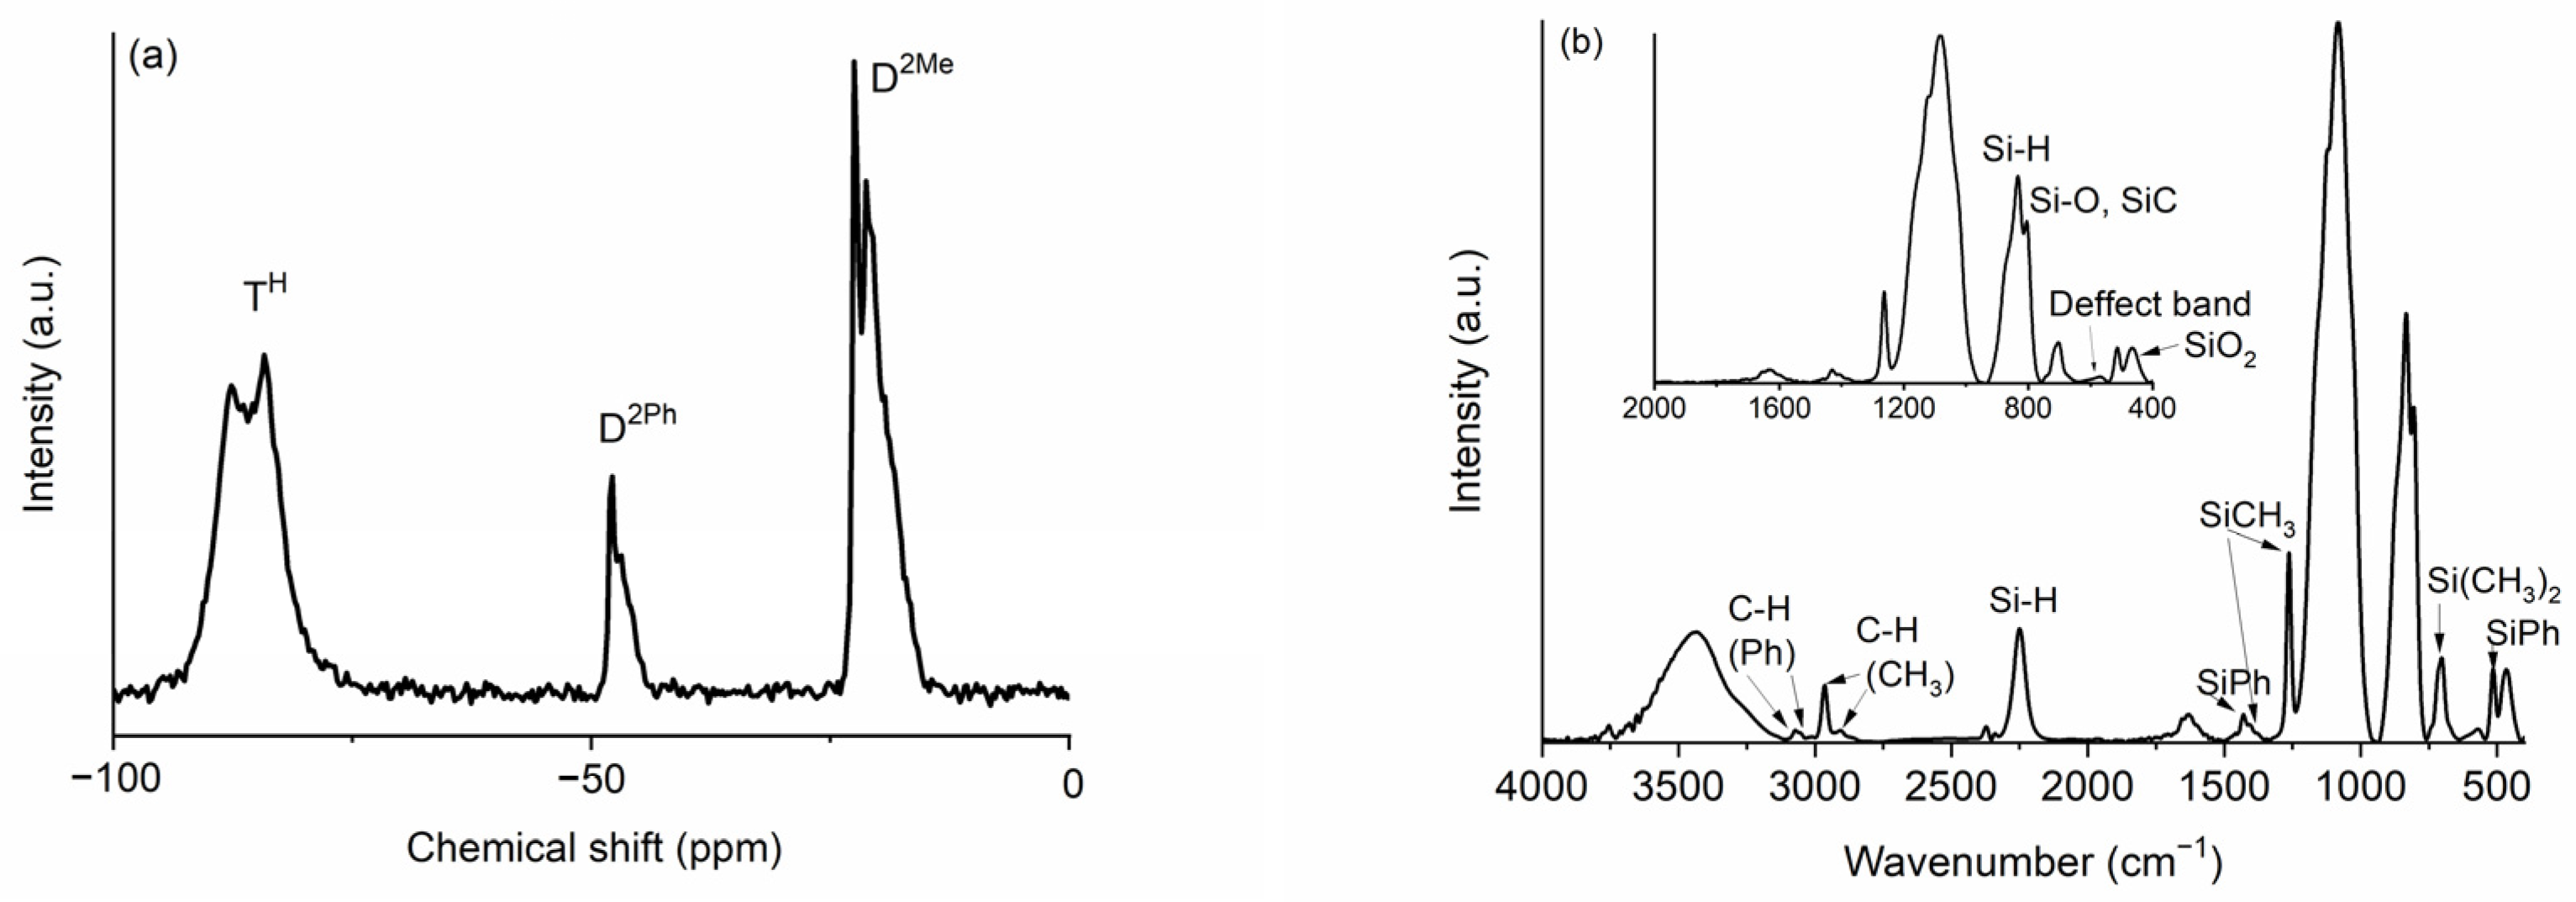
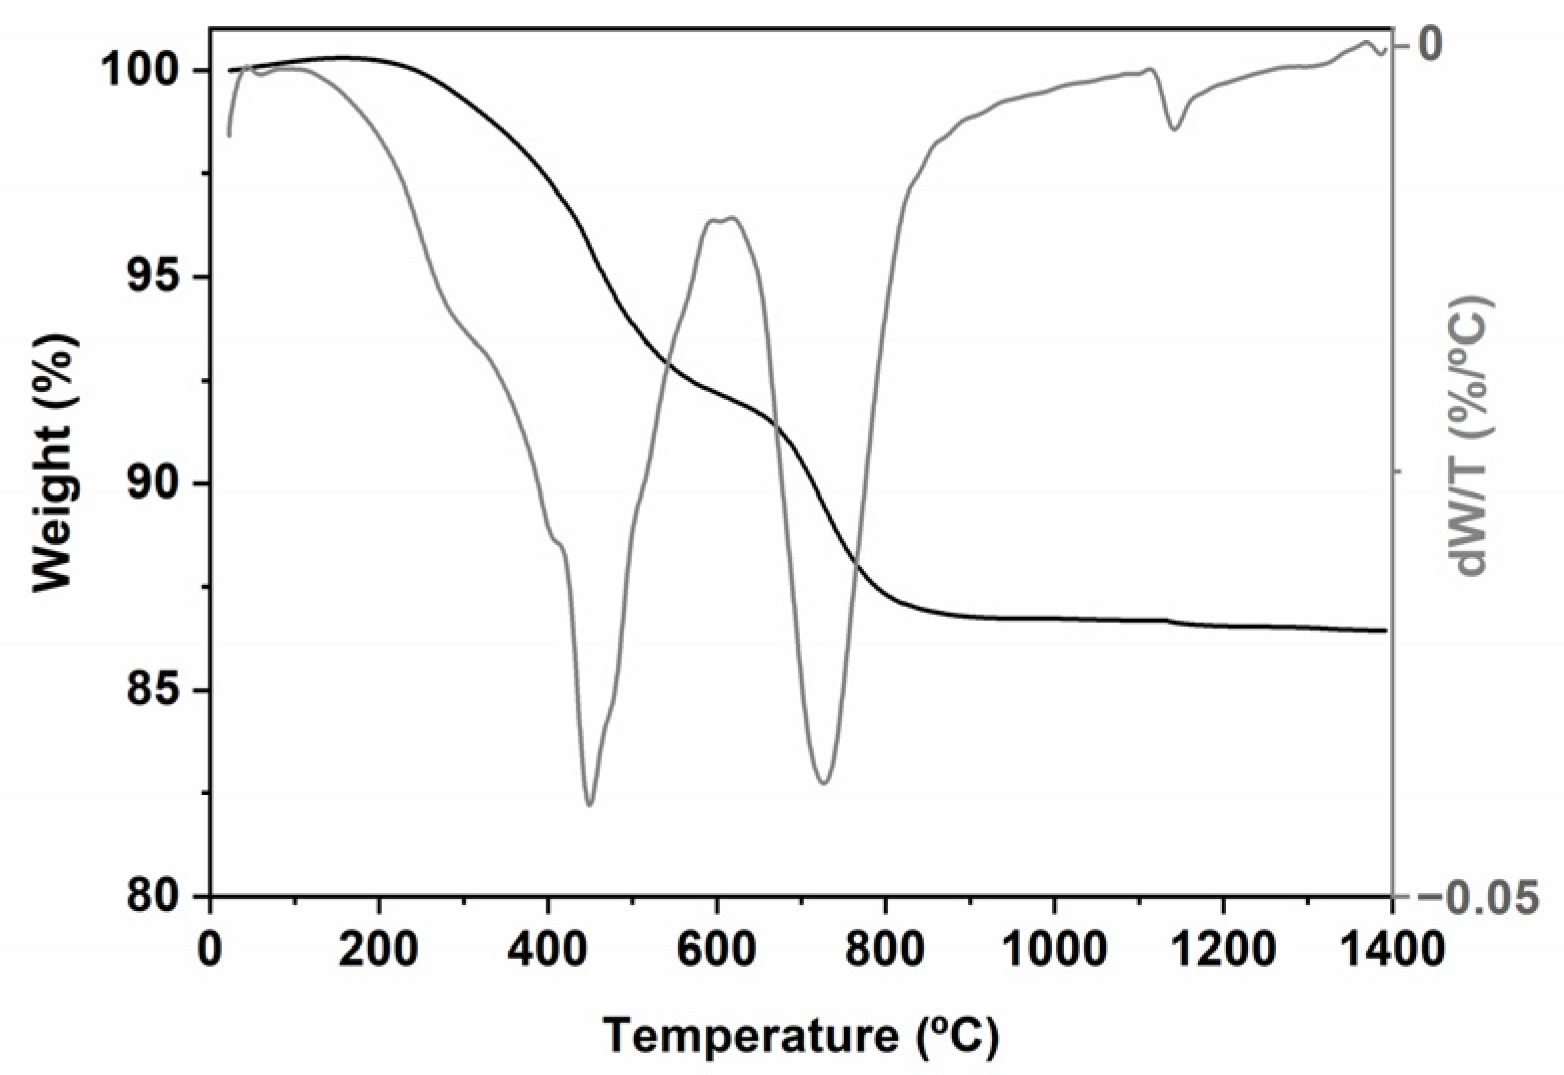
2.1. Characterization of the Hybrid and Tracking of the Pyrolysis Process
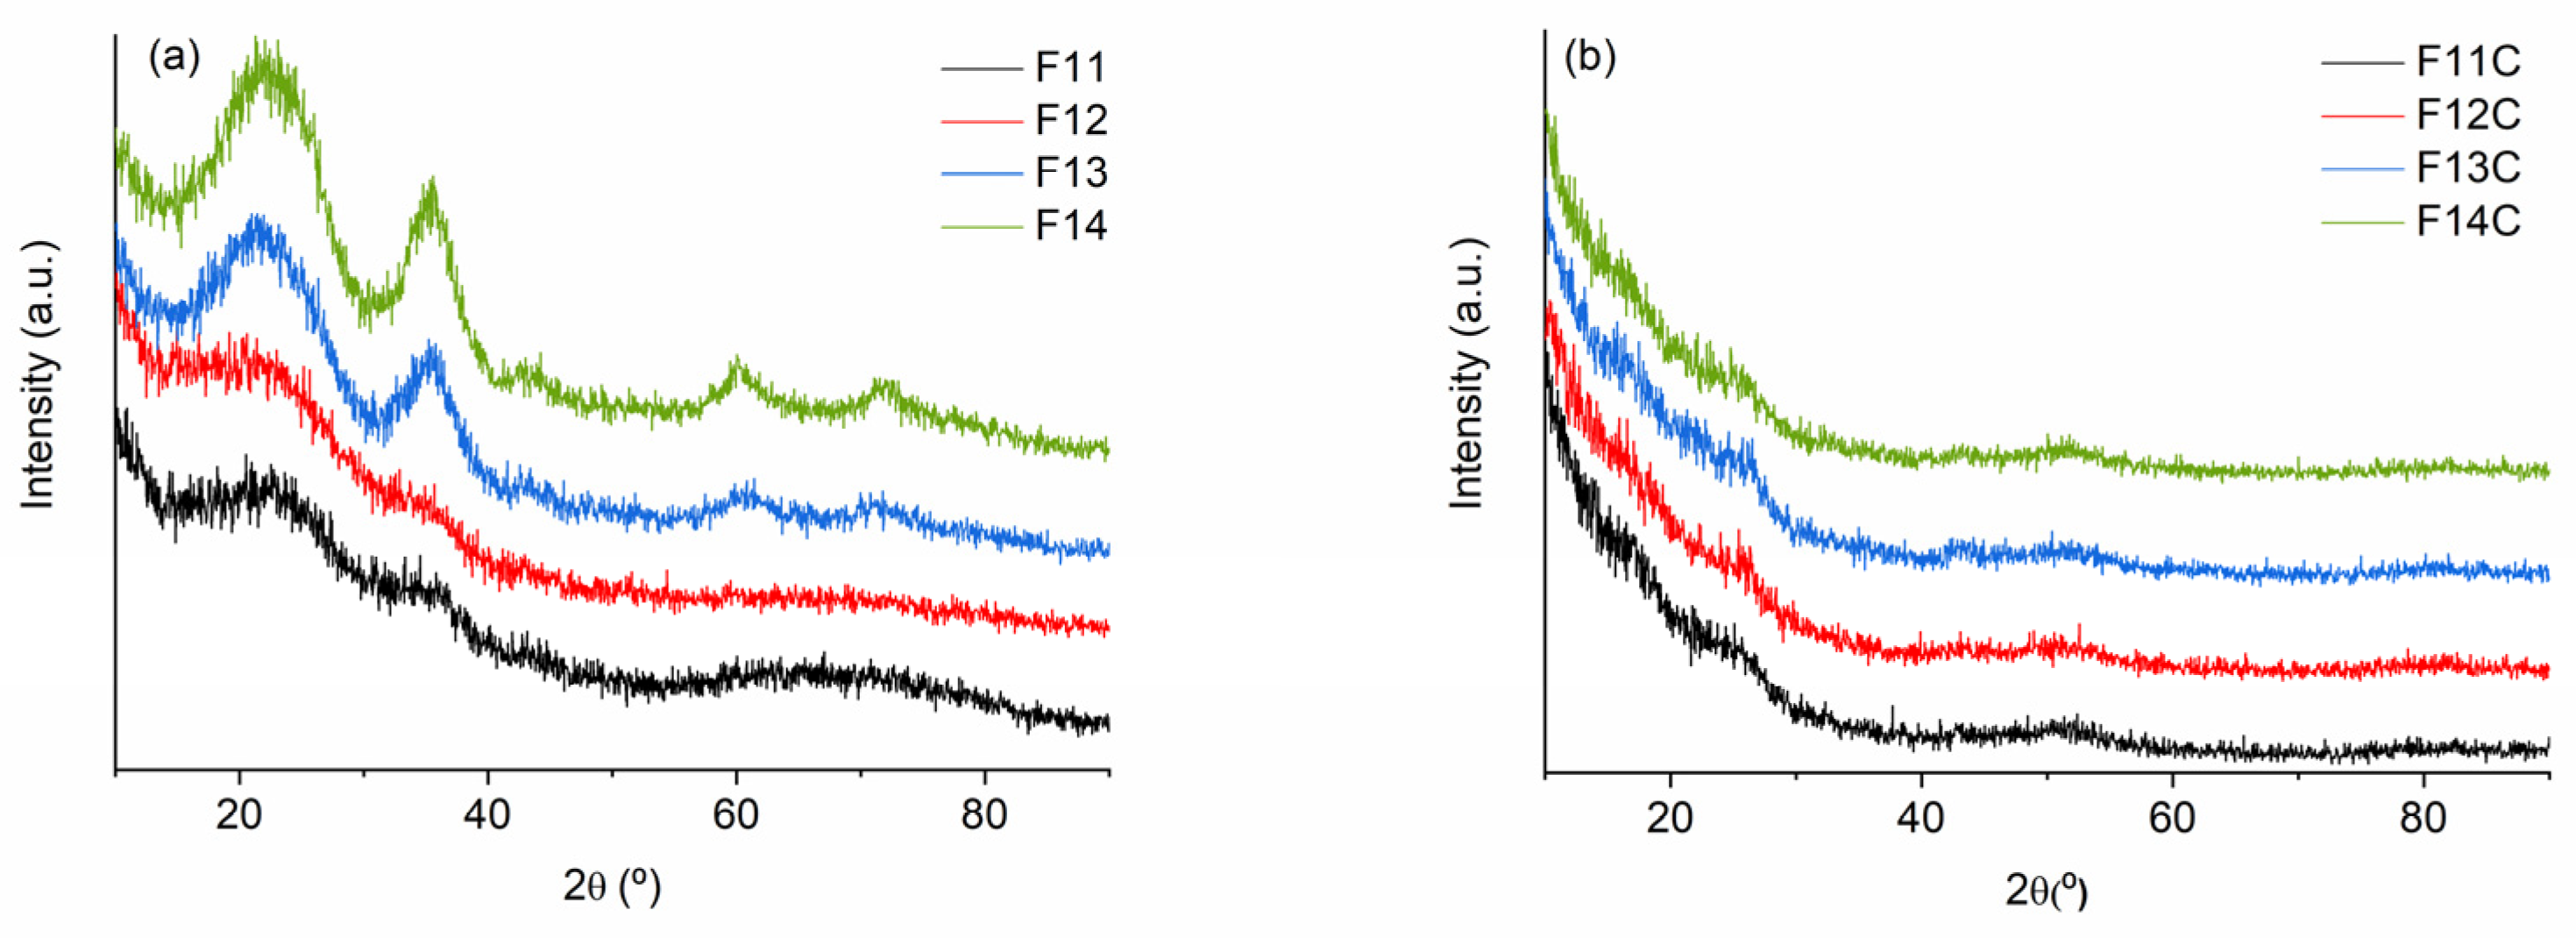
2.2. SiOC and SiOC-DC after Chlorine Etching
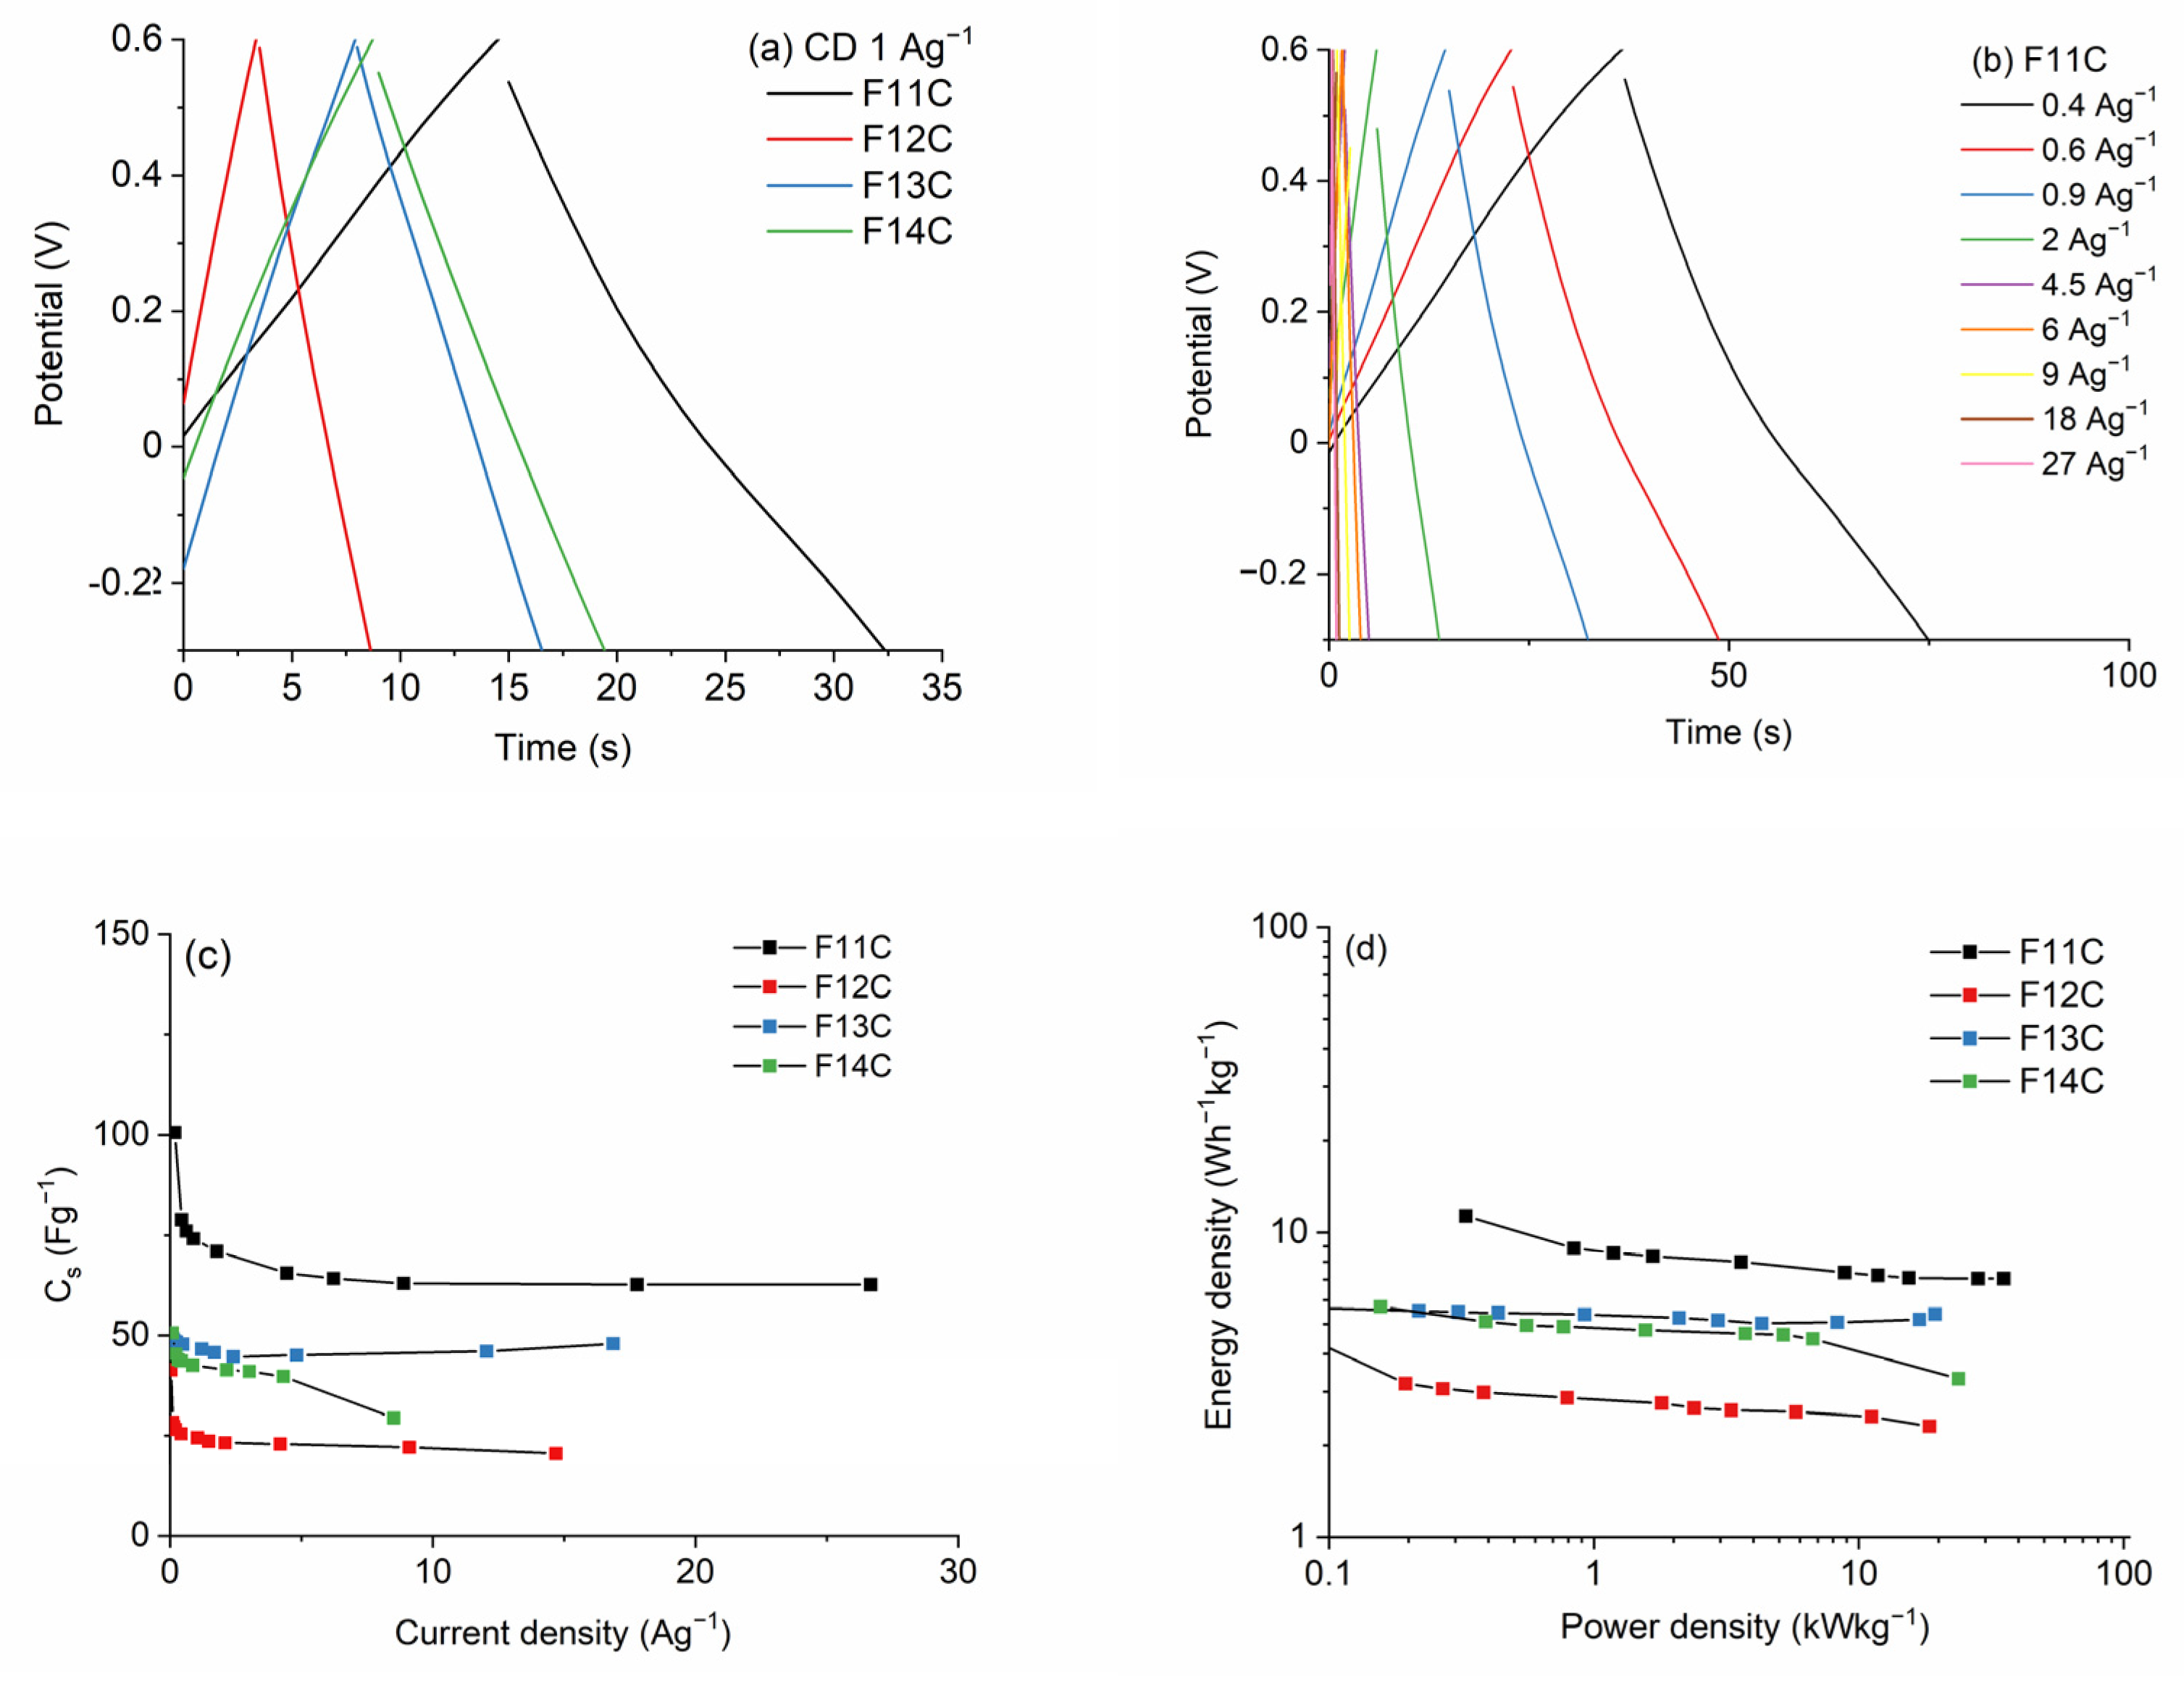
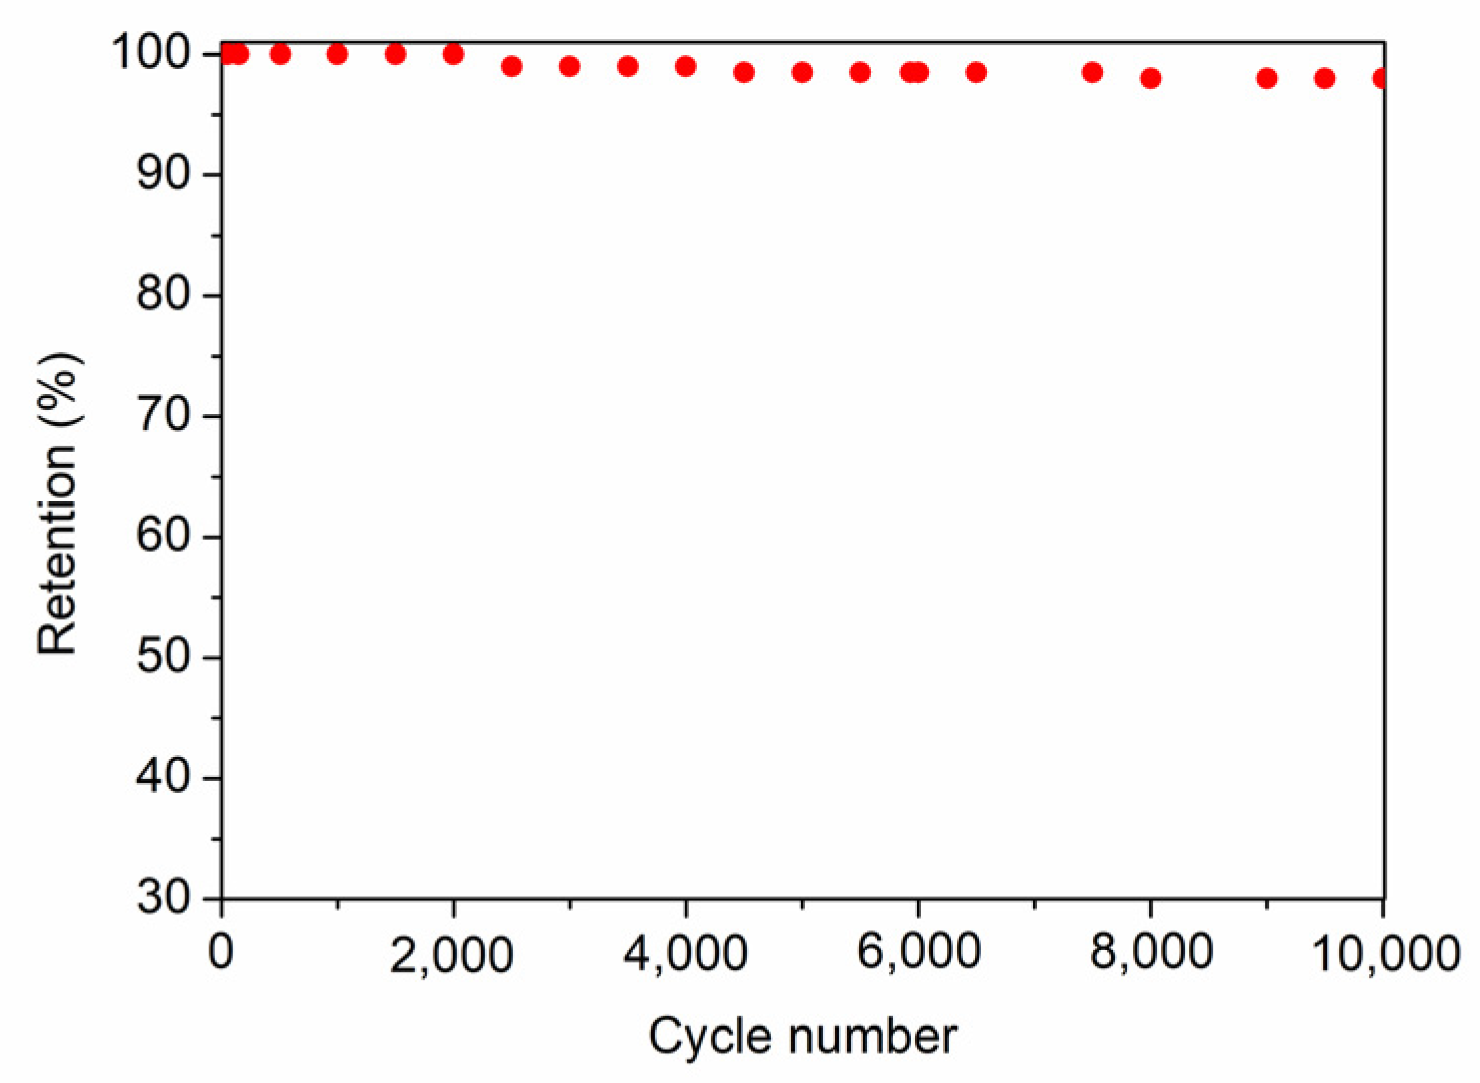
2.3. Electrochemical Characterization
3. Materials and Methods
3.1. Experimental Procedure
3.2. Material Characterization
3.3. Electrochemical Measurement
4. Conclusions
Supplementary Materials
Author Contributions
Funding
Institutional Review Board Statement
Informed Consent Statement
Data Availability Statement
Acknowledgments
Conflicts of Interest
References
- Simon, P.; Gogotsi, Y. Materials for Electrochemical Capacitors. Nat. Mater. 2008, 7, 845–854. [Google Scholar] [CrossRef] [PubMed]
- Vakifahmetoglu, C.; Presser, V.; Yeon, S.H.; Colombo, P.; Gogotsi, Y. Enhanced Hydrogen and Methane Gas Storage of Silicon Oxycarbide Derived Carbon. Microporous Mesoporous Mater. 2011, 144, 105–112. [Google Scholar] [CrossRef]
- Chauhan, P.K.; Parameshwaran, R.; Kannan, P.; Madhavaram, R.; Sujith, R. Hydrogen Storage in Porous Polymer Derived SiliconOxycarbide Ceramics: Outcomes and Perspectives. Ceram. Int. 2021, 47, 2591–2599. [Google Scholar] [CrossRef]
- Duan, L.; Ma, Q.; Chen, Z. Fabrication and CO2 Capture Performance of Silicon Carbide Derived Carbons from Polysiloxane. Microporous Mesoporous Mater. 2015, 203, 24–31. [Google Scholar] [CrossRef]
- Moni, P.; Chaves, W.F.; Wilhelm, M.; Rezwan, K. Polysiloxane Microspheres Encapsulated in Carbon Allotropes: A Promising Material for Supercapacitor and Carbon Dioxide Capture. J. Colloid Interface Sci. 2019, 542, 91–101. [Google Scholar] [CrossRef]
- Xia, K.; Wu, Z.; Xuan, C.; Xiao, W.; Wang, J.; Wang, D. Effect of KOH Etching on the Structure and Electrochemical Performance of SiOC Anodes for Lithium-Ion Batteries. Electrochim. Acta 2017, 245, 287–295. [Google Scholar] [CrossRef]
- Chandra, C.; Kim, J. Silicon Oxycarbide Produced from Silicone Oil for High-Performance Anode Material in Sodium Ion Batteries. Chem. Eng. J. 2018, 338, 126–136. [Google Scholar] [CrossRef]
- Meier, A.; Weinberger, M.; Pinkert, K.; Oschatz, M.; Paasch, S.; Giebeler, L.; Althues, H.; Brunner, E.; Eckert, J.; Kaskel, S. Silicon Oxycarbide-Derived Carbons from a Polyphenylsilsequioxane Precursor for Supercapacitor Applications. Microporous Mesoporous Mater. 2014, 188, 140–148. [Google Scholar] [CrossRef]
- Duan, L.; Ma, Q.; Mei, L.; Chen, Z. Fabrication and Electrochemical Performance of Nanoporous Carbon Derived from Silicon Oxycarbide. Microporous Mesoporous Mater. 2015, 202, 97–105. [Google Scholar] [CrossRef]
- Tolosa, A.; Krüner, B.; Jäckel, N.; Aslan, M.; Vakifahmetoglu, C.; Presser, V. Electrospinning and Electrospraying of Silicon Oxycarbide-Derived Nanoporous Carbon for Supercapacitor Electrodes. J. Power Sources 2016, 313, 178–188. [Google Scholar] [CrossRef]
- Krüner, B.; Odenwald, C.; Tolosa, A.; Schreiber, A.; Aslan, M.; Kickelbick, G.; Presser, V. Carbide-Derived Carbon Beads with Tunable Nanopores from Continuously Produced Polysilsesquioxanes for Supercapacitor Electrodes. Sustain. Energy Fuels 2017, 1, 1588–1600. [Google Scholar] [CrossRef]
- Ma, C.; Fan, Q.; Dirican, M.; Subjalearndee, N.; Cheng, H.; Li, J.; Song, Y.; Shi, J.; Zhang, X. Rational Design of Meso-/Micro-Pores for Enhancing Ion Transportation in Highly-Porous Carbon Nanofibers Used as Electrode for Supercapacitors. Appl. Surf. Sci. 2021, 545, 148933. [Google Scholar] [CrossRef]
- Liu, J.; Ma, L.; Zhao, Y.; Pan, H.; Tang, H.; Zhang, H. Porous Structural Effect of Carbon Electrode Formed through One-Pot Strategy on Performance of Ionic Liquid-Based Supercapacitors. Chem. Eng. J. 2021, 411, 128573. [Google Scholar] [CrossRef]
- Yang, J.; Wu, H.; Zhu, M.; Ren, W.; Lin, Y.; Chen, H.; Pan, F. Optimized Mesopores Enabling Enhanced Rate Performance in Novel Ultrahigh Surface Area Meso-/Microporous Carbon for Supercapacitors. Nano Energy 2017, 33, 453–461. [Google Scholar] [CrossRef]
- Chen, W.; Wang, X.; Liu, C.; Luo, M.; Yang, P.; Zhou, X. Rapid Single-Step Synthesis of Porous Carbon from an Agricultural Waste for Energy Storage Application. Waste Manag. 2020, 102, 330–339. [Google Scholar] [CrossRef]
- Mazo, M.A.; Colomer, M.T.; Tamayo, A.; Rubio, J. Hierarchical Porous Fluorine-Doped Silicon Oxycarbide Derived Materials: Physicochemical Characterization and Electrochemical Behaviour. Microporous Mesoporous Mater. 2022, 330, 111604. [Google Scholar] [CrossRef]
- Xia, K.; Cheng, Y.; Zhang, H.; Han, F.; Duan, L.; Liu, X. Highly Microporous Nitrogen-Doped Carbon Derived from Silicon Oxycarbide Ceramics for Supercapacitor Application. J. Inorg. Organomet. Polym. Mater. 2023, 33, 2023–2034. [Google Scholar] [CrossRef]
- Cordelair, J.; Greil, P. Electrical Conductivity Measurements as a Microprobe for Structure Transitions in Polysiloxane Derived Si-O-C Ceramics. J. Eur. Ceram. Soc. 2000, 20, 1947–1957. [Google Scholar] [CrossRef]
- Mazo, M.A.; Tamayo, A.; Caballero, A.C.; Rubio, J. Enhanced Electrical and Thermal Conductivities of Silicon Oxycarbide Nanocomposites Containing Carbon Nanofibers. Carbon N. Y. 2018, 138, 42–51. [Google Scholar] [CrossRef]
- Mazo, M.A.; Caballero, A.C.; Rubio, J. Further Insights into the Electrical and Thermal Properties of Carbon Enriched Silicon Oxycarbide Composites. J. Alloys Compd. 2022, 889, 161698. [Google Scholar] [CrossRef]
- Ionescu, E.; Kleebe, H.-J.; Riedel, R. Silicon-Containing Polymer-Derived Ceramic Nanocomposites (PDC-NCs): Preparative Approaches and Properties Silicon-Containing Polymer-Derived Ceramic Nanocomposites (PDC-NCs): Preparative Approaches and Propertiesw. Chem. Soc. Rev 2012, 41, 5032–5052. [Google Scholar] [CrossRef] [PubMed]
- Pantano, C.G.; Singh, A.K.; Zhang, H. Silicon Oxycarbide Glasses. J. Sol-Gel Sci. Technol. 1999, 14, 7–25. [Google Scholar] [CrossRef]
- Bois, L.; Maquet, J.; Babonneau, F.; Bahloul, D. Structural Characterization of Sol-Gel Derived Oxycarbide Glasses. 2. Study of the Thermal Stability of the Silicon Oxycarbide Phase. Chem. Mater. 1995, 7, 975–981. [Google Scholar] [CrossRef]
- Mutin, P.H. Control of the Composition and Structure of Silicon Oxycarbide and Oxynitride Glasses Derived from Polysiloxane Precursors. J. Sol-Gel Sci. Technol. 1999, 14, 27–38. [Google Scholar] [CrossRef]
- Vakifahmetoglu, C.; Zeydanli, D.; Colombo, P. Porous Polymer Derived Ceramics. Mater. Sci. Eng. R Rep. 2016, 106, 1–30. [Google Scholar] [CrossRef]
- Yeon, S.H.; Reddington, P.; Gogotsi, Y.; Fischer, J.E.; Vakifahmetoglu, C.; Colombo, P. Carbide-Derived-Carbons with Hierarchical Porosity from a Preceramic Polymer. Carbon N. Y. 2010, 48, 201–210. [Google Scholar] [CrossRef]
- Presser, V.; Heon, M.; Gogotsi, Y. Carbide-Derived Carbons—From Porous Networks to Nanotubes and Graphene. Adv. Funct. Mater. 2011, 21, 810–833. [Google Scholar] [CrossRef]
- Rose, M.; Kockrick, E.; Senkovska, I.; Kaskel, S. High Surface Area Carbide-Derived Carbon Fibers Produced by Electrospinning of Polycarbosilane Precursors. Carbon N. Y. 2010, 48, 403–407. [Google Scholar] [CrossRef]
- Mazo, M.A.; Colomer, M.T.; Tamayo, A.; Rubio, J. Microstructure-Electrochemical Behavior Relationships of Hierarchically Micro-Mesoporous Silicon Oxycarbide Derived Materials Obtained by the Pyrolysis of Trietoxysilane/Dimethyldiphenylsiloxane Hybrids. J. Alloys Compd. 2021, 870, 159427. [Google Scholar] [CrossRef]
- Mazo, M.A.; Tamayo, A.; Rubio, J. Stable Highly Porous Silicon Oxycarbide Glasses from Pre-Ceramic Hybrids. J. Mater. Chem. 2015, 3, 23220–23229. [Google Scholar] [CrossRef]
- Duan, L.; Ma, Q.; Dai, X.; Wang, Y.; Wu, F.; Wang, Y.; Wang, M. The Effect of Etching Temperature on the Compositional and Structural Evolution of Ceramer from Polysiloxane in Chlorine. Corros. Sci. 2015, 101, 132–138. [Google Scholar] [CrossRef]
- Liqun, D.; Qingsong, M.; Zhaohui, C. Etching Process of Silicon Oxycarbide from Polysiloxane by Chlorine. Corros. Sci. 2015, 94, 237–244. [Google Scholar] [CrossRef]
- Sorarù, G.D.; D’Andrea, G.; Campostrini, R.; Babonneau, F. Characterization of Methyl-Substituted Silica Gels with Si–H Functionalities. J. Mater. Chem. 1995, 5, 1363–1374. [Google Scholar] [CrossRef]
- Deshpande, G.; Rezac, M.E.; Irisawa, T. The Effect of Phenyl Content on the Degradation of Poly(Dimethyl Diphenyl) Siloxane Copolymers. Polym. Degrad. Stab. 2001, 74, 363–370. [Google Scholar] [CrossRef]
- Campostrini, R.; Sicurelli, A.; Ischia, M.; Carturan, G. Pyrolysis Study of a Hydride-Sol-Gel Silica. J. Therm. Anal. Calorim. 2007, 89, 633–641. [Google Scholar] [CrossRef]
- Fidalgo, A.; Ilharco, L.M. The Defect Structure of Sol–Gel-Derived Silica/Polytetrahydrofuran Hybrid Films by FTIR. J. Non. Cryst. Solids 2001, 283, 144–154. [Google Scholar] [CrossRef]
- Chomel, A.D.; Dempsey, P.; Latournerie, J.; Djamila Hourlier-Bahloul, A.; Upali, A. Jayasooriya Gel to Glass Transformation of Methyltriethoxysilane: A Silicon Oxycarbide Glass Precursor Investigated Using Vibrational Spectroscopy. Chem. Mater. 2005, 17, 4468–4473. [Google Scholar] [CrossRef]
- Kolář, F.; Machovič, V.; Svítilová, J.; Borecká, L. Structural Characterization and Thermal Oxidation Resistance of Silicon Oxycarbides Produced by Polysiloxane Pyrolysis. Mater. Chem. Phys. 2004, 86, 88–98. [Google Scholar] [CrossRef]
- Grassie, N.; Macfarlane, I.G.; Francey, K.F. The Thermal Degradation of Polysiloxanes-II. Poly(Methylphenylsiloxane). Eur. Polym. J. 1979, 15, 415–422. [Google Scholar] [CrossRef]
- Grassie, N.; Francey, K.F.; Macfarlane, I.G. The Thermal Degradation of Polysiloxanes—Part 4: Poly(Dimethyl/Diphenyl Siloxane). Polym. Degrad. Stab. 1980, 2, 67–83. [Google Scholar] [CrossRef]
- Bahloul-Hourlier, D.; Latournerie, J.; Dempsey, P. Reaction Pathways during the Thermal Conversion of Polysiloxane Precursors into Oxycarbide Ceramics. J. Eur. Ceram. Soc. 2005, 25, 979–985. [Google Scholar] [CrossRef]
- Mazo, M.A.; Tamayo, A.; Rubio, J. Highly Micro- and Mesoporous Oxycarbide Derived Materials from HF Etching of Silicon Oxycarbide Materials. Microporous Mesoporous Mater. 2019, 289, 109614. [Google Scholar] [CrossRef]
- Corriu, R.J.P.; Leclercq, D.; Mutin, P.H.; Vioux, A. 29Si Nuclear Magnetic Resonance Study of the Structure of Silicon Oxycarbide Glasses Derived from Organosilicon Precursors. J. Mater. Sci. 1995, 30, 2313–2318. [Google Scholar] [CrossRef]
- Oteo, J.L.; Mazo, M.A.; Palencia, C.; Rubio, F.; Rubio, J. Synthesis and Characterization of Silicon Oxycarbide Derived Nanocomposites Obtained through Ceramic Processing of TEOS/PDMS Preceramic Materials. J. Nano Res. 2011, 14, 27–38. [Google Scholar] [CrossRef]
- Ramis, G.; Quintard, P.; Cauchetier, M.; Busca, G.; Lorenzelli, V. Surface Chemistry and Structure of Ultrafine Silicon Carbide: An FT-IR Study. J. Am. Ceram. Soc. 1989, 72, 1692–1697. [Google Scholar] [CrossRef]
- Vix-Guterl, C.; Alix, I.; Gibot, P.; Ehrburger, P. Formation of Tubular Silicon Carbide from a Carbon–Silica Material by Using a Reactive Replica Technique: Infra-Red Characterisation. Appl. Surf. Sci. 2003, 210, 329–337. [Google Scholar] [CrossRef]
- Arkles, P.L.B. Infrared Analysis of Organosilicon Compounds: Spectra-Structure Correlations. In Silicon Compounds: Silanes & Silicones; Gelest Inc.: Morrisville, PA, USA, 2013; pp. 175–178. [Google Scholar]
- Faber, K.; Badaczewski, F.; Oschatz, M.; Mondin, G.; Nickel, W.; Kaskel, S.; Smarsly, B.M. In-Depth Investigation of the Carbon Microstructure of Silicon Carbide-Derived Carbons by Wide-Angle X-Ray Scattering. J. Phys. Chem. C 2014, 118, 15705–15715. [Google Scholar] [CrossRef]
- Mazo, M.A.; Tamayo, A.; Rubio, J. Advanced Silicon Oxycarbide-Carbon Composites for High Temperature Resistant Friction Systems. J. Eur. Ceram. Soc. 2016, 36, 2443–2452. [Google Scholar] [CrossRef]
- Vidano, R.; Fiscgbach, D.B. New Lines in the Raman Spectra of Carbons and Graphite. J. Am. Ceram. Soc. 1978, 61, 13–17. [Google Scholar] [CrossRef]
- Tuinstra, F.; Koenig, J.L. Raman Spectrum of Graphite. J. Chem. Phys. 2003, 53, 1126. [Google Scholar] [CrossRef]
- Nemanich, R.J.; Solin, S.A. First- and Second-Order Raman Scattering from Finite-Size Crystals of Graphite. Phys. Rev. B 1979, 20, 392. [Google Scholar] [CrossRef]
- Lespade, P.; Marchand, A.; Couzi, M.; Cruege, F. Caracterisation de Materiaux Carbones Par Microspectrometrie Raman. Carbon N. Y. 1984, 22, 375–385. [Google Scholar] [CrossRef]
- Knight, D.S.; White, W.B. Characterization of Diamond Films by Raman Spectroscopy. J. Mater. Res. 1989, 4, 385–393. [Google Scholar] [CrossRef]
- Lucchese, M.M.; Stavale, F.; Ferreira, E.H.M.; Vilani, C.; Moutinho, M.V.O.; Capaz, R.B.; Achete, C.A.; Jorio, A. Quantifying Ion-Induced Defects and Raman Relaxation Length in Graphene. Carbon N. Y. 2010, 48, 1592–1597. [Google Scholar] [CrossRef]
- Ferrari, A.; Robertson, J. Interpretation of Raman Spectra of Disordered and Amorphous Carbon. Phys. Rev. B 2000, 61, 14095. [Google Scholar] [CrossRef]
- Larouche, N.; Stansfield, B.L. Classifying Nanostructured Carbons Using Graphitic Indices Derived from Raman Spectra. Carbon N. Y. 2010, 48, 620–629. [Google Scholar] [CrossRef]
- Mazo, M.A.; Caballero, A.C.; Rubio, J. Improved Electrical and Thermal Properties of Silicon Oxycarbide/Spodumene Nanocomposites. J. Eur. Ceram. Soc. 2023, 43, 4958–4967. [Google Scholar] [CrossRef]
- Papakollu, K.; Moharana, N.; Hari Kumar, K.C.; Lauterbach, S.; Kleebe, H.J.; Ionescu, E.; Kumar, R. Synthesis and Temperature-Dependent Evolution of the Phase Composition in Palladium-Containing Silicon Oxycarbide Ceramics. J. Eur. Ceram. Soc. 2022, 42, 4825–4834. [Google Scholar] [CrossRef]
- Ricohermoso, E.; Klug, F.; Schlaak, H.; Riedel, R.; Ionescu, E. Compressive Thermal Stress and Microstructure-Driven Charge Carrier Transport in Silicon Oxycarbide Thin Films. J. Eur. Ceram. Soc. 2021, 41, 6377–6384. [Google Scholar] [CrossRef]
- Jella, G.; Panda, D.K.; Sapkota, N.; Greenough, M.; Datta, S.P.; Rao, A.M.; Sujith, R.; Bordia, R.K. Electrochemical Performance of Polymer-Derived Silicon-Oxycarbide/Graphene Nanoplatelet Composites for High-Performance Li-Ion Batteries. ACS Appl. Mater. Interfaces 2023, 15, 30039–30051. [Google Scholar] [CrossRef]
- Penã-Alonso, R.; Sorarù, G.D.; Raj, R. Preparation of Ultrathin-Walled Carbon-Based Nanoporous Structures by Etching Pseudo-Amorphous Silicon Oxycarbide Ceramics. J. Am. Ceram. Soc. 2006, 89, 2473–2480. [Google Scholar] [CrossRef]
- Thommes, M.; Kaneko, K.; Neimark, A.V.; Olivier, J.P.; Rodriguez-Reinoso, F.; Rouquerol, J.; Sing, K.S.W. Physisorption of Gases, with Special Reference to the Evaluation of Surface Area and Pore Size Distribution (IUPAC Technical Report). Pure Appl. Chem. 2015, 87, 1051–1069. [Google Scholar] [CrossRef]
- Perez-Roman, B.; Layek, R.; Rodriguez, M.A.; Rubio, F.; Rubio, J.; Tamayo, A. Insights into the Structural and Surface Characteristics of Microporous Carbide Derived Carbons Obtained through Single and Double Halogen Etching. Microporous Mesoporous Mater. 2021, 310, 110675. [Google Scholar] [CrossRef]
- Sevilla, M.; Fuertes, A.B. Direct Synthesis of Highly Porous Interconnected Carbon Nanosheets and Their Application as High-Performance Supercapacitors. ACS Nano 2023, 12, 23. [Google Scholar] [CrossRef] [PubMed]
- Brunauer, S.; Emmett, P.H.; Teller, E. Adsorption of Gases in Multimolecular Layers. J. Am. Chem. Soc. 1938, 60, 309–319. [Google Scholar] [CrossRef]
- Barrett, E.P.; Joyner, L.G.; Halenda, P.P. The Determination of Pore Volume and Area Distributions in Porous Substances. I. Computations from Nitrogen Isotherms. J. Am. Chem. Soc. 1951, 73, 373–380. [Google Scholar] [CrossRef]
- Laheäär, A.; Przygocki, P.; Abbas, Q.; Béguin, F. Appropriate Methods for Evaluating the Efficiency and Capacitive Behavior of Different Types of Supercapacitors. Electrochem. Commun. 2015, 60, 21–25. [Google Scholar] [CrossRef]
- Zhang, S.; Pan, N. Supercapacitors Performance Evaluation. Adv. Energy Mater. 2015, 5, 1401401. [Google Scholar] [CrossRef]


| C (%) | O (%) | Si (%) | Empirical Formula | |
|---|---|---|---|---|
| F hybrid | 27.3 | 25.7 | 47.0 | SiC1.35O0.96 |
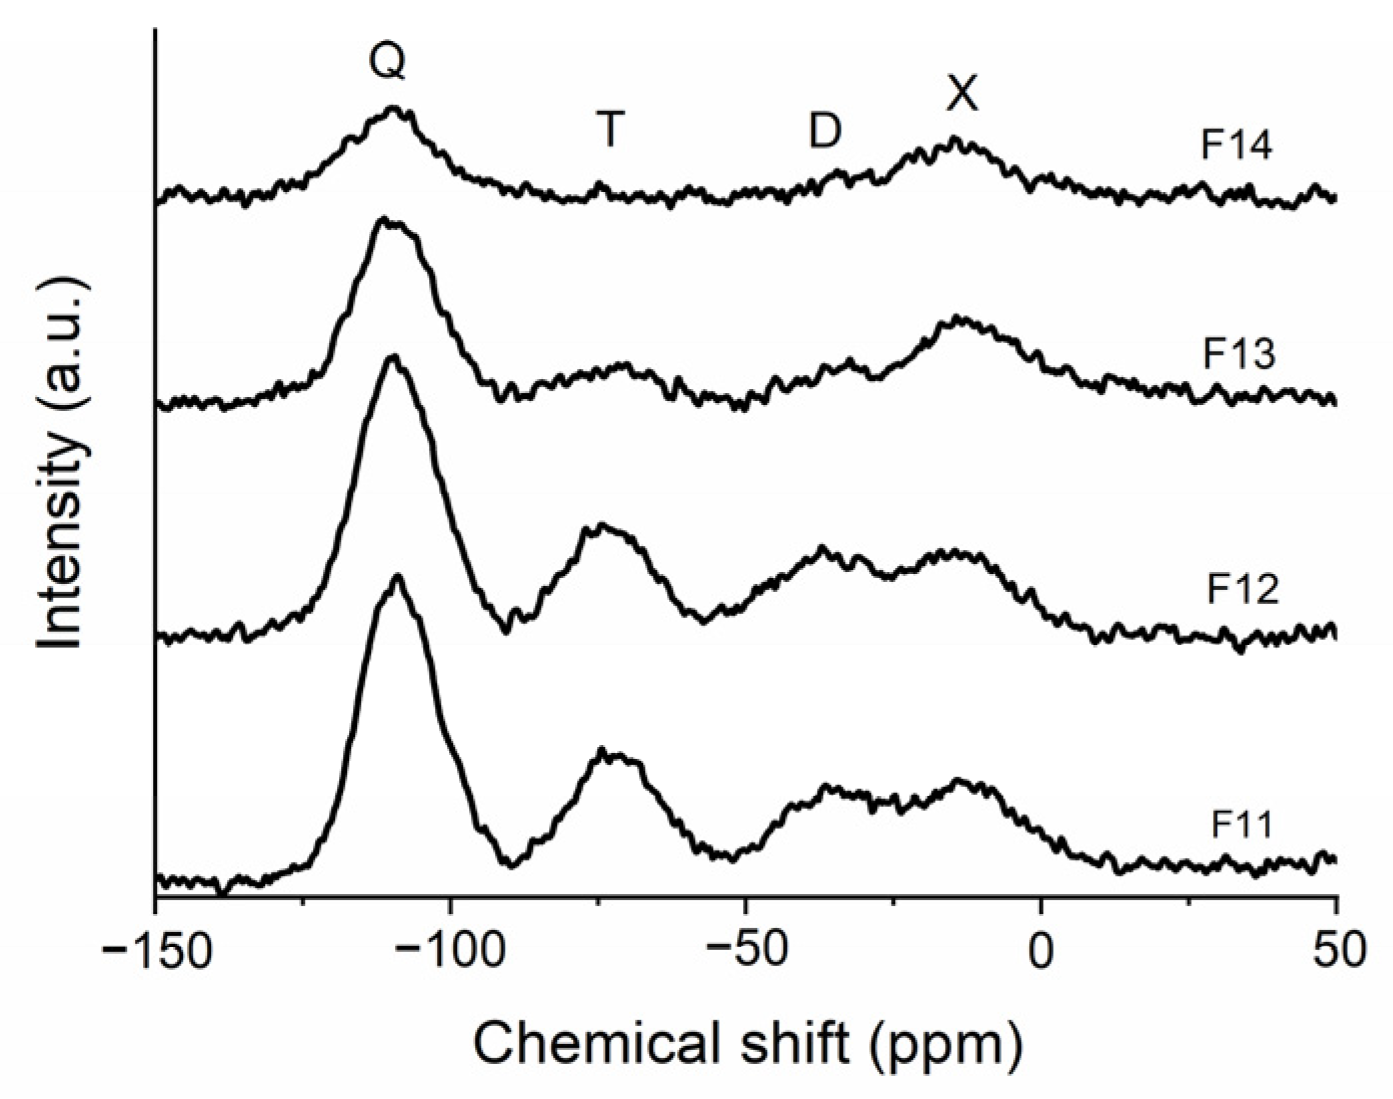
| Sample | Q (ppm) (%) | T (ppm) (%) | D (ppm) (%) | X (ppm) (%) |
|---|---|---|---|---|
| F11 | −108.7 (45) | −72.1 (21) | −36.4 (14) | −12.6 (19) |
| F12 | −109.1 (47) | −73.3 (19) | −37.1 (18) | −13.2 (16) |
| F13 | −109.4 (54) | −73.0 (8) | −35.9 (5) | −11.8 (33) |
| F14 | −110.3 (57) | n.d. | n.d. | −15.5 (43) |
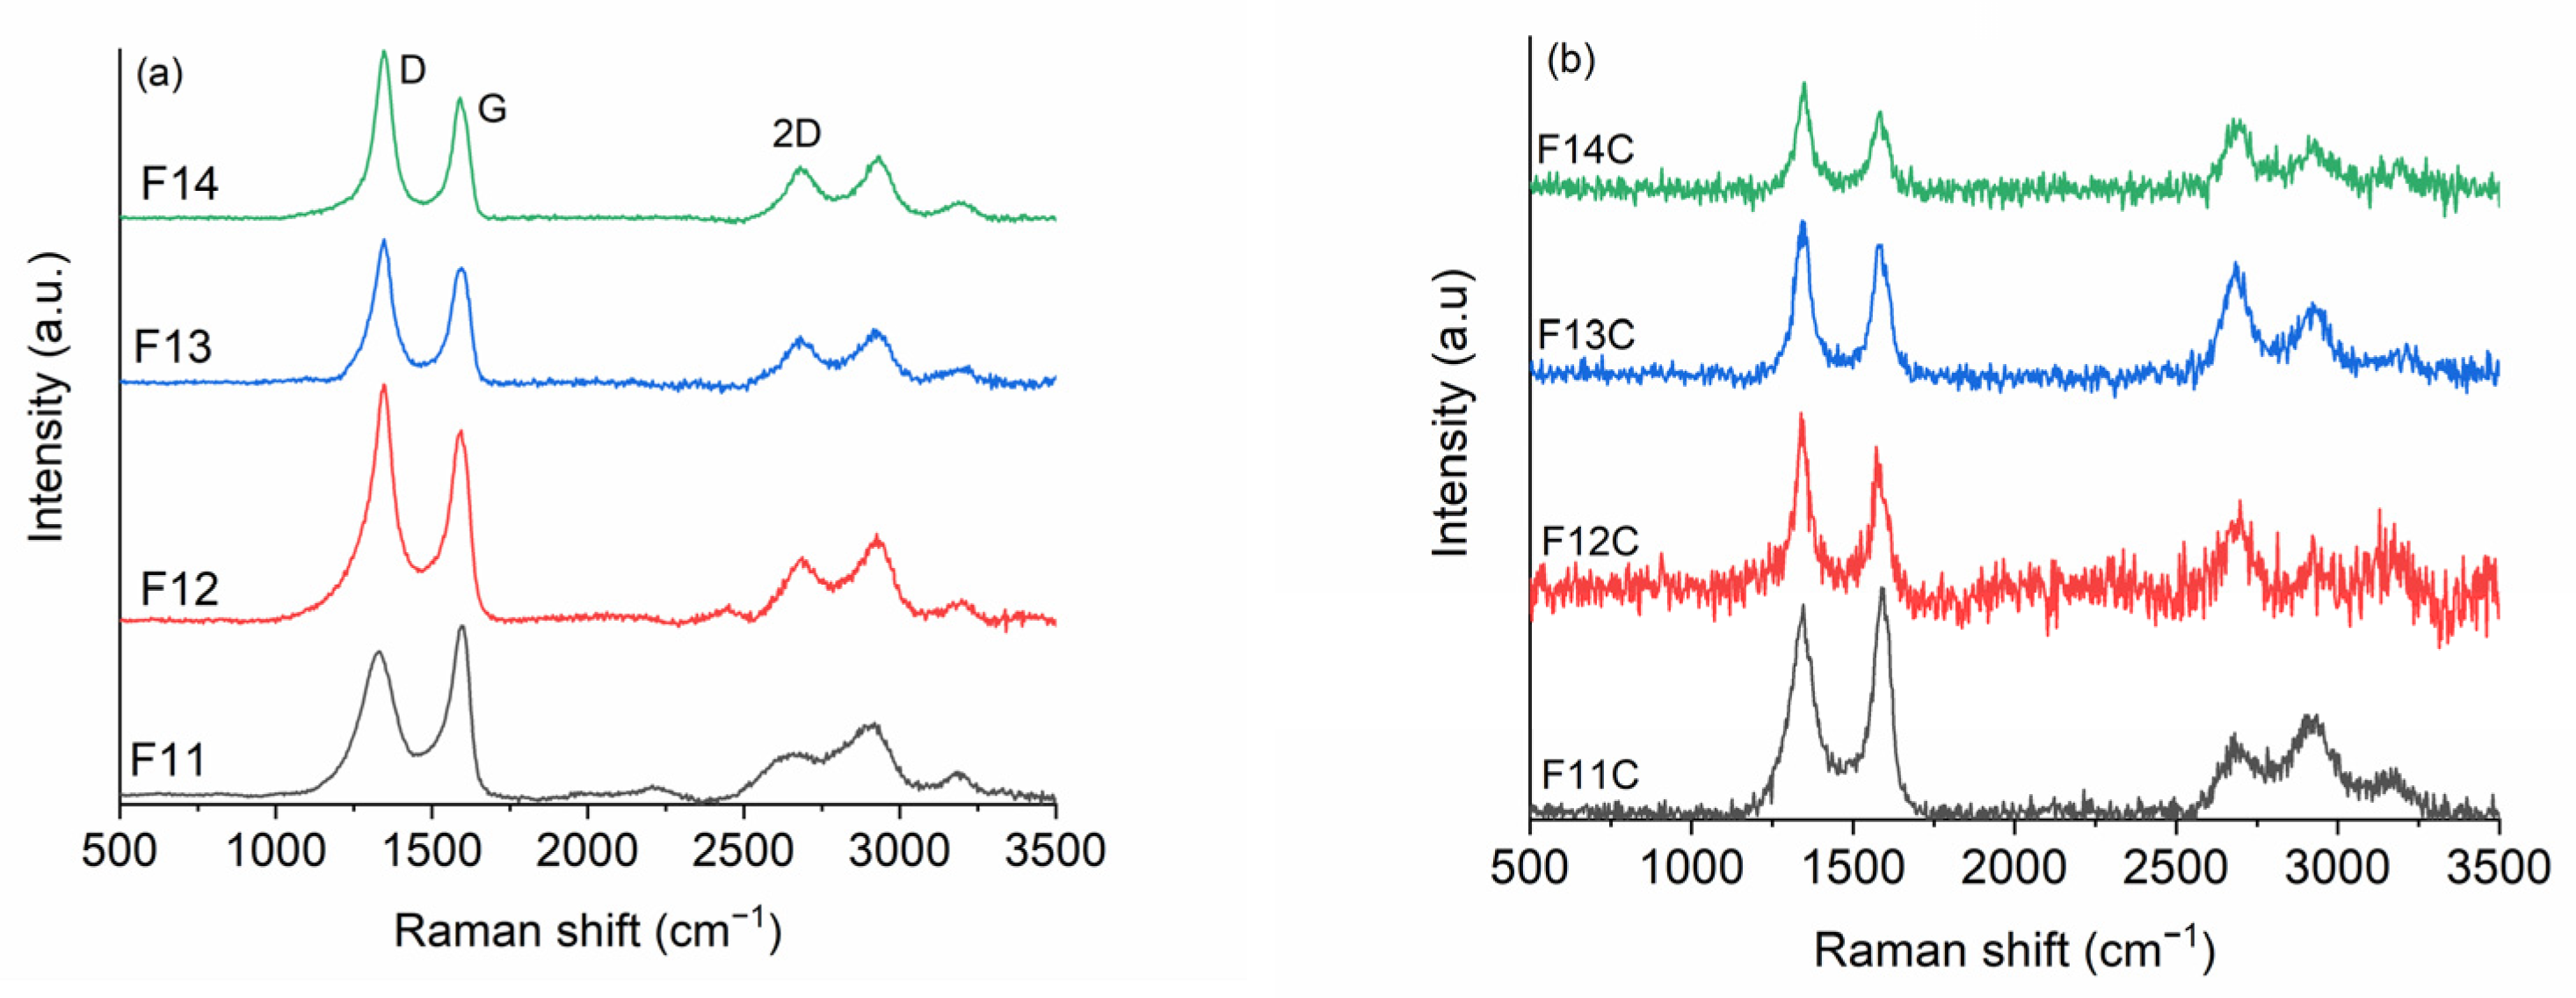
| Sample | D (cm−1) | WD (cm−1) | G (cm−1) | WG (cm−1) | 2D (cm−1) | W2D (cm−1) | La (nm) | LD (nm) | Leq (nm) | ΔW2D−1 (cm) | I2D /IG |
|---|---|---|---|---|---|---|---|---|---|---|---|
| F11 | 1328 | 141 | 1560 | 68 | 2658 | 212 | 5.1 | 12.2 | 3.7 | 0.47 | 0.24 |
| F12 | 1341 | 107 | 1588 | 67 | 2688 | 146 | 3.9 | 10.5 | 3.1 | 0.68 | 0.29 |
| F13 | 1343 | 81 | 1591 | 63 | 2683 | 123 | 3.9 | 10.6 | 4.1 | 0.81 | 0.35 |
| F14 | 1345 | 71 | 1591 | 55 | 2686 | 112 | 3.3 | 9.7 | 4.1 | 0.89 | 0.39 |
| F11C | 1343 | 96 | 1589 | 63 | 2690 | 124 | 5.1 | 12.1 | 3.5 | 0.81 | 0.27 |
| F12C | 1342 | 62 | 1580 | 51 | 2687 | 88 | 3.6 | 9.1 | 5.9 | 1.12 | 0.57 |
| F13C | 1344 | 59 | 1585 | 60 | 2684 | 95 | 3.8 | 10.6 | 9.6 | 1.04 | 0.78 |
| F14C | 1346 | 52 | 1582 | 56 | 2690 | 84 | 3.3 | 9.7 | 9.2 | 1.19 | 0.86 |
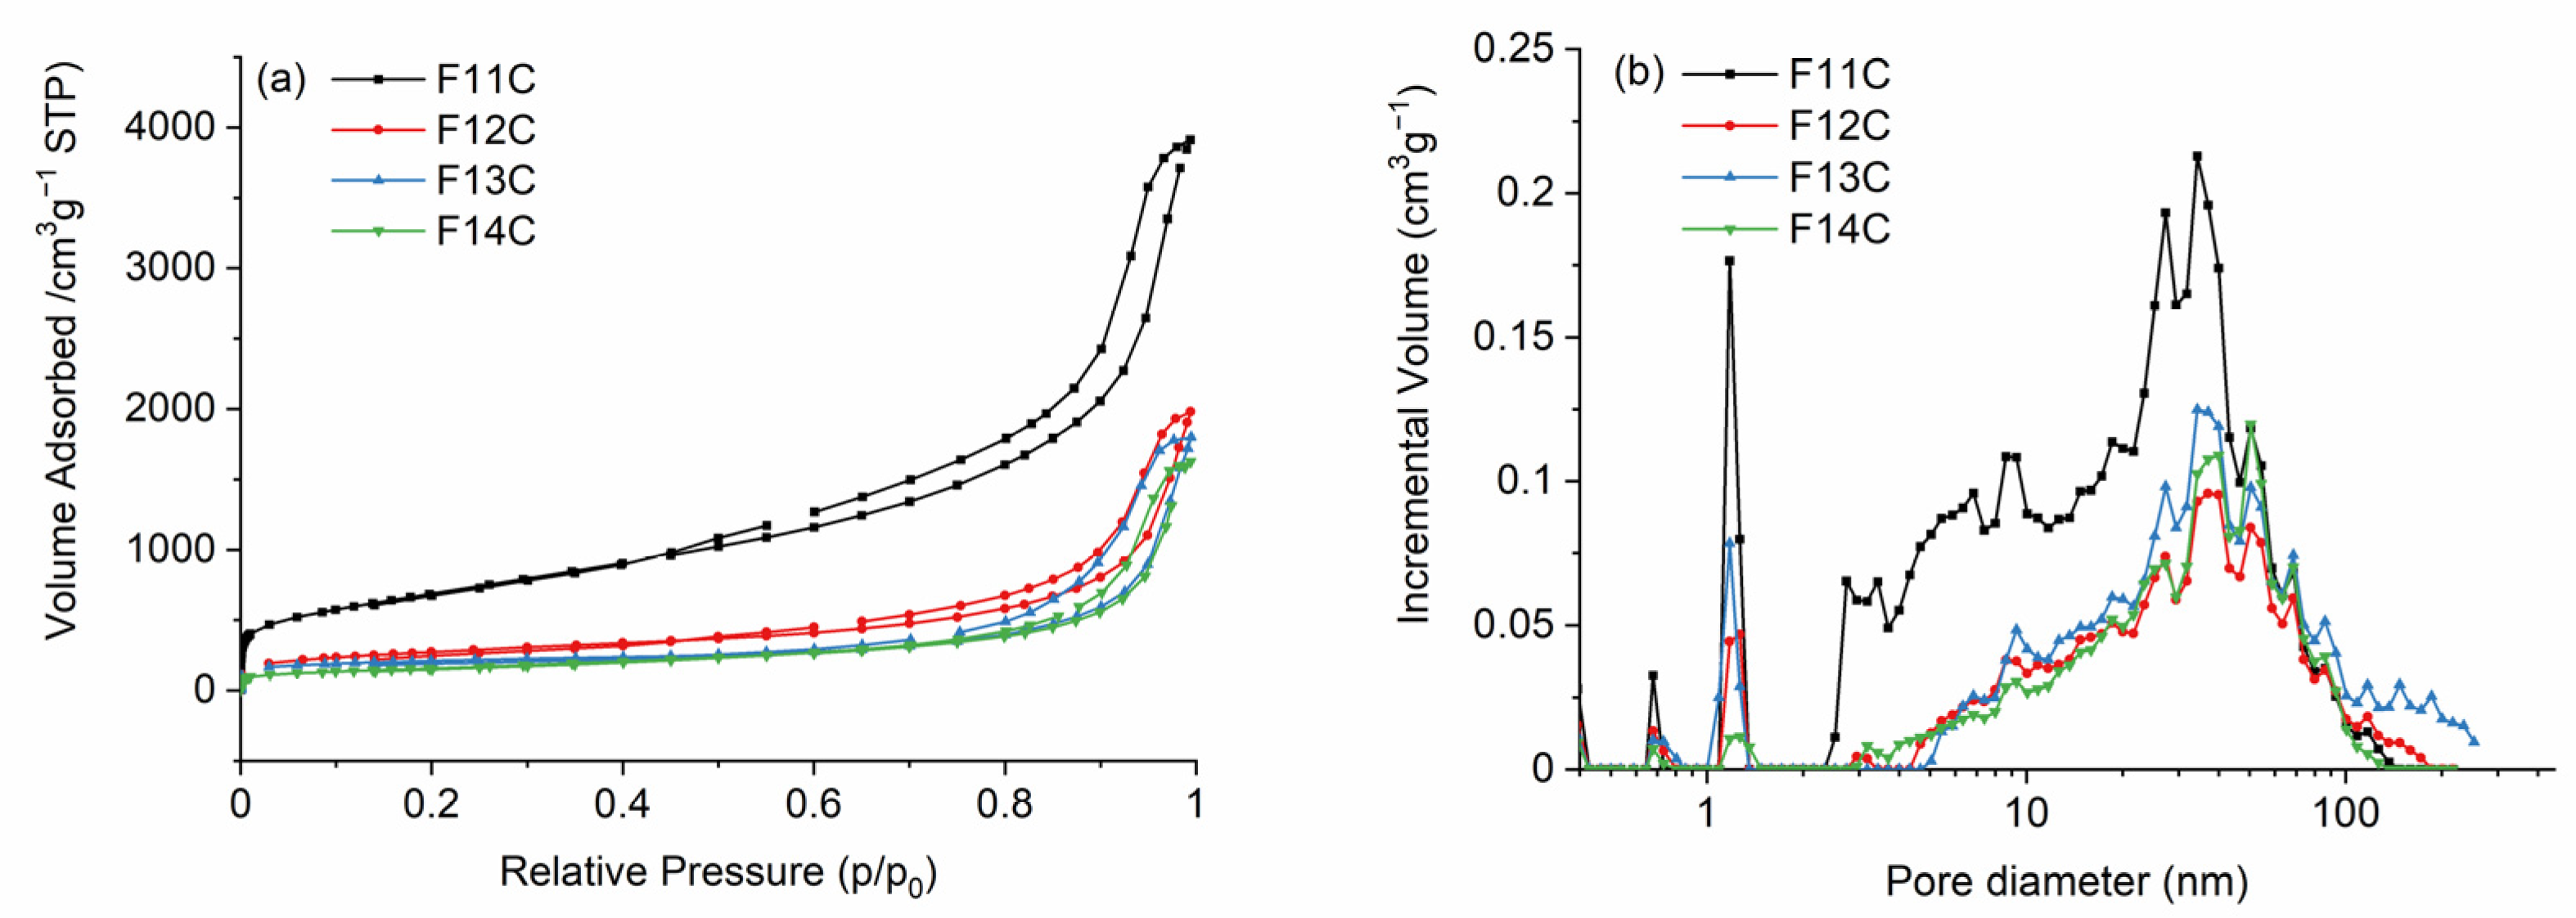
| C (%) | SBET (m2 g−1) | VSP (cm3 g−1) | Vtot (cm3 g−1) | Vmicro (cm3 g−1) | Vmeso (cm3 g−1) | Vmacro (cm3 g−1) | Da (nm) | |
|---|---|---|---|---|---|---|---|---|
| F11 | 25.4 | 3 | - | - | - | - | 12 | |
| F12 | 25.6 | 6 | - | - | - | - | 14 | |
| F13 | 24.2 | 1 | - | - | - | - | 14 | |
| F14 | 26.5 | 1 | - | - | - | - | 16 | |
| F11C | 84.2 | 2499 | 5.95 | 4.94 | 0.32 | 4.13 | 0.49 | 10 |
| F12C | 86.7 | 986 | 2.95 | 2.12 | 0.13 | 1.53 | 0.47 | 12 |
| F13C | 78.5 | 724 | 2.66 | 2.72 | 0.17 | 1.80 | 0.75 | 15 |
| F14C | 84.3 | 569 | 2.46 | 2.11 | 0.05 | 1.60 | 0.47 | 17 |
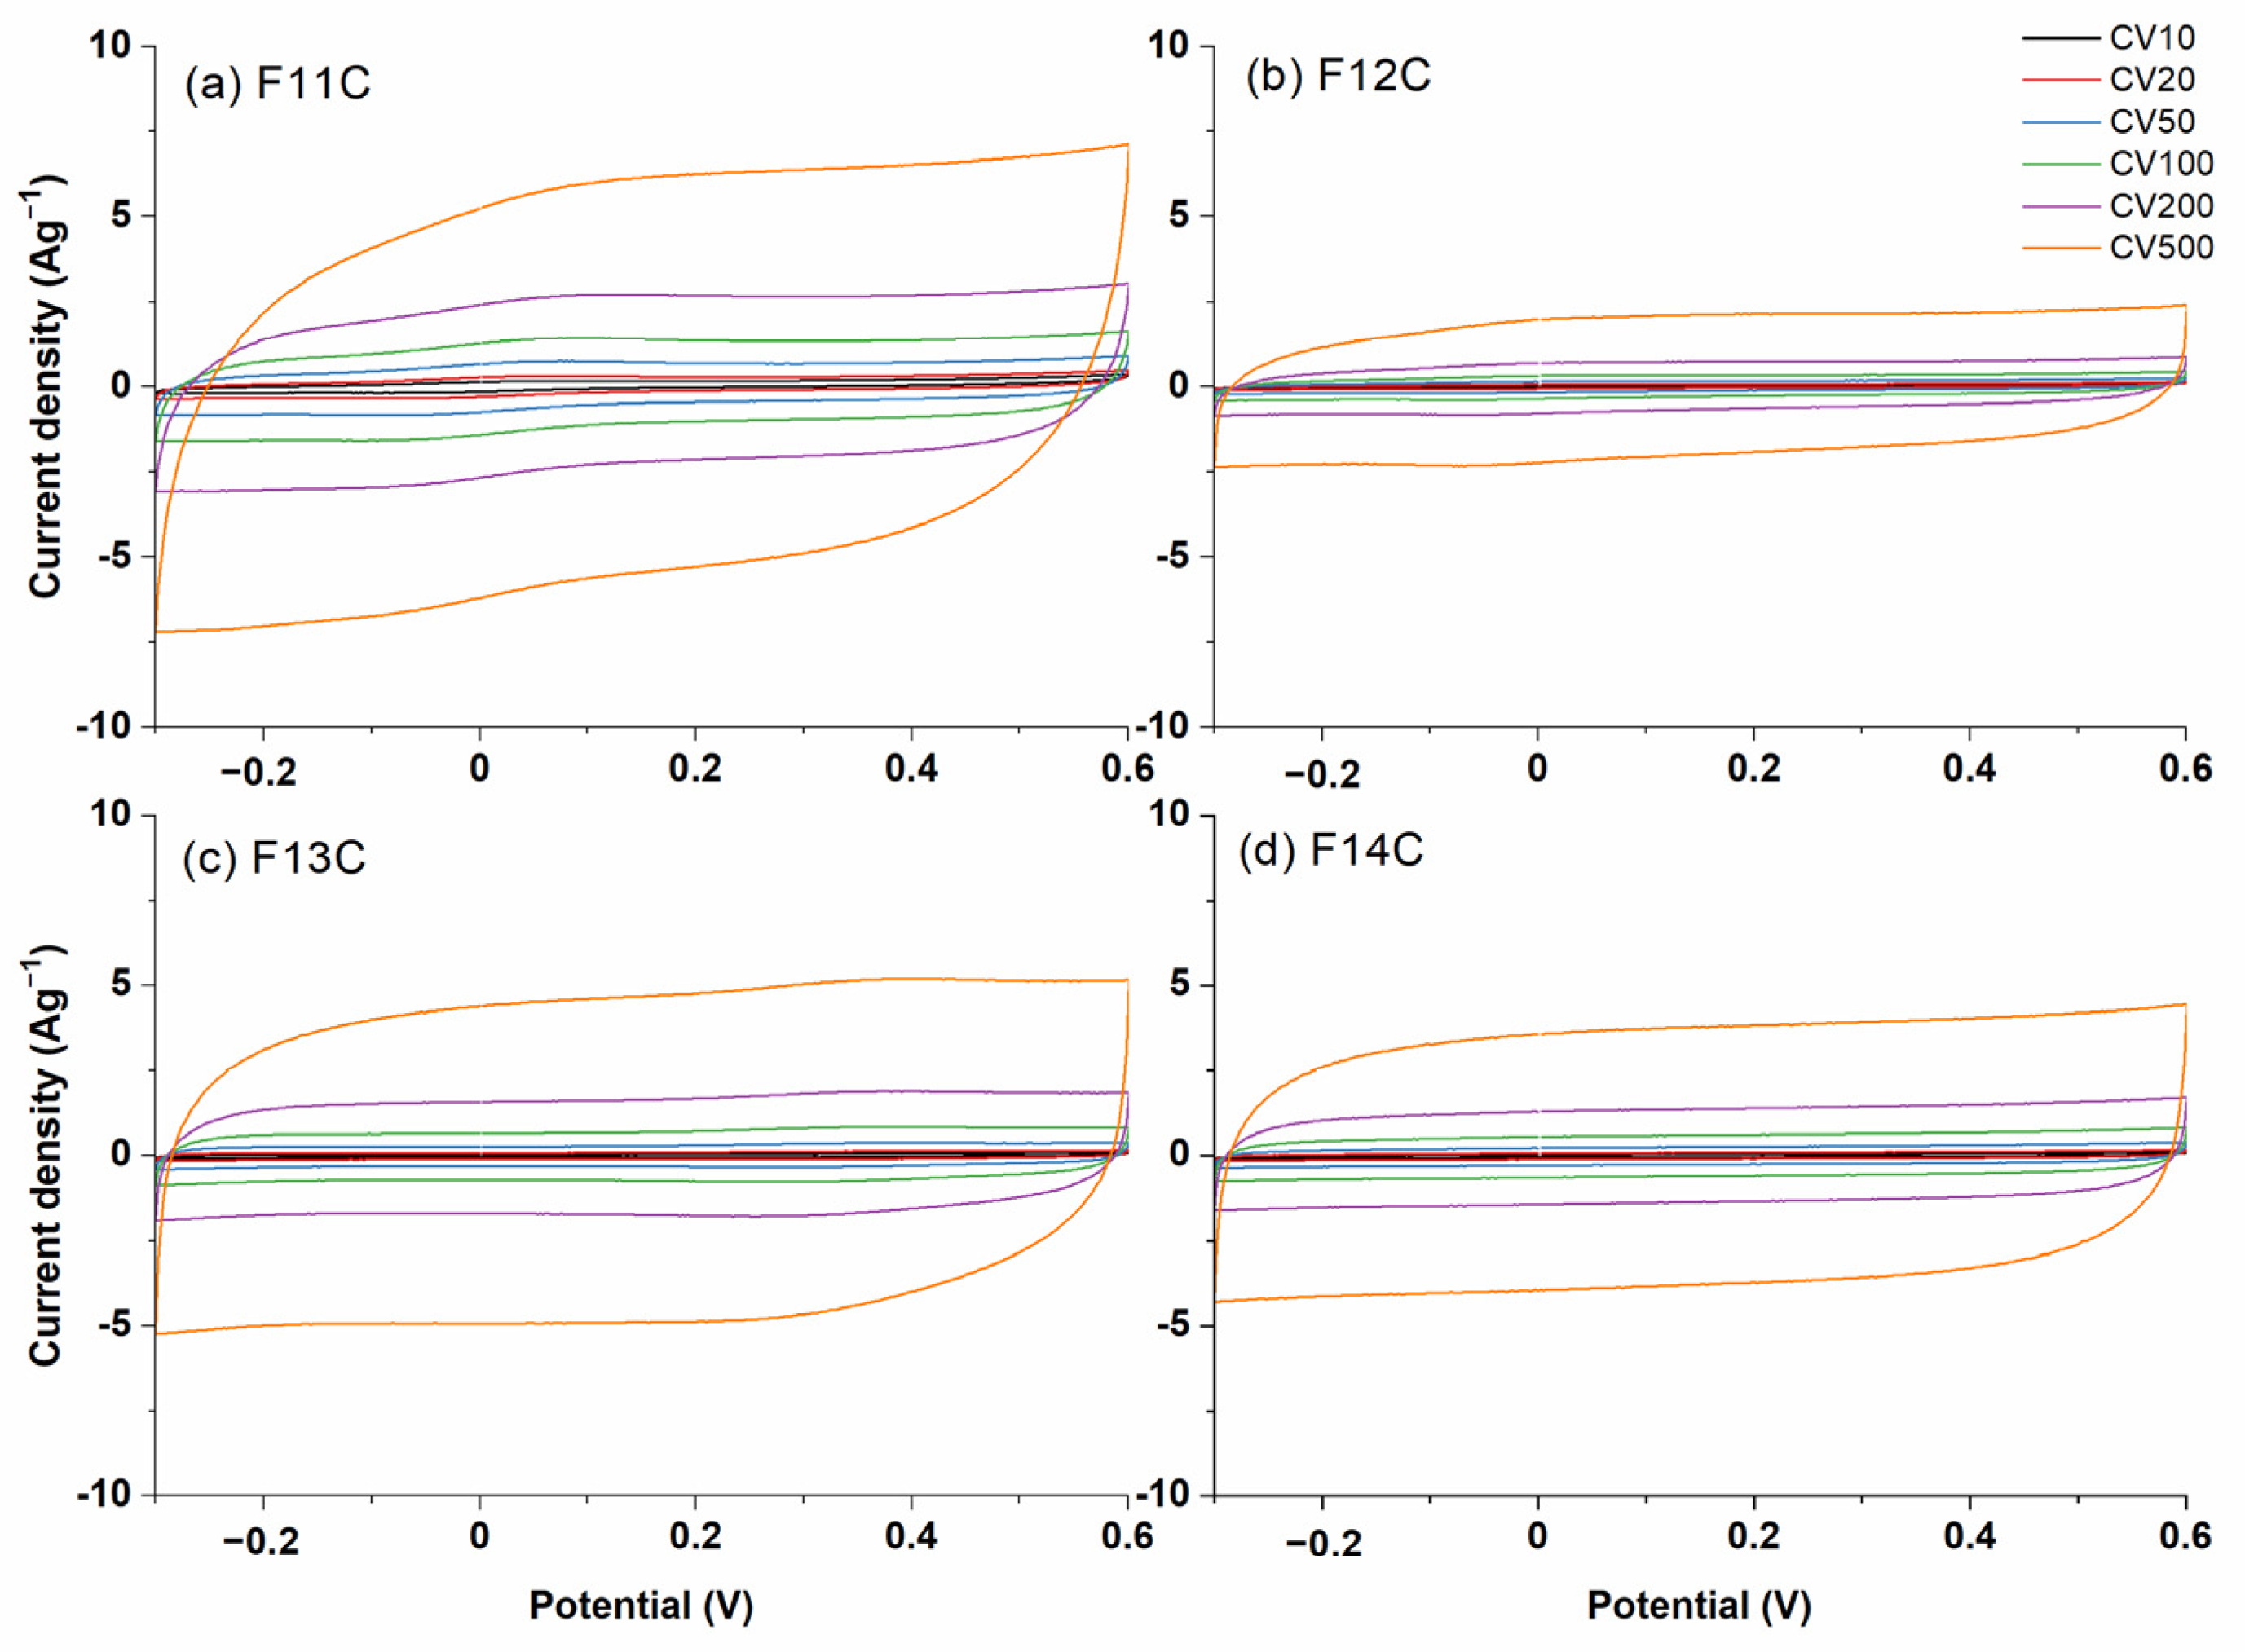
| F11C | F12C | F13C | F14C | |
|---|---|---|---|---|
| RES (Ω) | 0.4 | 0.5 | 0.5 | 0.6 |
| RCT (Ω) | 9.8 | 1.7 | 1.3 | 1.6 |
| f0 (Hz) | 10.0 | 39.8 | 25.0 | 25.0 |
| τ0 (s) | 0.100 | 0.025 | 0.040 | 0.040 |
Disclaimer/Publisher’s Note: The statements, opinions and data contained in all publications are solely those of the individual author(s) and contributor(s) and not of MDPI and/or the editor(s). MDPI and/or the editor(s) disclaim responsibility for any injury to people or property resulting from any ideas, methods, instructions or products referred to in the content. |
© 2023 by the authors. Licensee MDPI, Basel, Switzerland. This article is an open access article distributed under the terms and conditions of the Creative Commons Attribution (CC BY) license (https://creativecommons.org/licenses/by/4.0/).
Share and Cite
Merida, J.; Colomer, M.T.; Rubio, F.; Mazo, M.A. Highly Porous Carbon Materials Derived from Silicon Oxycarbides and Effect of the Pyrolysis Temperature on Their Electrochemical Response. Int. J. Mol. Sci. 2023, 24, 13868. https://doi.org/10.3390/ijms241813868
Merida J, Colomer MT, Rubio F, Mazo MA. Highly Porous Carbon Materials Derived from Silicon Oxycarbides and Effect of the Pyrolysis Temperature on Their Electrochemical Response. International Journal of Molecular Sciences. 2023; 24(18):13868. https://doi.org/10.3390/ijms241813868
Chicago/Turabian StyleMerida, Jose, Maria T. Colomer, Fausto Rubio, and M. Alejandra Mazo. 2023. "Highly Porous Carbon Materials Derived from Silicon Oxycarbides and Effect of the Pyrolysis Temperature on Their Electrochemical Response" International Journal of Molecular Sciences 24, no. 18: 13868. https://doi.org/10.3390/ijms241813868