
The Muscle-Conditioned Medium Containing Protocatechuic Acid Improves Insulin Resistance by Modulating Muscle Communication with Liver and Adipose Tissue
 , ,
, , 
Abstract
:1. Introduction
2. Results
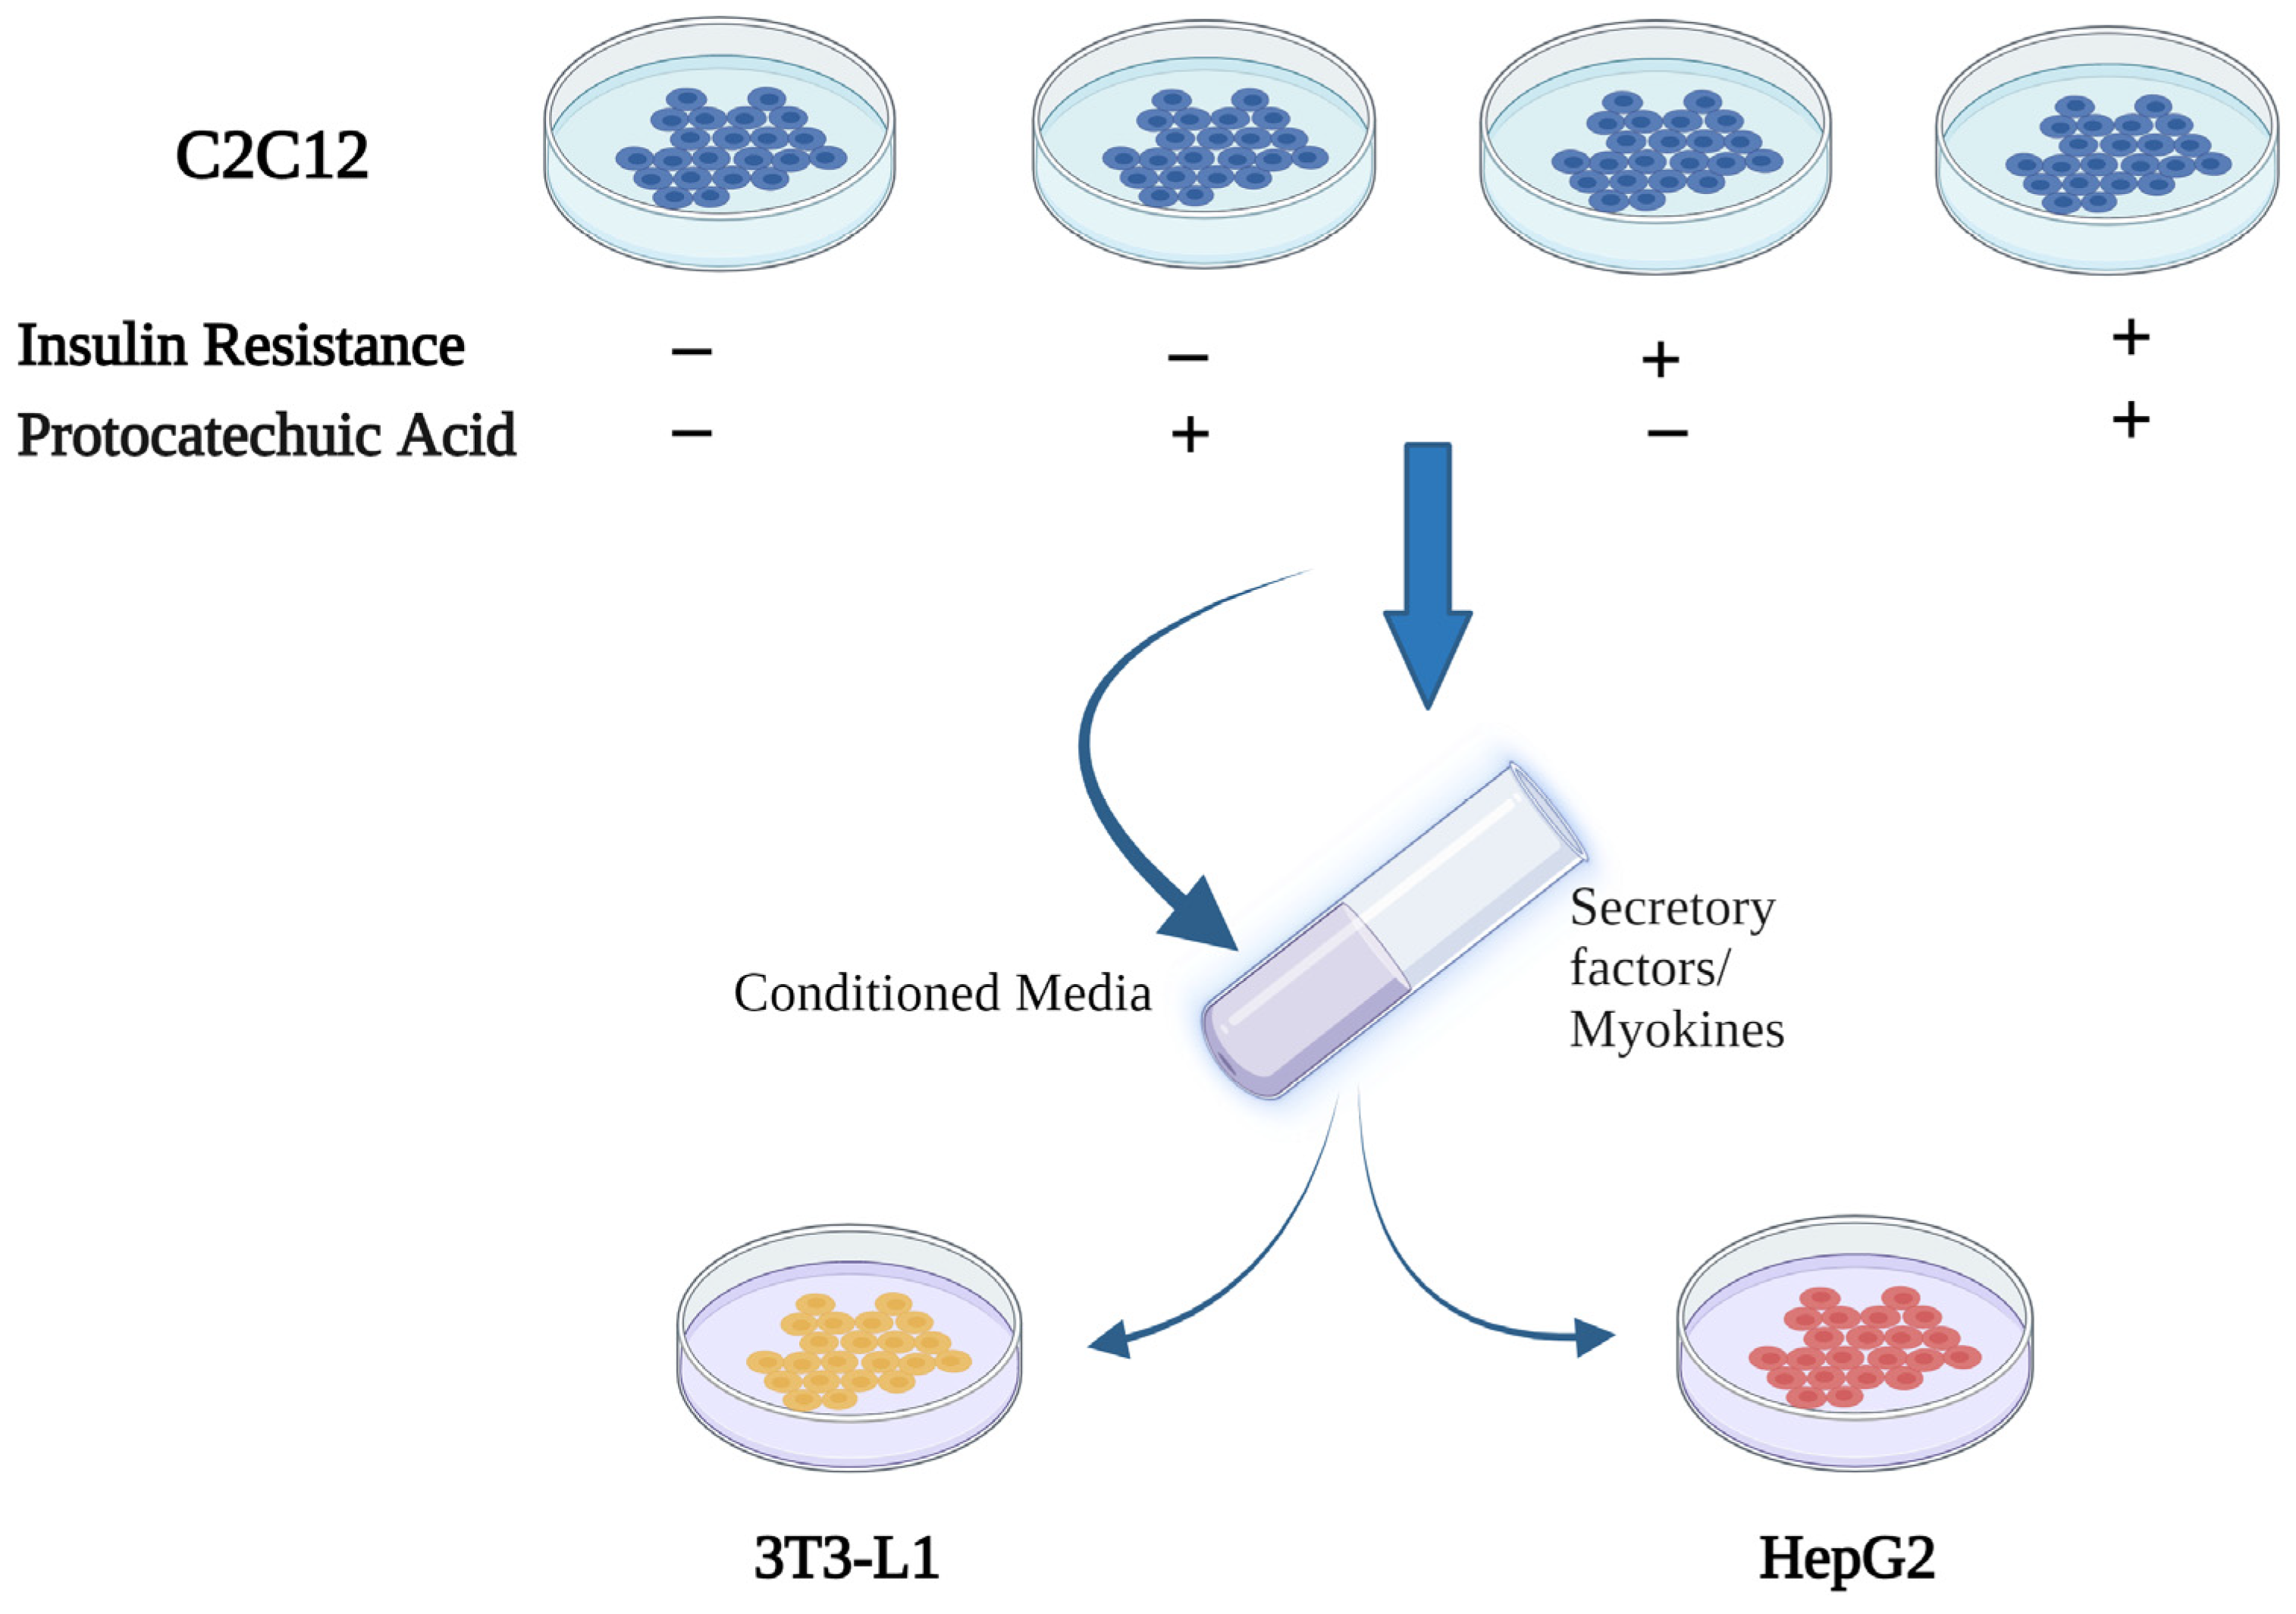
2.1. Study Design
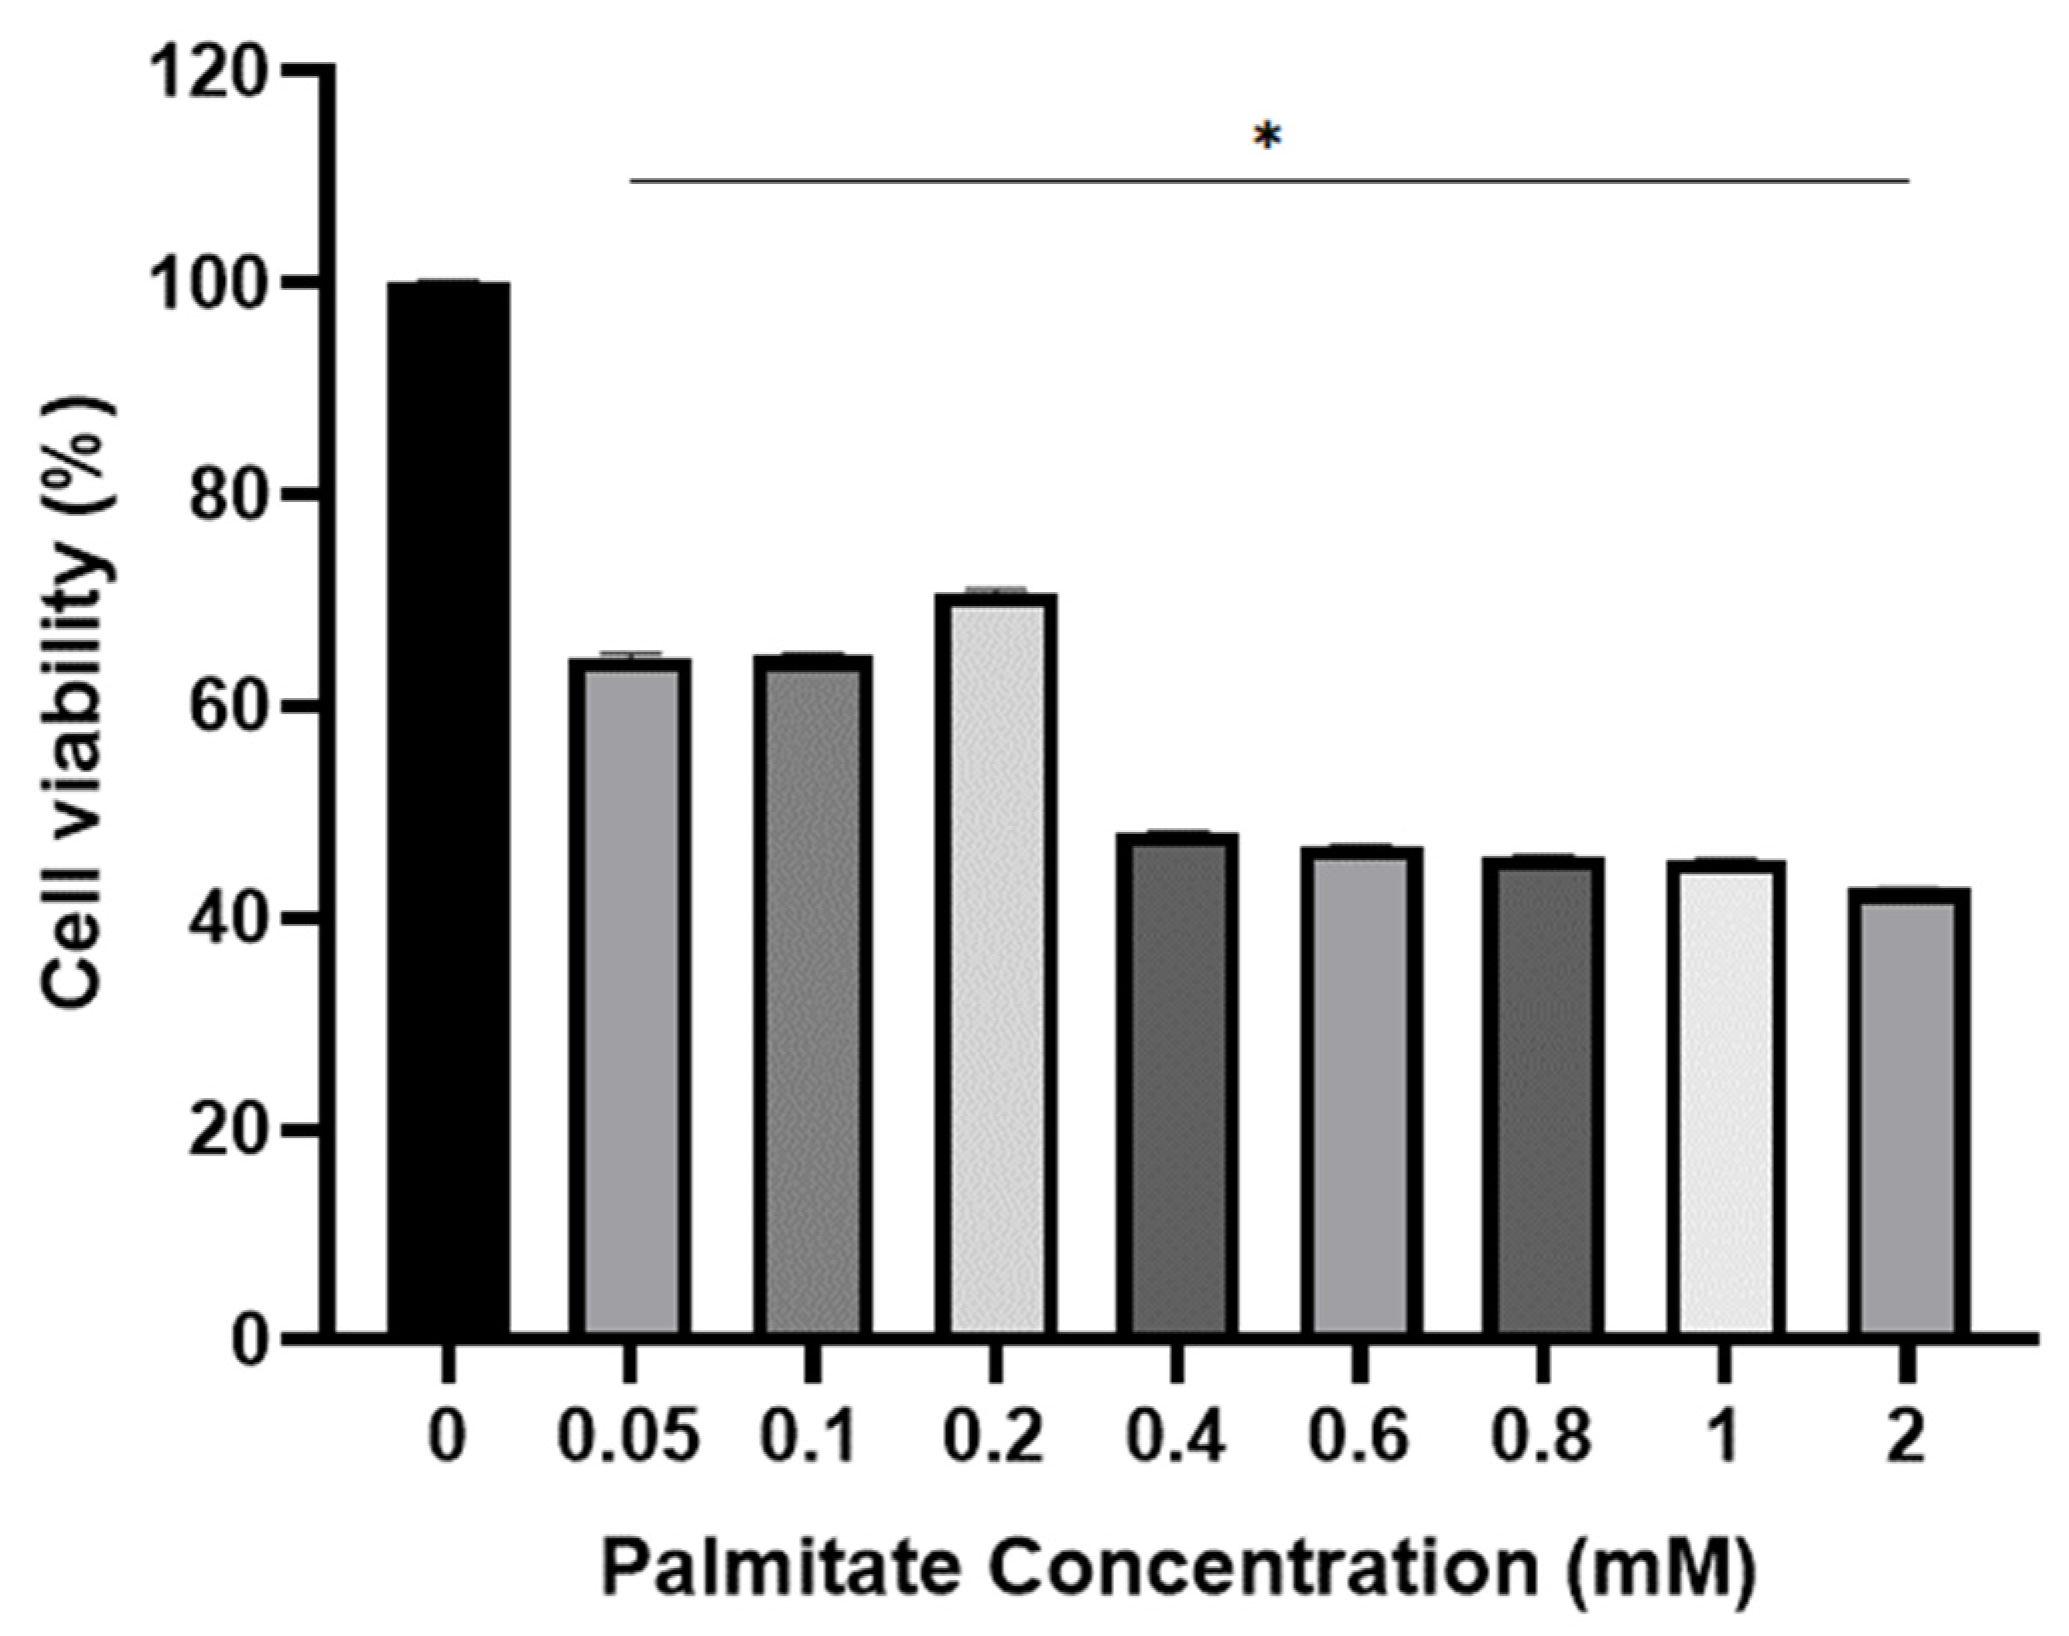
2.2. Viability of C2C12 Cell for Palmitate
2.3. Viability of C2C12 Cell for PCA
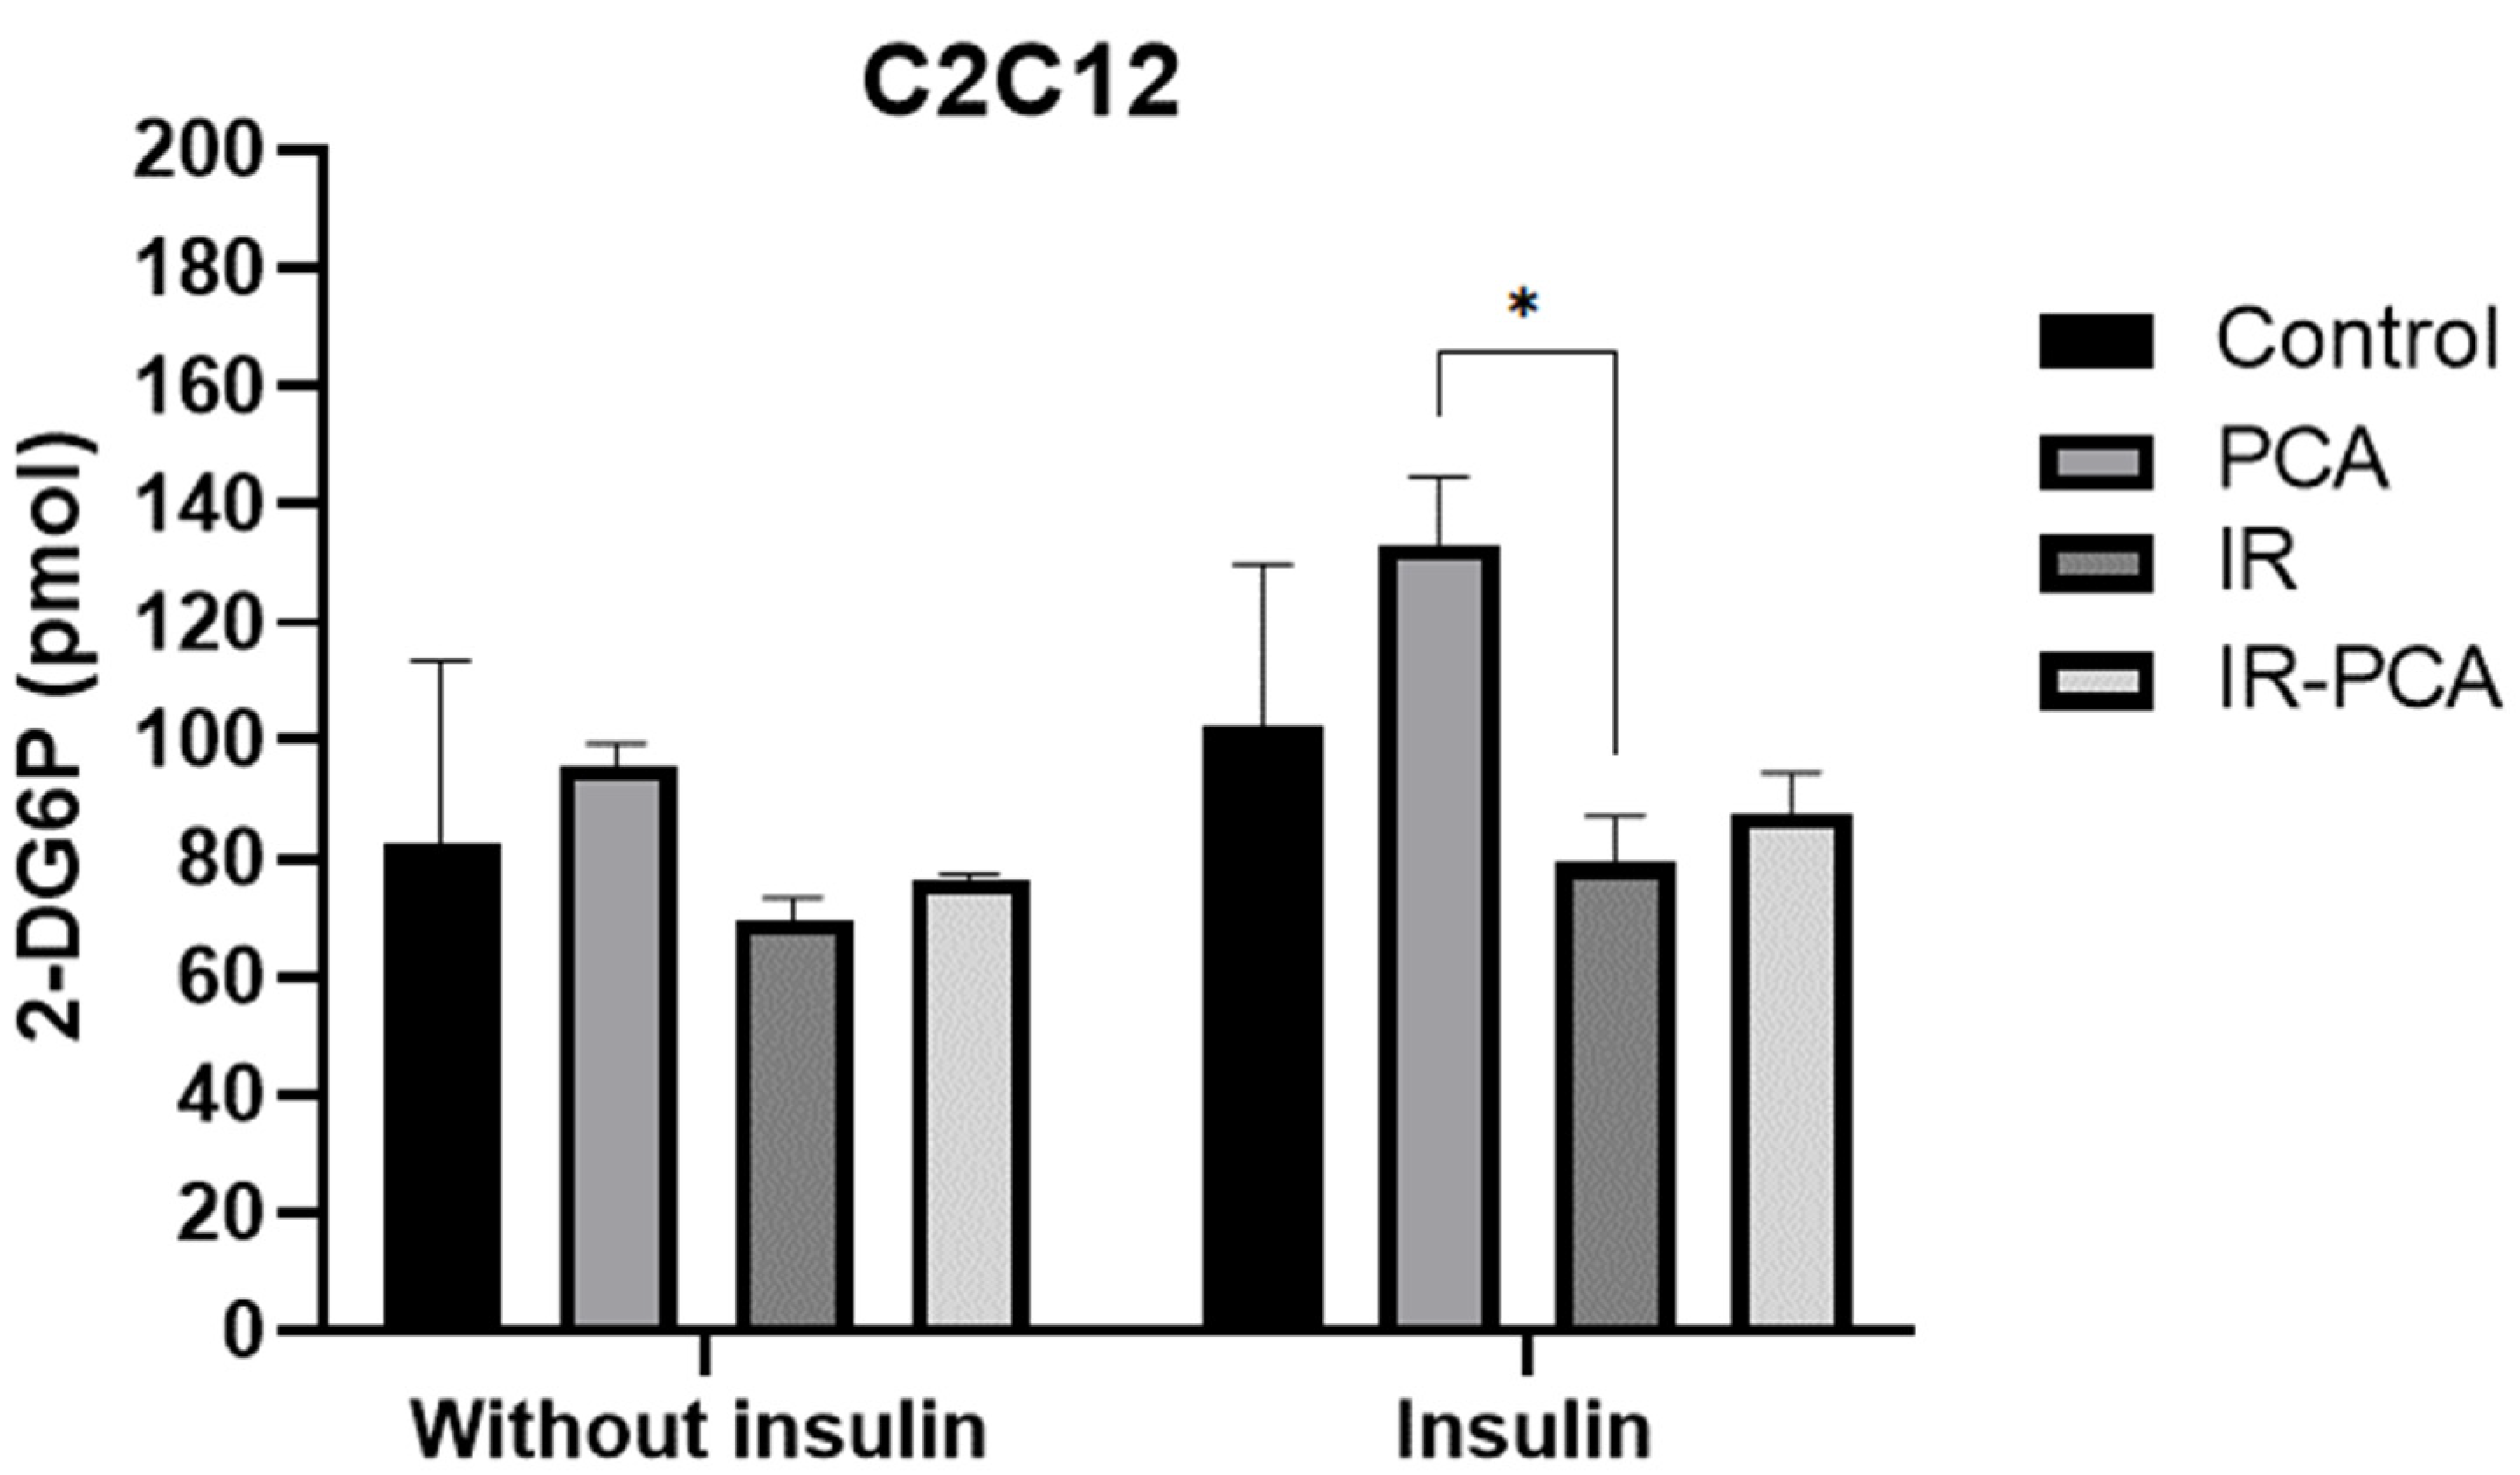
2.4. Glucose Uptake by C2C12
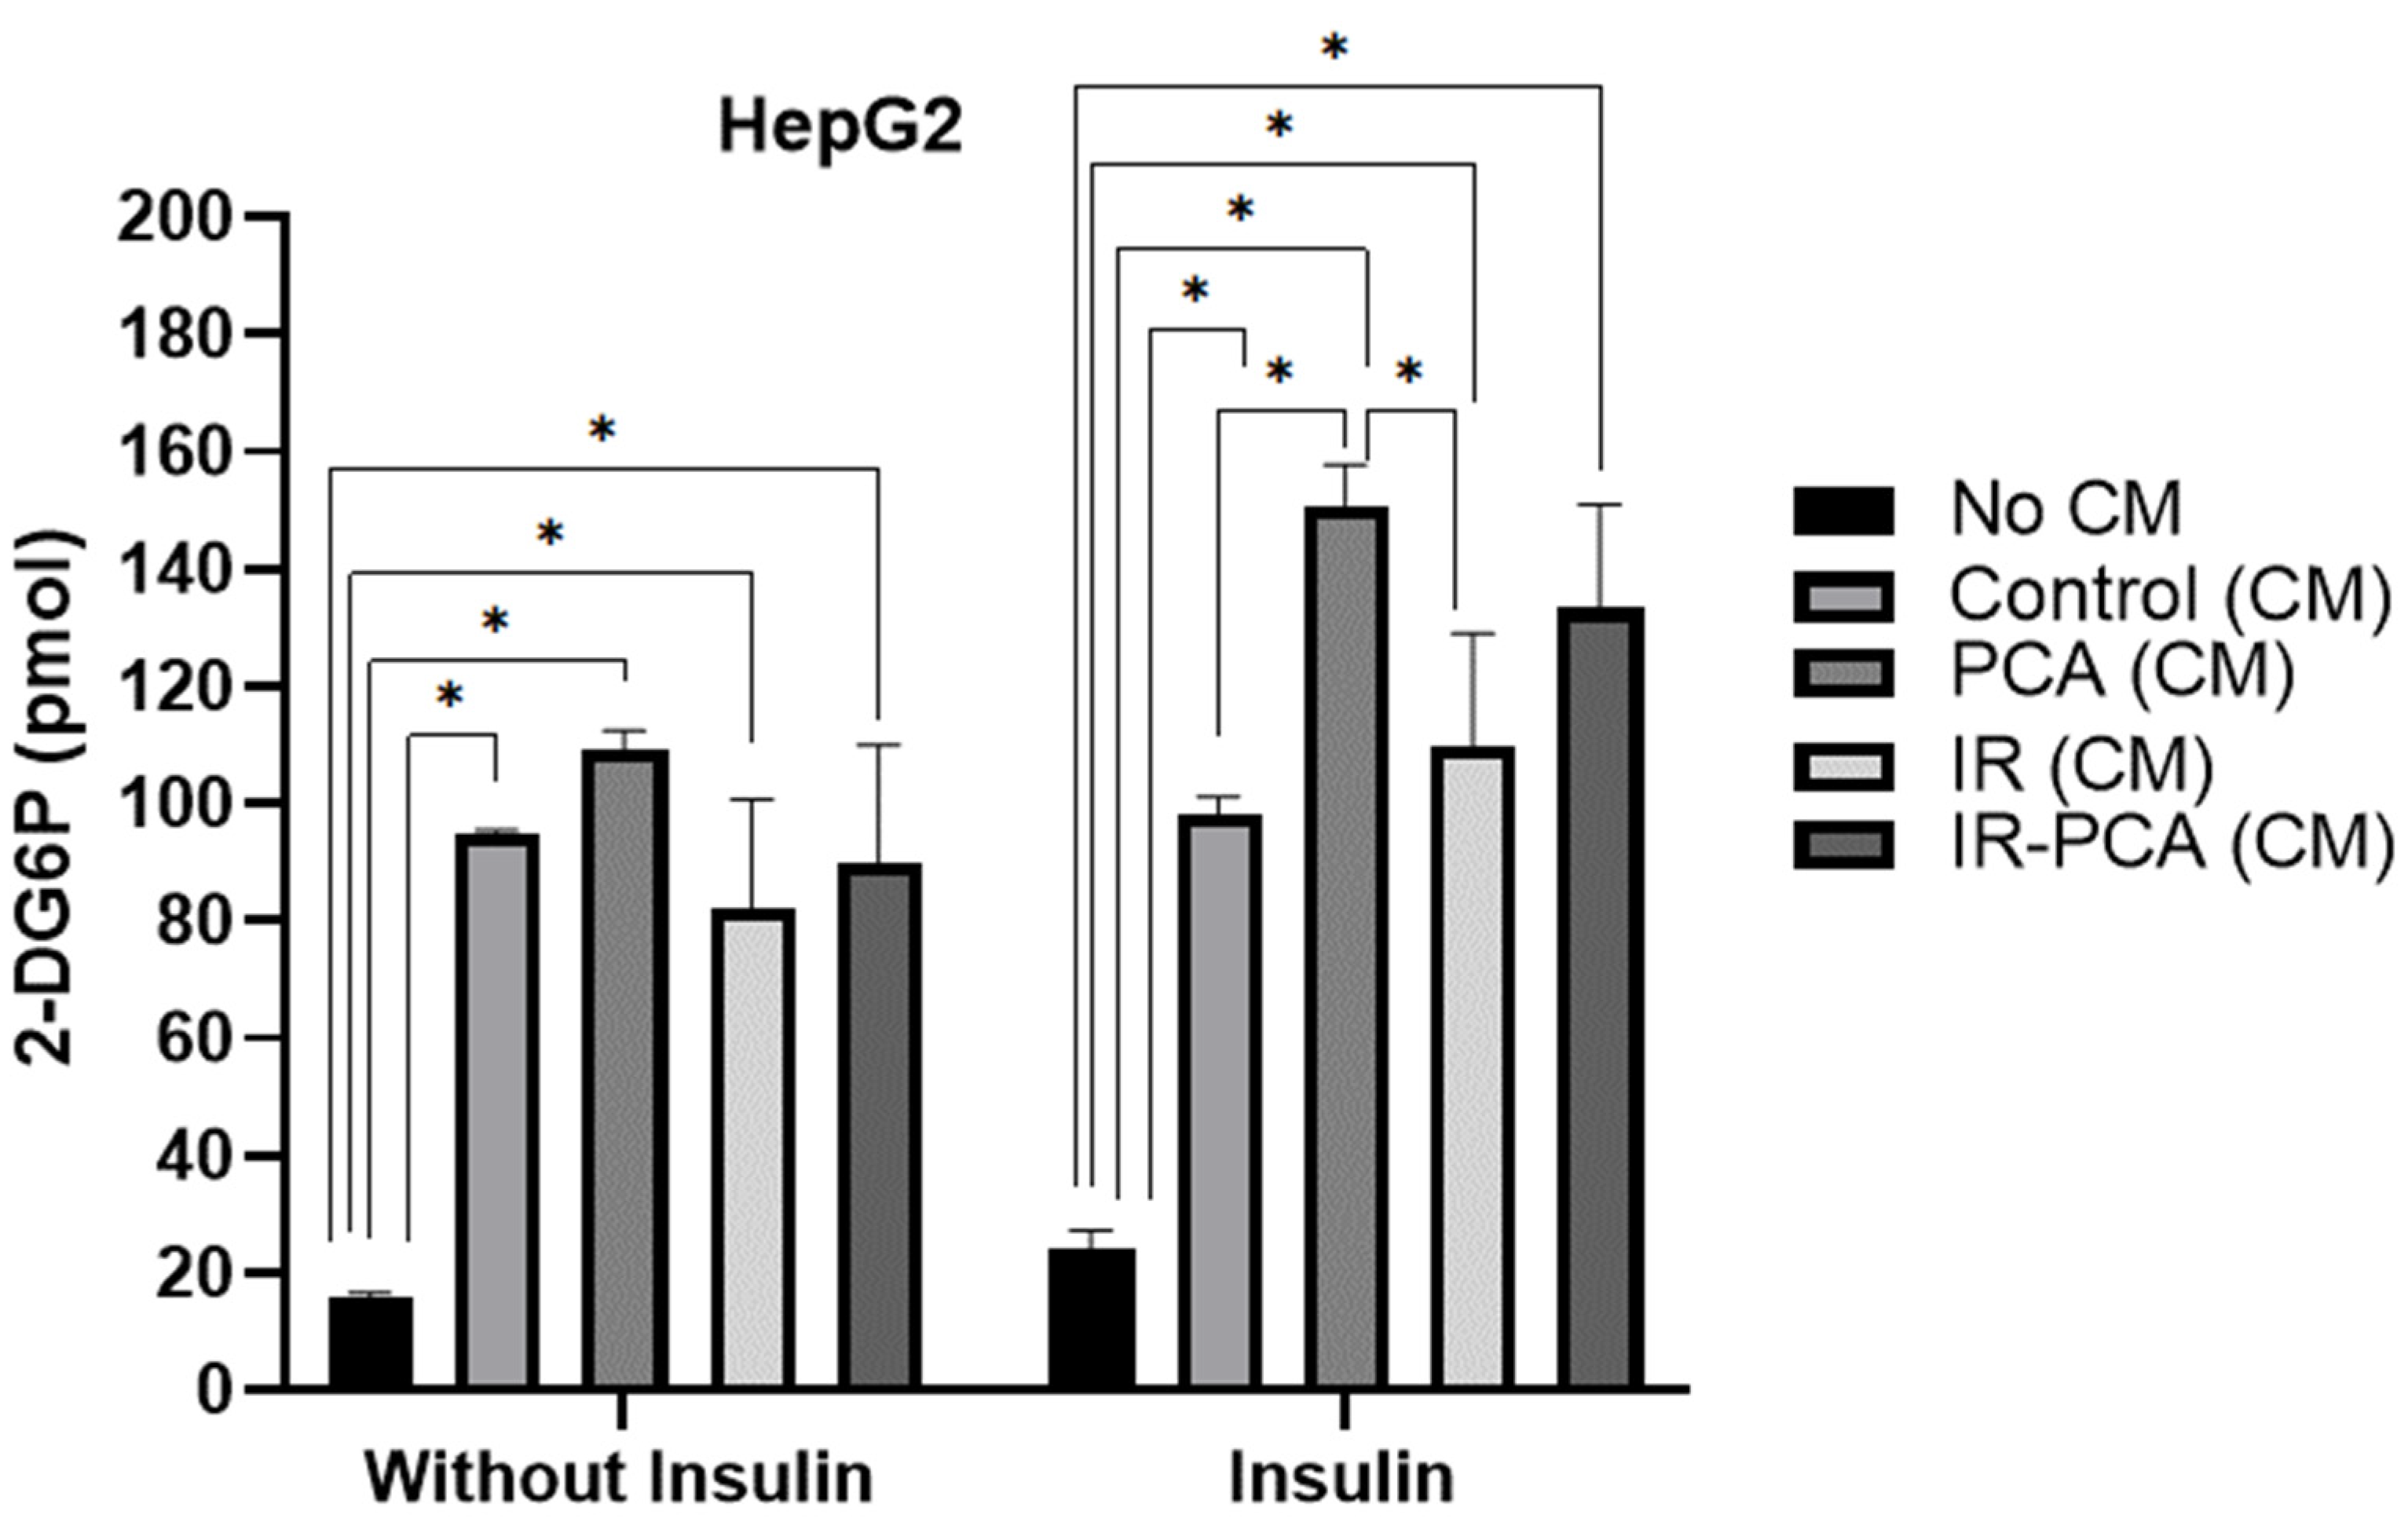
2.5. Glucose Uptake by HepG2
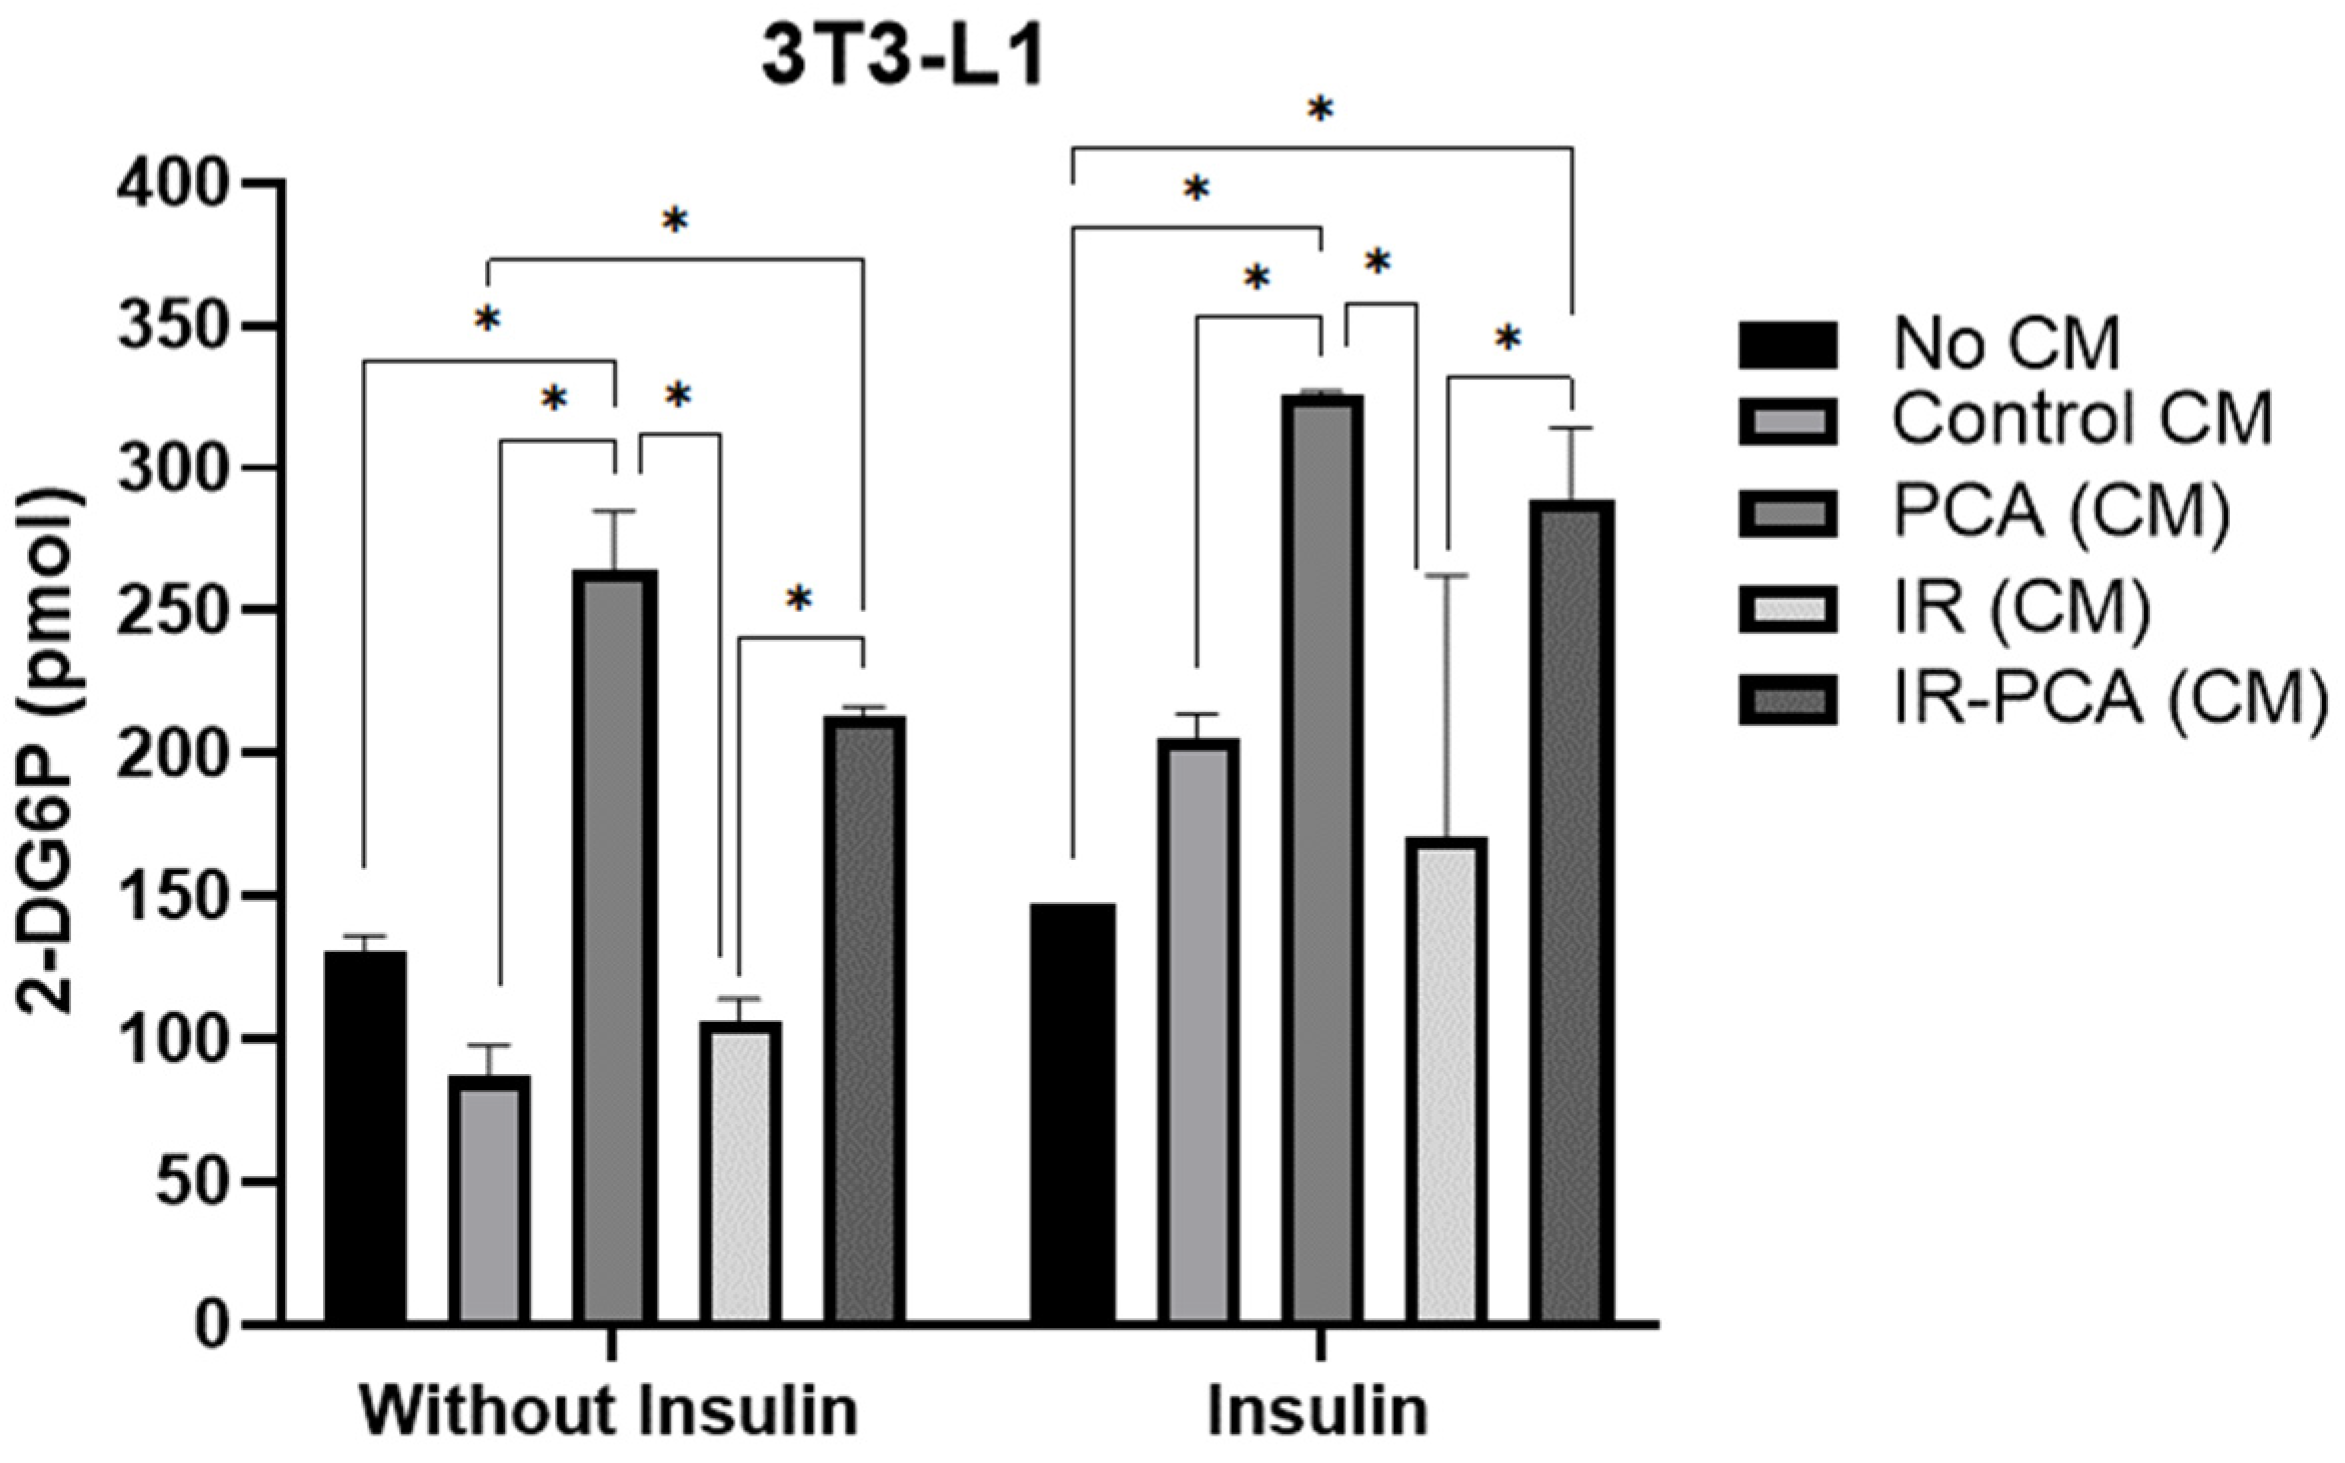
2.6. Glucose Uptake by 3T3-L1 Adipocytes
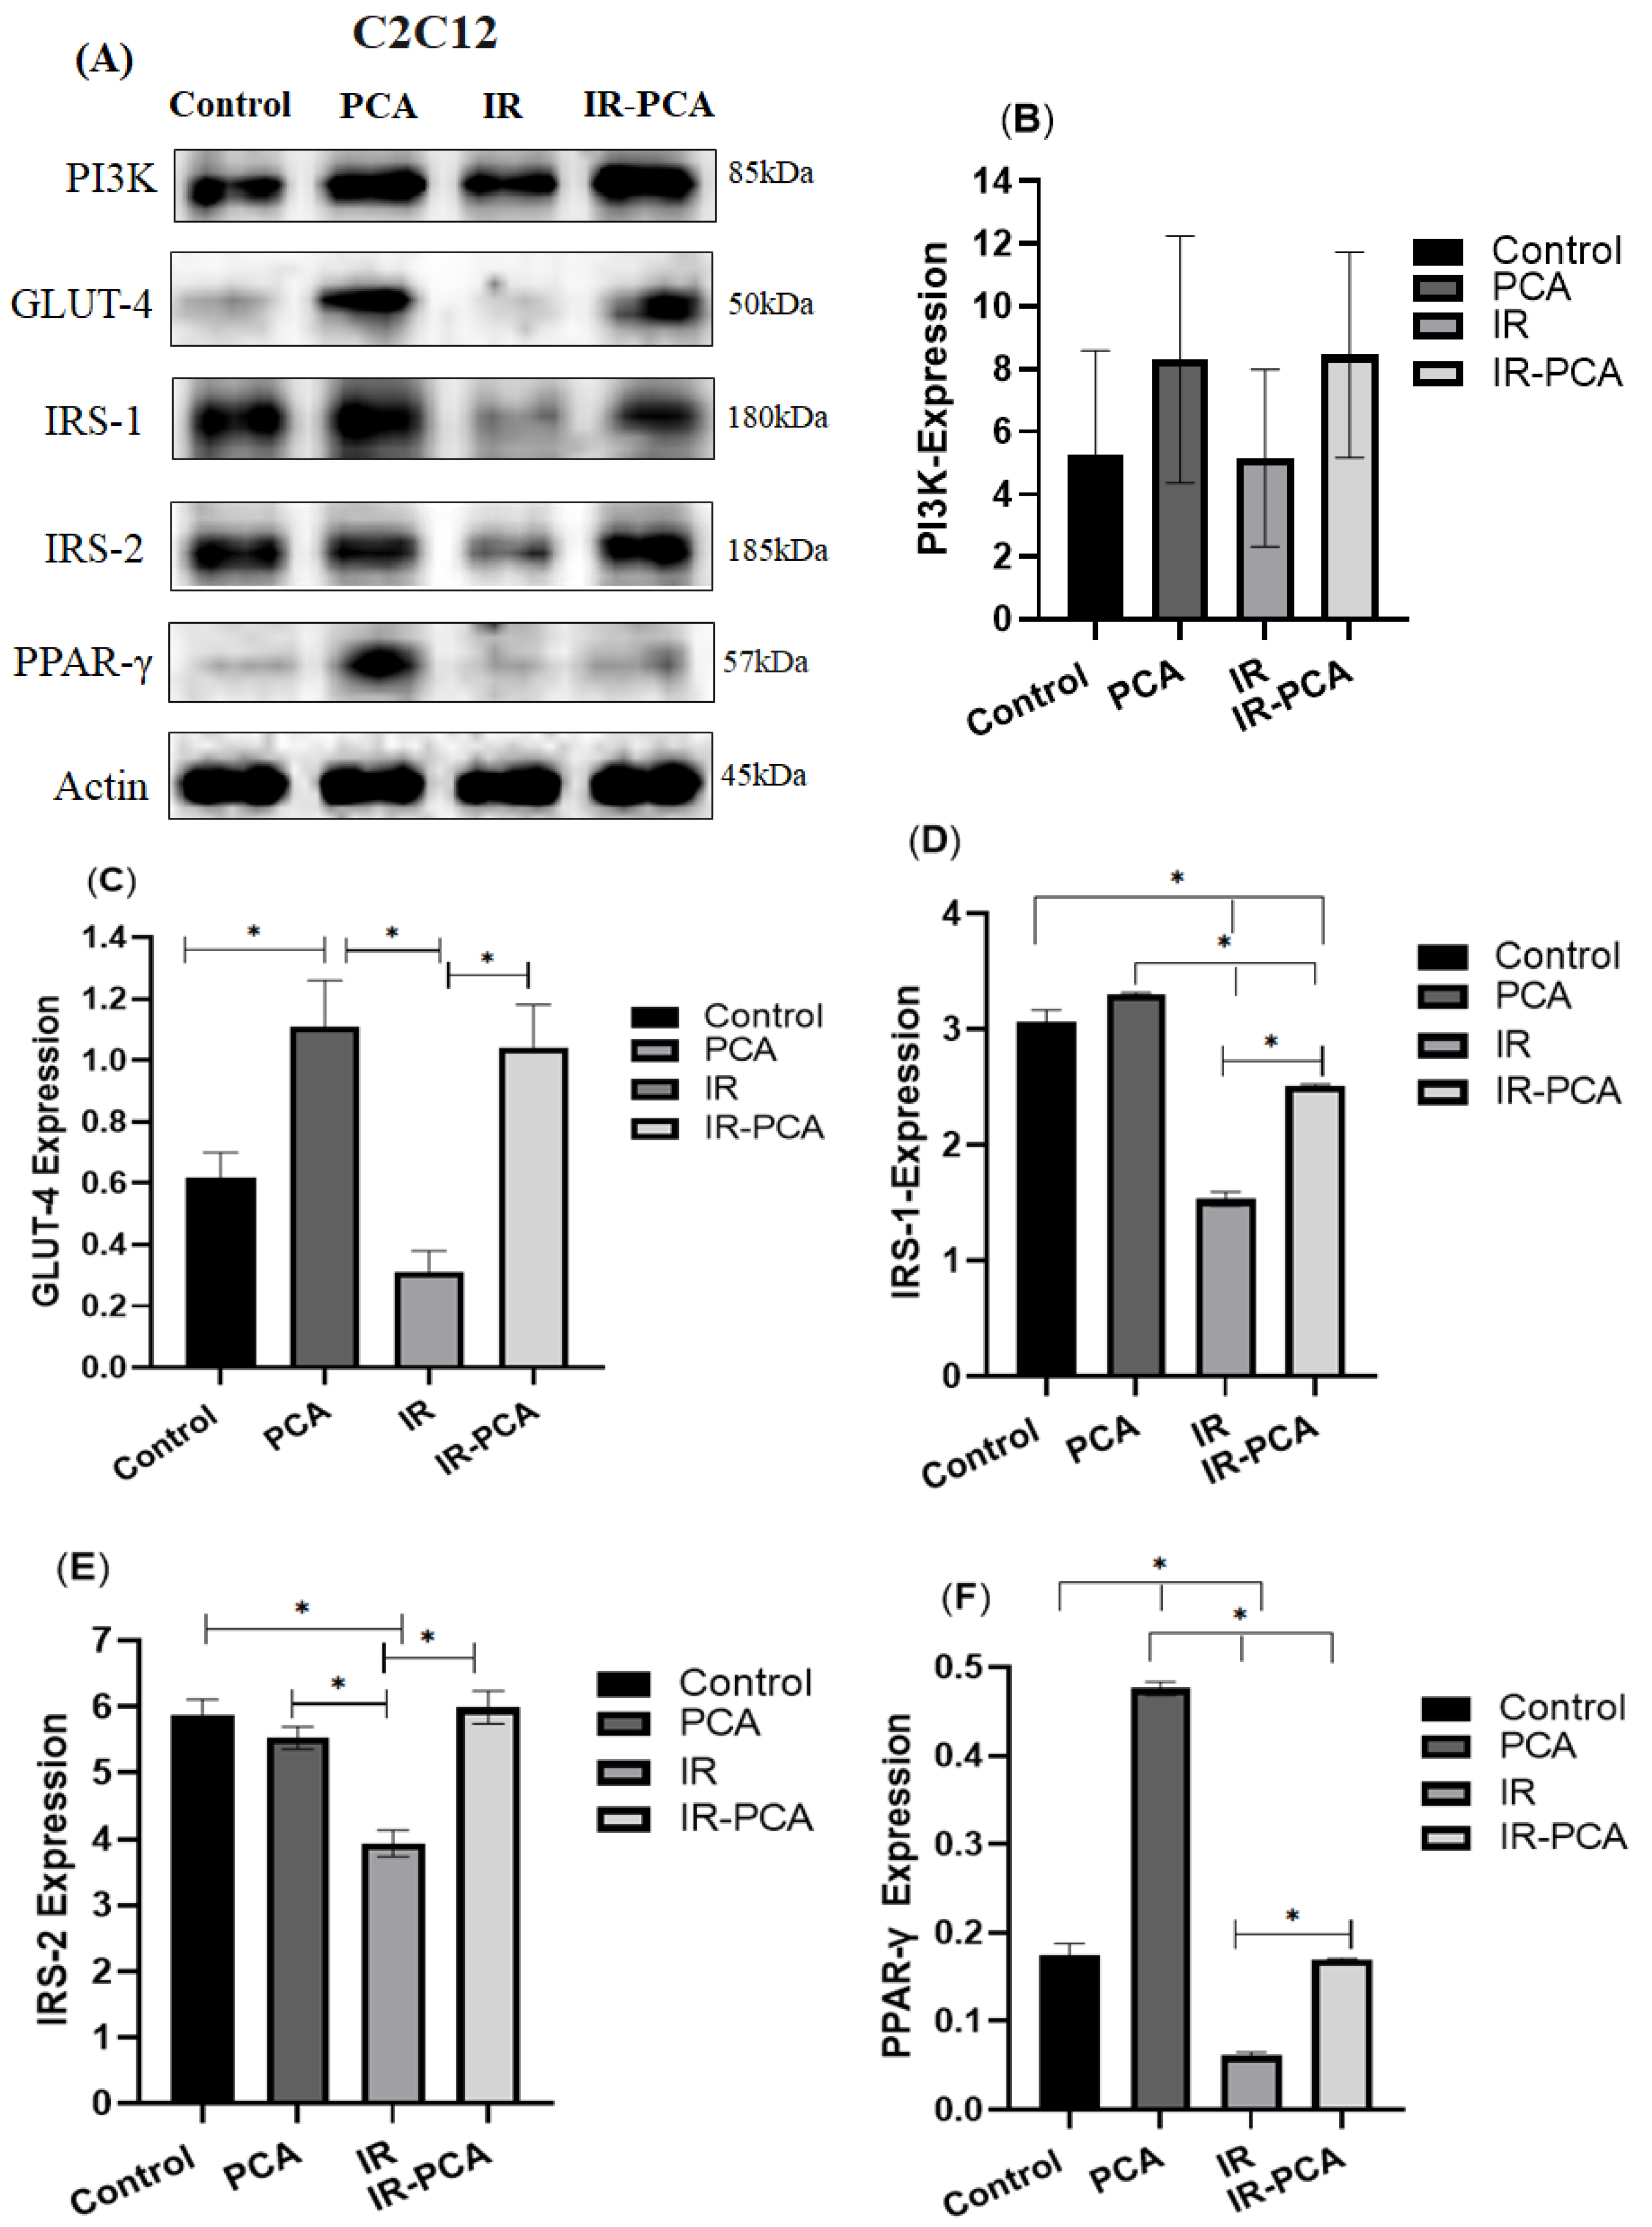
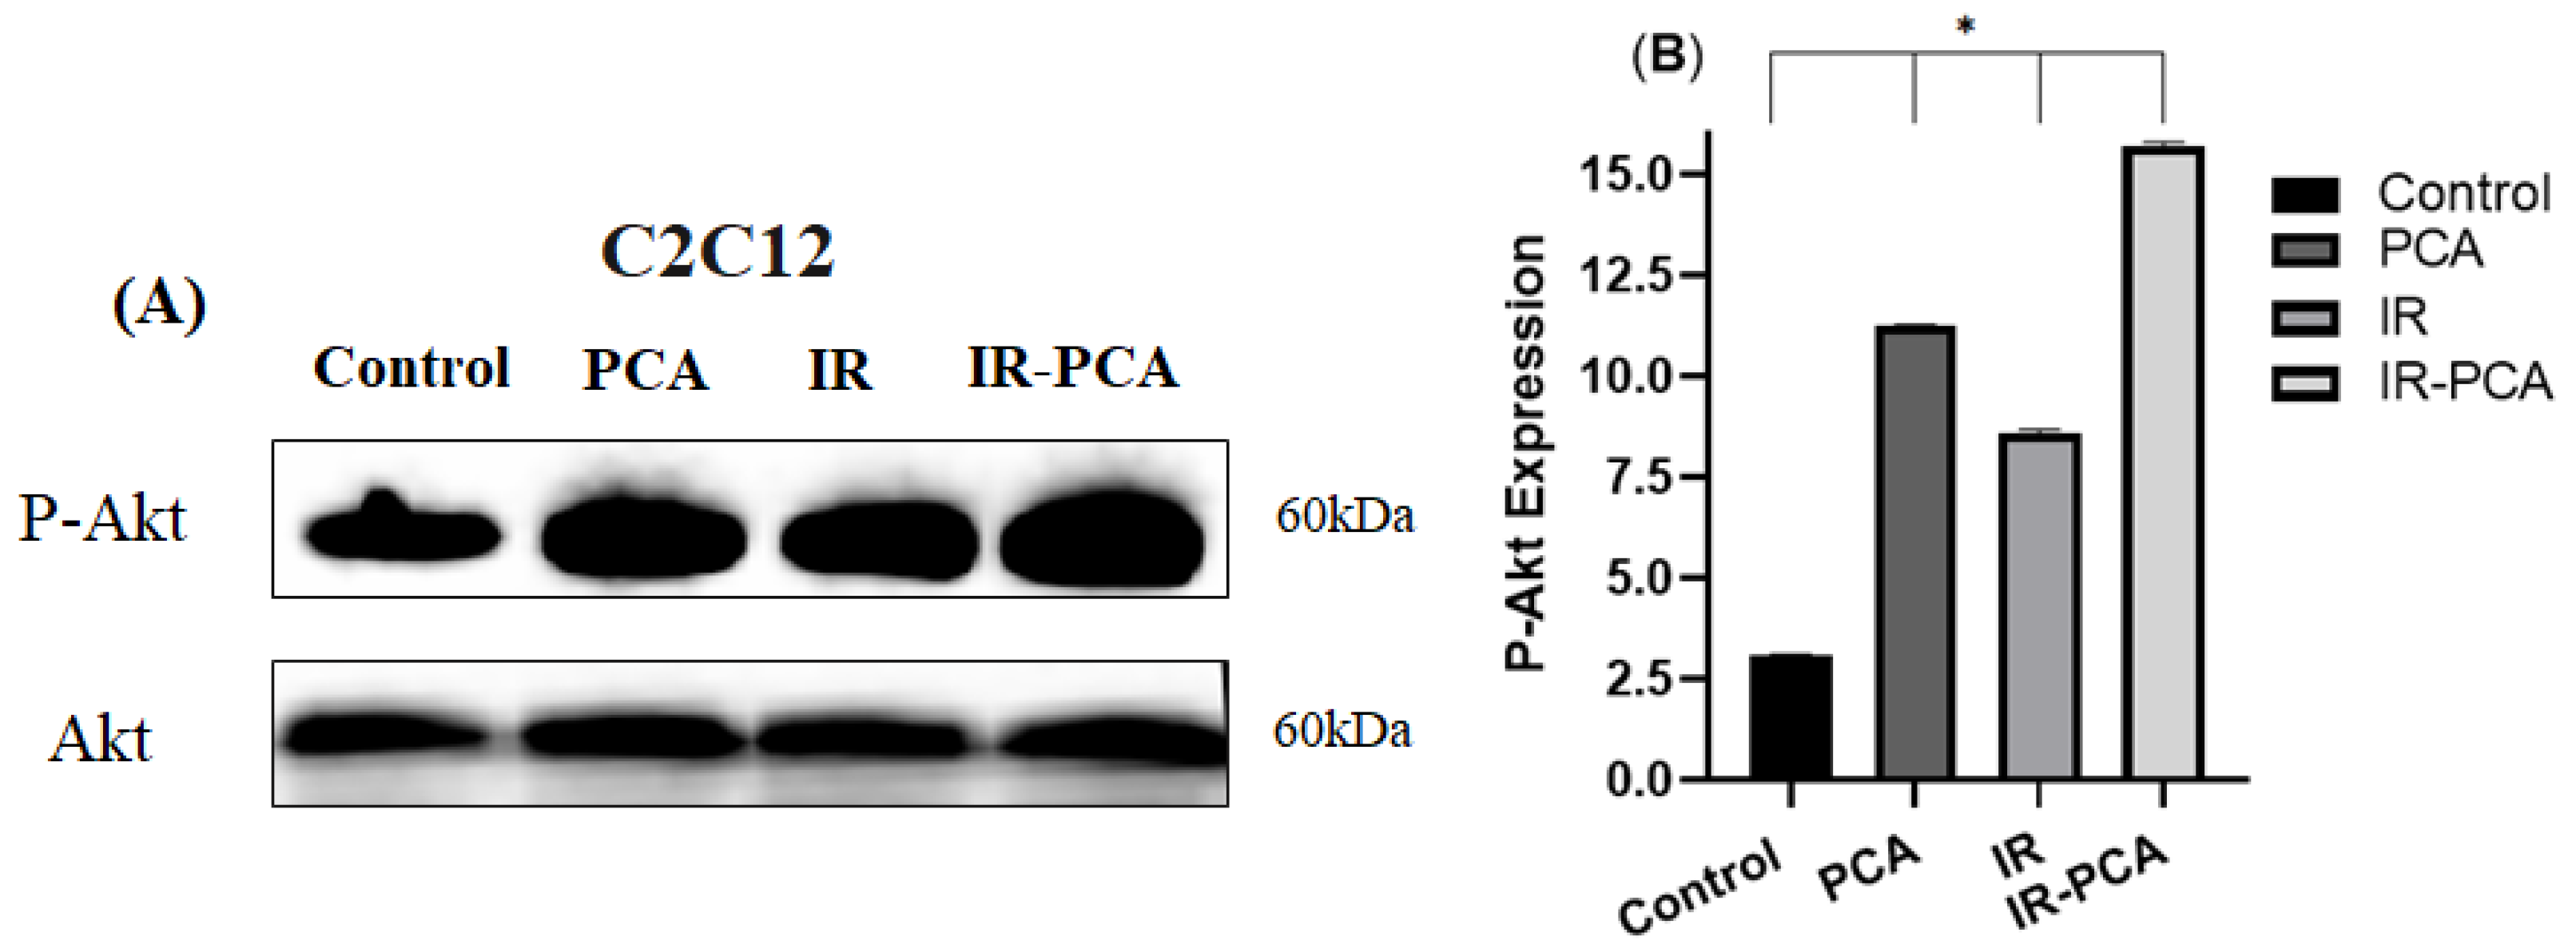
2.7. Effect of Protocatechuic Acid on Insulin Signaling in C2C12 Myotubes
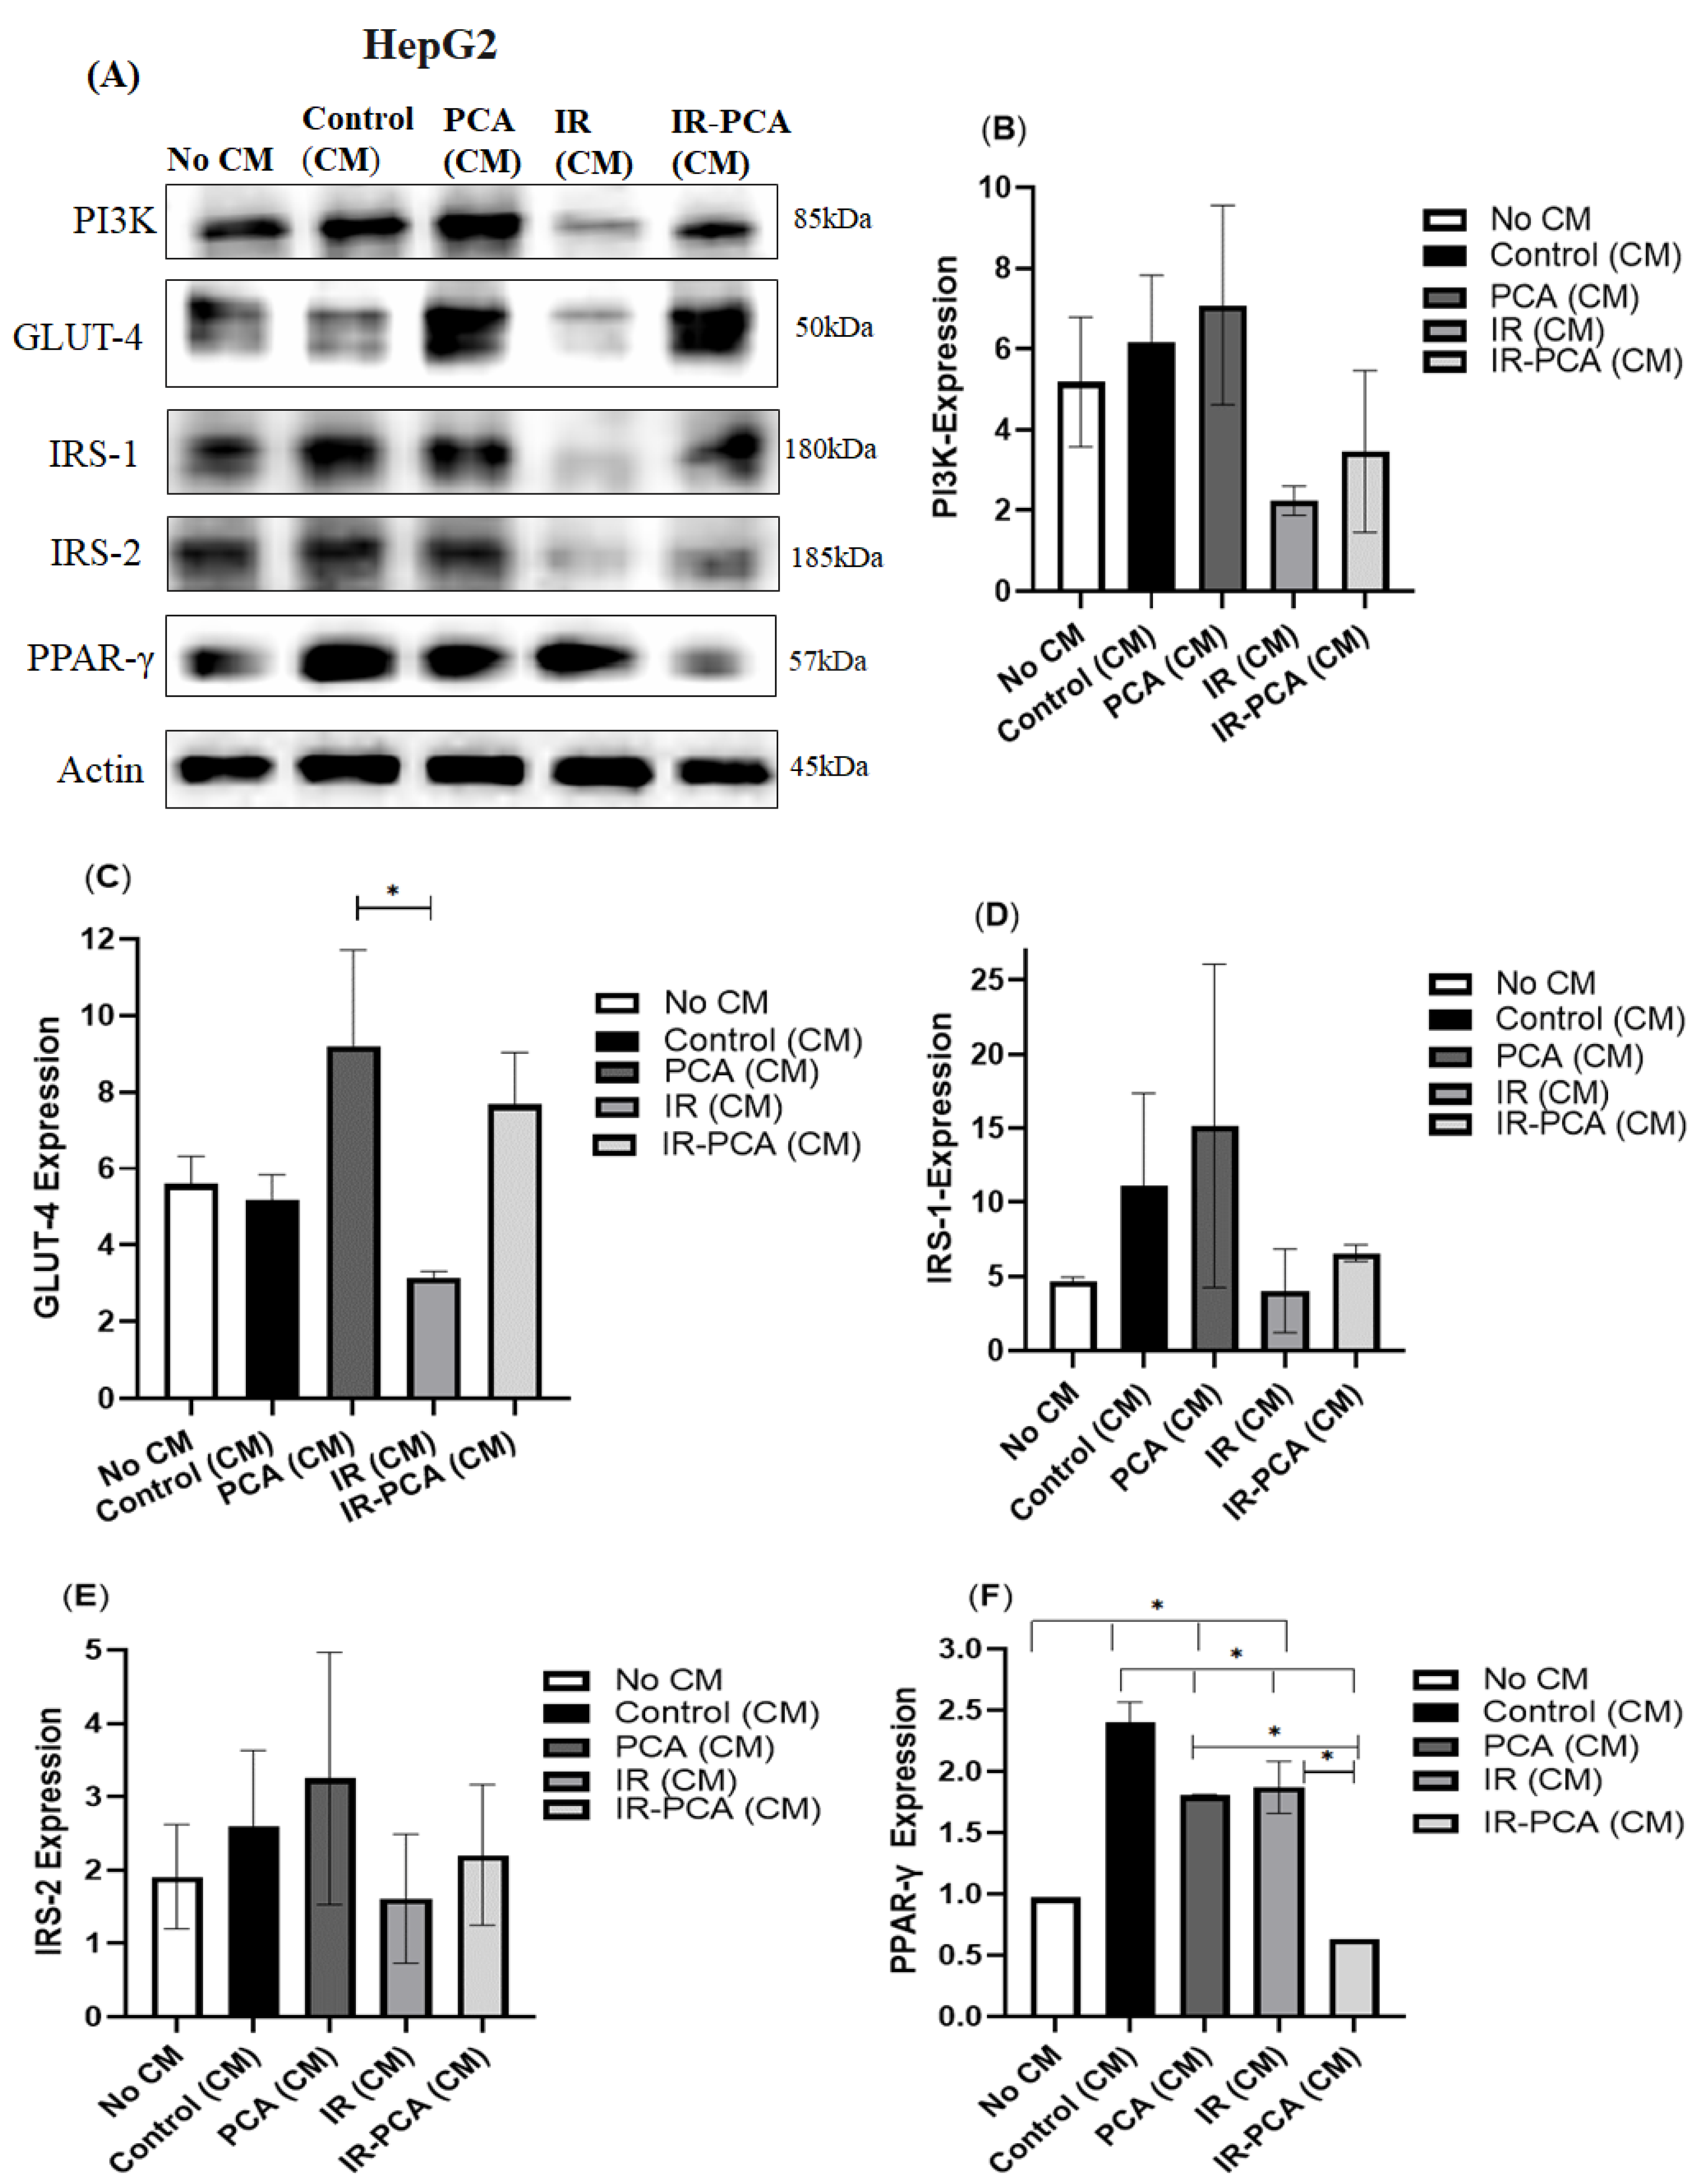
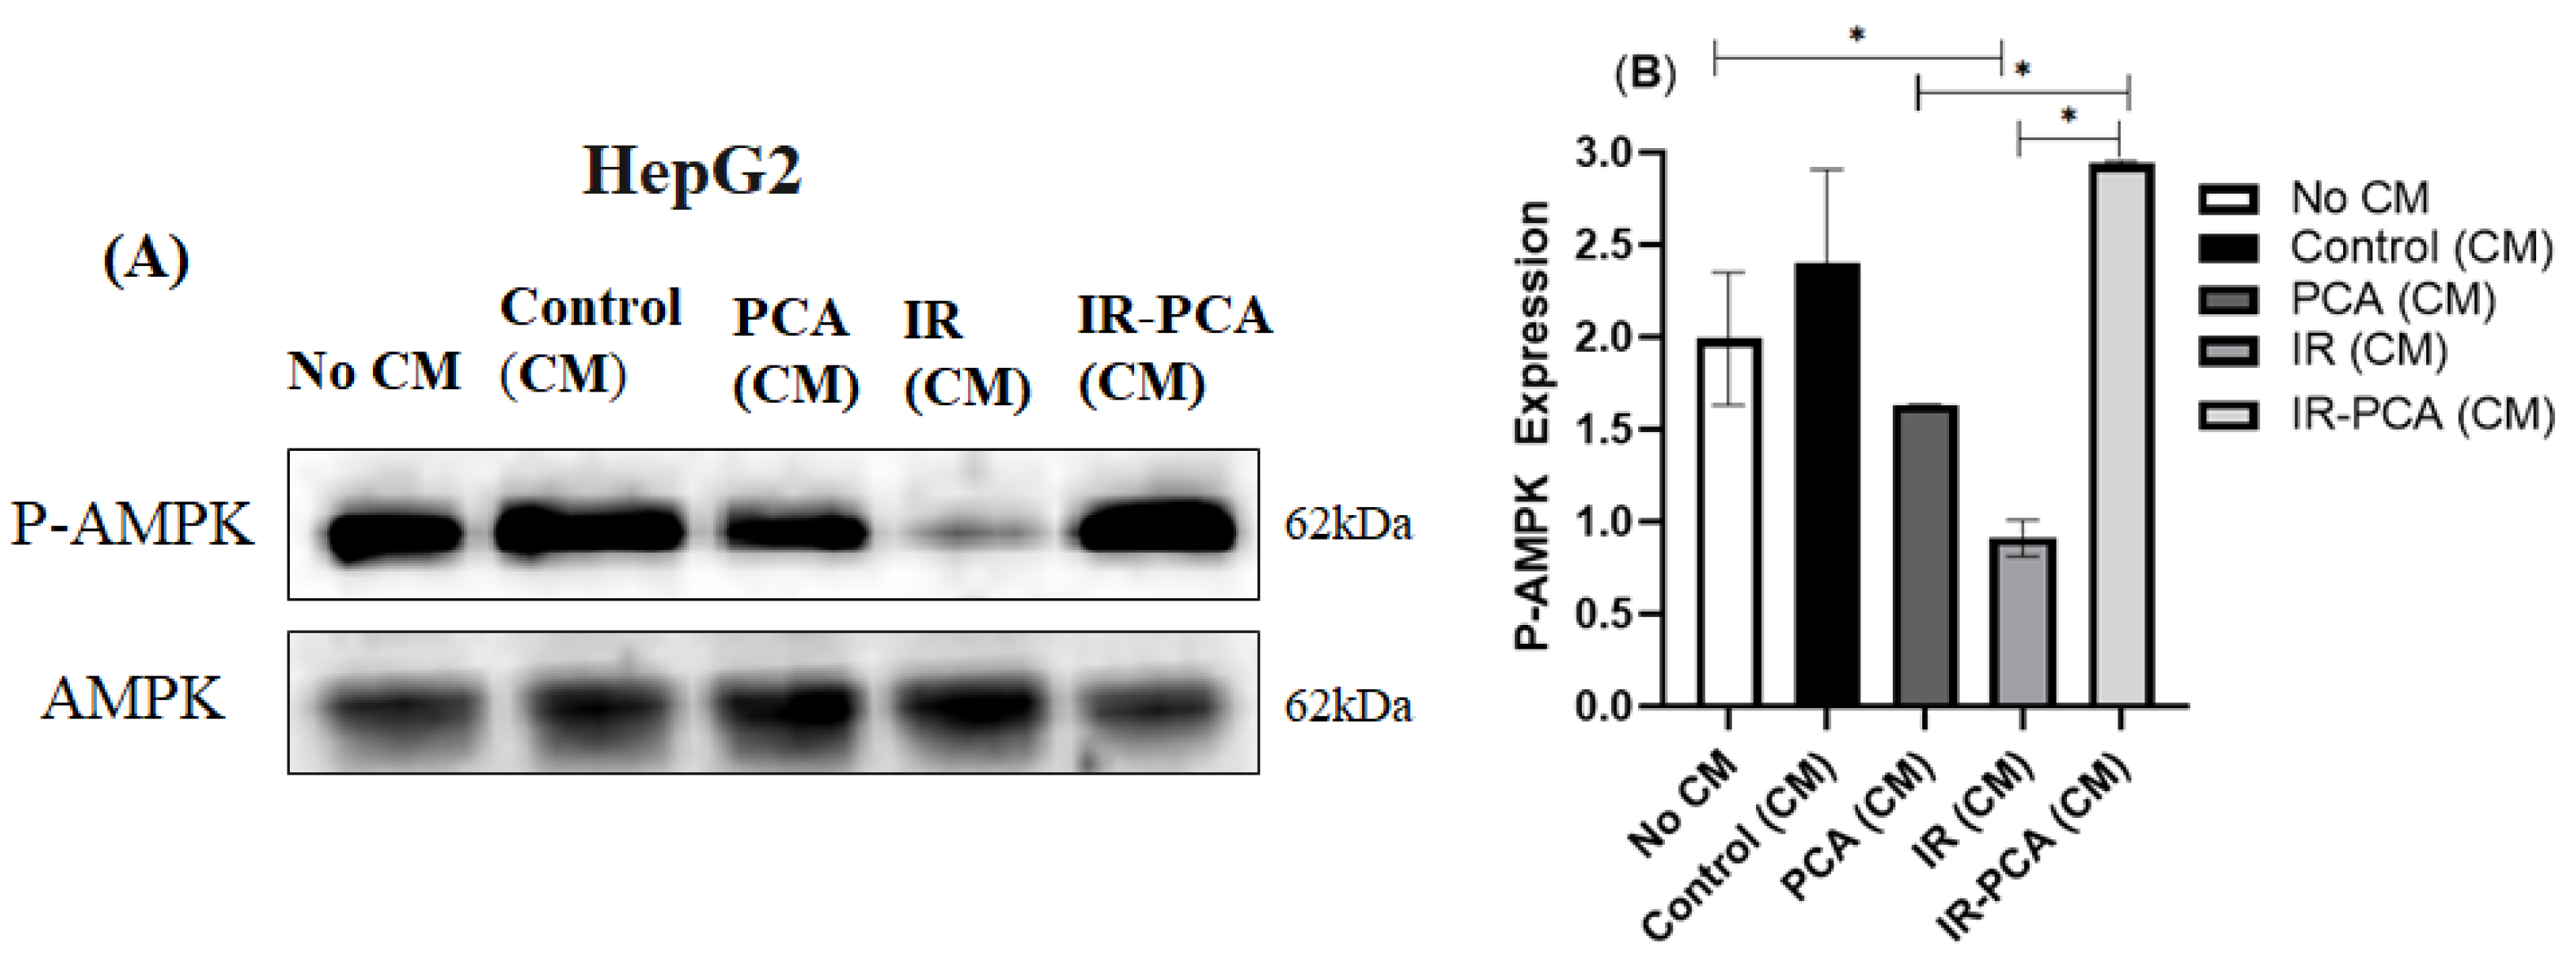
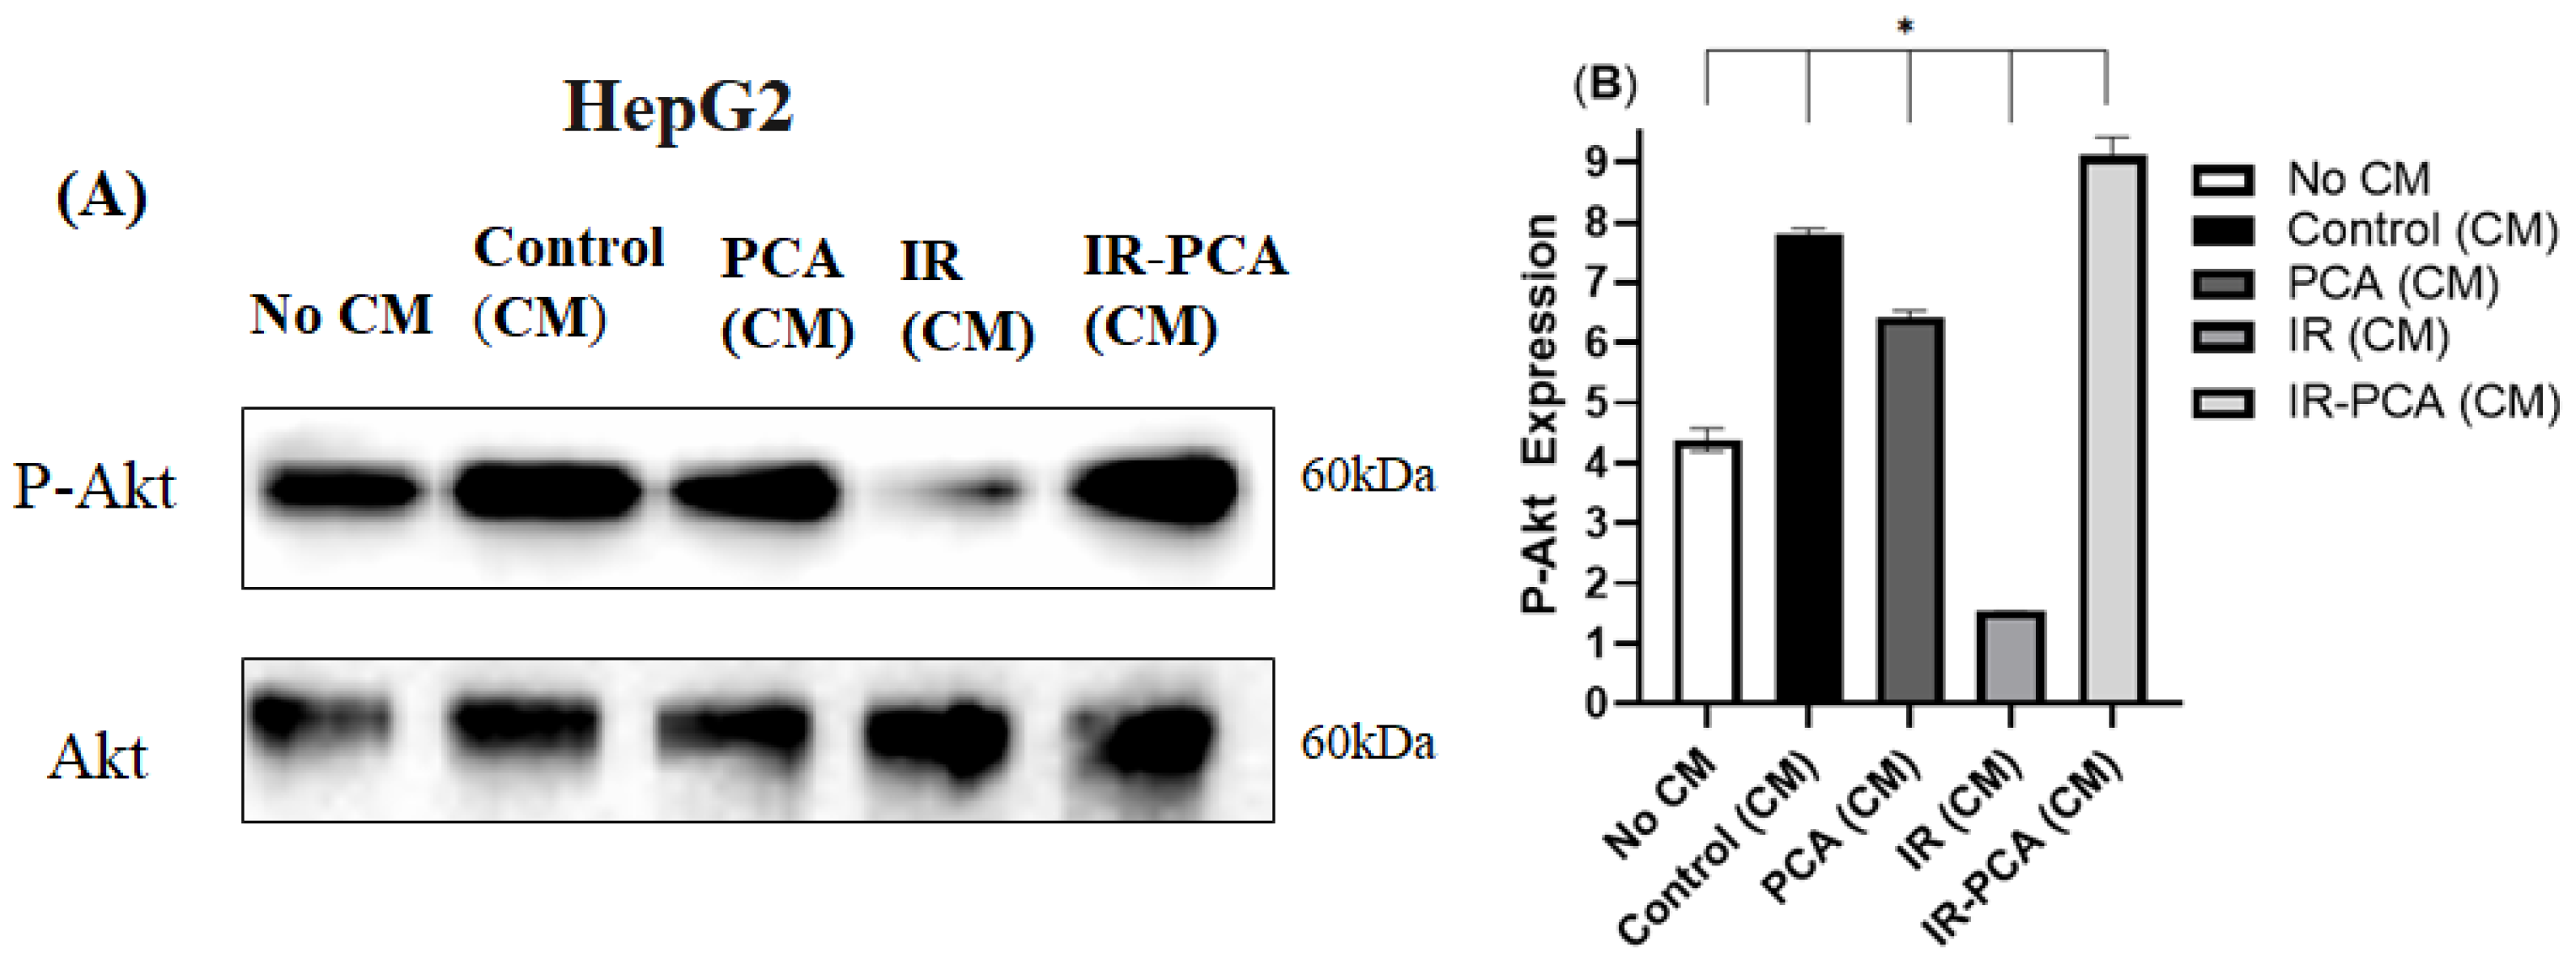
2.8. Effect of Protocatechuic Acid on Insulin Signaling in HepG2 Cells
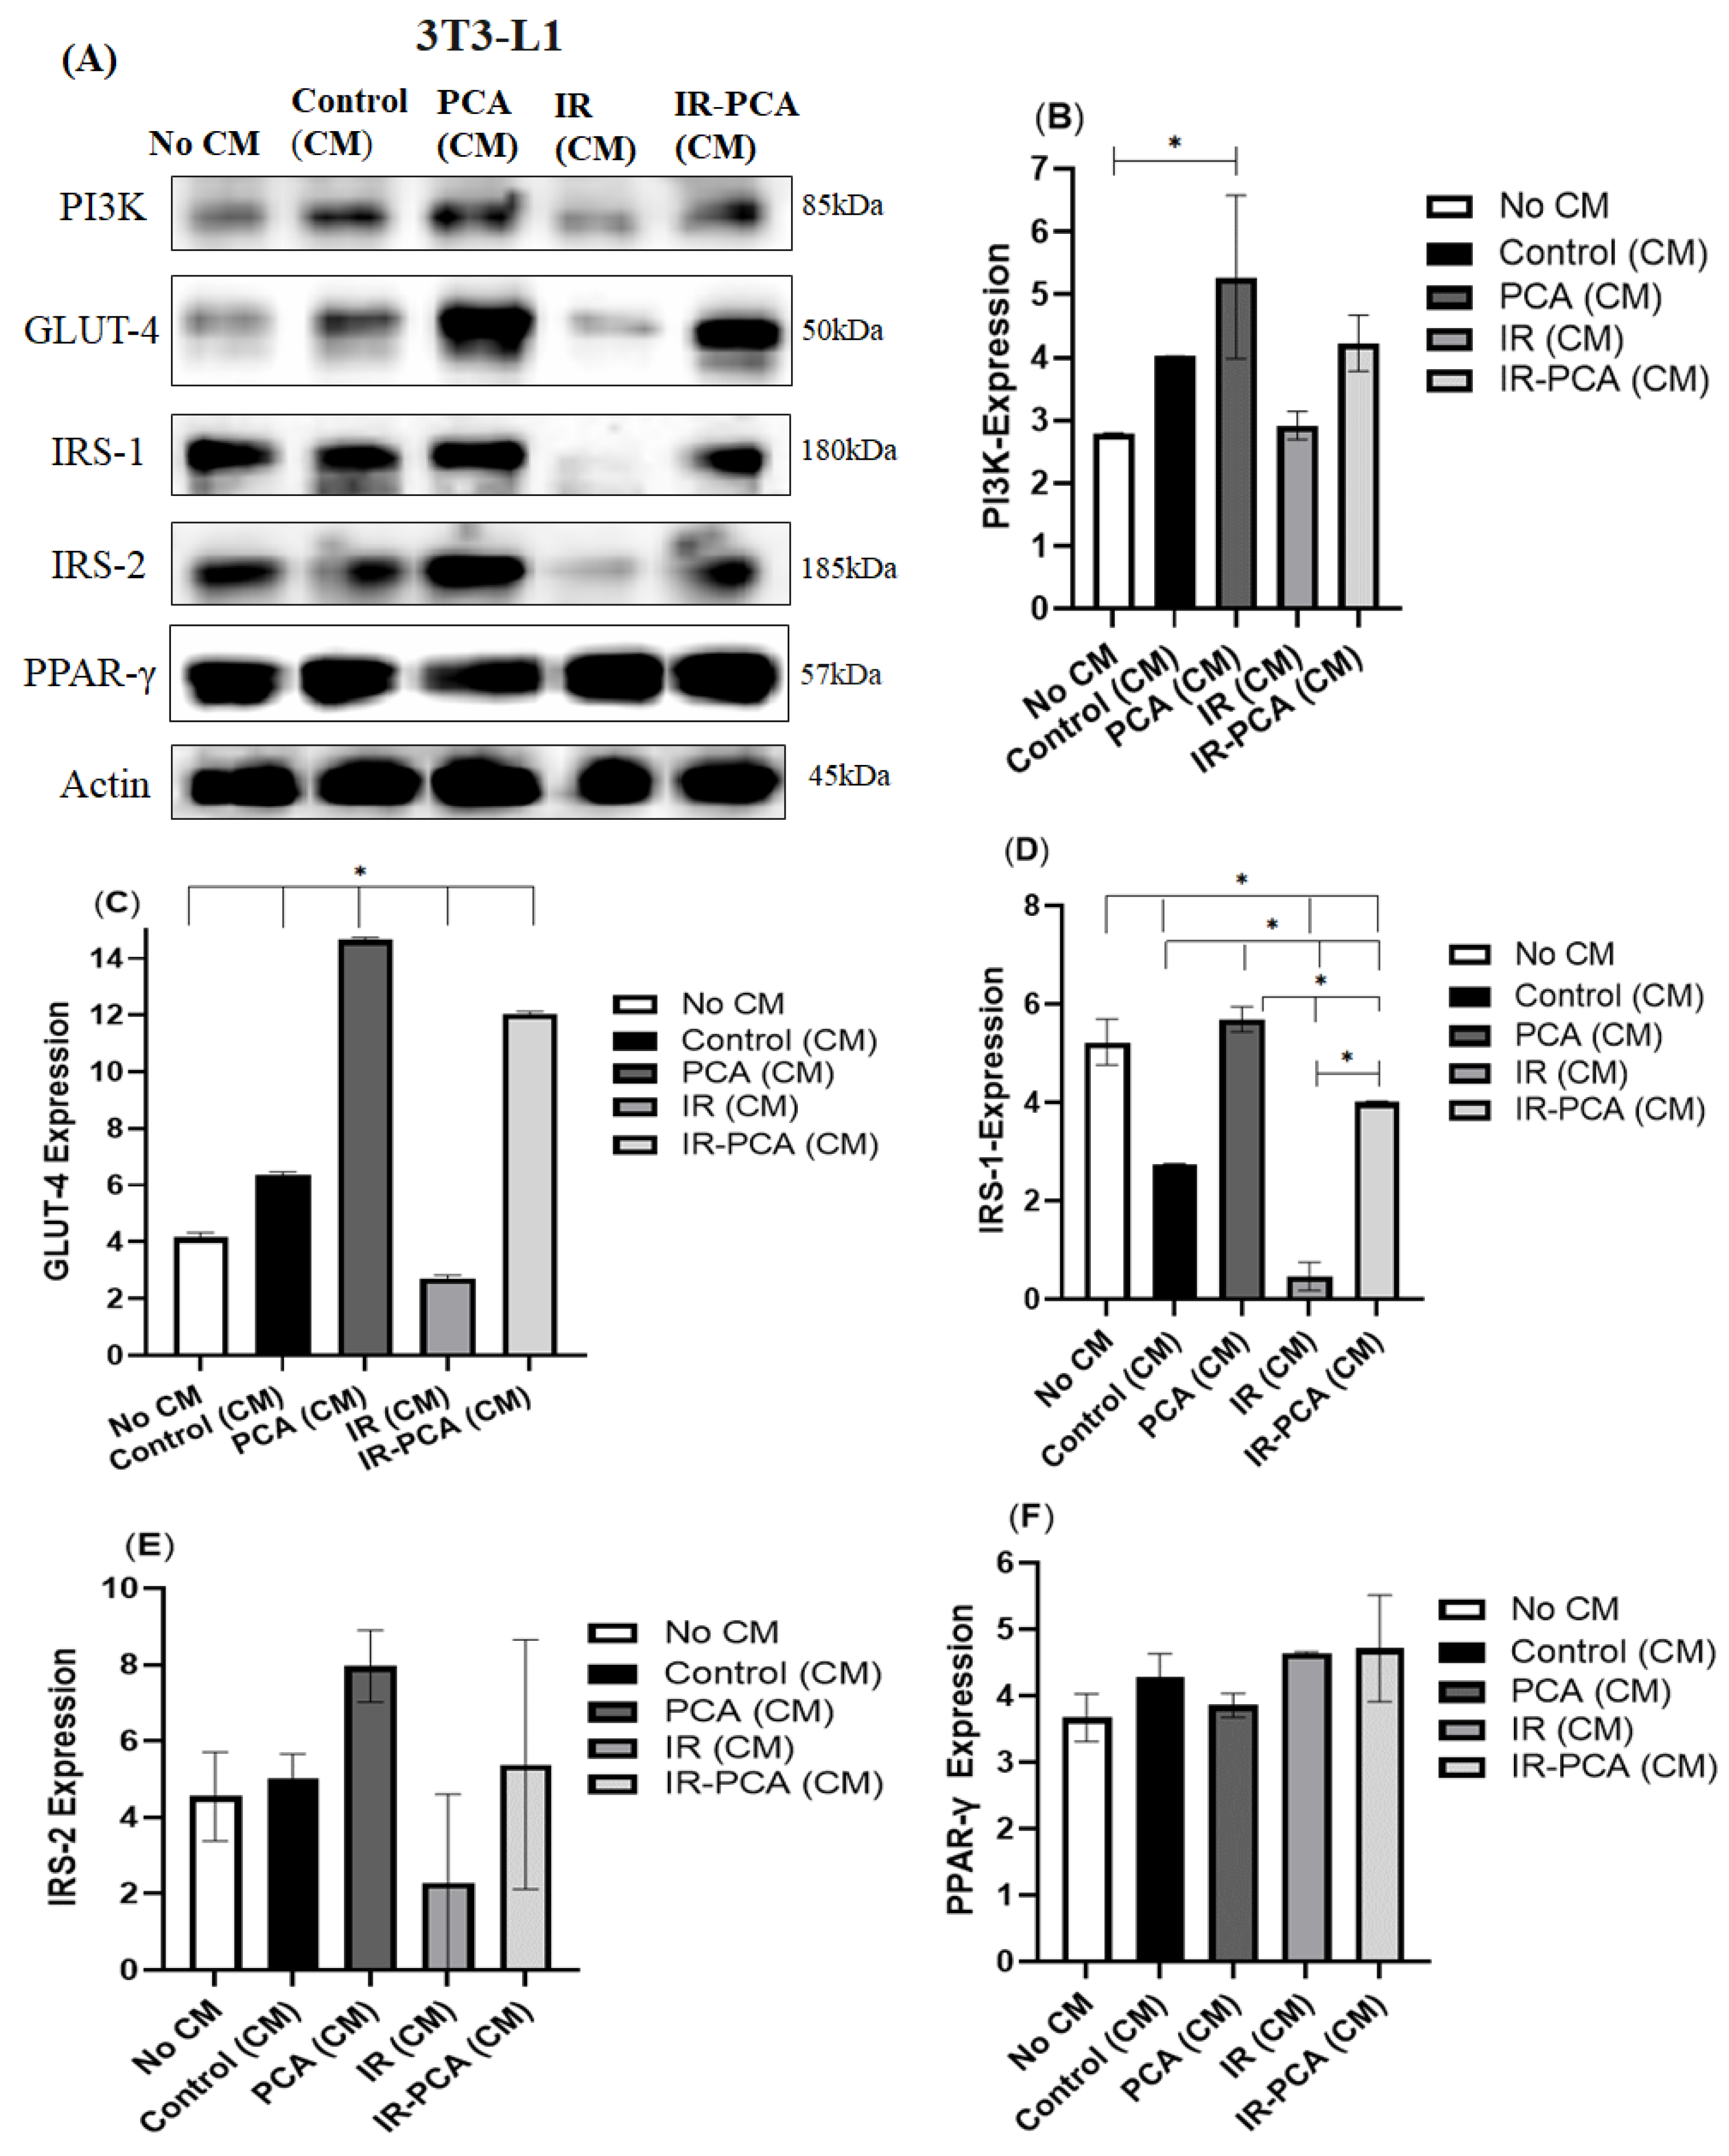
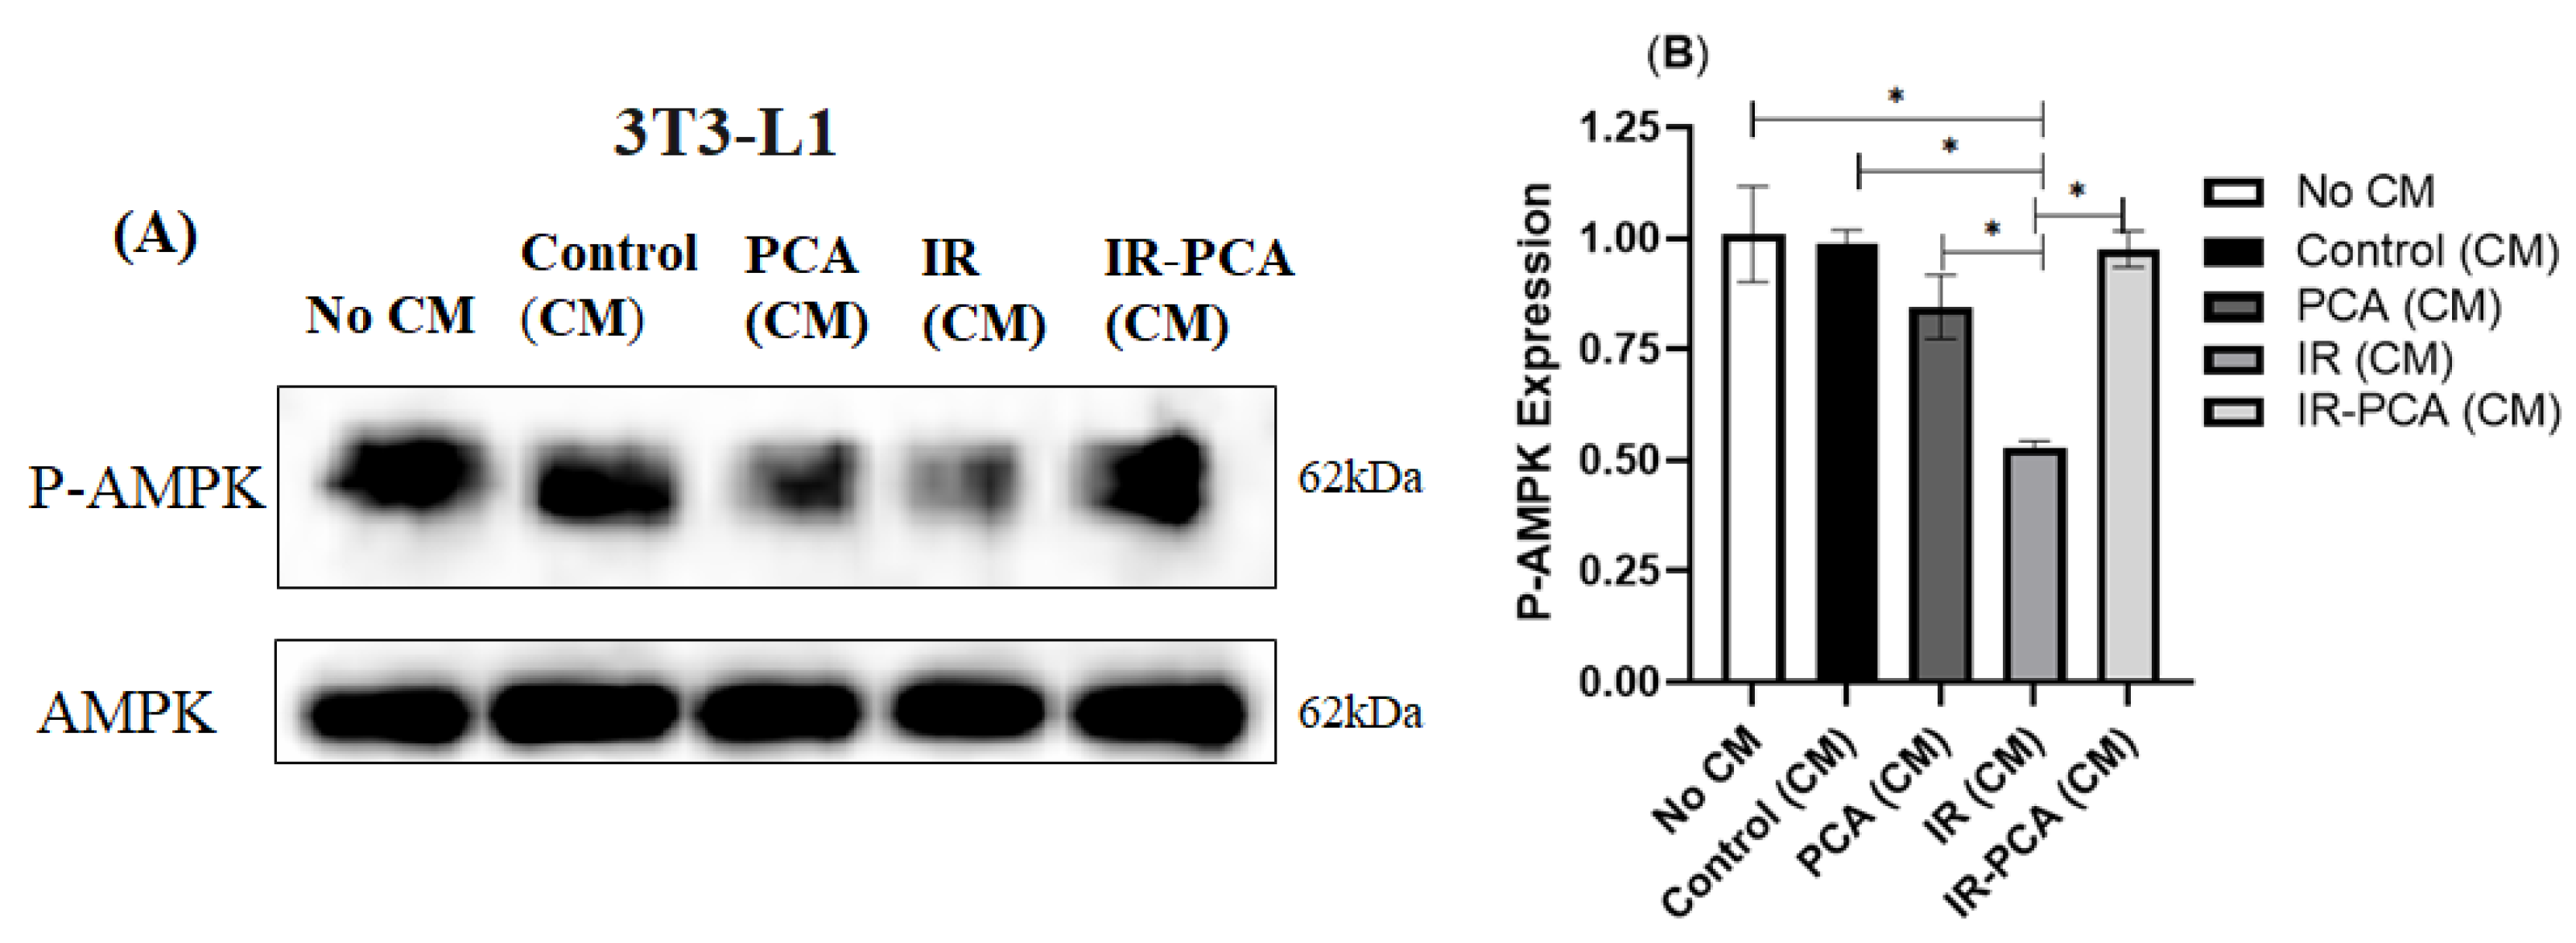
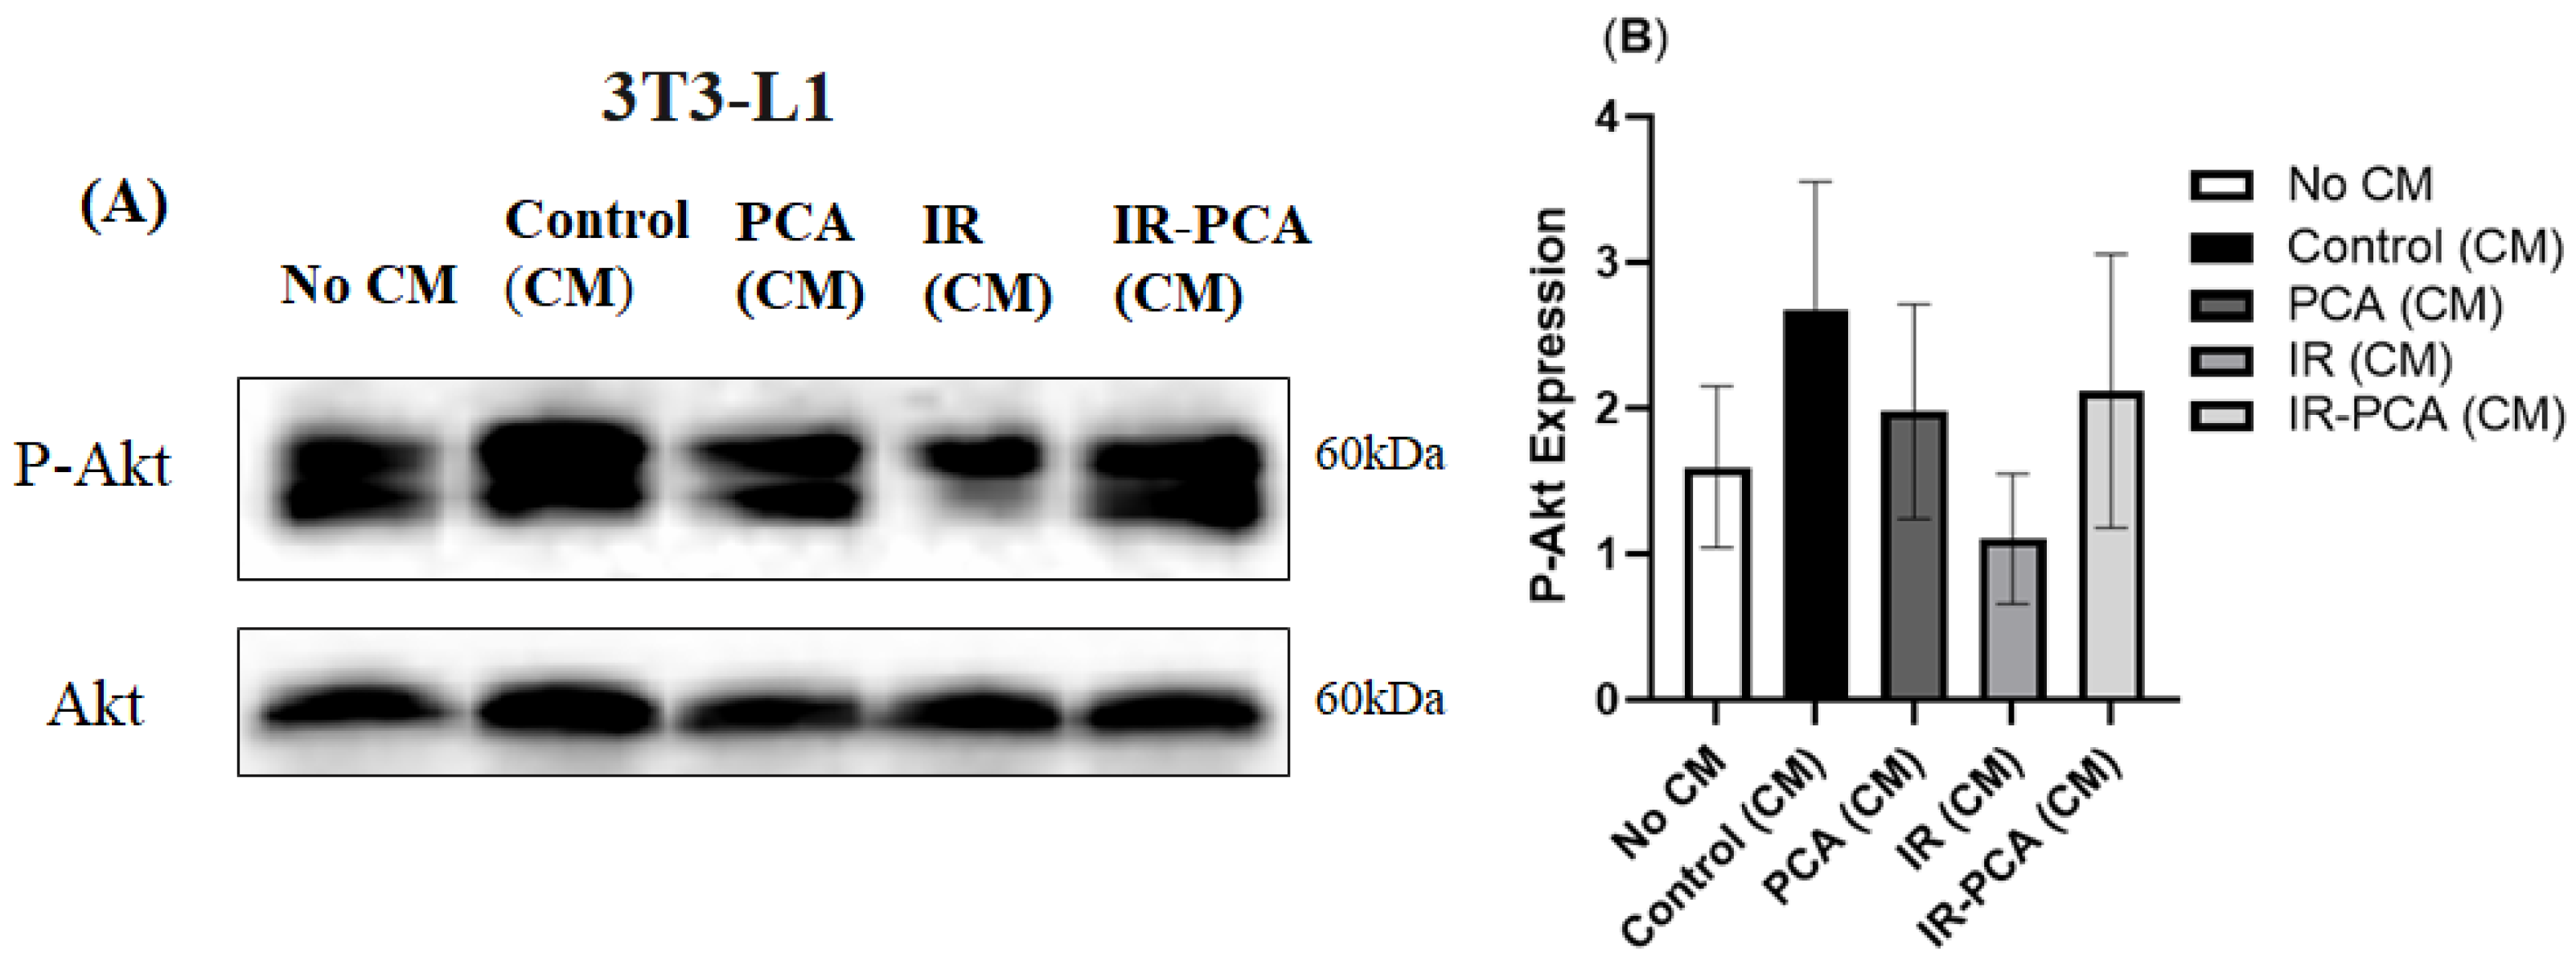
2.9. Effect of Protocatechuic Acid on Insulin Signaling in 3T3-L1 Adipocytes
3. Discussion
4. Materials and Methods
4.1. C2C12 Culture
4.2. HepG2 Liver Cells Culture
4.3. T3-L1 Pre-Adipocytes Culture
4.4. Cell Viability Test
4.5. C2C12 Myotubes Insulin Resistance Model
4.6. PCA Treatment
4.7. Treatment of 3T3-L1 Adipocytes and HepG2 cells with C2C12 Conditioned Media
4.8. Glucose Uptake
4.9. Protein Expression
4.10. Statistical Analysis
5. Conclusions
Author Contributions
Funding
Data Availability Statement
Conflicts of Interest
References
- World Health Organization (WHO). Diabetes; World Health Organization (WHO): Geneva, Switzerland, 2021; Available online: https://www.who.int/news-room/fact-sheets/detail/diabetes (accessed on 13 February 2023).
- Ministry of Health and Prevention. Prevalence of Diabetes; Ministry of Health and Prevention: Dubai, United Arab Emirates, 2021. Available online: https://www.vision2021.ae/en/national-agenda-2021/list/card/prevalence-of-diabetes (accessed on 15 February 2023).
- International Diabetes Federation (IDF). IDF News; International Diabetes Federation (IDF): Brussels, Belgium, 2022; Available online: https://diabetesatlas.org/2022-reports/ (accessed on 5 March 2023).
- Center for Disease Control and Prevention (CDC). Diabetes Quick Facts; Center for Disease Control and Prevention (CDC): Atlanta, GA, USA, 2022.
- Ferrannini, E.; Smith, J.D.; Cobelli, C.; Toffolo, G.; Pilo, A.; DeFronzo, R.A. Effect of insulin on the distribution and disposition of glucose in man. J. Clin. Investig. 1985, 76, 357–364. [Google Scholar] [CrossRef]
- Cersosimo, E.; Triplitt, C.; Solis-Herrera, C.; Mandarino, L.J.; DeFronzo, R.A. Pathogenesis of type 2 diabetes mellitus. Endotext 2015, 12–16. [Google Scholar]
- Honka, M.J.; Latva-Rasku, A.; Bucci, M.; Virtanen, K.A.; Hannukainen, J.C.; Kalliokoski, K.K.; Nuutila, P. Insulin-stimulated glucose uptake in skeletal muscle, adipose tissue and liver: A positron emission tomography study. Eur. J. Endocrinol. 2018, 178, 523–531. [Google Scholar] [CrossRef] [PubMed]
- Oh, K.-J.; Lee, D.S.; Kim, W.K.; Han, B.S.; Lee, S.C.; Bae, K.-H. Metabolic adaptation in obesity and type II diabetes: Myokines, adipokines and hepatokines. Int. J. Mol. Sci. 2017, 18, 8. [Google Scholar] [CrossRef] [PubMed]
- Li, Y.; Li, F.; Lin, B.; Kong, X.; Tang, Y.; Yin, Y. Myokine IL-15 regulates the crosstalk of co-cultured porcine skeletal muscle satellite cells and preadipocytes. Mol. Biol. Rep. 2014, 41, 7543–7553. [Google Scholar] [CrossRef] [PubMed]
- Yang, M.; Wei, D.; Mo, C.; Zhang, J.; Wang, X.; Han, X.; Wang, Z.; Xiao, H. Saturated fatty acid palmitate-induced insulin resistance is accompanied with myotube loss and the impaired expression of health benefit myokine genes in C2C12 myotubes. Lipids Health Dis. 2013, 12, 1–10. [Google Scholar] [CrossRef] [PubMed]
- Garneau, L.; Aguer, C. Role of myokines in the development of skeletal muscle insulin resistance and related metabolic defects in type 2 diabetes. Diabetes Metab. 2019, 45, 505–516. [Google Scholar] [CrossRef]
- Dellagreca, M.; Isidori, M.; Lavorgna, M.; Monaco, P.; Previtera, L.; Zarrelli, A. Bioactivity of phenanthrenes from Juncus acutus on Selenastrum capricornutum. J. Chem. Ecol. 2004, 30, 867–879. [Google Scholar] [CrossRef] [PubMed]
- Aryaeian, N.; Sedehi, S.K.; Arablou, T. Polyphenols and their effects on diabetes management: A review. Med. J. Islam. Repub. Iran 2017, 31, 134. [Google Scholar] [CrossRef]
- Hoggard, N.; Cruickshank, M.; Moar, K.-M.; Bestwick, C.; Holst, J.J.; Russell, W.; Horgan, G. A single supplement of a standardised bilberry (Vaccinium myrtillus L.) extract (36% wet weight anthocyanins) modifies glycaemic response in individuals with type 2 diabetes controlled by diet and lifestyle. J. Nutr. Sci. 2013, 2, e22. [Google Scholar] [CrossRef] [PubMed]
- Takikawa, M.; Inoue, S.; Horio, F.; Tsuda, T. Dietary anthocyanin-rich bilberry extract ameliorates hyperglycemia and insulin sensitivity via activation of AMP-activated protein kinase in diabetic mice. J. Nutr. 2010, 140, 527–533. [Google Scholar] [CrossRef]
- Song, J.; He, Y.; Luo, C.; Feng, B.; Ran, F.; Xu, H.; Ci, Z.; Xu, R.; Han, L.; Zhang, D. New progress in the pharmacology of protocatechuic acid: A compound ingested in daily foods and herbs frequently and heavily. Pharmacol. Res. 2020, 161, 105109. [Google Scholar] [CrossRef]
- Abdelmageed, M.E.; Shehatou, G.S.G.; Suddek, G.M.; Salem, H.A. Protocatechuic acid improves hepatic insulin resistance and restores vascular oxidative status in type-2 diabetic rats. Environ. Toxicol. Pharmacol. 2021, 83, 103577. [Google Scholar] [CrossRef]
- El-Sonbaty, Y.A.; Suddek, G.M.; Megahed, N.; Gameil, N.M. Protocatechuic acid exhibits hepatoprotective, vasculoprotective, antioxidant and insulin-like effects in dexamethasone-induced insulin-resistant rats. Biochimie 2019, 167, 119–134. [Google Scholar] [CrossRef] [PubMed]
- Domínguez-Avila, J.A.; González-Aguilar, G.A.; Alvarez-Parrilla, E.; De la Rosa, L.A. Modulation of PPAR expression and activity in response to polyphenolic compounds in high fat diets. Int. J. Mol. Sci. 2016, 17, 1002. [Google Scholar] [CrossRef]
- Talagavadi, V.; Rapisarda, P.; Galvano, F.; Pelicci, P.; Giorgio, M. Cyanidin-3-O-β-glucoside and protocatechuic acid activate AMPK/mTOR/S6K pathway and improve glucose homeostasis in mice. J. Funct. Foods 2016, 21, 338–348. [Google Scholar] [CrossRef]
- Scazzocchio, B.; Varì, R.; Filesi, C.; D’Archivio, M.; Santangelo, C.; Giovannini, C.; Iacovelli, A.; Silecchia, G.; Volti, G.L.; Galvano, F. Cyanidin-3-O-β-glucoside and protocatechuic acid exert insulin-like effects by upregulating PPARγ activity in human omental adipocytes. Diabetes 2011, 60, 2234–2244. [Google Scholar] [CrossRef]
- Jia, Y.; Wu, C.; Kim, Y.-S.; Yang, S.O.; Kim, Y.; Kim, J.-S.; Jeong, M.-Y.; Lee, J.H.; Kim, B.; Lee, S.; et al. A dietary anthocyanin cyanidin-3-O-glucoside binds to PPARs to regulate glucose metabolism and insulin sensitivity in mice. Commun. Biol. 2020, 3, 514. [Google Scholar] [CrossRef]
- Al-Hariri, M.; Alsunni, A.; Shaikh, M.H.; Gamal Eldin, T.; Al Ghamdi, K.; Alharbi, A.F.; Alhawaj, H.; Chathoth, S. Caffeic Acid Phenethyl Ester reduces Pro Inflammatory Cytokines in Moderate Swimming Test in Growing Rats Model. J. Inflamm. Res. 2021, 14, 5653–5657. [Google Scholar] [CrossRef]
- Masodsai, K.; Lin, Y.-Y.; Chaunchaiyakul, R.; Su, C.-T.; Lee, S.-D.; Yang, A.-L. Twelve-Week Protocatechuic Acid Administration Improves Insulin-Induced and Insulin-Like Growth Factor-1-Induced Vasorelaxation and Antioxidant Activities in Aging Spontaneously Hypertensive Rats. Nutrients 2019, 11, 699. [Google Scholar] [CrossRef]
- Jang, Y.J.; Son, H.J.; Kim, J.-S.; Jung, C.H.; Ahn, J.; Hur, J.; Ha, T.Y. Coffee consumption promotes skeletal muscle hypertrophy and myoblast differentiation. Food Funct. 2018, 9, 1102–1111. [Google Scholar] [CrossRef]
- Balakrishnan, R.; Thurmond, D.C. Mechanisms by Which Skeletal Muscle Myokines Ameliorate Insulin Resistance. Int. J. Mol. Sci. 2022, 23, 4636. [Google Scholar] [CrossRef]
- Park, K.; Ahn, C.W.; Park, J.S.; Kim, Y.; Nam, J.S. Circulating myokine levels in different stages of glucose intolerance. Medicine 2020, 99, e19235. [Google Scholar] [CrossRef] [PubMed]
- Ciaraldi, T.P.; Ryan, A.J.; Mudaliar, S.R.; Henry, R.R. Altered myokine secretion is an intrinsic property of skeletal muscle in type 2 diabetes. PLoS ONE 2016, 11, e0158209. [Google Scholar] [CrossRef]
- Ouchi, N.; Oshima, Y.; Ohashi, K.; Higuchi, A.; Ikegami, C.; Izumiya, Y.; Walsh, K. Follistatin-like 1, a secreted muscle protein, promotes endothelial cell function and revascularization in ischemic tissue through a nitric-oxide synthase-dependent mechanism. J. Biol. Chem. 2008, 283, 32802–32811. [Google Scholar] [CrossRef] [PubMed]
- Lee, H.J.; Lee, J.O.; Lee, Y.W.; Kim, S.A.; Park, S.H.; Kim, H.S. Kalirin, a GEF for Rac1, plays an important role in FSTL-1-mediated glucose uptake in skeletal muscle cells. Cell. Signal. 2017, 29, 150–157. [Google Scholar] [CrossRef]
- Natalicchio, A.; Marrano, N.; Biondi, G.; Spagnuolo, R.; Labarbuta, R.; Porreca, I.; Cignarelli, A.; Bugliani, M.; Marchetti, P.; Perrini, S. The myokine irisin is released in response to saturated fatty acids and promotes pancreatic β-cell survival and insulin secretion. Diabetes 2017, 66, 2849–2856. [Google Scholar] [CrossRef]
- Jung, T.W.; Hwang, H.-J.; Hong, H.C.; Yoo, H.J.; Baik, S.H.; Choi, K.M. BAIBA attenuates insulin resistance and inflammation induced by palmitate or a high fat diet via an AMPK–PPARδ-dependent pathway in mice. Diabetologia 2015, 58, 2096–2105. [Google Scholar] [CrossRef] [PubMed]
- Krolopp, J.E.; Thornton, S.M.; Abbott, M.J. IL-15 activates the Jak3/STAT3 signaling pathway to mediate glucose uptake in skeletal muscle cells. Front. Physiol. 2016, 7, 626. [Google Scholar] [CrossRef] [PubMed]
- Gray, S.R.; Kamolrat, T. The effect of exercise induced cytokines on insulin stimulated glucose transport in C2C12 cells. Cytokine 2011, 55, 221–228. [Google Scholar] [CrossRef]
- Izumiya, Y.; Bina, H.A.; Ouchi, N.; Akasaki, Y.; Kharitonenkov, A.; Walsh, K. FGF21 is an Akt-regulated myokine. FEBS Lett. 2008, 582, 3805–3810. [Google Scholar] [CrossRef] [PubMed]
- Cantley, L.C. The phosphoinositide 3-kinase pathway. Science 2002, 296, 1655–1657. [Google Scholar] [CrossRef]
- Björnholm, M.; Zierath, J.R. Insulin signal transduction in human skeletal muscle: Identifying the defects in Type II diabetes. Biochem. Soc. Trans. 2005, 33, 354–357. [Google Scholar] [CrossRef] [PubMed]
- Chen, L.; Teng, H.; Cao, H. Chlorogenic acid and caffeic acid from Sonchus oleraceus Linn synergistically attenuate insulin resistance and modulate glucose uptake in HepG2 cells. Food Chem. Toxicol. 2019, 127, 182–187. [Google Scholar] [CrossRef]
- Li, D.; Yang, Y.; Sun, L.; Fang, Z.; Chen, L.; Zhao, P.; Wang, Z.; Guo, Y. Effect of young apple (Malus domestica Borkh. cv. Red Fuji) polyphenols on alleviating insulin resistance. Food Biosci. 2020, 36, 100637. [Google Scholar] [CrossRef]
- Chadt, A.; Al-Hasani, H. Glucose transporters in adipose tissue, liver, and skeletal muscle in metabolic health and disease. Pflug. Arch. 2020, 472, 1273–1298. [Google Scholar] [CrossRef]
- Son, M.J.; Minakawa, M.; Miura, Y.; Yagasaki, K. Aspalathin improves hyperglycemia and glucose intolerance in obese diabetic ob/ob mice. Eur. J. Nutr. 2013, 52, 1607–1619. [Google Scholar] [CrossRef]
- Li, H.B.; Yang, Y.R.Y.; Mo, Z.J.; Ding, Y.; Jiang, W.J. Silibinin improves palmitate-induced insulin resistance in C2C12 myotubes by attenuating IRS-1/PI3K/Akt pathway inhibition. Braz. J. Med. Biol. Res. 2015, 48, 440–446. [Google Scholar] [CrossRef]
- Cordero-Herrera, I.; Martín, M.A.; Bravo, L.; Goya, L.; Ramos, S. Cocoa flavonoids improve insulin signalling and modulate glucose production via AKT and AMPK in H ep G 2 cells. Mol. Nnutrition Food Res. 2013, 57, 974–985. [Google Scholar] [CrossRef] [PubMed]
- Montagut, G.; Onnockx, S.; Vaqué, M.; Bladé, C.; Blay, M.; Fernández-Larrea, J.; Pujadas, G.; Salvadó, M.J.; Arola, L.; Pirson, I. Oligomers of grape-seed procyanidin extract activate the insulin receptor and key targets of the insulin signaling pathway differently from insulin. J. Nutr. Biochem. 2010, 21, 476–481. [Google Scholar] [CrossRef]
- Sharma, A.K.; Bharti, S.; Goyal, S.; Arora, S.; Nepal, S.; Kishore, K.; Joshi, S.; Kumari, S.; Arya, D.S. Upregulation of PPARγ by Aegle marmelos ameliorates insulin resistance and β-cell dysfunction in high fat diet fed-streptozotocin induced type 2 diabetic rats. Phytother. Res. 2011, 25, 1457–1465. [Google Scholar] [CrossRef]
- Prabhakar, P.K.; Doble, M. Synergistic effect of phytochemicals in combination with hypoglycemic drugs on glucose uptake in myotubes. Phytomedicine 2009, 16, 1119–1126. [Google Scholar] [CrossRef] [PubMed]
- Pujimulyani, D.; Yulianto, W.A.; Setyowati, A.; Arumwardana, S.; Sari Widya Kusuma, H.; Adhani Sholihah, I.; Rizal, R.; Widowati, W.; Maruf, A. Hypoglycemic activity of Curcuma mangga val. extract via modulation of GLUT4 and PPAR-γ mRNA expression in 3T3-L1 Adipocytes. J. Exp. Pharmacol. 2020, 2020, 363–369. [Google Scholar] [CrossRef]
- Zhao, Y.; Li, N.; Li, Z.; Zhang, D.; Chen, L.; Yao, Z.; Niu, W. Conditioned medium from contracting skeletal muscle cells reverses insulin resistance and dysfunction of endothelial cells. Metabolism 2018, 82, 36–46. [Google Scholar] [CrossRef] [PubMed]
- Yoon, H.J.; Bang, M.-H.; Kim, H.; Imm, J.-Y. Improvement of palmitate-induced insulin resistance in C2C12 skeletal muscle cells using Platycodon grandiflorum seed extracts. Food Biosci. 2018, 25, 61–67. [Google Scholar] [CrossRef]
- Huang, Q.; Chen, L.; Teng, H.; Song, H.; Wu, X.; Xu, M. Phenolic compounds ameliorate the glucose uptake in HepG2 cells’ insulin resistance via activating AMPK: Anti-diabetic effect of phenolic compounds in HepG2 cells. J. Funct. Foods 2015, 19, 487–494. [Google Scholar] [CrossRef]
- Alessi, D.R.; Cohen, P. Mechanism of activation and function of protein kinase B. Curr. Opin. Genet. Dev. 1998, 8, 55–62. [Google Scholar] [CrossRef]
- Dai, X.; Ding, Y.; Zhang, Z.; Cai, X.; Bao, L.; Li, Y. Quercetin but not quercitrin ameliorates tumor necrosis factor-alpha-induced insulin resistance in C2C12 skeletal muscle cells. Biol. Pharm. Bull. 2013, 36, 788–795. [Google Scholar] [CrossRef]
- Peng, Y.; Sun, Q.; Park, Y. Chicoric acid promotes glucose uptake and Akt phosphorylation via AMP-activated protein kinase α-dependent pathway. J. Funct. Foods 2019, 59, 8–15. [Google Scholar] [CrossRef]
- Kang, W.; Hong, H.J.; Guan, J.; Kim, D.G.; Yang, E.-J.; Koh, G.; Park, D.; Han, C.H.; Lee, Y.-J.; Lee, D.-H. Resveratrol improves insulin signaling in a tissue-specific manner under insulin-resistant conditions only: In vitro and in vivo experiments in rodents. Metabolism 2012, 61, 424–433. [Google Scholar] [CrossRef]
- Park, J.-Y.; Kim, Y.; Im, J.; Lee, H. Oligonol suppresses lipid accumulation and improves insulin resistance in a palmitate-induced in HepG2 hepatocytes as a cellular steatosis model. BMC Complement. Altern. Med. 2015, 15, 1–13. [Google Scholar] [CrossRef]
- Watt, M.J.; Steinberg, G.R.; Chen, Z.P.; Kemp, B.E.; Febbraio, M.A. Fatty acids stimulate AMP-activated protein kinase and enhance fatty acid oxidation in L6 myotubes. J. Physiol. 2006, 574, 139–147. [Google Scholar] [CrossRef]
- Zhao, N.-Q.; Li, X.-Y.; Wang, L.; Feng, Z.-L.; Li, X.-F.; Wen, Y.-F.; Han, J.-X. Palmitate induces fat accumulation by activating C/EBPβ-mediated G0S2 expression in HepG2 cells. World J. Gastroenterol. 2017, 23, 7705. [Google Scholar] [CrossRef]
- Mazibuko-Mbeje, S.E.; Dludla, P.V.; Roux, C.; Johnson, R.; Ghoor, S.; Joubert, E.; Louw, J.; Opoku, A.R.; Muller, C.J.F. Aspalathin-Enriched Green Rooibos Extract Reduces Hepatic Insulin Resistance by Modulating PI3K/AKT and AMPK Pathways. Int. J. Mol. Sci. 2019, 20, 633. [Google Scholar] [CrossRef]
- Peppler, W.T.; Townsend, L.K.; Meers, G.M.; Panasevich, M.R.; MacPherson, R.E.K.; Rector, R.S.; Wright, D.C. Acute administration of IL-6 improves indices of hepatic glucose and insulin homeostasis in lean and obese mice. Am. J. Physiol. -Gastrointest. Liver Physiol. 2019, 316, G166–G178. [Google Scholar] [CrossRef]
- Pedersen, B.K.; Febbraio, M.A. Muscle as an endocrine organ: Focus on muscle-derived interleukin-6. Physiol. Rev. 2008, 8, 1379–1406. [Google Scholar] [CrossRef] [PubMed]
- Argilés, J.M.; López-Soriano, J.; Almendro, V.; Busquets, S.; López-Soriano, F.J. Cross-talk between skeletal muscle and adipose tissue: A link with obesity? Med. Res. Rev. 2005, 25, 49–65. [Google Scholar] [CrossRef]
- Gong, Q.; Hu, Z.; Zhang, F.; Cui, A.; Chen, X.; Jiang, H.; Gao, J.; Chen, X.; Han, Y.; Liang, Q. Fibroblast growth factor 21 improves hepatic insulin sensitivity by inhibiting mammalian target of rapamycin complex 1 in mice. Hepatology 2016, 64, 425–438. [Google Scholar] [CrossRef]
- Liu, X.H.; Pan, J.P.; Bauman, W.A.; Cardozo, C.P. AdipoRon prevents myostatin-induced upregulation of fatty acid synthesis and downregulation of insulin activity in a mouse hepatocyte line. Physiol. Rep. 2019, 7, e14152. [Google Scholar] [CrossRef] [PubMed]
- Zou, T.; Li, S.; Wang, B.; Wang, Z.; Liu, Y.; You, J. Curcumin improves insulin sensitivity and increases energy expenditure in high-fat-diet–induced obese mice associated with activation of FNDC5/irisin. Nutrition 2021, 90, 111263. [Google Scholar] [CrossRef] [PubMed]
- Kim, O.Y.; Chung, J.Y.; Song, J. Effect of resveratrol on adipokines and myokines involved in fat browning: Perspectives in healthy weight against obesity. Pharmacol. Res. 2019, 148, 104411. [Google Scholar] [CrossRef]
- Gauze-Gnagne, C.; Raynaud, F.; Djohan, Y.F.; Lauret, C.; Feillet-Coudray, C.; Coudray, C.; Monde, A.; Koffi, G.; Morena, M.; Camara-Cisse, M. Impact of diets rich in olive oil, palm oil or lard on myokine expression in rats. Food Funct. 2020, 11, 9114–9128. [Google Scholar] [CrossRef]
- Senesi, P.; Luzi, L.; Terruzzi, I. Adipokines, Myokines, and Cardiokines: The Role of Nutritional Interventions. Int. J. Mol. Sci. 2020, 21, 8372. [Google Scholar] [CrossRef]


Disclaimer/Publisher’s Note: The statements, opinions and data contained in all publications are solely those of the individual author(s) and contributor(s) and not of MDPI and/or the editor(s). MDPI and/or the editor(s) disclaim responsibility for any injury to people or property resulting from any ideas, methods, instructions or products referred to in the content. |
© 2023 by the authors. Licensee MDPI, Basel, Switzerland. This article is an open access article distributed under the terms and conditions of the Creative Commons Attribution (CC BY) license (https://creativecommons.org/licenses/by/4.0/).
Share and Cite
Shakoor, H.; Hussein, H.; Al-Hassan, N.; Alketbi, M.; Kizhakkayil, J.; Platat, C. The Muscle-Conditioned Medium Containing Protocatechuic Acid Improves Insulin Resistance by Modulating Muscle Communication with Liver and Adipose Tissue. Int. J. Mol. Sci. 2023, 24, 9490. https://doi.org/10.3390/ijms24119490
Shakoor H, Hussein H, Al-Hassan N, Alketbi M, Kizhakkayil J, Platat C. The Muscle-Conditioned Medium Containing Protocatechuic Acid Improves Insulin Resistance by Modulating Muscle Communication with Liver and Adipose Tissue. International Journal of Molecular Sciences. 2023; 24(11):9490. https://doi.org/10.3390/ijms24119490
Chicago/Turabian StyleShakoor, Hira, Haneen Hussein, Nour Al-Hassan, Mouza Alketbi, Jaleel Kizhakkayil, and Carine Platat. 2023. "The Muscle-Conditioned Medium Containing Protocatechuic Acid Improves Insulin Resistance by Modulating Muscle Communication with Liver and Adipose Tissue" International Journal of Molecular Sciences 24, no. 11: 9490. https://doi.org/10.3390/ijms24119490