
Gene Expression Analysis in gla-Mutant Zebrafish Reveals Enhanced Ca2+ Signaling Similar to Fabry Disease
 , , , , , , and
Abstract
:1. Introduction
2. Results
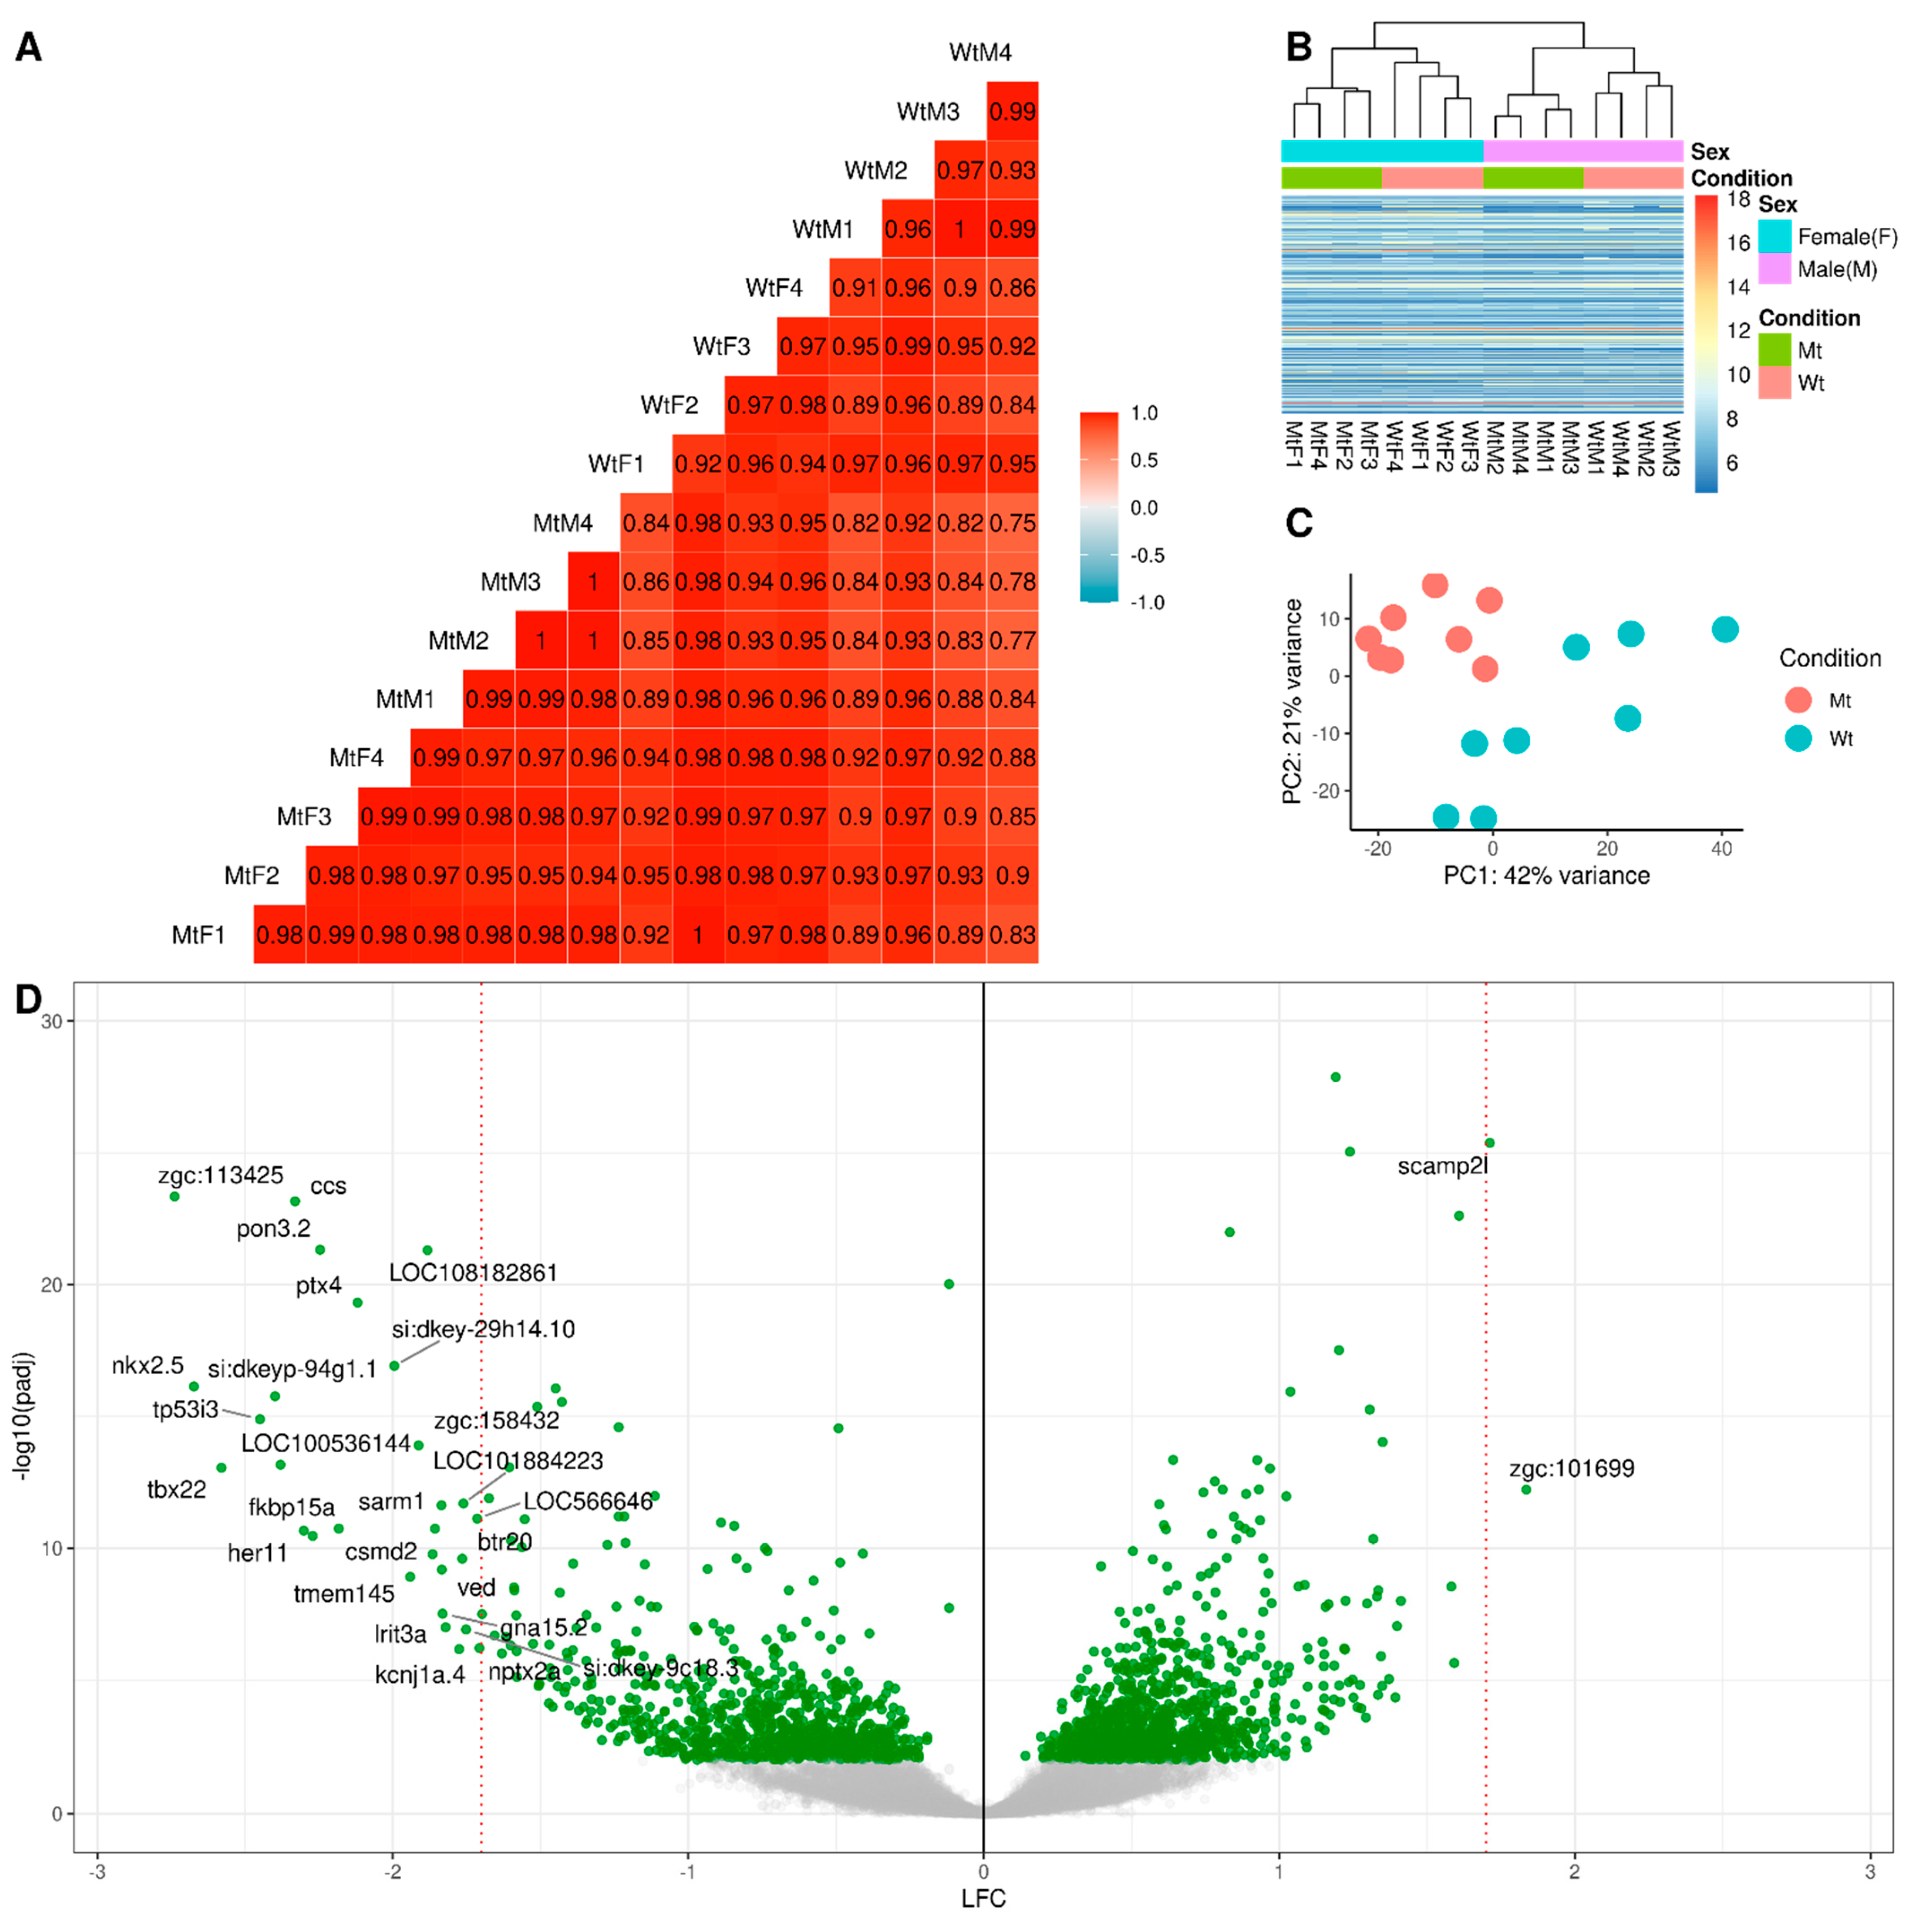
2.1. RNA Sequencing
2.2. Differential Gene Expression Analysis
2.3. Validation by Immunohistochemistry and Western Blot
3. Discussion
4. Materials and Methods
4.1. Ethical Approval
4.2. Zebrafish Maintenance and Sample Collection
4.3. RNA Extraction and Sequencing
4.4. RNA Sequences Analysis
4.5. Immunohistochemistry
4.6. Western Blot
Author Contributions
Funding
Institutional Review Board Statement
Informed Consent Statement
Data Availability Statement
Acknowledgments
Conflicts of Interest
References
- Germain, D.P. Fabry disease. Orphanet. J. Rare Dis. 2010, 5, 30. [Google Scholar] [CrossRef] [PubMed] [Green Version]
- Tondel, C.; Bostad, L.; Hirth, A.; Svarstad, E. Renal biopsy findings in children and adolescents with Fabry disease and minimal albuminuria. Am. J. Kidney Dis. 2008, 51, 767–776. [Google Scholar] [CrossRef] [PubMed]
- Smid, B.E.; van der Tol, L.; Cecchi, F.; Elliott, P.M.; Hughes, D.A.; Linthorst, G.E.; Timmermans, J.; Weidemann, F.; West, M.L.; Biegstraaten, M.; et al. Uncertain diagnosis of Fabry disease: Consensus recommendation on diagnosis in adults with left ventricular hypertrophy and genetic variants of unknown significance. Int. J. Cardiol. 2014, 177, 400–408. [Google Scholar] [CrossRef] [PubMed]
- Carnicer-Caceres, C.; Arranz-Amo, J.A.; Cea-Arestin, C.; Camprodon-Gomez, M.; Moreno-Martinez, D.; Lucas-Del-Pozo, S.; Molto-Abad, M.; Tigri-Santina, A.; Agraz-Pamplona, I.; Rodriguez-Palomares, J.F.; et al. Biomarkers in Fabry Disease. Implications for clinical diagnosis and follow-up. J. Clin. Med. 2021, 10, 1664. [Google Scholar] [CrossRef]
- Rubino, M.; Monda, E.; Lioncino, M.; Caiazza, M.; Palmiero, G.; Dongiglio, F.; Fusco, A.; Cirillo, A.; Cesaro, A.; Capodicasa, L.; et al. Diagnosis and management of cardiovascular involvement in fabry disease. Heart Fail Clin. 2022, 18, 39–49. [Google Scholar] [CrossRef]
- Najafian, B.; Tondel, C.; Svarstad, E.; Gubler, M.C.; Oliveira, J.P.; Mauer, M. Accumulation of globotriaosylceramide in podocytes in fabry nephropathy is associated with progressive podocyte loss. J. Am. Soc. Nephrol. 2020, 31, 865–875. [Google Scholar] [CrossRef]
- Silva, C.A.B.; Moura-Neto, J.A.; Dos Reis, M.A.; Vieira Neto, O.M.; Barreto, F.C. Renal manifestations of fabry disease: A narrative review. Can. J. Kidney Health Dis. 2021, 8, 2054358120985627. [Google Scholar] [CrossRef]
- Svarstad, E.; Marti, H.P. The changing landscape of fabry disease. Clin. J. Am. Soc. Nephrol. 2020, 15, 569–576. [Google Scholar] [CrossRef]
- Tondel, C.; Bostad, L.; Larsen, K.K.; Hirth, A.; Vikse, B.E.; Houge, G.; Svarstad, E. Agalsidase benefits renal histology in young patients with Fabry disease. J. Am. Soc. Nephrol. 2013, 24, 137–148. [Google Scholar] [CrossRef] [Green Version]
- van der Veen, S.J.; Korver, S.; Hirsch, A.; Hollak, C.E.M.; Wijburg, F.A.; Brands, M.M.; Tondel, C.; van Kuilenburg, A.B.P.; Langeveld, M. Early start of enzyme replacement therapy in pediatric male patients with classical Fabry disease is associated with attenuated disease progression. Mol. Genet. Metab. 2022, 135, 163–169. [Google Scholar] [CrossRef]
- Nowak, A.; Beuschlein, F.; Sivasubramaniam, V.; Kasper, D.; Warnock, D.G. Lyso-Gb3 associates with adverse long-term outcome in patients with Fabry disease. J. Med. Genet. 2022, 59, 287–293. [Google Scholar] [CrossRef]
- Sanchez-Nino, M.D.; Carpio, D.; Sanz, A.B.; Ruiz-Ortega, M.; Mezzano, S.; Ortiz, A. Lyso-Gb3 activates Notch1 in human podocytes. Hum. Mol. Genet. 2015, 24, 5720–5732. [Google Scholar] [CrossRef] [PubMed] [Green Version]
- Effraimidis, G.; Feldt-Rasmussen, U.; Rasmussen, A.K.; Lavoie, P.; Abaoui, M.; Boutin, M.; Auray-Blais, C. Globotriaosylsphingosine (lyso-Gb3) and analogues in plasma and urine of patients with Fabry disease and correlations with long-term treatment and genotypes in a nationwide female Danish cohort. J. Med. Genet. 2021, 58, 692–700. [Google Scholar] [CrossRef] [PubMed]
- Azevedo, O.; Cordeiro, F.; Gago, M.F.; Miltenberger-Miltenyi, G.; Ferreira, C.; Sousa, N.; Cunha, D. Fabry Disease and the Heart: A Comprehensive Review. Int. J. Mol. Sci. 2021, 22, 4434. [Google Scholar] [CrossRef] [PubMed]
- Bichet, D.G.; Aerts, J.M.; Auray-Blais, C.; Maruyama, H.; Mehta, A.B.; Skuban, N.; Krusinska, E.; Schiffmann, R. Assessment of plasma lyso-Gb3 for clinical monitoring of treatment response in migalastat-treated patients with Fabry disease. Genet. Med. 2021, 23, 192–201. [Google Scholar] [CrossRef]
- Liu, H.C.; Lin, H.Y.; Yang, C.F.; Liao, H.C.; Hsu, T.R.; Lo, C.W.; Chang, F.P.; Huang, C.K.; Lu, Y.H.; Lin, S.P.; et al. Globotriaosylsphingosine (lyso-Gb3) might not be a reliable marker for monitoring the long-term therapeutic outcomes of enzyme replacement therapy for late-onset Fabry patients with the Chinese hotspot mutation (IVS4+919G>A). Orphanet. J. Rare Dis. 2014, 9, 111. [Google Scholar] [CrossRef] [Green Version]
- Smid, B.E.; van der Tol, L.; Biegstraaten, M.; Linthorst, G.E.; Hollak, C.E.; Poorthuis, B.J. Plasma globotriaosylsphingosine in relation to phenotypes of Fabry disease. J. Med. Genet. 2015, 52, 262–268. [Google Scholar] [CrossRef]
- Shen, J.S.; Meng, X.L.; Moore, D.F.; Quirk, J.M.; Shayman, J.A.; Schiffmann, R.; Kaneski, C.R. Globotriaosylceramide induces oxidative stress and up-regulates cell adhesion molecule expression in Fabry disease endothelial cells. Mol. Genet. Metab. 2008, 95, 163–168. [Google Scholar] [CrossRef] [Green Version]
- Liebau, M.C.; Braun, F.; Hopker, K.; Weitbrecht, C.; Bartels, V.; Muller, R.U.; Brodesser, S.; Saleem, M.A.; Benzing, T.; Schermer, B.; et al. Dysregulated autophagy contributes to podocyte damage in Fabry’s disease. PLoS ONE 2013, 8, e63506. [Google Scholar] [CrossRef] [Green Version]
- Elsaid, H.O.A.; Furriol, J.; Blomqvist, M.; Diswall, M.; Leh, S.; Gharbi, N.; Anonsen, J.H.; Babickova, J.; Tondel, C.; Svarstad, E.; et al. Reduced alpha-galactosidase A activity in zebrafish (Danio rerio) mirrors distinct features of Fabry nephropathy phenotype. Mol. Genet. Metab. Rep. 2022, 31, 100851. [Google Scholar] [CrossRef]
- Levstek, T.; Vujkovac, B.; Trebusak Podkrajsek, K. Biomarkers of fabry nephropathy: Review and future perspective. Genes 2020, 11, 1091. [Google Scholar] [CrossRef] [PubMed]
- Read, A.; Schroder, M. The unfolded protein response: An overview. Biology 2021, 10, 384. [Google Scholar] [CrossRef] [PubMed]
- Živná, M.; Dostálová, G.; Barešová, V.; Mušálková, D.; Kuchař, L.; Asfaw, B.; Poupětová, H.; Vlášková, H.; Kmochová, T.; Vyletal, P.; et al. AGAL misprocessing-induced ER stress and the unfolded protein response: Lysosomal storage-independent mechanism of Fabry disease pathogenesis? bioRxiv 2022. [Google Scholar] [CrossRef]
- Consolato, F.; De Fusco, M.; Schaeffer, C.; Pieruzzi, F.; Scolari, F.; Gallieni, M.; Lanzani, C.; Feriozzi, S.; Rampoldi, L. α-Gal A missense variants associated with Fabry disease can lead to ER stress and induction of the unfolded protein response. Mol. Genet. Metab. Rep. 2022, 33, 100926. [Google Scholar] [CrossRef]
- Mauhin, W.; Lidove, O.; Masat, E.; Mingozzi, F.; Mariampillai, K.; Ziza, J.M.; Benveniste, O. Innate and Adaptive Immune Response in Fabry Disease. JIMD Rep. 2015, 22, 1–10. [Google Scholar]
- Rigante, D.; Cipolla, C.; Basile, U.; Gulli, F.; Savastano, M.C. Overview of immune abnormalities in lysosomal storage disorders. Immunol. Lett. 2017, 188, 79–85. [Google Scholar] [CrossRef] [PubMed]
- De Francesco, P.N.; Mucci, J.M.; Ceci, R.; Fossati, C.A.; Rozenfeld, P.A. Fabry disease peripheral blood immune cells release inflammatory cytokines: Role of globotriaosylceramide. Mol. Genet. Metab. 2013, 109, 93–99. [Google Scholar] [CrossRef]
- Pereira, C.S.; Pérez-Cabezas, B.; Ribeiro, H.; Maia, M.L.; Cardoso, M.T.; Dias, A.F.; Azevedo, O.; Ferreira, M.F.; Garcia, P.; Rodrigues, E.; et al. Lipid antigen presentation by CD1b and CD1d in lysosomal storage disease patients. Front. Immunol. 2019, 10, 1264. [Google Scholar] [CrossRef]
- Langenau, D.M.; Zon, L.I. The zebrafish: A new model of T-cell and thymic development. Nat. Rev. Immunol. 2005, 5, 307–317. [Google Scholar] [CrossRef]
- Lewis, K.L.; Del Cid, N.; Traver, D. Perspectives on antigen presenting cells in zebrafish. Dev. Comp. Immunol. 2014, 46, 63–73. [Google Scholar] [CrossRef] [Green Version]
- Matafora, V.; Cuccurullo, M.; Beneduci, A.; Petrazzuolo, O.; Simeone, A.; Anastasio, P.; Mignani, R.; Feriozzi, S.; Pisani, A.; Comotti, C.; et al. Early markers of Fabry disease revealed by proteomics. Mol. Biosyst. 2015, 11, 1543–1551. [Google Scholar] [CrossRef] [PubMed]
- Rozenfeld, P.; Feriozzi, S. Contribution of inflammatory pathways to Fabry disease pathogenesis. Mol. Genet. Metab. 2017, 122, 19–27. [Google Scholar] [CrossRef] [PubMed]
- van Eijk, M.; Ferraz, M.J.; Boot, R.G.; Aerts, J. Lyso-glycosphingolipids: Presence and consequences. Essays Biochem. 2020, 64, 565–578. [Google Scholar]
- Khan, M.I.; Hariprasad, G. Human secretary phospholipase A2 mutations and their clinical implications. J. Inflamm. Res. 2020, 13, 551–561. [Google Scholar] [CrossRef] [PubMed]
- Sun, G.Y.; Shelat, P.B.; Jensen, M.B.; He, Y.; Sun, A.Y.; Simonyi, A. Phospholipases A2 and inflammatory responses in the central nervous system. Neuromolecular Med. 2010, 12, 133–148. [Google Scholar] [CrossRef] [Green Version]
- Eikrem, O.; Delaleu, N.; Strauss, P.; Sekulic, M.; Tøndel, C.; Leh, S.; Svarstad, E.; Skrunes, R.; Nowak, A.; Rusu, E.E.; et al. Systems analyses of renal fabry transcriptome and response to enzyme replacement therapy (ERT) identifies a cross-validated and druggable ERT-resistant module (Abstract, ASN, Kidney Week). J. Am. Soc. Nephrol. 2020, 31, 510. [Google Scholar]
- Strauss, P.; Eikrem, Ø.; Tøndel, C.; Svarstad, E.; Scherer, A.; Leh, S.; Flatberg, A.; Delaleu, N.; Koch, E.; Beisvag, V.; et al. Fabry Nephropathy: First mRNA-Seq findings from kidney biopsies before and after enzyme replacement therapy (Abstract, 6th update on fabry disease: Biomarkers, progression and treatment opportunities). Nephron 2019, 142, 169. [Google Scholar]
- Eikrem, O.; Strauss, P.; Sekulic, M.; Tøndel, C.; Flatberg, A.; Skrunes, R.; Landolt, L.; Babickova, J.; Leh, S.; Scherer, A.; et al. Fabry Nephropathy: Transcriptome Sequencing of Microdissected Renal Compartments from Archival Kidney Biopsies at Baseline, and After 5 and 10 Years of Enzyme Replacement Therapy (Abstract, ASN, Kidney Week). J. Am. Soc. Nephrol. 2018, 29, 310. [Google Scholar]
- Heo, S.H.; Kang, E.; Kim, Y.M.; Go, H.; Kim, K.Y.; Jung, J.Y.; Kang, M.; Kim, G.H.; Kim, J.M.; Choi, I.H.; et al. Fabry disease: Characterisation of the plasma proteome pre- and post-enzyme replacement therapy. J. Med. Genet. 2017, 54, 771–780. [Google Scholar] [CrossRef] [Green Version]
- Braun, F.; Blomberg, L.; Brodesser, S.; Liebau, M.C.; Schermer, B.; Benzing, T.; Kurschat, C.E. Enzyme replacement therapy clears Gb3 deposits from a podocyte cell culture model of fabry disease but fails to restore altered cellular signaling. Cell Physiol. Biochem. 2019, 52, 1139–1150. [Google Scholar]
- Frustaci, A.; Verardo, R.; Scialla, R.; Bagnato, G.; Verardo, M.; Alfarano, M.; Russo, M.A. Downregulation of mannose-6-phosphate receptors in fabry disease cardiomyopathy: A potential target for enzyme therapy enhancement. J. Clin. Med. 2022, 11, 5440. [Google Scholar] [CrossRef]
- Sands, M.S.; Davidson, B.L. Gene therapy for lysosomal storage diseases. Mol. Ther. 2006, 13, 839–849. [Google Scholar] [CrossRef] [PubMed]
- Prabakaran, T.; Nielsen, R.; Satchell, S.C.; Mathieson, P.W.; Feldt-Rasmussen, U.; Sorensen, S.S.; Christensen, E.I. Mannose 6-phosphate receptor and sortilin mediated endocytosis of alpha-galactosidase A in kidney endothelial cells. PLoS ONE 2012, 7, e39975. [Google Scholar] [CrossRef] [PubMed] [Green Version]
- Hetz, C. The unfolded protein response: Controlling cell fate decisions under ER stress and beyond. Nat. Rev. Mol. Cell Biol. 2012, 13, 89–102. [Google Scholar] [CrossRef]
- Walter, P.; Ron, D. The unfolded protein response: From stress pathway to homeostatic regulation. Science 2011, 334, 1081–1086. [Google Scholar] [CrossRef] [PubMed] [Green Version]
- Vitner, E.B.; Platt, F.M.; Futerman, A.H. Common and uncommon pathogenic cascades in lysosomal storage diseases. J. Biol. Chem. 2010, 285, 20423–20427. [Google Scholar] [CrossRef]
- Garg, A.D.; Kaczmarek, A.; Krysko, O.; Vandenabeele, P.; Krysko, D.V.; Agostinis, P. ER stress-induced inflammation: Does it aid or impede disease progression? Trends. Mol. Med. 2012, 18, 589–598. [Google Scholar] [CrossRef]
- Pearce, E.L.; Pearce, E.J. Metabolic pathways in immune cell activation and quiescence. Immunity 2013, 38, 633–643. [Google Scholar] [CrossRef] [Green Version]
- Gorlach, A.; Bertram, K.; Hudecova, S.; Krizanova, O. Calcium and ROS: A mutual interplay. Redox. Biol. 2015, 6, 260–271. [Google Scholar] [CrossRef] [Green Version]
- Oh-hora, M.; Rao, A. Calcium signaling in lymphocytes. Curr. Opin. Immunol. 2008, 20, 250–258. [Google Scholar] [CrossRef] [Green Version]
- Kim, J.W.; Kim, H.W.; Nam, S.A.; Lee, J.Y.; Cho, H.J.; Kim, T.M.; Kim, Y.K. Human kidney organoids reveal the role of glutathione in Fabry disease. Exp. Mol. Med. 2021, 53, 1580–1591. [Google Scholar] [CrossRef] [PubMed]
- Park, E.S.; Choi, J.O.; Park, J.W.; Lee, M.H.; Park, H.Y.; Jung, S.C. Expression of genes and their responses to enzyme replacement therapy in a Fabry disease mouse model. Int. J. Mol. Med. 2009, 24, 401–407. [Google Scholar] [PubMed] [Green Version]
- Wang, S.; Song, R.; Wang, Z.; Jing, Z.; Wang, S.; Ma, J. S100A8/A9 in Inflammation. Front. Immunol. 2018, 9, 1298. [Google Scholar] [CrossRef] [PubMed] [Green Version]
- Schumann, A.; Schaller, K.; Belche, V.; Cybulla, M.; Grunert, S.C.; Moers, N.; Sass, J.O.; Kaech, A.; Hannibal, L.; Spiekerkoetter, U. Defective lysosomal storage in Fabry disease modifies mitochondrial structure, metabolism and turnover in renal epithelial cells. J. Inherit. Metab. Dis. 2021, 44, 1039–1050. [Google Scholar] [CrossRef]
- Biancini, G.B.; Vanzin, C.S.; Rodrigues, D.B.; Deon, M.; Ribas, G.S.; Barschak, A.G.; Manfredini, V.; Netto, C.B.; Jardim, L.B.; Giugliani, R.; et al. Globotriaosylceramide is correlated with oxidative stress and inflammation in Fabry patients treated with enzyme replacement therapy. Biochim. Biophys. Acta 2012, 1822, 226–232. [Google Scholar] [CrossRef] [Green Version]
- Rossi, A.; Pizzo, P.; Filadi, R. Calcium, mitochondria and cell metabolism: A functional triangle in bioenergetics. Biochim. Biophys. Acta Mol. Cell Res. 2019, 1866, 1068–1078. [Google Scholar] [CrossRef]
- Ugur, B.; Bao, H.; Stawarski, M.; Duraine, L.R.; Zuo, Z.; Lin, Y.Q.; Neely, G.G.; Macleod, G.T.; Chapman, E.R.; Bellen, H.J. The Krebs Cycle Enzyme Isocitrate Dehydrogenase 3A Couples Mitochondrial Metabolism to Synaptic Transmission. Cell. Rep. 2017, 21, 3794–3806. [Google Scholar] [CrossRef] [Green Version]
- De Pasquale, V.; Moles, A.; Pavone, L.M. Cathepsins in the Pathophysiology of Mucopolysaccharidoses: New Perspectives for Therapy. Cells 2020, 9, 979. [Google Scholar] [CrossRef] [Green Version]
- Man, S.M.; Kanneganti, T.D. Regulation of lysosomal dynamics and autophagy by CTSB/cathepsin B. Autophagy 2016, 12, 2504–2505. [Google Scholar] [CrossRef] [Green Version]
- Yadati, T.; Houben, T.; Bitorina, A.; Shiri-Sverdlov, R. The ins and outs of cathepsins: Physiological function and role in disease management. Cells 2020, 9, 1679. [Google Scholar] [CrossRef]
- Mizunoe, Y.; Kobayashi, M.; Tagawa, R.; Nakagawa, Y.; Shimano, H.; Higami, Y. Association between lysosomal dysfunction and obesity-related pathology: A key knowledge to prevent metabolic syndrome. Int. J. Mol. Sci. 2019, 20, 3688. [Google Scholar] [CrossRef] [PubMed] [Green Version]
- Cermak, S.; Kosicek, M.; Mladenovic-Djordjevic, A.; Smiljanic, K.; Kanazir, S.; Hecimovic, S. Loss of cathepsin B and L leads to lysosomal dysfunction, NPC-like cholesterol sequestration and accumulation of the key alzheimer’s proteins. PLoS ONE 2016, 11, e0167428. [Google Scholar] [CrossRef] [PubMed] [Green Version]
- Aisa, M.C.; Cappuccini, B.; Barbati, A.; Orlacchio, A.; Baglioni, M.; Di Renzo, G.C. Biochemical parameters of renal impairment/injury and surrogate markers of nephron number in intrauterine growth-restricted and preterm neonates at 30-40 days of postnatal corrected age. Pediatr. Nephrol. 2016, 31, 2277–2287. [Google Scholar] [CrossRef] [PubMed]
- Wang, N.; Bai, X.; Jin, B.; Han, W.; Sun, X.; Chen, X. The association of serum cathepsin B concentration with age-related cardiovascular-renal subclinical state in a healthy Chinese population. Arch. Gerontol. Geriatr. 2016, 65, 146–155. [Google Scholar] [CrossRef]
- Svara, T.; Pogacnik, M.; Juntes, P. Distribution and amount of cathepsin B in gentamicin-induced acute kidney injury in rats. Pol. J. Vet. Sci. 2010, 13, 75–82. [Google Scholar]
- Herzog, C.; Yang, C.; Holmes, A.; Kaushal, G.P. zVAD-fmk prevents cisplatin-induced cleavage of autophagy proteins but impairs autophagic flux and worsens renal function. Am. J. Physiol. Renal. Physiol. 2012, 303, F1239–F1250. [Google Scholar] [CrossRef] [Green Version]
- Liu, W.J.; Shen, T.T.; Chen, R.H.; Wu, H.L.; Wang, Y.J.; Deng, J.K.; Chen, Q.H.; Pan, Q.; Huang Fu, C.M.; Tao, J.L.; et al. Autophagy-Lysosome Pathway in Renal Tubular Epithelial Cells Is Disrupted by Advanced Glycation End Products in Diabetic Nephropathy. J. Biol. Chem. 2015, 290, 20499–20510. [Google Scholar] [CrossRef]
- Goncalves, I.; Hultman, K.; Duner, P.; Edsfeldt, A.; Hedblad, B.; Fredrikson, G.N.; Bjorkbacka, H.; Nilsson, J.; Bengtsson, E. High levels of cathepsin D and cystatin B are associated with increased risk of coronary events. Open Heart 2016, 3, e000353. [Google Scholar] [CrossRef] [Green Version]
- Pereira, E.M.; do Monte, S.J.; do Nascimento, F.F.; de Castro, J.A.; Sousa, J.L.; Filho, H.C.; da Silva, R.N.; Labilloy, A.; Monte Neto, J.T.; da Silva, A.S. Lysosome-associated protein 1 (LAMP-1) and lysosome-associated protein 2 (LAMP-2) in a larger family carrier of Fabry disease. Gene 2014, 536, 118–122. [Google Scholar] [CrossRef]
- Ivanova, M.M.; Changsila, E.; Iaonou, C.; Goker-Alpan, O. Impaired autophagic and mitochondrial functions are partially restored by ERT in Gaucher and Fabry diseases. PLoS ONE 2019, 14, e0210617. [Google Scholar] [CrossRef] [Green Version]
- Traver, D. Cellular dissection of zebrafish hematopoiesis. In Methods in Cell Biology; Academic Press: Cambridge, MA, USA, 2004; Volume 76, pp. 127–149. [Google Scholar]
- Bailone, R.L.; Fukushima, H.C.S.; Ventura Fernandes, B.H.; De Aguiar, L.K.; Correa, T.; Janke, H.; Grejo Setti, P.; Roca, R.O.; Borra, R.C. Zebrafish as an alternative animal model in human and animal vaccination research. Lab. Anim. Res. 2020, 36, 13. [Google Scholar] [CrossRef] [PubMed]
- Povoa, V.; Rebelo de Almeida, C.; Maia-Gil, M.; Sobral, D.; Domingues, M.; Martinez-Lopez, M.; de Almeida Fuzeta, M.; Silva, C.; Grosso, A.R.; Fior, R. Innate immune evasion revealed in a colorectal zebrafish xenograft model. Nat. Commun. 2021, 12, 1156. [Google Scholar] [CrossRef] [PubMed]
- Trede, N.S.; Langenau, D.M.; Traver, D.; Look, A.T.; Zon, L.I. The use of zebrafish to understand immunity. Immunity 2004, 20, 367–379. [Google Scholar] [PubMed] [Green Version]
- Zhang, X.; Zhou, Q.; Zou, W.; Hu, X. Molecular mechanisms of developmental toxicity induced by graphene oxide at predicted environmental concentrations. Environ. Sci. Technol. 2017, 51, 7861–7871. [Google Scholar] [CrossRef] [PubMed]
- Tjeldnes, H.; Labun, K.; Torres Cleuren, Y.; Chyzynska, K.; Swirski, M.; Valen, E. ORFik: A comprehensive R toolkit for the analysis of translation. BMC Bioinform. 2021, 22, 336. [Google Scholar] [CrossRef]
- Chen, S.; Zhou, Y.; Chen, Y.; Gu, J. fastp: An ultra-fast all-in-one FASTQ preprocessor. Bioinformatics 2018, 34, i884–i890. [Google Scholar] [CrossRef]
- Dobin, A.; Davis, C.A.; Schlesinger, F.; Drenkow, J.; Zaleski, C.; Jha, S.; Batut, P.; Chaisson, M.; Gingeras, T.R. STAR: Ultrafast universal RNA-seq aligner. Bioinformatics 2013, 29, 15–21. [Google Scholar] [CrossRef]
- Gentleman, R.C.; Carey, V.J.; Bates, D.M.; Bolstad, B.; Dettling, M.; Dudoit, S.; Ellis, B.; Gautier, L.; Ge, Y.; Gentry, J.; et al. Bioconductor: Open software development for computational biology and bioinformatics. Genome Biol. 2004, 5, R80. [Google Scholar] [CrossRef] [Green Version]
- Lawrence, M.; Huber, W.; Pages, H.; Aboyoun, P.; Carlson, M.; Gentleman, R.; Morgan, M.T.; Carey, V.J. Software for computing and annotating genomic ranges. PLoS Comput. Biol. 2013, 9, e1003118. [Google Scholar] [CrossRef]
- Love, M.I.; Huber, W.; Anders, S. Moderated estimation of fold change and dispersion for RNA-seq data with DESeq2. Genome Biol. 2014, 15, 550. [Google Scholar] [CrossRef] [Green Version]
- Villanueva, R.A.M.; Chen, Z.J. ggplot2: Elegant Graphics for Data Analysis (2nd ed.). Meas. Interdiscip. Res. Perspect. 2019, 17, 160–167. [Google Scholar] [CrossRef]
- Ge, S.X.; Jung, D.; Yao, R. ShinyGO: A graphical gene-set enrichment tool for animals and plants. Bioinformatics 2020, 36, 2628–2629. [Google Scholar] [CrossRef] [PubMed]
- Thawng, C.N.; Smith, G.B. A transcriptome software comparison for the analyses of treatments expected to give subtle gene expression responses. BMC Genom. 2022, 23, 452. [Google Scholar] [CrossRef] [PubMed]
- Seyednasrollah, F.; Laiho, A.; Elo, L.L. Comparison of software packages for detecting differential expression in RNA-seq studies. Brief Bioinform. 2015, 16, 59–70. [Google Scholar] [CrossRef] [Green Version]
- Zhang, H.; Wen, W.; Yan, J. Application of immunohistochemistry technique in hydrobiological studies. Aquac. Fish. 2017, 2, 140–144. [Google Scholar] [CrossRef]


Disclaimer/Publisher’s Note: The statements, opinions and data contained in all publications are solely those of the individual author(s) and contributor(s) and not of MDPI and/or the editor(s). MDPI and/or the editor(s) disclaim responsibility for any injury to people or property resulting from any ideas, methods, instructions or products referred to in the content. |
© 2022 by the authors. Licensee MDPI, Basel, Switzerland. This article is an open access article distributed under the terms and conditions of the Creative Commons Attribution (CC BY) license (https://creativecommons.org/licenses/by/4.0/).
Share and Cite
Elsaid, H.O.A.; Tjeldnes, H.; Rivedal, M.; Serre, C.; Eikrem, Ø.; Svarstad, E.; Tøndel, C.; Marti, H.-P.; Furriol, J.; Babickova, J. Gene Expression Analysis in gla-Mutant Zebrafish Reveals Enhanced Ca2+ Signaling Similar to Fabry Disease. Int. J. Mol. Sci. 2023, 24, 358. https://doi.org/10.3390/ijms24010358
Elsaid HOA, Tjeldnes H, Rivedal M, Serre C, Eikrem Ø, Svarstad E, Tøndel C, Marti H-P, Furriol J, Babickova J. Gene Expression Analysis in gla-Mutant Zebrafish Reveals Enhanced Ca2+ Signaling Similar to Fabry Disease. International Journal of Molecular Sciences. 2023; 24(1):358. https://doi.org/10.3390/ijms24010358
Chicago/Turabian StyleElsaid, Hassan Osman Alhassan, Håkon Tjeldnes, Mariell Rivedal, Camille Serre, Øystein Eikrem, Einar Svarstad, Camilla Tøndel, Hans-Peter Marti, Jessica Furriol, and Janka Babickova. 2023. "Gene Expression Analysis in gla-Mutant Zebrafish Reveals Enhanced Ca2+ Signaling Similar to Fabry Disease" International Journal of Molecular Sciences 24, no. 1: 358. https://doi.org/10.3390/ijms24010358