
The Regulatory Roles of Intrinsically Disordered Linker in VRN1-DNA Phase Separation


1
Beijing National Laboratory for Molecular Sciences (BNLMS), State Key Laboratory for Structural Chemistry of Unstable and Stable Species, College of Chemistry and Molecular Engineering, Peking University, Beijing 100871, China
2
Peking-Tsinghua Center for Life Sciences, Peking University, Beijing 100871, China
3
Center for Quantitative Biology, Peking University, Beijing 100871, China
4
Research Unit of Drug Design Method, Chinese Academy of Medical Sciences (2021RU014), Beijing 100871, China
*
Authors to whom correspondence should be addressed.
Int. J. Mol. Sci. 2022, 23(9), 4594; https://doi.org/10.3390/ijms23094594
Submission received: 19 March 2022
/
Revised: 16 April 2022
/
Accepted: 19 April 2022
/
Published: 21 April 2022
(This article belongs to the Special Issue Intrinsically Disordered Proteins (IDPs) 2.0)
Abstract
:Biomacromolecules often form condensates to function in cells. VRN1 is a transcriptional repressor that plays a key role in plant vernalization. Containing two DNA-binding domains connected by an intrinsically disordered linker (IDL), VRN1 was shown to undergo liquid-like phase separation with DNA, and the length and charge pattern of IDL play major regulatory roles. However, the underlying mechanism remains elusive. Using a polymer chain model and lattice-based Monte-Carlo simulations, we comprehensively investigated how the IDL regulates VRN1 and DNA phase separation. Using a worm-like chain model, we showed that the IDL controls the binding affinity of VRN1 to DNA, by modulating the effective local concentration of the VRN1 DNA-binding domains. The predicted binding affinities, under different IDL lengths, were in good agreement with previously reported experimental results. Our simulation of the phase diagrams of the VRN1 variants with neutral IDLs and DNA revealed that the ability of phase separation first increased and then decreased, along with the increase in the linker length. The strongest phase separation ability was achieved when the linker length was between 40 and 80 residues long. Adding charged patches to the IDL resulted in robust phase separation that changed little with IDL length variations. Our study provides mechanism insights on how IDL regulates VRN1 and DNA phase separation, and why naturally occurring VRN1-like proteins evolve to contain the charge segregated IDL sequences, which may also shed light on the molecular mechanisms of other IDL-regulated phase separation processes in living cells.

1. Introduction
Living cells contain huge amounts of biomacromolecules in a limited space, which often form membraneless organelles to mediate a myriad of functions precisely and efficiently, such as chromatin remodeling [1,2,3,4], gene transcription [5] and biomolecule sequestration [6]. Since the first observation of liquid-liquid phase separation (LLPS) in germline P granules [7], more and more evidence suggests that liquid-like droplets are widely spread and utilized in both eukaryotic and prokaryotic cells [8,9], by virtue of achieving complex multicomponent subcellular translocation and enhanced local concentration, making them a promising approach to ensure homeostasis and development. The dysfunction of LLPS will induce severe diseases [10,11,12], such as neurodegenerative diseases. To integrate these intensive data, several databases [13] have been built to record the LLPS-related biological functions, regulating mechanisms, components and subcellular locations in cells, such as LLPSDB [14], DrLLPS [15], PhaSePro [16] and PhaSepDB [17]. Based on these invaluable resources, machine learning-based algorithms have also been developed to predict LLPS proteins [18,19].
The major driving forces of LLPS are supposed to be the non-specific interactions between biomolecules; however, specific interactions can also provide heterogeneity for these biomolecular condensates [20,21], especially for those that possess weak multivalent interactions [21,22,23], such as intrinsically disordered proteins (IDPs) or intrinsically disordered regions (IDRs), which lack well-defined structures and are frequently observed in the liquid-like droplets [9,24]. IDRs often act as disordered linkers to connect and interact with globular domains in multidomain proteins [25], the major protein architecture in LLPS. The sequence pattern and length of disordered linkers regulate the interactions between domains [26,27,28,29] and modulate macroscopic phase behaviors, such as liquid-like droplets and aggregates [30,31,32]. These features can, in turn, guide the design of the linkers with specific lengths and charge patterns to artificially modulate LLPS [33] and the binding affinity between domains. In general, multidomain proteins can be divided into stickers, which form specific and multivalent interactions that mainly correspond to domains, and spacers that provide non-specific interactions or a volume exclusion effect, corresponding to the neutral disordered linkers [30,34,35]. The sticker-spacer framework [36] has deepened the understanding of LLPS and successfully revealed the underlying mechanism of some complex phase separation phenomenon, using both computational and experimental techniques [37,38,39].
The transcriptional repressor VRN1 is a multidomain DNA-binding protein involved in plant vernalization [40,41,42]. VRN1 contains two B3 domains, connected by an intrinsically disordered linker (IDL), which can bind DNA to undergo LLPS [43]. A previous study showed that the length and charge pattern of the IDL could modulate both the binding affinity of the B3 domain to DNA and the phase separation behavior, which changes from gel-like aggregates to liquid-like droplets and solution, depending on the linker length and existence of charged patches [44]. This IDL charge segregation pattern is also conserved in the transcriptional activation domains of many transcriptional factors, hinting a general property [45]. However, it is still obscure how the linker length and charge segregation modulate these mesoscale behaviors, hindering the cognition and application of these rules.
To answer these questions, we used a polymer chain model and lattice-based Monte-Carlo simulations to comprehensively investigate how the IDL mediates VRN1 and DNA phase separation. The IDL length and sequence pattern control the effective local concentration of the DNA-binding domains and the binding free energy between VRN1 and DNA, which further affects the macroscopic phase behavior. The simulated phase diagrams under different conditions also qualitatively reproduced the previous experimental results [44]. These findings not only explain the experimental observations, but also deepen our understanding of IDL-regulated phase separation processes in cells.
2. Results
2.1. The Effective Local Concentration Effect of IDL has Essential Influence on the Binding Affinity between VRN1 and DNA
In domain-linker-domain (DLD) protein architectures, the linkers enhance the local concentration of domains to allosterically promote ligand binding [25,26], which can be described as a worm-like chain (WLC) [29,46,47,48] or a random-coil chain (RMC) [49]. VRN1 has a typical DLD architecture. In order to study the length effect of the IDL, Wang et al. constructed a series of VRN1 variants (PSN) with different lengths of IDL, containing PS repeats, and found that their apparent binding affinity with DNA decreases with the increase in IDL length, as summarized in Table 1 [44]. As these linkers are composed of neutral residues and do not interact with the surroundings, the entropic effect may be dominant and polymer chain models can be applied. The binding of VRN1 to DNA is much stronger than that of a single B3 domain, due to the enhanced local concentration effect, as shown in Figure 1. The apparent VRN1-DNA binding affinity is related to the effective local concentration caused by the linker, which can be calculated using the following equation:
where is the binding affinity of a single B3 domain to DNA (753 nM) and is the binding affinity between VRN1 variants, with different linker lengths and DNA (Table 1). is expected to depend mainly on the linker length, as described in Section 4. To test whether the linker-length dependence of the VRN1-DNA affinity can be explained by such a mechanism, the experimental data were fitted with WLC and RMC models. In both models, there were only the following two fitted parameters: the end-to-end distance () of the IDL in the VRN1-DNA complex and a proportional factor (). It was shown that the experimental results can be fitted well by both models (Figure 2), with the Pearson correlation coefficient of 0.92. Therefore, the IDL enhances the VRN1-DNA binding affinity via the effective local concentration . A longer VRN1 IDL leads to a lower ; thus, causes weaker binding to DNA. The predicted end-to-end distance is 31.6 Å for WLC, being close to the predicted Å for RMC.
As a further step, the WLC and RMC models predicted that, as the IDL is shorter to some extent, the binding may be weakened rather than being strengthened, leading to an optimal linker length of about 43 residues, under which the binding affinity is the highest (Figure 3). It should be noted that these polymer models do not consider the protein volume and fluctuations of the end-to-end distance, which may cause some uncertainty that would be significant at a smaller linker length. It is also difficult to experimentally verify the situation at a short length, since the linker may not remain disordered. Anyway, the above results demonstrated that the entropic effect of the disordered linkers in VRN1 could effectively tune their binding affinity to DNA. By varying the linker length, it is possible to control the affinity and further influence the mesoscale phase separation process, as discussed below.
2.2. Simulations of Phase Separation under Different IDL Lengths
A previous study showed that multidomain proteins can function as stickers and spacers during the phase separation process [35]. The B3 domains in VRN1 resemble stickers to interact with DNA, while the IDL resembles spacers that contribute the effective local concentration. An experimental study revealed that the phase behavior of VRN1 and DNA transited from gel-like precipitates (L = 40) to liquid-like droplets (L = 100) and a clear solution (L = 160) when neutral linkers were used [44], where L refers to the number of linker residues. When a pair of positively and negatively charged patches were added to the linker, the phase behavior converged to the robust droplets, regardless of the linker length [44]. To better understand these phase transition processes, we performed coarse-grained Monte-Carlo simulations using LASSI [30,35,50,51], a lattice model developed by Pappu et al. (see Section 4). In this model, and are two key quantities to be obtained from the simulations, which describe the density inhomogeneities and the extend of percolation, respectively. They can be used to distinguish between phase separation and gelation [35]. In this paper, we expect that if exceeds 0.025, phase separation occurs; and if exceeds 0.5, gelation occurs. Each VRN1 variant protein was modeled as two beads, with an implicit linker connecting them. The reason to use the implicit linker is that the worm-like chain model or random-coil model can describe the IDL properties, by incorporating the excluded volume effect and nonspecific attraction into the persistent length [52]. This is also why the implicit linker models can be used to fit the experimental results in Figure 2. Every 10 base pairs (bp) of DNA were modeled as a bead. For DNA with 55 bp that was used in experiments, 5 consecutive beads were used. Every 10 residues in the linker were supposed to occupy 1 lattice unit length. Therefore, the linker length varied from 2 to 16 lattice unit length, with an interval of 2, corresponding to 8 simulation systems (L = 20, 40, 60, 80, 100, 120, 140, 160) to obtain a detailed picture of how phase behavior correlates with linker length. A total of 1000 protein and 250 DNA molecules were put into the simulation box to duplicate the experimental concentration ratio. Since electrostatic interactions play a key role, and the net charge of a single B3 bead and a DNA bead is +4 and −20, respectively, the contact energy between protein-protein, protein-DNA and DNA-DNA are set to be 0.4, and , respectively, where is the Boltzmann constant and K is the reference temperature. By varying the concentration, through modifying the size of the simulation box as well as temperature, the phase diagram of each system can be simulated.
The simulation results of the phase diagram under different linker lengths were summarized in Figure 4. It can be observed that as the linker length increased, the upper critical solution temperature (UCST) to undergo LLPS first increased and then decreased, and the concentration allowed to undergo phase separation globally became lower, indicating that the ability of LLPS first improved and later weakened. Gelation follows a similar tendency, as the concentration allowed to undergo gelation first decreased and then increased as the linker length grew, but the variation is far less significant. These simulations hint that if the linkers are short, two B3 domains prefer to bind to the same DNA in favor of forming network terminating dimers and oligomers, which weakens the ability of either gelation or phase separation, and if the linkers are too long, two B3 domains will become independent from one another and the enhanced local concentration effect becomes negligible, although gelation can still occur.
Evidently, the simulated phase separation behaviors correlated well with the binding affinity of VRN1-DNA. A higher affinity is more favorable for the occurrence of phase separation. Being judged from the UCST, the strongest phase separation occurs approximately between L = 40 and L = 60, which is close to the optimal linker length of L = 43, to achieve the highest affinity. A longer linker has a high entropic cost, which eventually inhibits phase separation. We also performed simulations with a different VRN1/DNA ratio, i.e., with 1000 protein and 500 DNA molecules. The obtained results showed a similar tendency (Figure S1). In short, these simulations indicated that linker length can effectively modulate the process of gelation, as well as phase separation. A shorter linker will prohibit the phase separation (and gelation), by forming network terminating dimers and oligomers, while a longer linker length will diminish the cooperativity of two adjacent B3 domains and disrupt phase separation. For an intermediate linker length, a strong tendency for phase separation may occur.
2.3. Simulations of Phase Separation for Systems with Charged Patches in Linker
The linker considered in the above simulations is neutral, so its effect is tuned by the length. On the other hand, naturally occurring VRN1 and VRN1-like proteins contain IDL with charge segregation. Adding charged patches on the linker can robustly maintain the liquid-like phase separation behavior of VRN1 variants and DNA [44]. As these patches made specific interactions with each other and with both the B3 domains and DNA, we next modeled the positively and negatively charged patches as two explicit beads, connected by the rest of the implicit linker. The contact energy among these components was listed in Table S1, according to the net charge of each bead type (the charged patch that was used in the experiments included +7 or −7 charged residues). Considering that each charged patch occupies one lattice unit length, the implicit linker length varied from 2 lattice units to 14 lattice units, with an interval of 4, which corresponds to 4 simulated systems (L = 40, 80, 120, 160).
The phase diagrams of these systems were simulated using the same settings as before. The obtained results showed that these systems had a much wider phase separation boundary and the UCST was much higher than the corresponding system with a neutral linker (Figure 5). Even for the system with the weakest LLPS ability (L = 160), the UCST was close to the neutral system with the strongest LLPS ability (L = 80), which was consistent with the experimental results [44] that charge segregation in the IDL ensures robust LLPS that does not depend on the IDL length.
The naturally occurring charged patches in the linker often consist of several consecutive charged segments, while too short or too long charged patches are rare [44]. Therefore, we next investigated whether the too short or too long charged patches lead to weakened phase separation. To explore these situations, the linker with 40 residues was chosen as a model system and the absolute net charge for each charged patch was gradually decreased from +7 to +6, +4 and +2, to mimic the shortening effect (Table S1). We also constructed a ‘1100’ linker architecture in which ‘1′ refers to the original positively charged patches and ‘0′ refers to the original negatively charged patches, to mimic the elongation effect. The simulation results showed that the LLPS ability decreased, along with the decrease in the charged patch length (Figure 6). On the other hand, a system with longer charged patches can also slightly alleviate the LLPS ability, which can lead to a waste of resources in cells. This may be the reason why nature utilizes sequences with charge segregation patterns and modest lengths.
3. Discussion
IDPs are widely spread in human cells and nearly half of human proteins are IDPs, possibly due to their many advantages, such as saving genome resources, achieving fast binding rates, and serving as flexible linkers to connect domains [53]. To perform complex functions, cells need to develop and evolve a method, possibly through phase separation, to precisely organize enormous molecules, on both spatial and temporal scales. Phase separation is a mesoscale event, involving multicomponent interactions to maintain the high-concentration condition. Although the underlying driving force can be electrostatic, hydrophobic, π-π, cation-π, dipole-dipole and non-specific interactions, they should be multivalent. A disordered linker is quite suitable for this demand. It can act as an entropic chain to modulate domain interaction or directly interact with the surroundings; both can induce LLPS. Recently, many transcriptional factors have been found to regulate gene expression through LLPS, in which the N- or C-terminal low complexity regions participate in the formation of large molecular machines and clusters of enhancers (the so-called super-enhancers) [54], with fast association and dissociation rates to accomplish high specificity with low affinity. Moreover, some pioneer transcriptional factors can modify the phase behavior or the accessibility of closed chromatins [55], possibly using the same strategy. It should be noticed that the IDL of VRN1 contains a considerable number of Y/F amino acids, as well as positively charged residues. It has been shown in our previous study [43] that the VRN1-DNA phase separation can be destroyed with a high concentration of salt, indicating that the electrostatic interactions play a dominant role here. The reason why the wild-type VRN1 protein contains a considerable number of Y/F amino acid residues and whether the cation-π interaction plays an important role in the VRN1-DNA LLPS should be analyzed in the future.
To reveal the underlying mechanism of IDL mediated biomolecular condensation, we applied a polymer chain model and phase diagram simulations to study the VRN1 system. We found that both the effective local concentration effect and charge segregation pattern could boost the ability of LLPS, which is consistent with experimental observations. This conclusion can be used to guide the design of linkers in constructing LLPS-enhanced functional systems, such as those containing functional modules, an example being fluorescent proteins or enzymes, which act as probes for translocation detection and chemoenzymatic microreactors [56]. Further research should explore such possibilities.
4. Materials and Methods
4.1. Fitting VRN1 Linker to WLC Model and RMC Model
The probability distribution function () of the end-to-end distance () for the linker between two B3 domains of VRN1 was calculated using the WLC model and RMC model. For the WLC model, one domain can be expressed using the following equation [29,46,47,48,57,58]:
where represents the persistent length of the linker, which is set to 3.0 Å, and is the total contour length of the linker, which is the multiplication of the residue number in the linker and the average distance between the adjacent (3.8 Å). is the Avogadro constant. For the RMC model, one domain can be expressed using the following equation [28,49,59]:
where is the root mean square of , which equals to . The effective local concentration for the formation of a DNA-protein complex is proportional to , given by the following equation:
where is assigned to the distance value between the B3 domain ends in the VRN1-DNA complex to be connected by a disordered linker (see Figure 1) and is a proportional factor. It is noted that in Equation (4) is independent of the linker length and the VRN1-DNA binding affinity. The linker length affects merely via in Equations (2) and (3). plays an essential role in the linker’s effect, since it further relates the VRN1-DNA binding affinity to the affinity between a single B3 domain and DNA, as shown in Equation (1).
4.2. Lattice-Based Coarse-Grained Monte-Carlo Simulations of Phase Diagrams
Phase diagram simulations were performed using LASSI, a lattice simulation engine for sticker and spacer interactions, developed by Pappu et al. [30,35,50,51]. LASSI performs Monte-Carlo simulations using a simple lattice model. The molecular evolution is driven by a variety of designed Monte-Carlo moves, including chain pivot, translation, rotation moves of both the individual molecules and clusters of molecules and so on. In our study, each VRN1 protein was modeled as two beads, with an implicit linker connecting them by distance restraint. Every 10 base pairs (bp) of DNA were modeled as a bead. For DNA with 50 bp in simulation, 5 neighbor beads were used. Every 10 residues in a linker were supposed to have 1 lattice unit length. The concentrations (which were titrated by changing the simulated box) and temperature were set as the independent variables. The contact radius used followed the default definition in LASSI, which suggests that the beads are considered to be adjacent to one another if they are within a lattice distance of . The overlap potential was the same as the contact energy. For each system, two independent simulations were conducted, each of which consisted of MC steps, after equilibration steps. To further elucidate the influence of the charged patches on phase separation, the positively and negatively charged patches inside the linker were modeled as an explicit bead, connected by the rest of the implicit linker.
Supplementary Materials
The following supporting information can be downloaded at: https://www.mdpi.com/article/10.3390/ijms23094594/s1.
Author Contributions
Conceptualization, Z.L. and L.L.; methodology, Z.L., L.L., Q.H. and Y.W.; software, Q.H.; formal analysis, Z.L., L.L., Q.H. and Y.W.; investigation, Q.H. and Y.W.; data curation, Q.H.; writing—original draft preparation, Q.H.; writing—review and editing, Z.L. and L.L.; supervision, Z.L. and L.L.; project administration, Z.L. and L.L.; funding acquisition, Z.L. and L.L. All authors have read and agreed to the published version of the manuscript.
Funding
This research was supported in part by the National Natural Science Foundation of China (21633001) and the Chinese Academy of Medical Sciences (2021-I2M-5-014).
Institutional Review Board Statement
Not applicable.
Informed Consent Statement
Not applicable.
Data Availability Statement
The LASSI simulation files for reproducibility are uploaded in LASSI_files.zip.
Acknowledgments
The Monte-Carlo simulations were carried out on the High-Performance Computing Platform of the Peking-Tsinghua Center for Life Sciences at Peking University. We thank Huabin Zhou and Limin Chen for their helpful discussions.
Conflicts of Interest
The authors declare no conflict of interest.
References
- Feric, M.; Misteli, T. Phase separation in genome organization across evolution. Trends. Cell Biol. 2021, 31, 671–685. [Google Scholar] [CrossRef] [PubMed]
- Liu, S.; Zhang, L.; Quan, H.; Tian, H.; Meng, L.; Yang, L.; Feng, H.; Gao, Y.Q. From 1D sequence to 3D chromatin dynamics and cellular functions: A phase separation perspective. Nucleic Acids Res. 2018, 46, 9367–9383. [Google Scholar] [CrossRef] [PubMed] [Green Version]
- Lytle, T.K.; Chang, L.W.; Markiewicz, N.; Perry, S.L.; Sing, C.E. Designing electrostatic interactions via polyelectrolyte monomer sequence. ACS Cent. Sci. 2019, 5, 709–718. [Google Scholar] [CrossRef] [PubMed] [Green Version]
- Bajpai, G.; Amiad Pavlov, D.; Lorber, D.; Volk, T.; Safran, S. Mesoscale phase separation of chromatin in the nucleus. eLife 2021, 10, e63976. [Google Scholar] [CrossRef] [PubMed]
- Li, W.; Jiang, H. Nuclear protein condensates and their properties in regulation of gene expression. J. Mol. Biol. 2021, 167151. [Google Scholar] [CrossRef] [PubMed]
- Banani, S.F.; Lee, H.O.; Hyman, A.A.; Rosen, M.K. Biomolecular condensates: Organizers of cellular biochemistry. Nat. Rev. Mol. Cell Biol. 2017, 18, 285–298. [Google Scholar] [CrossRef]
- Brangwynne, C.P.; Eckmann, C.R.; Courson, D.S.; Rybarska, A.; Hoege, C.; Gharakhani, J.; Julicher, F.; Hyman, A.A. Germline P granules are liquid droplets that localize by controlled dissolution/condensation. Science 2009, 324, 1729–1732. [Google Scholar] [CrossRef]
- Yeong, V.; Werth, E.G.; Brown, L.M.; Obermeyer, A.C. Formation of biomolecular condensates in bacteria by tuning protein electrostatics. ACS Cent. Sci. 2020, 6, 2301–2310. [Google Scholar] [CrossRef]
- Cohan, M.C.; Pappu, R.V. Making the case for disordered proteins and biomolecular condensates in bacteria. Trends Biochem. Sci. 2020, 45, 668–680. [Google Scholar] [CrossRef]
- Wang, W.; Chen, Y.; Xu, A.; Cai, M.; Cao, J.; Zhu, H.; Yang, B.; Shao, X.; Ying, M.; He, Q. Protein phase separation: A novel therapy for cancer? Br. J. Pharmacol. 2020, 177, 5008–5030. [Google Scholar] [CrossRef]
- Tsang, B.; Pritišanac, I.; Scherer, S.W.; Moses, A.M.; Forman-Kay, J.D. Phase separation as a missing mechanism for interpretation of disease mutations. Cell 2020, 183, 1742–1756. [Google Scholar] [CrossRef] [PubMed]
- Cai, D.; Liu, Z.; Lippincott-Schwartz, J. Biomolecular condensates and their links to cancer progression. Trends Biochem. Sci. 2021, 46, 535–549. [Google Scholar] [CrossRef] [PubMed]
- Li, Q.; Wang, X.; Dou, Z.; Yang, W.; Huang, B.; Lou, J.; Zhang, Z. Protein databases related to liquid-liquid phase separation. Int. J. Mol. Sci. 2020, 21, 6796. [Google Scholar] [CrossRef] [PubMed]
- Li, Q.; Peng, X.; Li, Y.; Tang, W.; Zhu, J.; Huang, J.; Qi, Y.; Zhang, Z. LLPSDB: A database of proteins undergoing liquid–liquid phase separation in vitro. Nucleic Acids Res. 2020, 48, D320–D327. [Google Scholar] [CrossRef]
- Ning, W.; Guo, Y.; Lin, S.; Mei, B.; Wu, Y.; Jiang, P.; Tan, X.; Zhang, W.; Chen, G.; Peng, D.; et al. DrLLPS: A data resource of liquid-liquid phase separation in eukaryotes. Nucleic Acids Res. 2020, 48, D288–D295. [Google Scholar] [CrossRef]
- Mészáros, B.; Erdős, G.; Szabó, B.; Schád, É.; Tantos, Á.; Abukhairan, R.; Horváth, T.; Murvai, N.; Kovács, O.P.; Kovács, M.; et al. PhaSePro: The database of proteins driving liquid–liquid phase separation. Nucleic Acids Res. 2020, 48, D360–D367. [Google Scholar] [CrossRef]
- You, K.; Huang, Q.; Yu, C.; Shen, B.; Sevilla, C.; Shi, M.; Hermjakob, H.; Chen, Y.; Li, T. PhaSepDB: A database of liquid-liquid phase separation related proteins. Nucleic Acids Res. 2020, 48, D354–D359. [Google Scholar] [CrossRef]
- Shen, B.; Chen, Z.; Yu, C.; Chen, T.; Shi, M.; Li, T. Computational screening of phase-separating proteins. Genom. Proteom. Bioinf. 2021, 19, 13–24. [Google Scholar] [CrossRef]
- Chu, X.; Sun, T.; Li, Q.; Xu, Y.; Zhang, Z.; Lai, L.; Pei, J. Prediction of liquid-liquid phase separating proteins using machine learning. BMC Bioinform. 2022, 23, 72. [Google Scholar] [CrossRef]
- Schmit, J.D.; Feric, M.; Dundr, M. How hierarchical interactions make membraneless organelles tick like clockwork. Trends Biochem. Sci. 2021, 46, 525–534. [Google Scholar] [CrossRef]
- Dignon, G.L.; Best, R.B.; Mittal, J. Biomolecular phase separation: From molecular driving forces to macroscopic properties. Annu. Rev. Phys. Chem. 2020, 71, 53–75. [Google Scholar] [CrossRef] [PubMed] [Green Version]
- Brangwynne, C.P.; Tompa, P.; Pappu, R.V. Polymer physics of intracellular phase transitions. Nat. Phys. 2015, 11, 899–904. [Google Scholar] [CrossRef]
- Das, S.; Lin, Y.H.; Vernon, R.M.; Forman-Kay, J.D.; Chan, H.S. Comparative roles of charge, p, and hydrophobic interactions in sequence-dependent phase separation of intrinsically disordered proteins. Proc. Natl. Acad. Sci. USA 2020, 117, 28795–28805. [Google Scholar] [CrossRef]
- Wei, M.T.; Elbaum-Garfinkle, S.; Holehouse, A.S.; Chen, C.C.; Feric, M.; Arnold, C.B.; Priestley, R.D.; Pappu, R.V.; Brangwynne, C.P. Phase behaviour of disordered proteins underlying low density and high permeability of liquid organelles. Nat. Chem. 2017, 9, 1118–1125. [Google Scholar] [CrossRef] [PubMed]
- Huang, Q.; Li, M.; Lai, L.; Liu, Z. Allostery of multidomain proteins with disordered linkers. Curr. Opin. Struct. Biol. 2020, 62, 175–182. [Google Scholar] [CrossRef]
- Li, M.; Cao, H.; Lai, L.; Liu, Z. Disordered linkers in multidomain allosteric proteins: Entropic effect to favor the open state or enhanced local concentration to favor the closed state? Protein Sci. 2018, 27, 1600–1610. [Google Scholar] [CrossRef] [Green Version]
- Yan, L.; Wang, L.; Tian, Y.; Xia, X.; Chen, Z. Structure and regulation of the chromatin remodeller ISWI. Nature 2016, 540, 466–469. [Google Scholar] [CrossRef]
- Anthis, N.J.; Clore, G.M. The length of the calmodulin linker determines the extent of transient interdomain association and target affinity. J. Am. Chem. Soc. 2013, 135, 9648–9651. [Google Scholar] [CrossRef] [Green Version]
- Zhou, H.X. Quantitative account of the enhanced affinity of two linked scFvs specific for different epitopes on the same antigen. J. Mol. Biol. 2003, 329, 1–8. [Google Scholar] [CrossRef]
- Harmon, T.S.; Holehouse, A.S.; Rosen, M.K.; Pappu, R.V. Intrinsically disordered linkers determine the interplay between phase separation and gelation in multivalent proteins. eLife 2017, 6, e30294. [Google Scholar] [CrossRef]
- McCarty, J.; Delaney, K.T.; Danielsen, S.P.O.; Fredrickson, G.H.; Shea, J.E. Complete phase diagram for liquid-liquid phase separation of intrinsically disordered proteins. J. Phys. Chem. Lett. 2019, 10, 1644–1652. [Google Scholar] [CrossRef] [PubMed]
- Schuster, B.S.; Dignon, G.L.; Tang, W.S.; Kelley, F.M.; Ranganath, A.K.; Jahnke, C.N.; Simpkins, A.G.; Regy, R.M.; Hammer, D.A.; Good, M.C.; et al. Identifying sequence perturbations to an intrinsically disordered protein that determine its phase-separation behavior. Proc. Natl. Acad. Sci. USA 2020, 117, 11421–11431. [Google Scholar] [CrossRef]
- Dzuricky, M.; Rogers, B.A.; Shahid, A.; Cremer, P.S.; Chilkoti, A. De novo engineering of intracellular condensates using artificial disordered proteins. Nat. Chem. 2020, 12, 814–825. [Google Scholar] [CrossRef] [PubMed]
- Choi, J.M.; Holehouse, A.S.; Pappu, R.V. Physical principles underlying the complex biology of intracellular phase transitions. Annu. Rev. Biophys. 2020, 49, 107–133. [Google Scholar] [CrossRef] [PubMed] [Green Version]
- Choi, J.M.; Dar, F.; Pappu, R.V. LASSI: A lattice model for simulating phase transitions of multivalent proteins. PLoS Comput. Biol. 2019, 15, e1007028. [Google Scholar] [CrossRef] [PubMed] [Green Version]
- Borcherds, W.; Bremer, A.; Borgia, M.B.; Mittag, T. How do intrinsically disordered protein regions encode a driving force for liquid-liquid phase separation? Curr. Opin. Struct. Biol. 2021, 67, 41–50. [Google Scholar] [CrossRef]
- Ruff, K.M.; Dar, F.; Pappu, R.V. Ligand effects on phase separation of multivalent macromolecules. Proc. Natl. Acad. Sci. USA 2021, 118, e2017184118. [Google Scholar] [CrossRef]
- Cohan, M.C.; Eddelbuettel, A.M.P.; Levin, P.A.; Pappu, R.V. Dissecting the functional contributions of the intrinsically disordered C-terminal tail of Bacillus subtilis FtsZ. J. Mol. Biol. 2020, 432, 3205–3221. [Google Scholar] [CrossRef]
- Singh, K.; Rabin, Y. Sequence effects on internal structure of droplets of associative polymers. Biophys. J. 2020, 120, 1210–1218. [Google Scholar] [CrossRef]
- Levy, Y.Y.; Mesnage, S.; Mylne, J.S.; Gendall, A.R.; Dean, C. Multiple roles of Arabidopsis VRN1 in vernalization and flowering time control. Science 2002, 297, 243–246. [Google Scholar] [CrossRef]
- Bastow, R.; Mylne, J.S.; Lister, C.; Lippman, Z.; Martienssen, R.A.; Dean, C. Vernalization requires epigenetic silencing of FLC by histone methylation. Nature 2004, 427, 164–167. [Google Scholar] [CrossRef] [PubMed]
- Mylne, J.S.; Barrett, L.; Tessadori, F.; Mesnage, S.; Johnson, L.; Bernatavichute, Y.V.; Jacobsen, S.E.; Fransz, P.; Dean, C. LHP1, the Arabidopsis homologue of HETEROCHROMATIN PROTEIN1, is required for epigenetic silencing of FLC. Proc. Natl. Acad. Sci. USA 2006, 103, 5012–5017. [Google Scholar] [CrossRef] [PubMed] [Green Version]
- Zhou, H.; Song, Z.; Zhong, S.; Zuo, L.; Qi, Z.; Qu, L.J.; Lai, L. Mechanism of DNA-induced phase separation for transcriptional repressor VRN1. Angew. Chem. Int. Ed. 2019, 58, 4858–4862. [Google Scholar] [CrossRef] [PubMed]
- Wang, Y.; Zhou, H.; Sun, X.; Huang, Q.; Li, S.; Liu, Z.; Zhang, C.; Lai, L. Charge segregation in the intrinsically disordered region governs VRN1 and DNA liquid-like phase separation robustness. J. Mol. Biol. 2021, 433, 167269. [Google Scholar] [CrossRef] [PubMed]
- Staller, M.V.; Ramirez, E.; Kotha, S.R.; Holehouse, A.S.; Pappu, R.V.; Cohen, B.A. Directed mutational scanning reveals a balance between acidic and hydrophobic residues in strong human activation domains. Cell Syst. 2022, 13, 334–345. [Google Scholar] [CrossRef] [PubMed]
- Zhou, H.X. Loops in proteins can be modeled as worm-like chains. J. Phys. Chem. B 2001, 105, 6763–6766. [Google Scholar] [CrossRef]
- Zhou, H.X. The affinity-enhancing roles of flexible linkers in two-domain DNA-binding proteins. Biochemistry 2001, 40, 15069–15073. [Google Scholar] [CrossRef]
- Zhou, H.X. Single-chain versus dimeric protein folding: Thermodynamic and kinetic consequences of covalent linkage. J. Am. Chem. Soc. 2001, 123, 6730–6731. [Google Scholar] [CrossRef]
- Mariottini, D.; Idili, A.; Nijenhuis, M.A.D.; de Greef, T.F.A.; Ricci, F. DNA-based nanodevices controlled by purely entropic linker domains. J. Am. Chem. Soc. 2018, 140, 14725–14734. [Google Scholar] [CrossRef]
- Feric, M.; Vaidya, N.; Harmon, T.S.; Mitrea, D.M.; Zhu, L.; Richardson, T.M.; Kriwacki, R.W.; Pappu, R.V.; Brangwynne, C.P. Coexisting liquid phases underlie nucleolar subcompartments. Cell 2016, 165, 1686–1697. [Google Scholar] [CrossRef] [Green Version]
- Guillen-Boixet, J.; Kopach, A.; Holehouse, A.S.; Wittmann, S.; Jahnel, M.; Schlussler, R.; Kim, K.; Trussina, I.; Wang, J.; Mateju, D.; et al. RNA-induced conformational switching and clustering of G3BP drive stress granule assembly by condensation. Cell 2020, 181, 346–361. [Google Scholar] [CrossRef] [PubMed]
- Li, M.; Liu, Z. Dimensions, energetics, and denaturant effects of the protein unstructured state. Protein Sci. 2016, 25, 734–747. [Google Scholar] [CrossRef] [PubMed]
- Liu, Z.; Huang, Y. Advantages of proteins being disordered. Protein Sci. 2014, 23, 539–550. [Google Scholar] [CrossRef] [PubMed] [Green Version]
- Whyte, W.A.; Orlando, D.A.; Hnisz, D.; Abraham, B.J.; Lin, C.Y.; Kagey, M.H.; Rahl, P.B.; Lee, T.I.; Young, R.A. Master transcription factors and mediator establish super-enhancers at key cell identity genes. Cell 2013, 153, 307–319. [Google Scholar] [CrossRef] [PubMed] [Green Version]
- Zaret, K.S. Pioneer transcription factors initiating gene network changes. Annu. Rev. Genet. 2020, 54, 367–385. [Google Scholar] [CrossRef] [PubMed]
- Capasso Palmiero, U.; Kuffner, A.M.; Krumeich, F.; Faltova, L.; Arosio, P. Adaptive chemoenzymatic microreactors composed of inorganic nanoparticles and bioinspired intrinsically disordered proteins. Angew. Chem. Int. Ed. 2020, 59, 8138–8142. [Google Scholar] [CrossRef]
- van Dongen, E.; Evers, T.H.; Dekkers, L.M.; Meijer, E.W.; Klomp, L.W.J.; Merkx, M. Variation of linker length in ratiometric fluorescent sensor proteins allows rational tuning of Zn(II) affinity in the picomolar to femtomolar range. J. Am. Chem. Soc. 2007, 129, 3494–3495. [Google Scholar] [CrossRef]
- Borcherds, W.; Becker, A.; Chen, L.; Chen, J.; Chemes, L.B.; Daughdrill, G.W. Optimal affinity enhancement by a conserved flexible linker controls p53 mimicry in MdmX. Biophys. J. 2017, 112, 2038–2042. [Google Scholar] [CrossRef] [Green Version]
- Krishnamurthy, V.M.; Semetey, V.; Bracher, P.J.; Shen, N.; Whitesides, G.M. Dependence of effective molarity on linker length for an intramolecular protein-ligand system. J. Am. Chem. Soc. 2007, 129, 1312–1320. [Google Scholar] [CrossRef] [Green Version]
Figure 1.
Schematic diagram of Ceff calculations. Top: two B3 domains in VRN1 bind to DNA cooperatively, the dissociation constant of which can be quantitated by . denotes the end-to-end distance of the linker in the binding complex. Bottom: two B3 domains bind to DNA independently, the dissociation constant of which can be quantitated by . The linker in VRN1 provides effective local concentration to enhance the binding of VRN1 to DNA, which can be quantitated by the ratio of .

Figure 2.
Fitted correlation between the VRN1 linker length and binding affinity to DNA. The linker length is measured by the number of residues. Scatterings are experimental data, as listed in Table 1. Solid lines are the fitting results by (A) the WLC model and (B) the RMC model with Equations (2) and (4). The resulting fitted parameters are 31.6 Å and in (A) and Å and in (B).
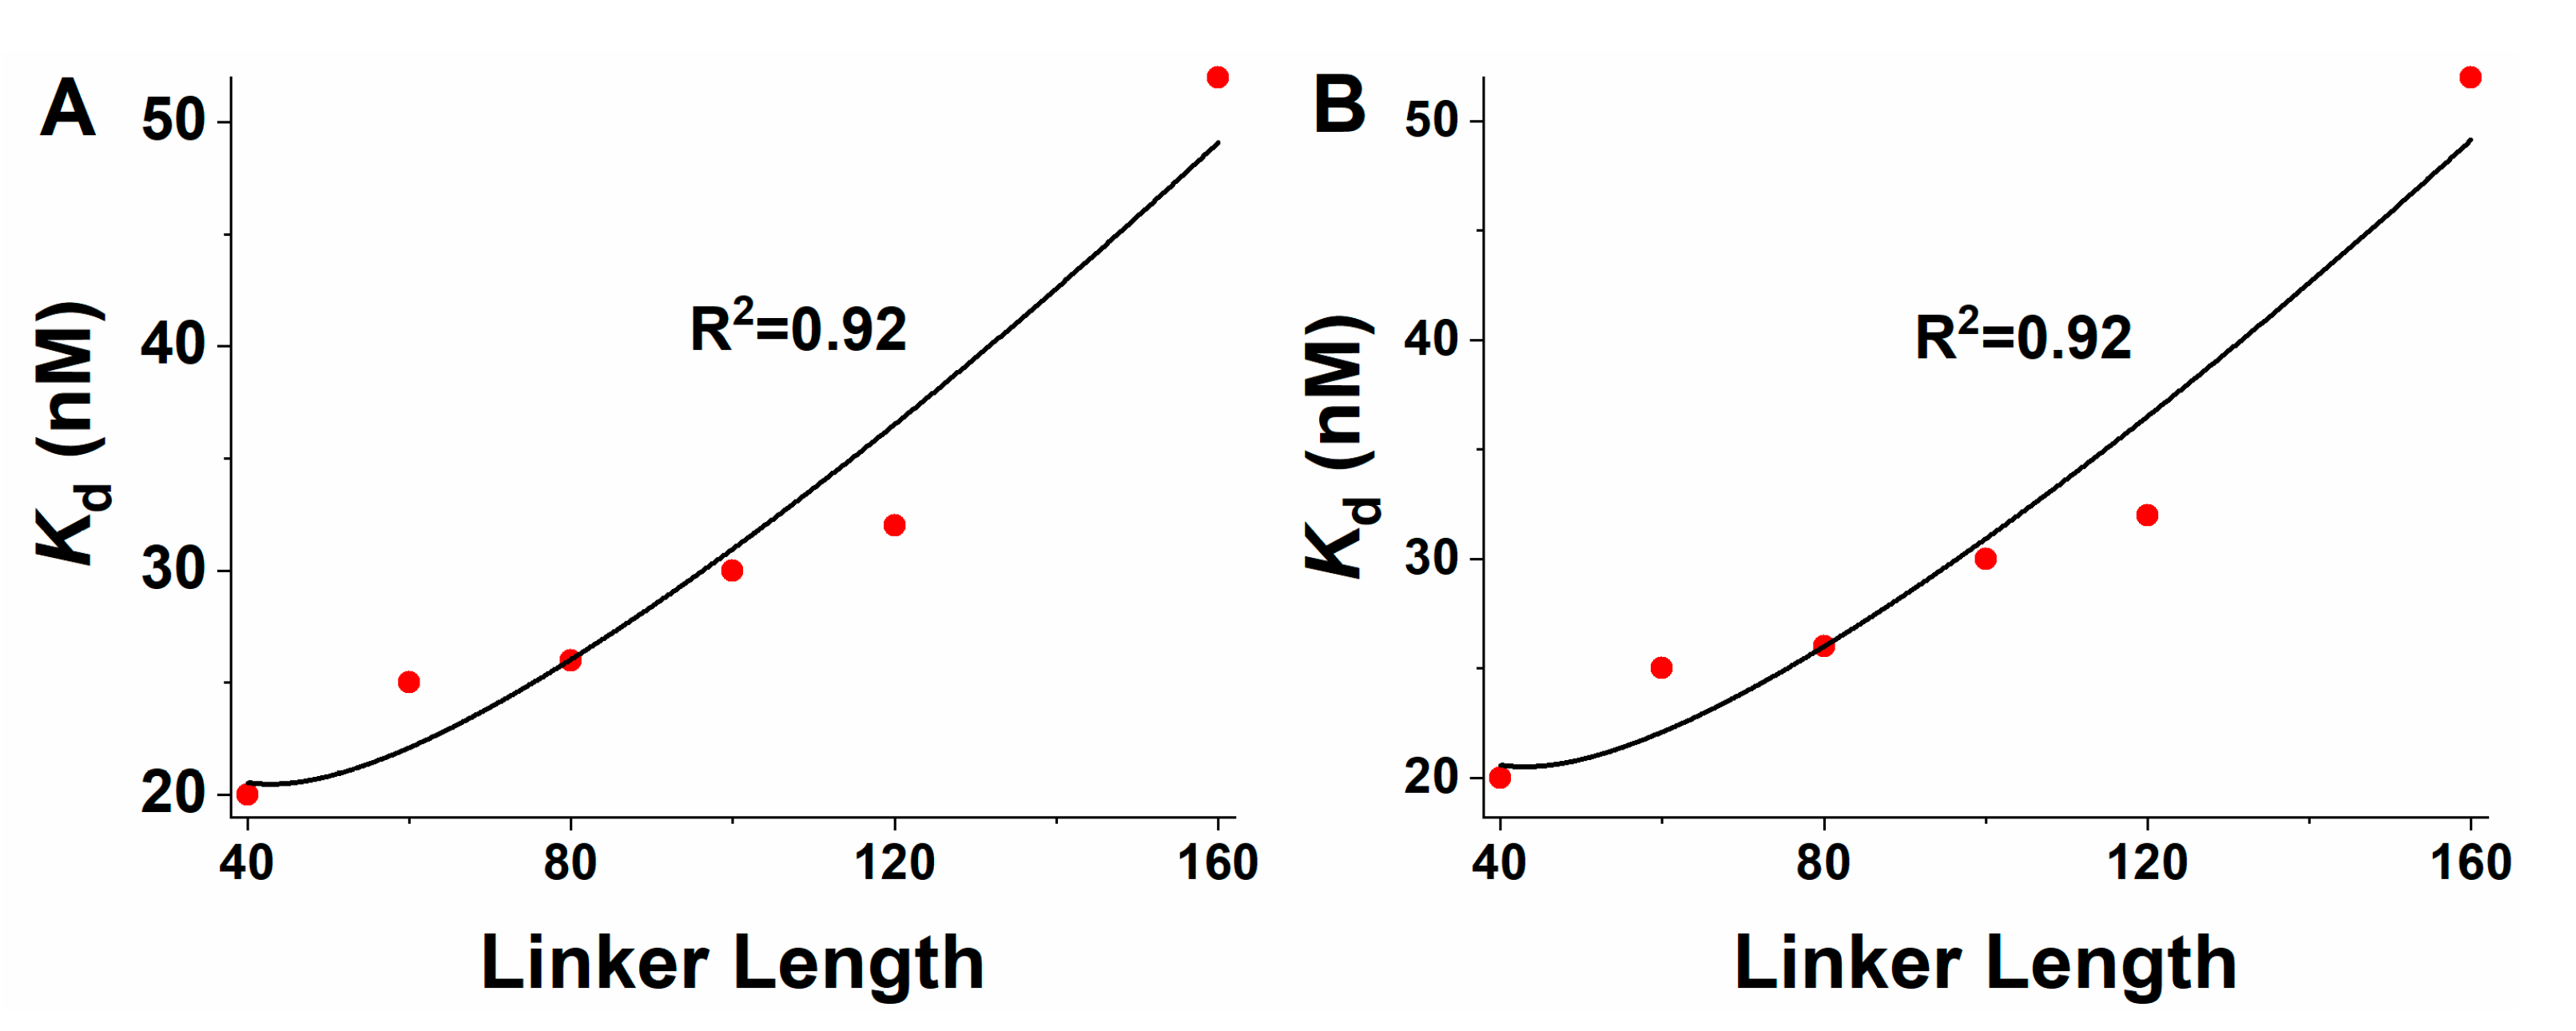
Figure 3.
Prediction of the optimal IDL linker length to achieve the strongest binding affinity to DNA, using a WLC model (red line) and a RMC model (blue line). The dotted grey line indicated the optimal linker length (43 residues), under which the predicted is the minimum (20.5 nM).
Figure 3.
Prediction of the optimal IDL linker length to achieve the strongest binding affinity to DNA, using a WLC model (red line) and a RMC model (blue line). The dotted grey line indicated the optimal linker length (43 residues), under which the predicted is the minimum (20.5 nM).

Figure 4.
Influence of the neutral-linker length on the simulated phase behaviors. (A) Phase diagrams of the systems with different linker lengths (). The red line shows the contour of = 0.025 and the orange dotted line indicates the contour of = 0.5. The left cyan area indicates solution phase; the right green phase indicates gelation phase; the purple area indicates phase separation without gelation and the grey area indicates phase separation with gelation. refers to the reduced temperature. (B,C) Contour of = 0.025 (B) and = 0.5 (C) for different systems. To make the interpretation more accessible, an approximation was made to transform a reduced concentration of /Voxel to 1 μM.

Figure 5.
Phase behaviors for the systems with charged patches (a positively and a negatively charged patch) on the linker. (A) Phase diagrams of systems with different linker lengths. The used line and color scheme is the same as that in Figure 3. (B,C) Contour of = 0.025 (B) and = 0.5 (C) for different systems.
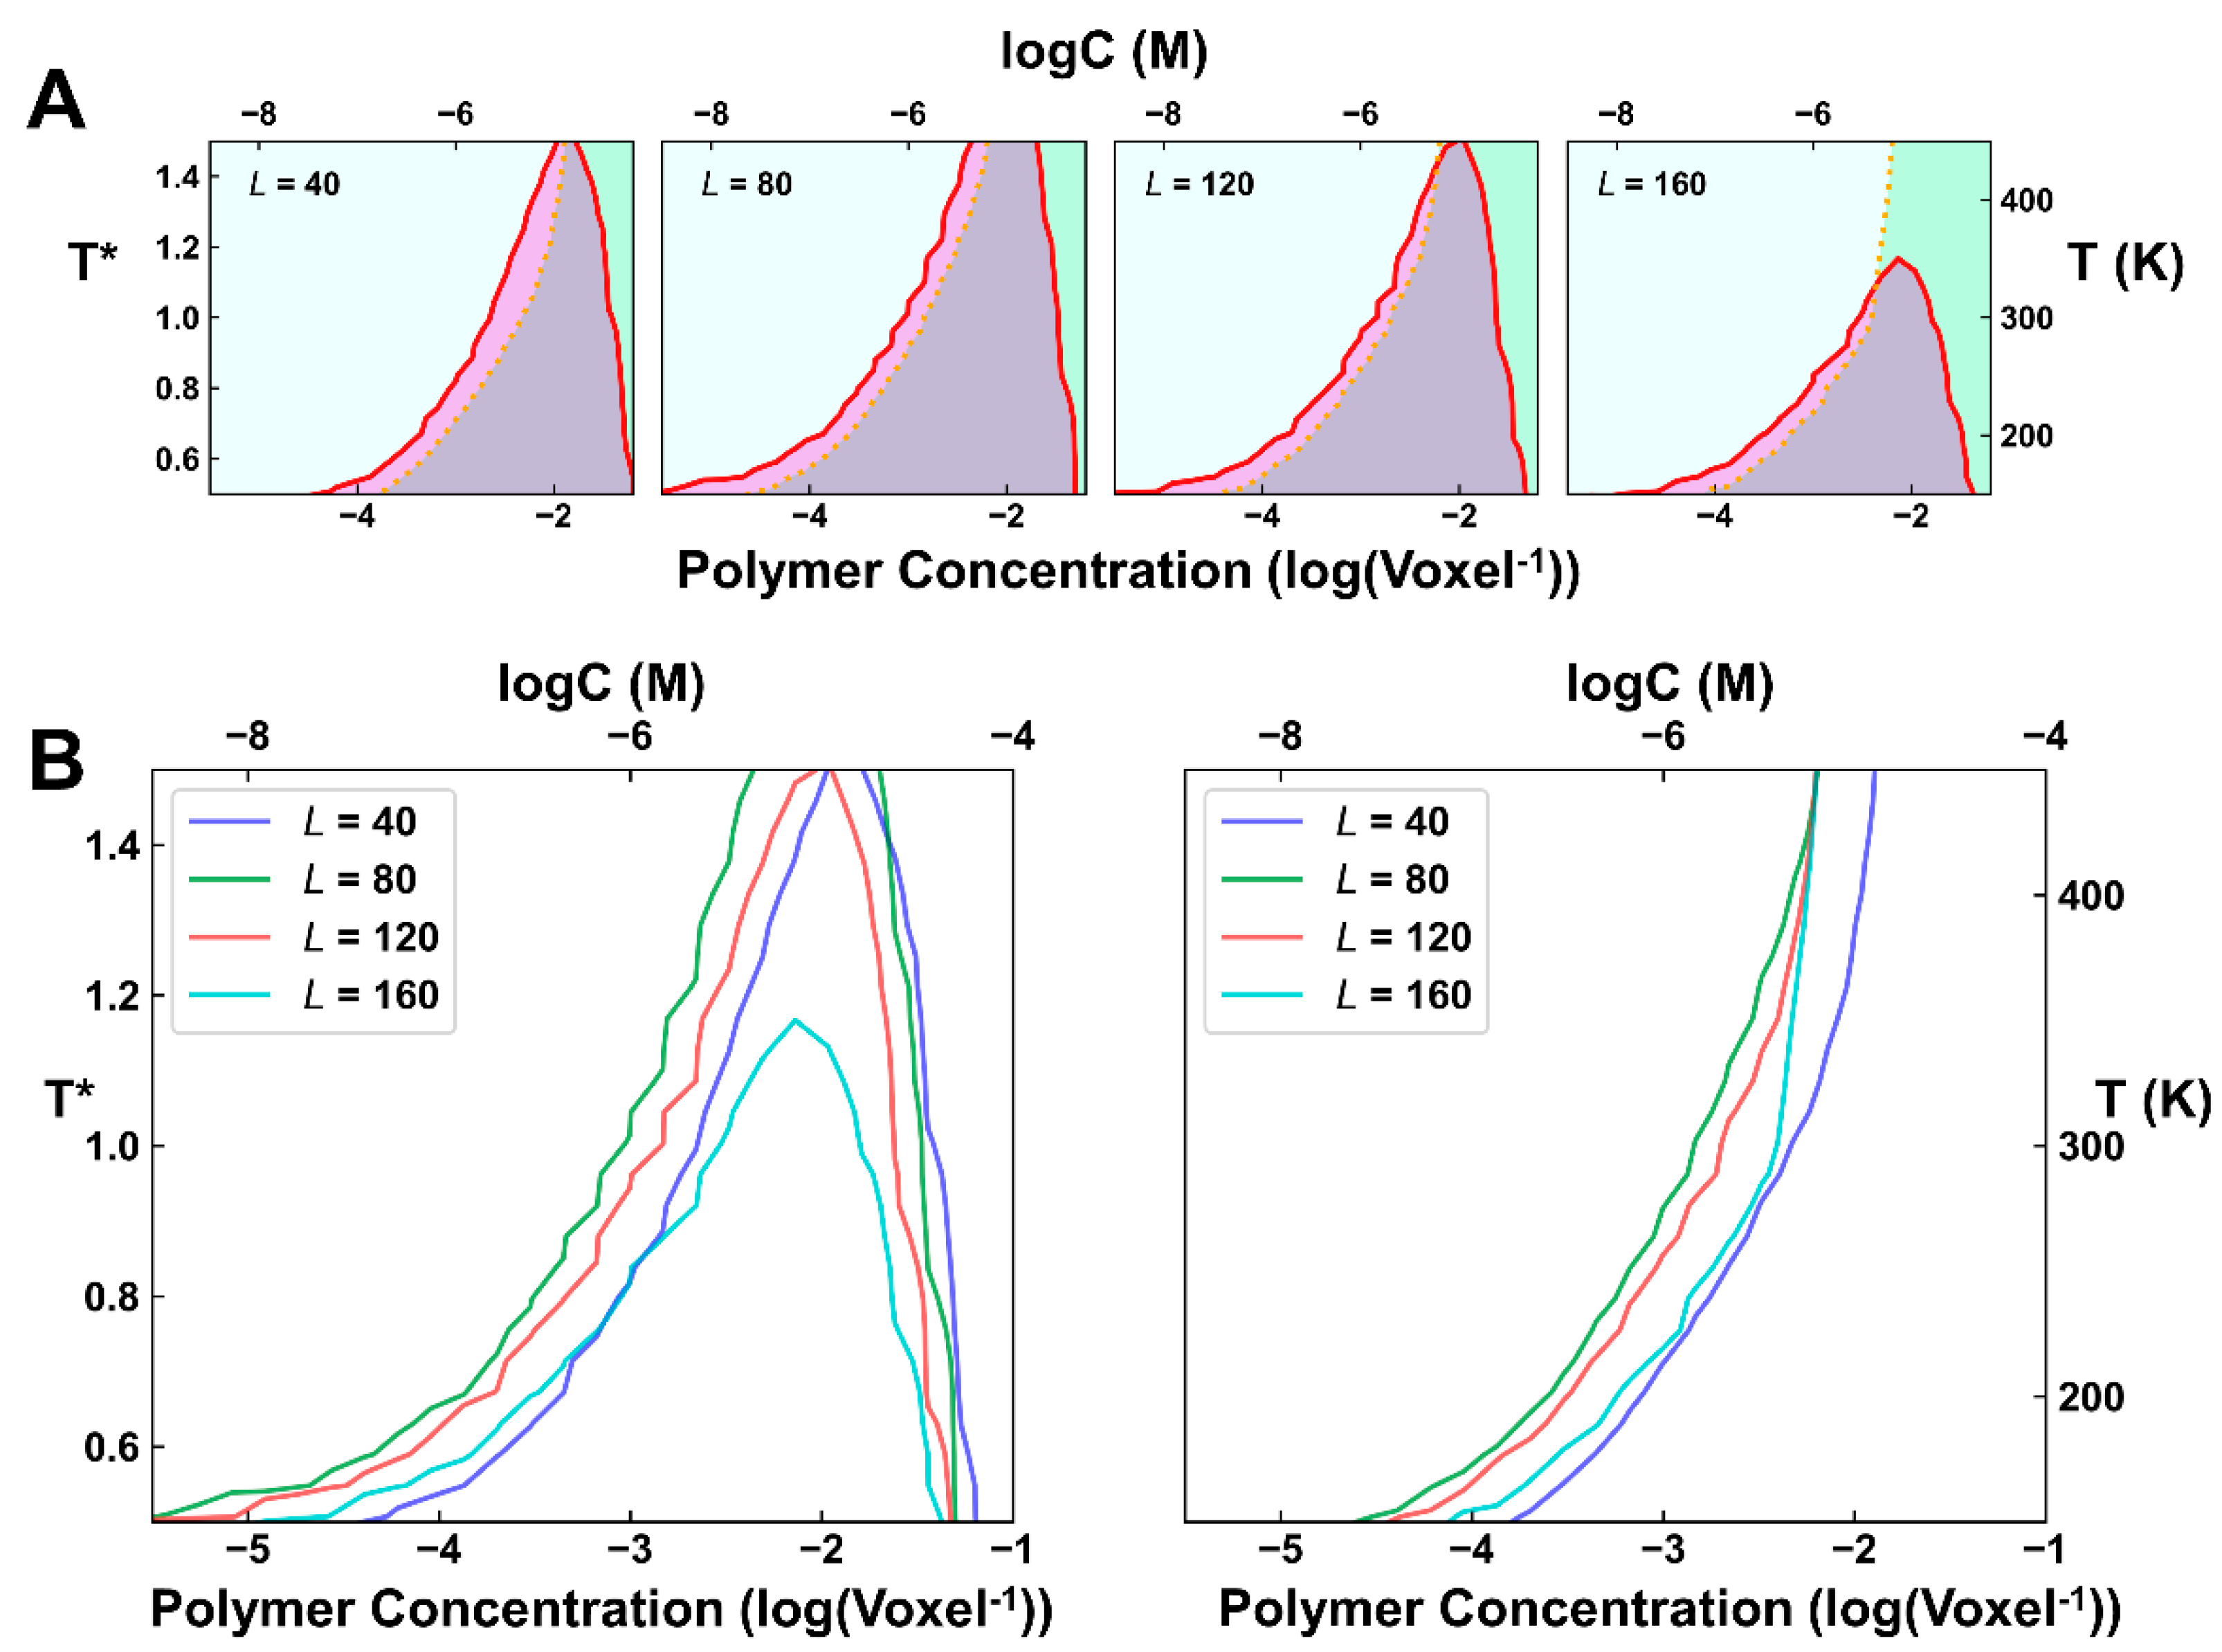
Figure 6.
Influence of the linker patch charge neutral on the phase behaviors (L = 40). (A,B) Contour of = 0.025 (A) and = 0.5 (B) for systems with a positively and a negatively charged patch. The label ‘+2’, ‘+4’, ‘+6’ refers to the absolute net charge for each charged patch. The label ‘1100’ refers to the linker architecture, in which two consecutive positively charged patches (that is ‘1’) connected to two consecutive negatively charged patches (that is ‘0’).


Table 1.
The fitting results of WLC and RMC with experimental data.
| Name | Apparent Kd from Ref. [44] (nM) | Ceff (mM) a | RMC-Kd | RMC-Ceff | WLC-Kd | WLC-Ceff |
|---|---|---|---|---|---|---|
| Single B3 | 753 | |||||
| PSN40 | 20 | 0.0284 | 21.4 | 0.0265 | 21.4 | 0.0265 |
| PSN60 | 25 | 0.0227 | 21.8 | 0.0260 | 21.7 | 0.0261 |
| PSN80 | 26 | 0.0218 | 24.9 | 0.0227 | 24.9 | 0.0227 |
| PSN100 | 30 | 0.0189 | 29.2 | 0.0194 | 29.2 | 0.0194 |
| PSN120 | 32 | 0.0177 | 34.1 | 0.0166 | 34.1 | 0.0166 |
| PSN160 | 52 | 0.0109 | 45.2 | 0.0125 | 45.2 | 0.0126 |
a: the was calculated using Equation (1).
Publisher’s Note: MDPI stays neutral with regard to jurisdictional claims in published maps and institutional affiliations. |
© 2022 by the authors. Licensee MDPI, Basel, Switzerland. This article is an open access article distributed under the terms and conditions of the Creative Commons Attribution (CC BY) license (https://creativecommons.org/licenses/by/4.0/).
Share and Cite
MDPI and ACS Style
Huang, Q.; Wang, Y.; Liu, Z.; Lai, L. The Regulatory Roles of Intrinsically Disordered Linker in VRN1-DNA Phase Separation. Int. J. Mol. Sci. 2022, 23, 4594. https://doi.org/10.3390/ijms23094594
AMA Style
Huang Q, Wang Y, Liu Z, Lai L. The Regulatory Roles of Intrinsically Disordered Linker in VRN1-DNA Phase Separation. International Journal of Molecular Sciences. 2022; 23(9):4594. https://doi.org/10.3390/ijms23094594
Chicago/Turabian StyleHuang, Qiaojing, Yanyan Wang, Zhirong Liu, and Luhua Lai. 2022. "The Regulatory Roles of Intrinsically Disordered Linker in VRN1-DNA Phase Separation" International Journal of Molecular Sciences 23, no. 9: 4594. https://doi.org/10.3390/ijms23094594
Note that from the first issue of 2016, this journal uses article numbers instead of page numbers. See further details here.