
TNF-α Induced Myotube Atrophy in C2C12 Cell Line Uncovers Putative Inflammatory-Related lncRNAs Mediating Muscle Wasting

 , , , and
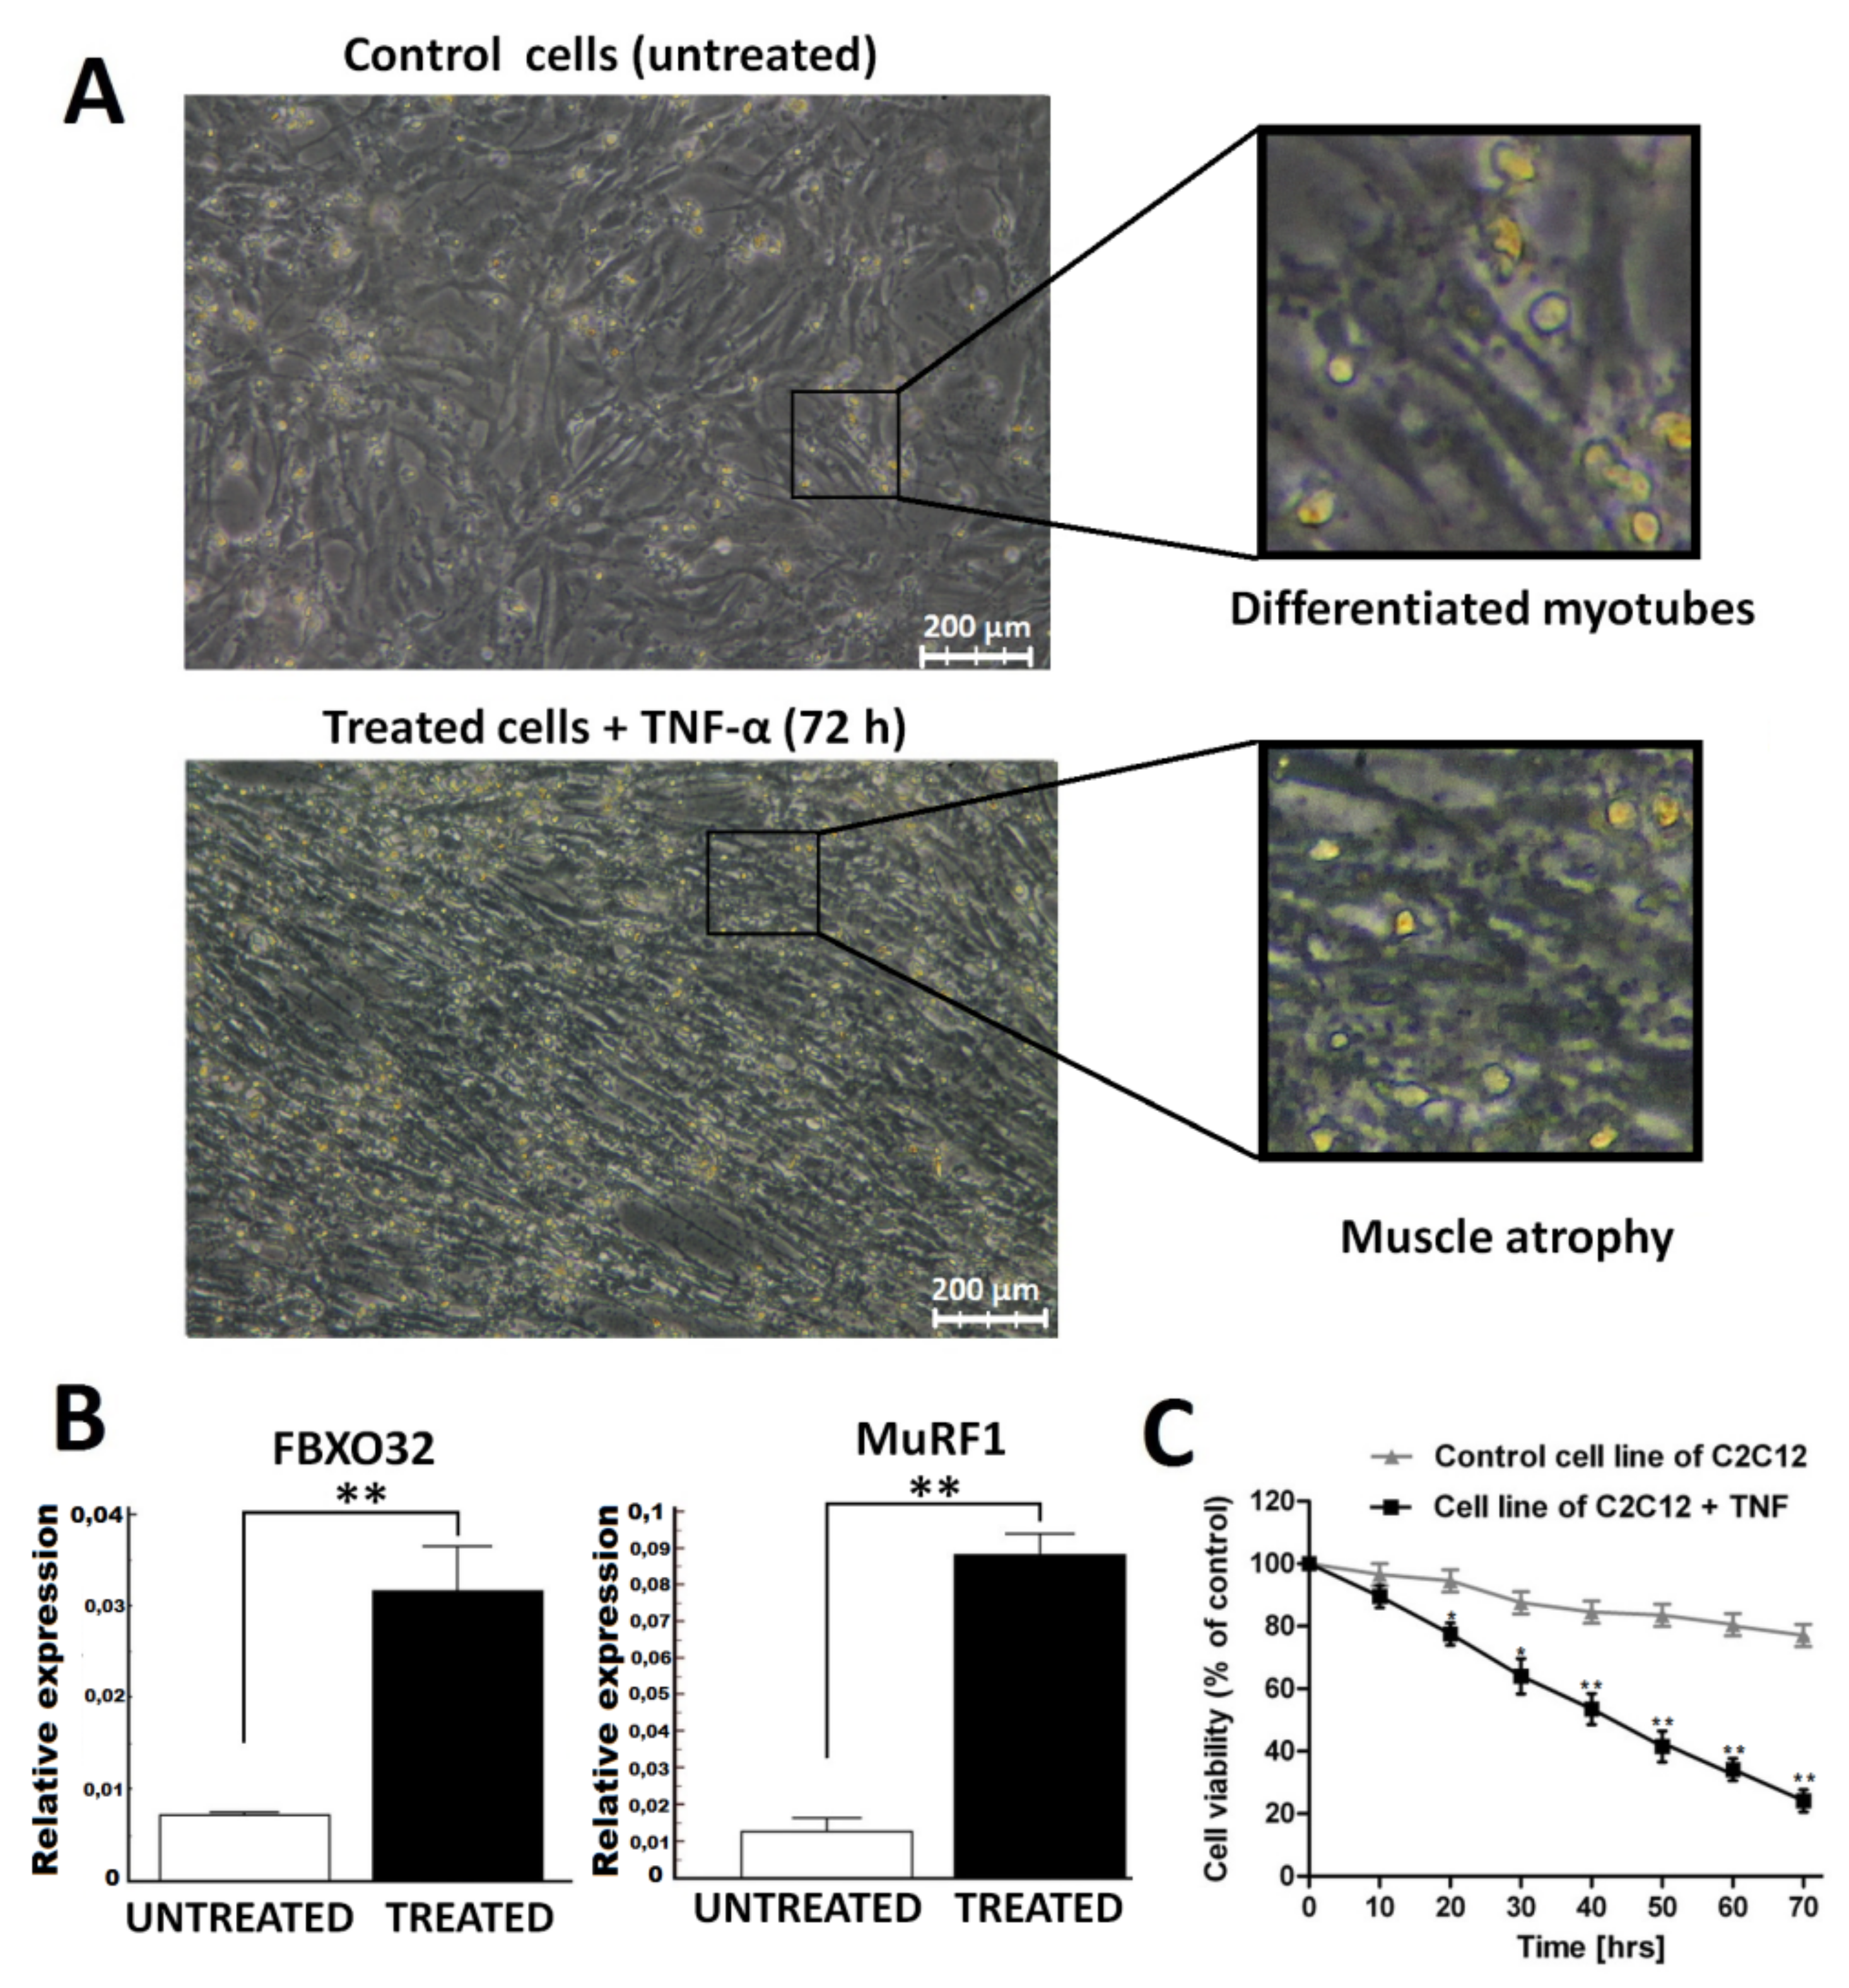
Abstract
:1. Introduction
2. Results
2.1. Atrophy Model
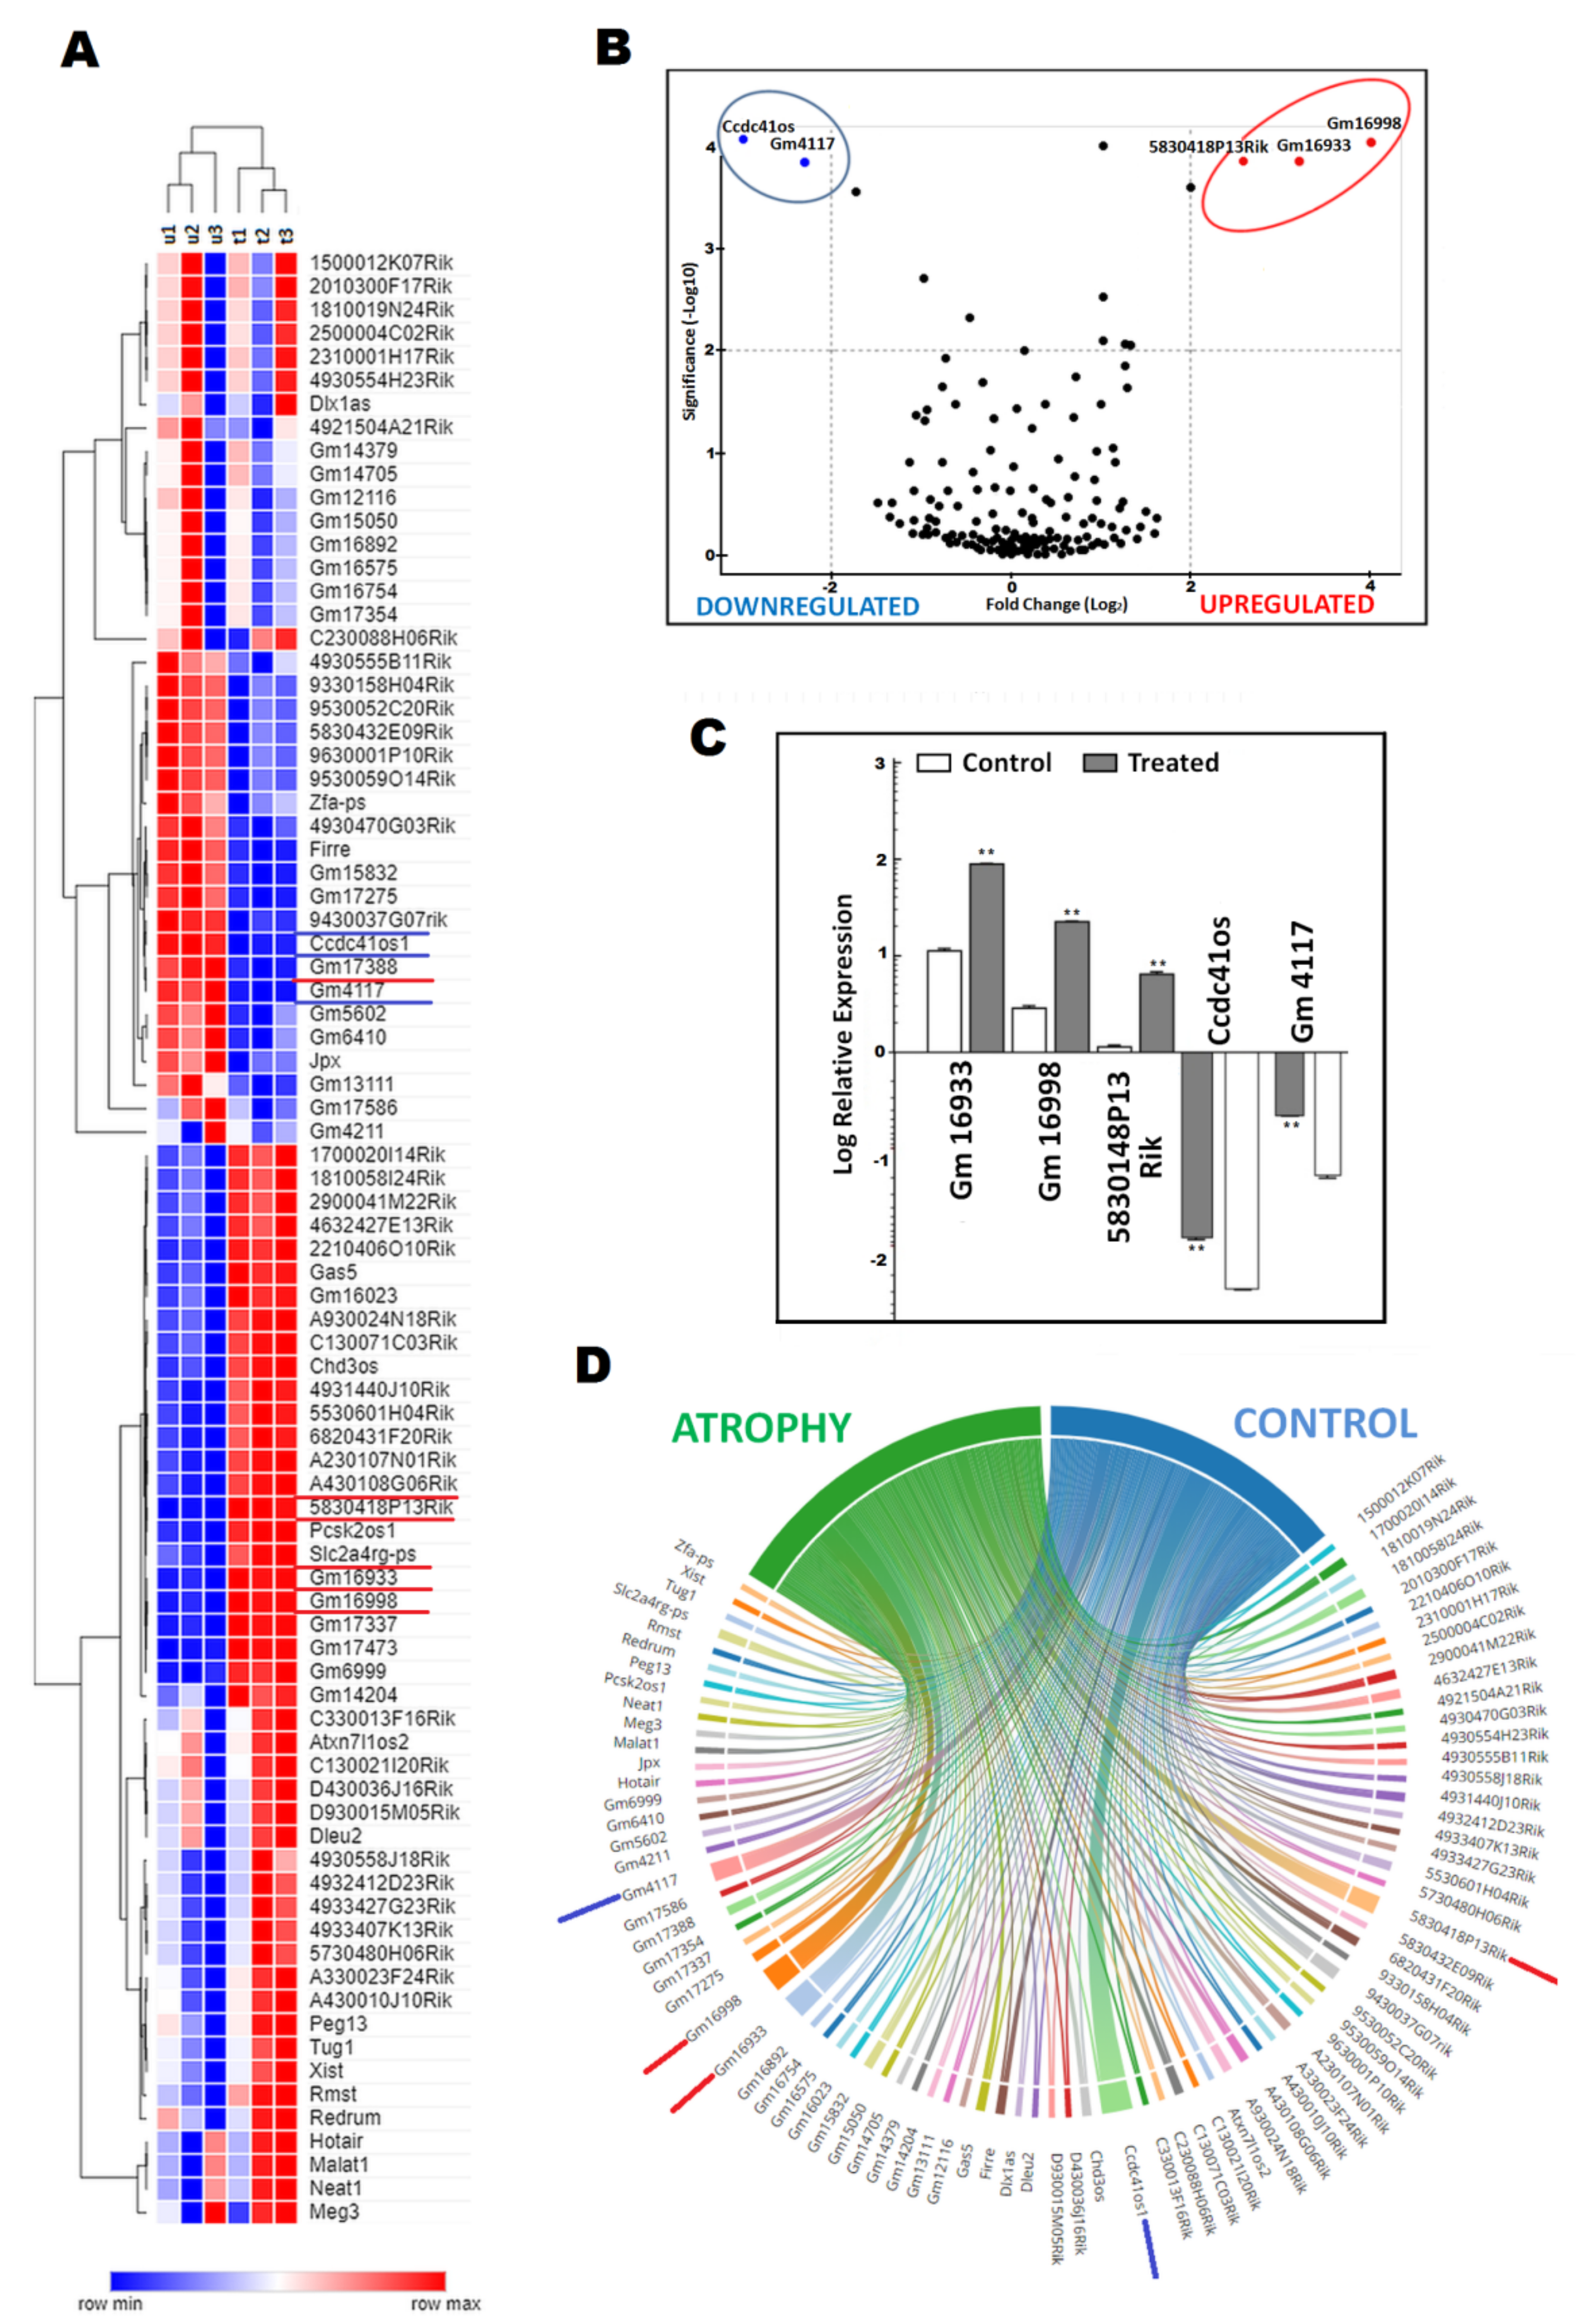
2.2. DElncRNA
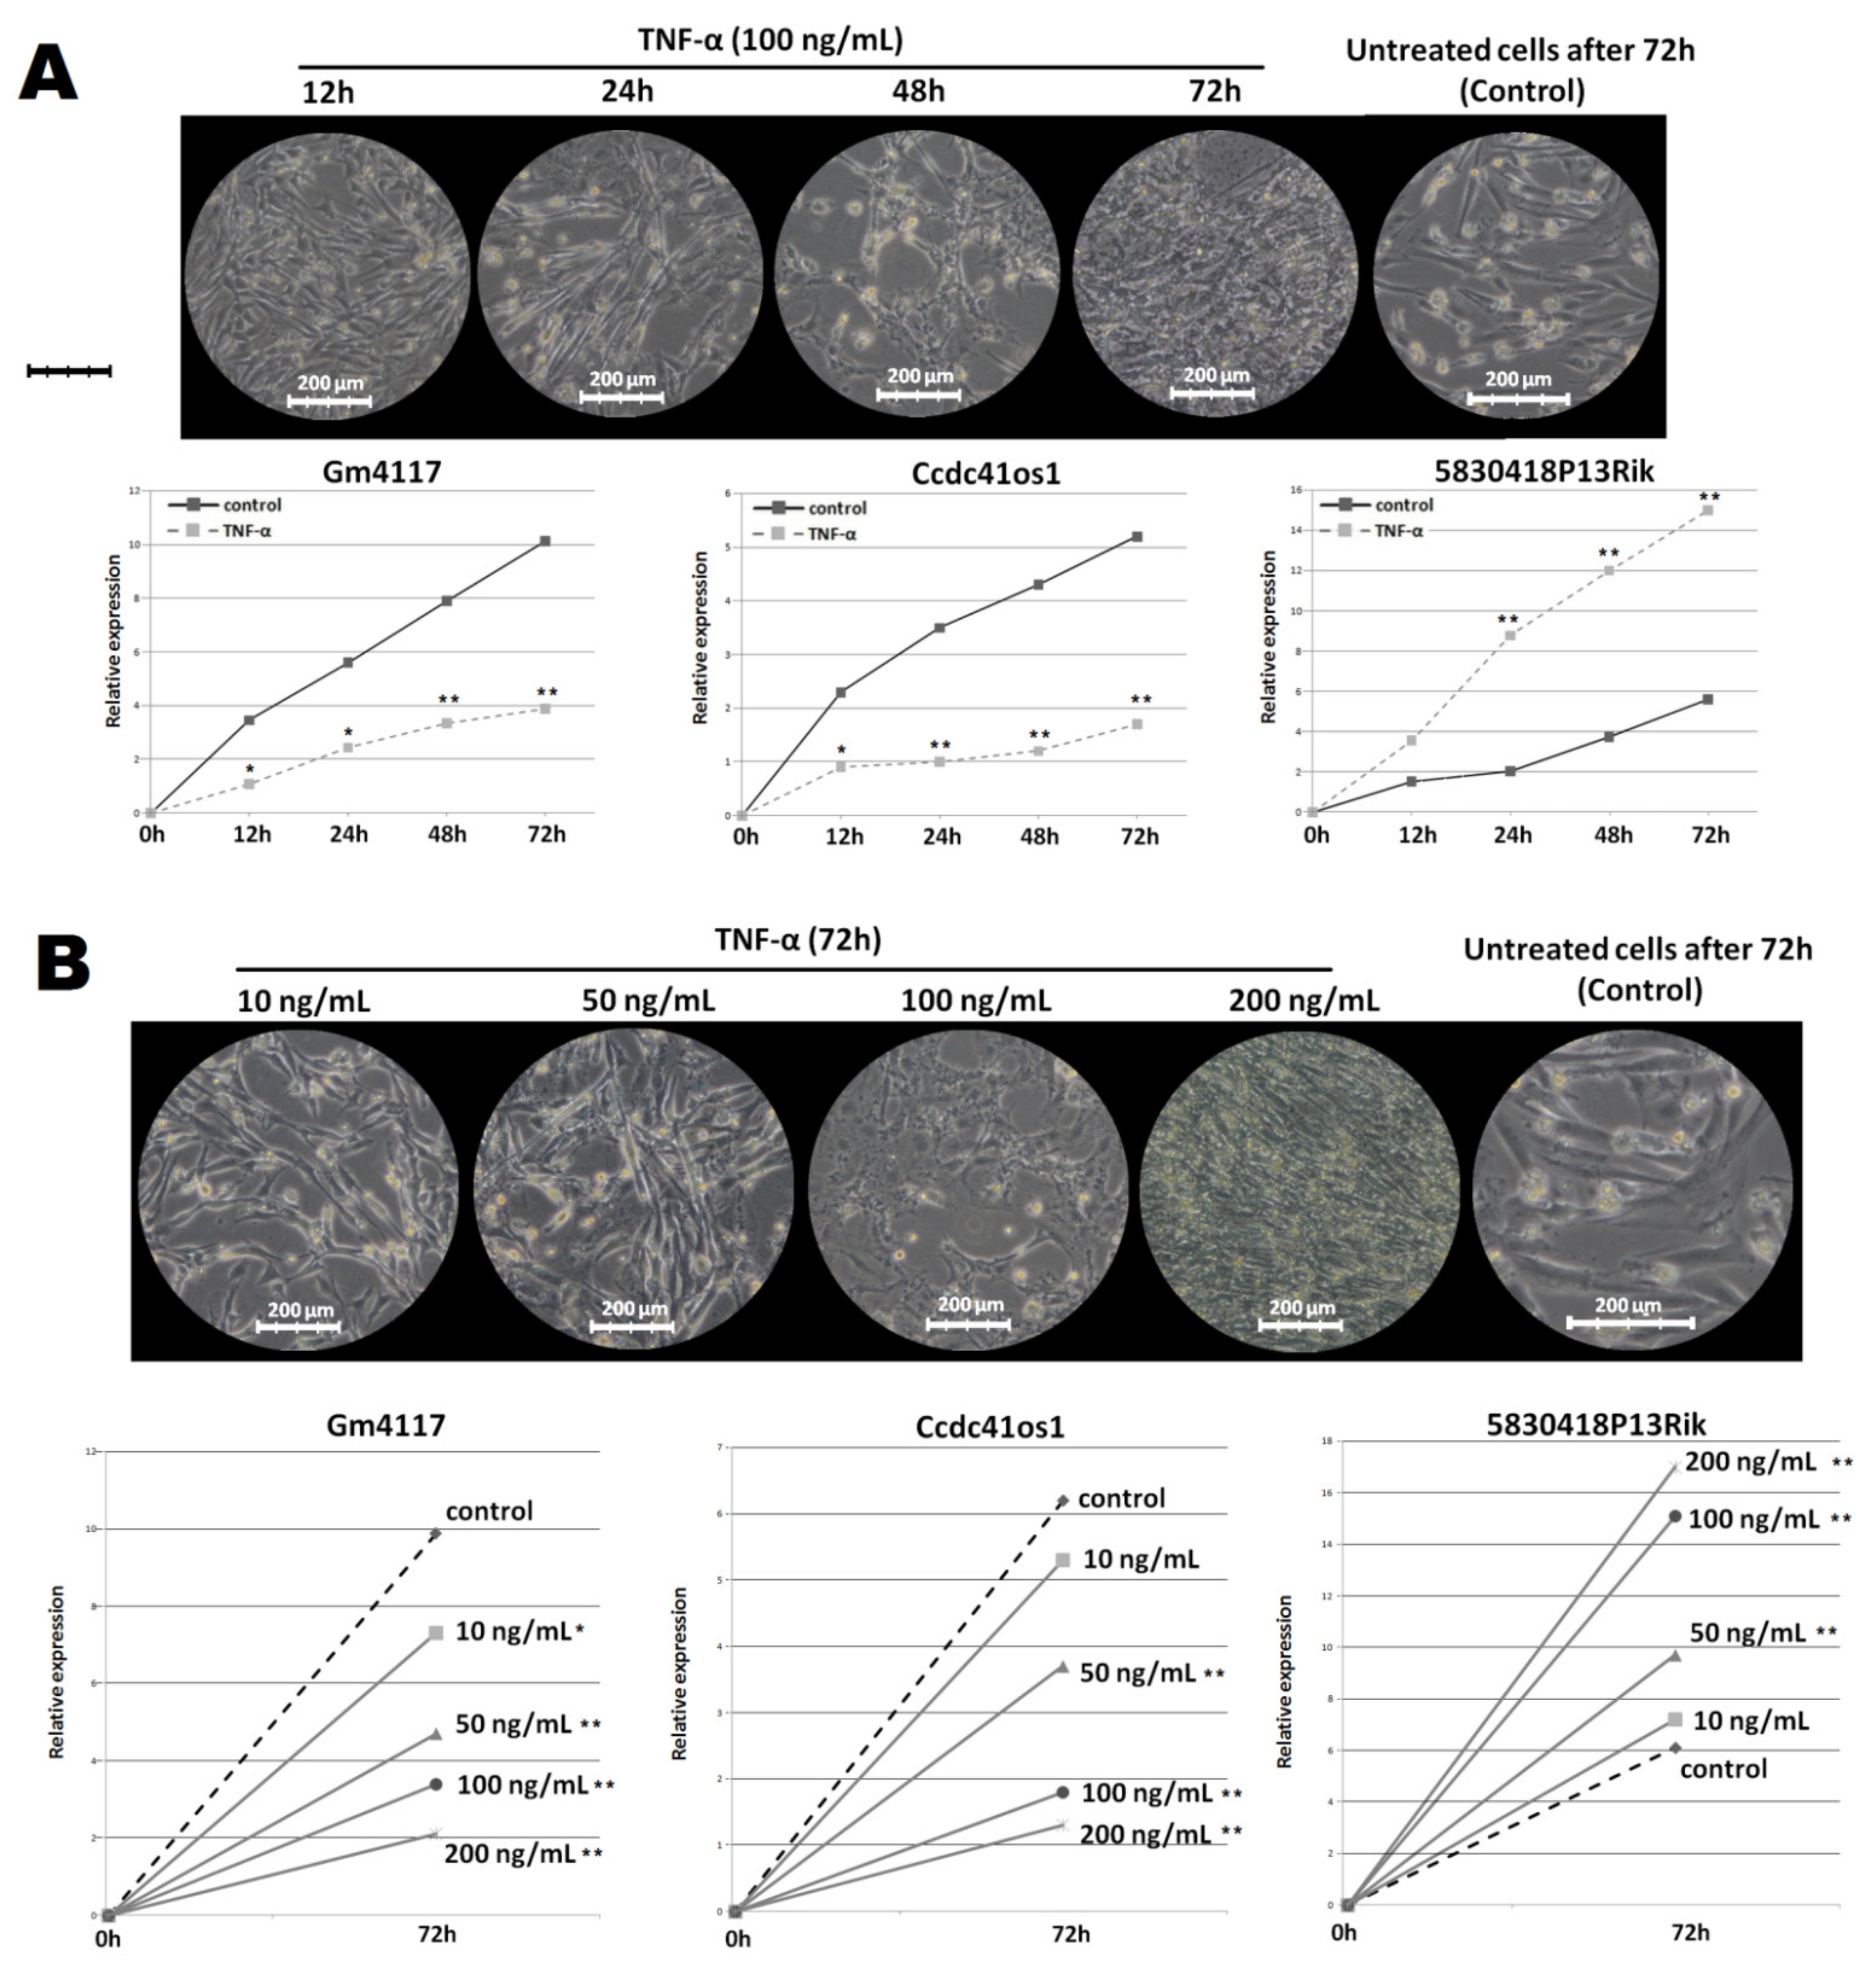
2.3. Changes in the Expression of the Top DElncRNA under Different Treatment Conditions
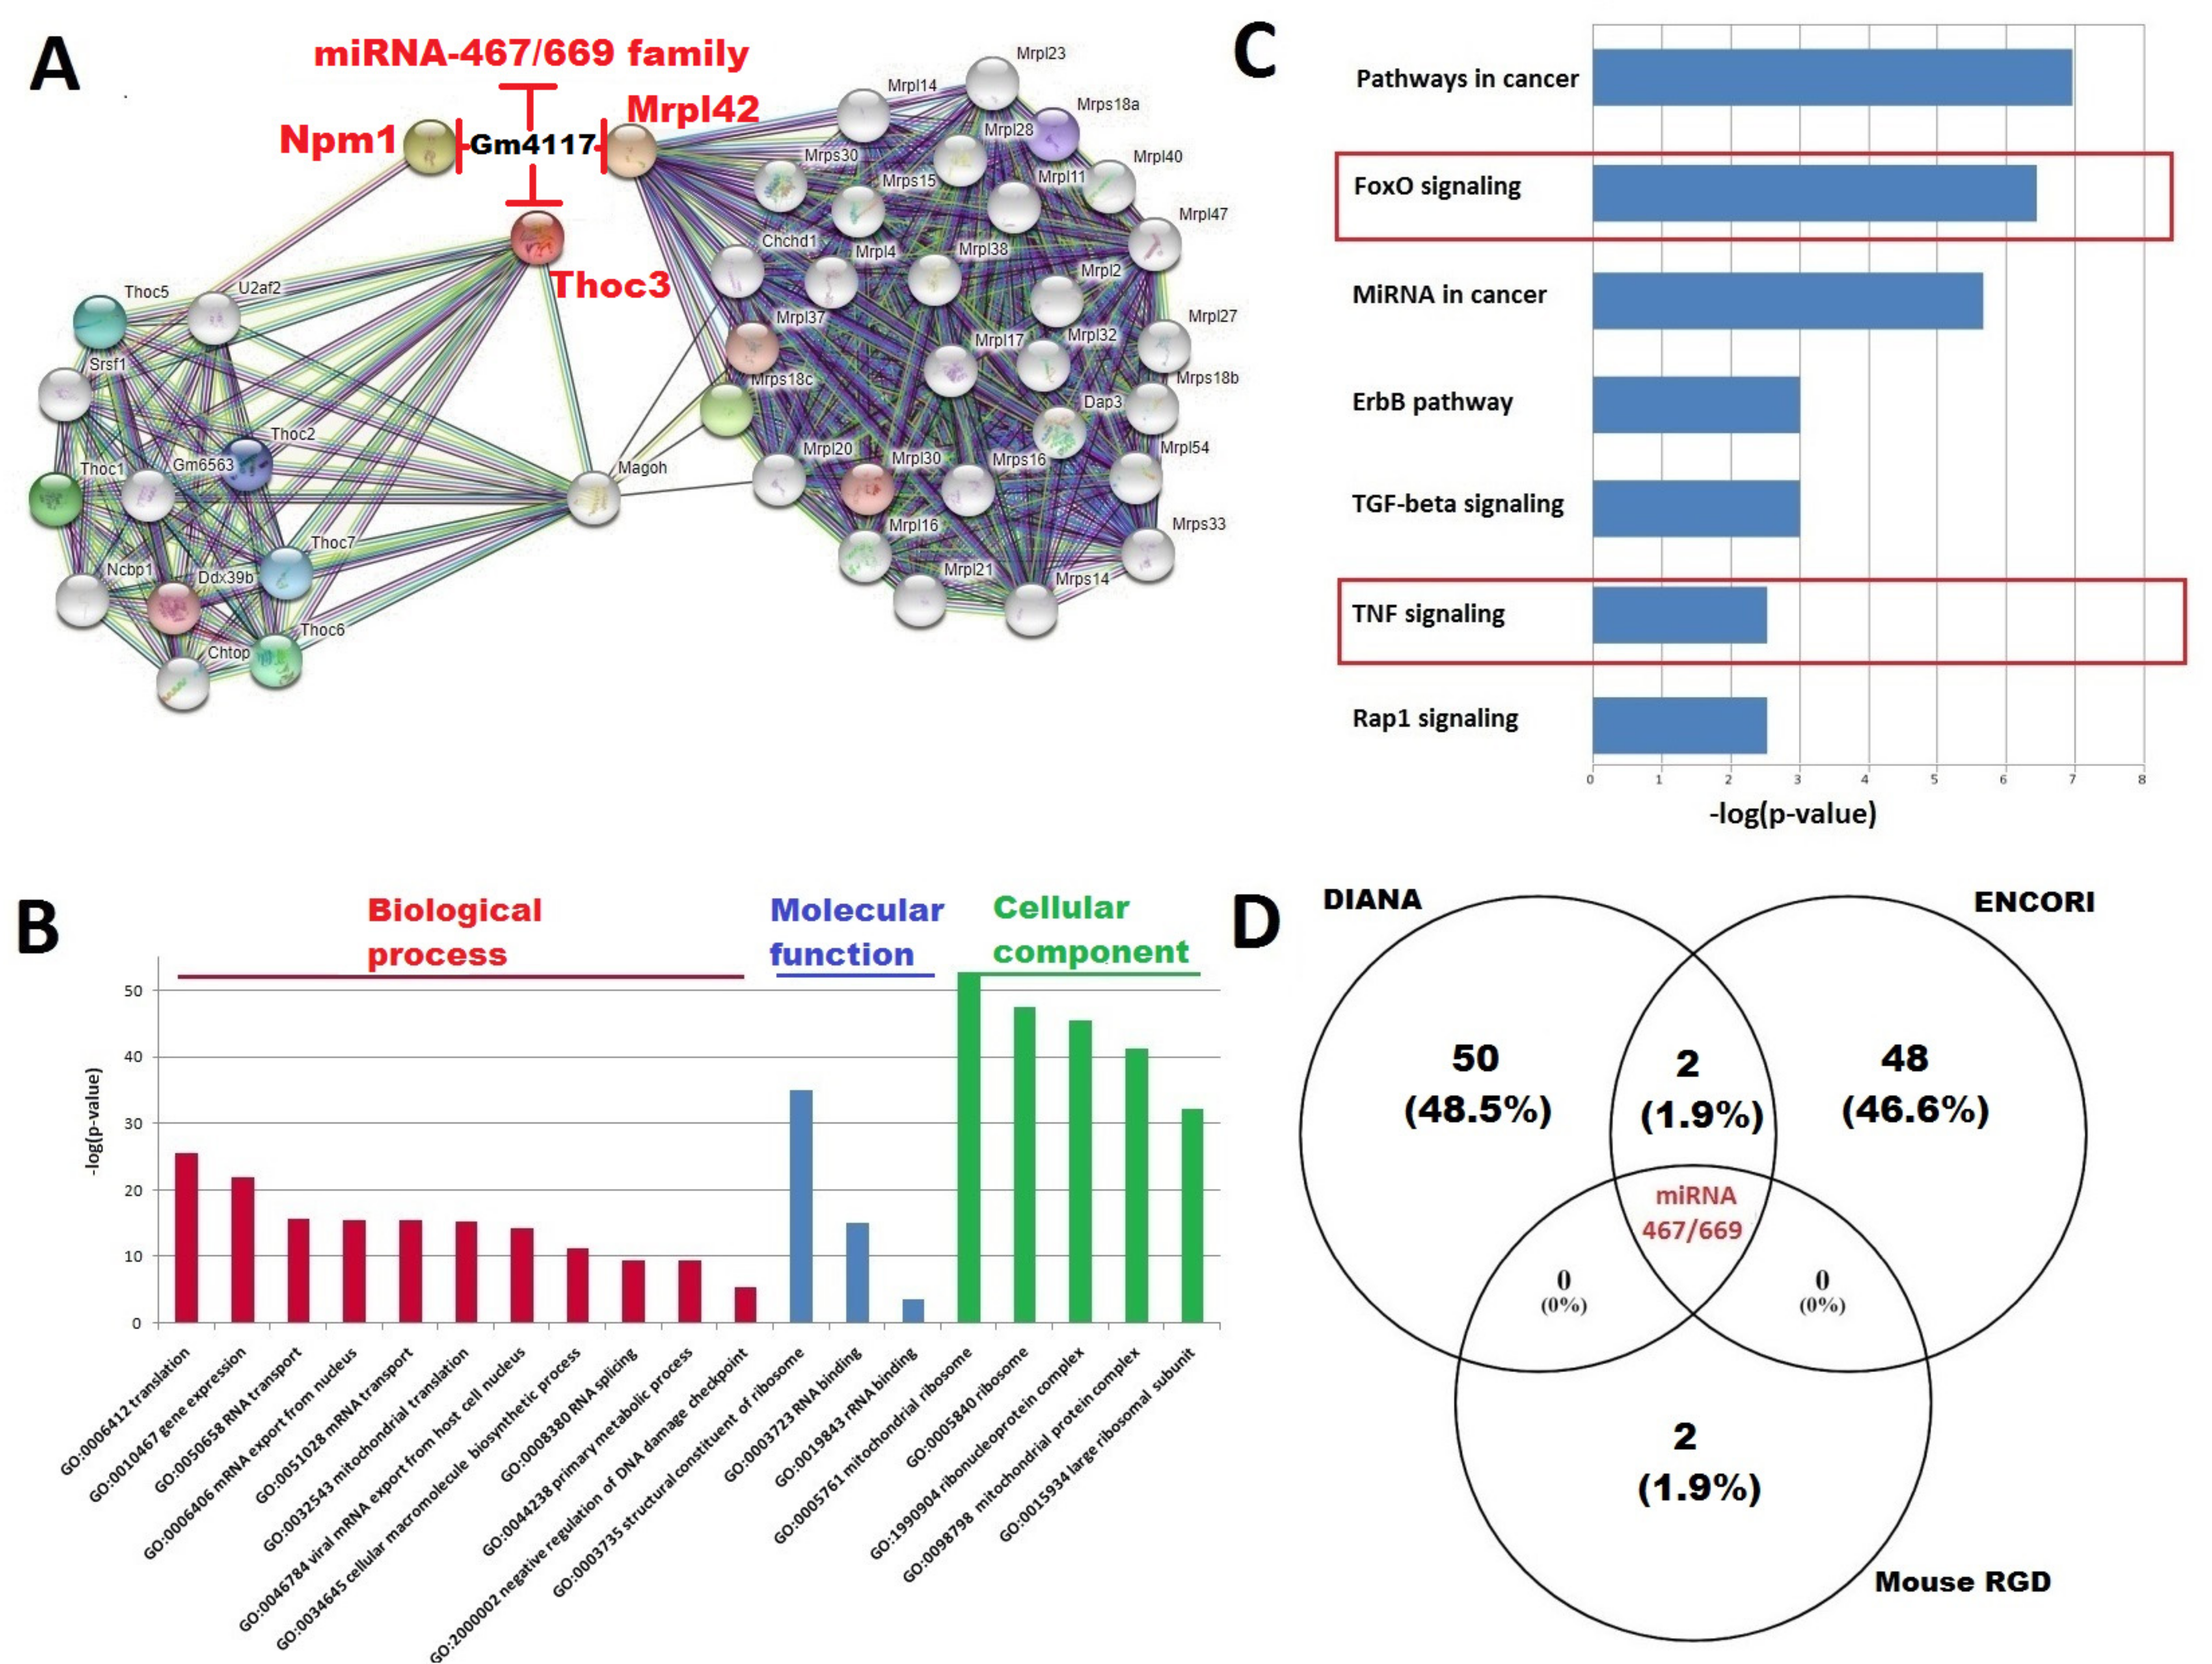
2.4. Construction of the Interaction Network between Top DElncRNA-mRNA and miRNA; Functional Annotation of Key DElncRNA, miRNAs, and PPI Network
2.5. Gm4117: ENSMUSG00000089940
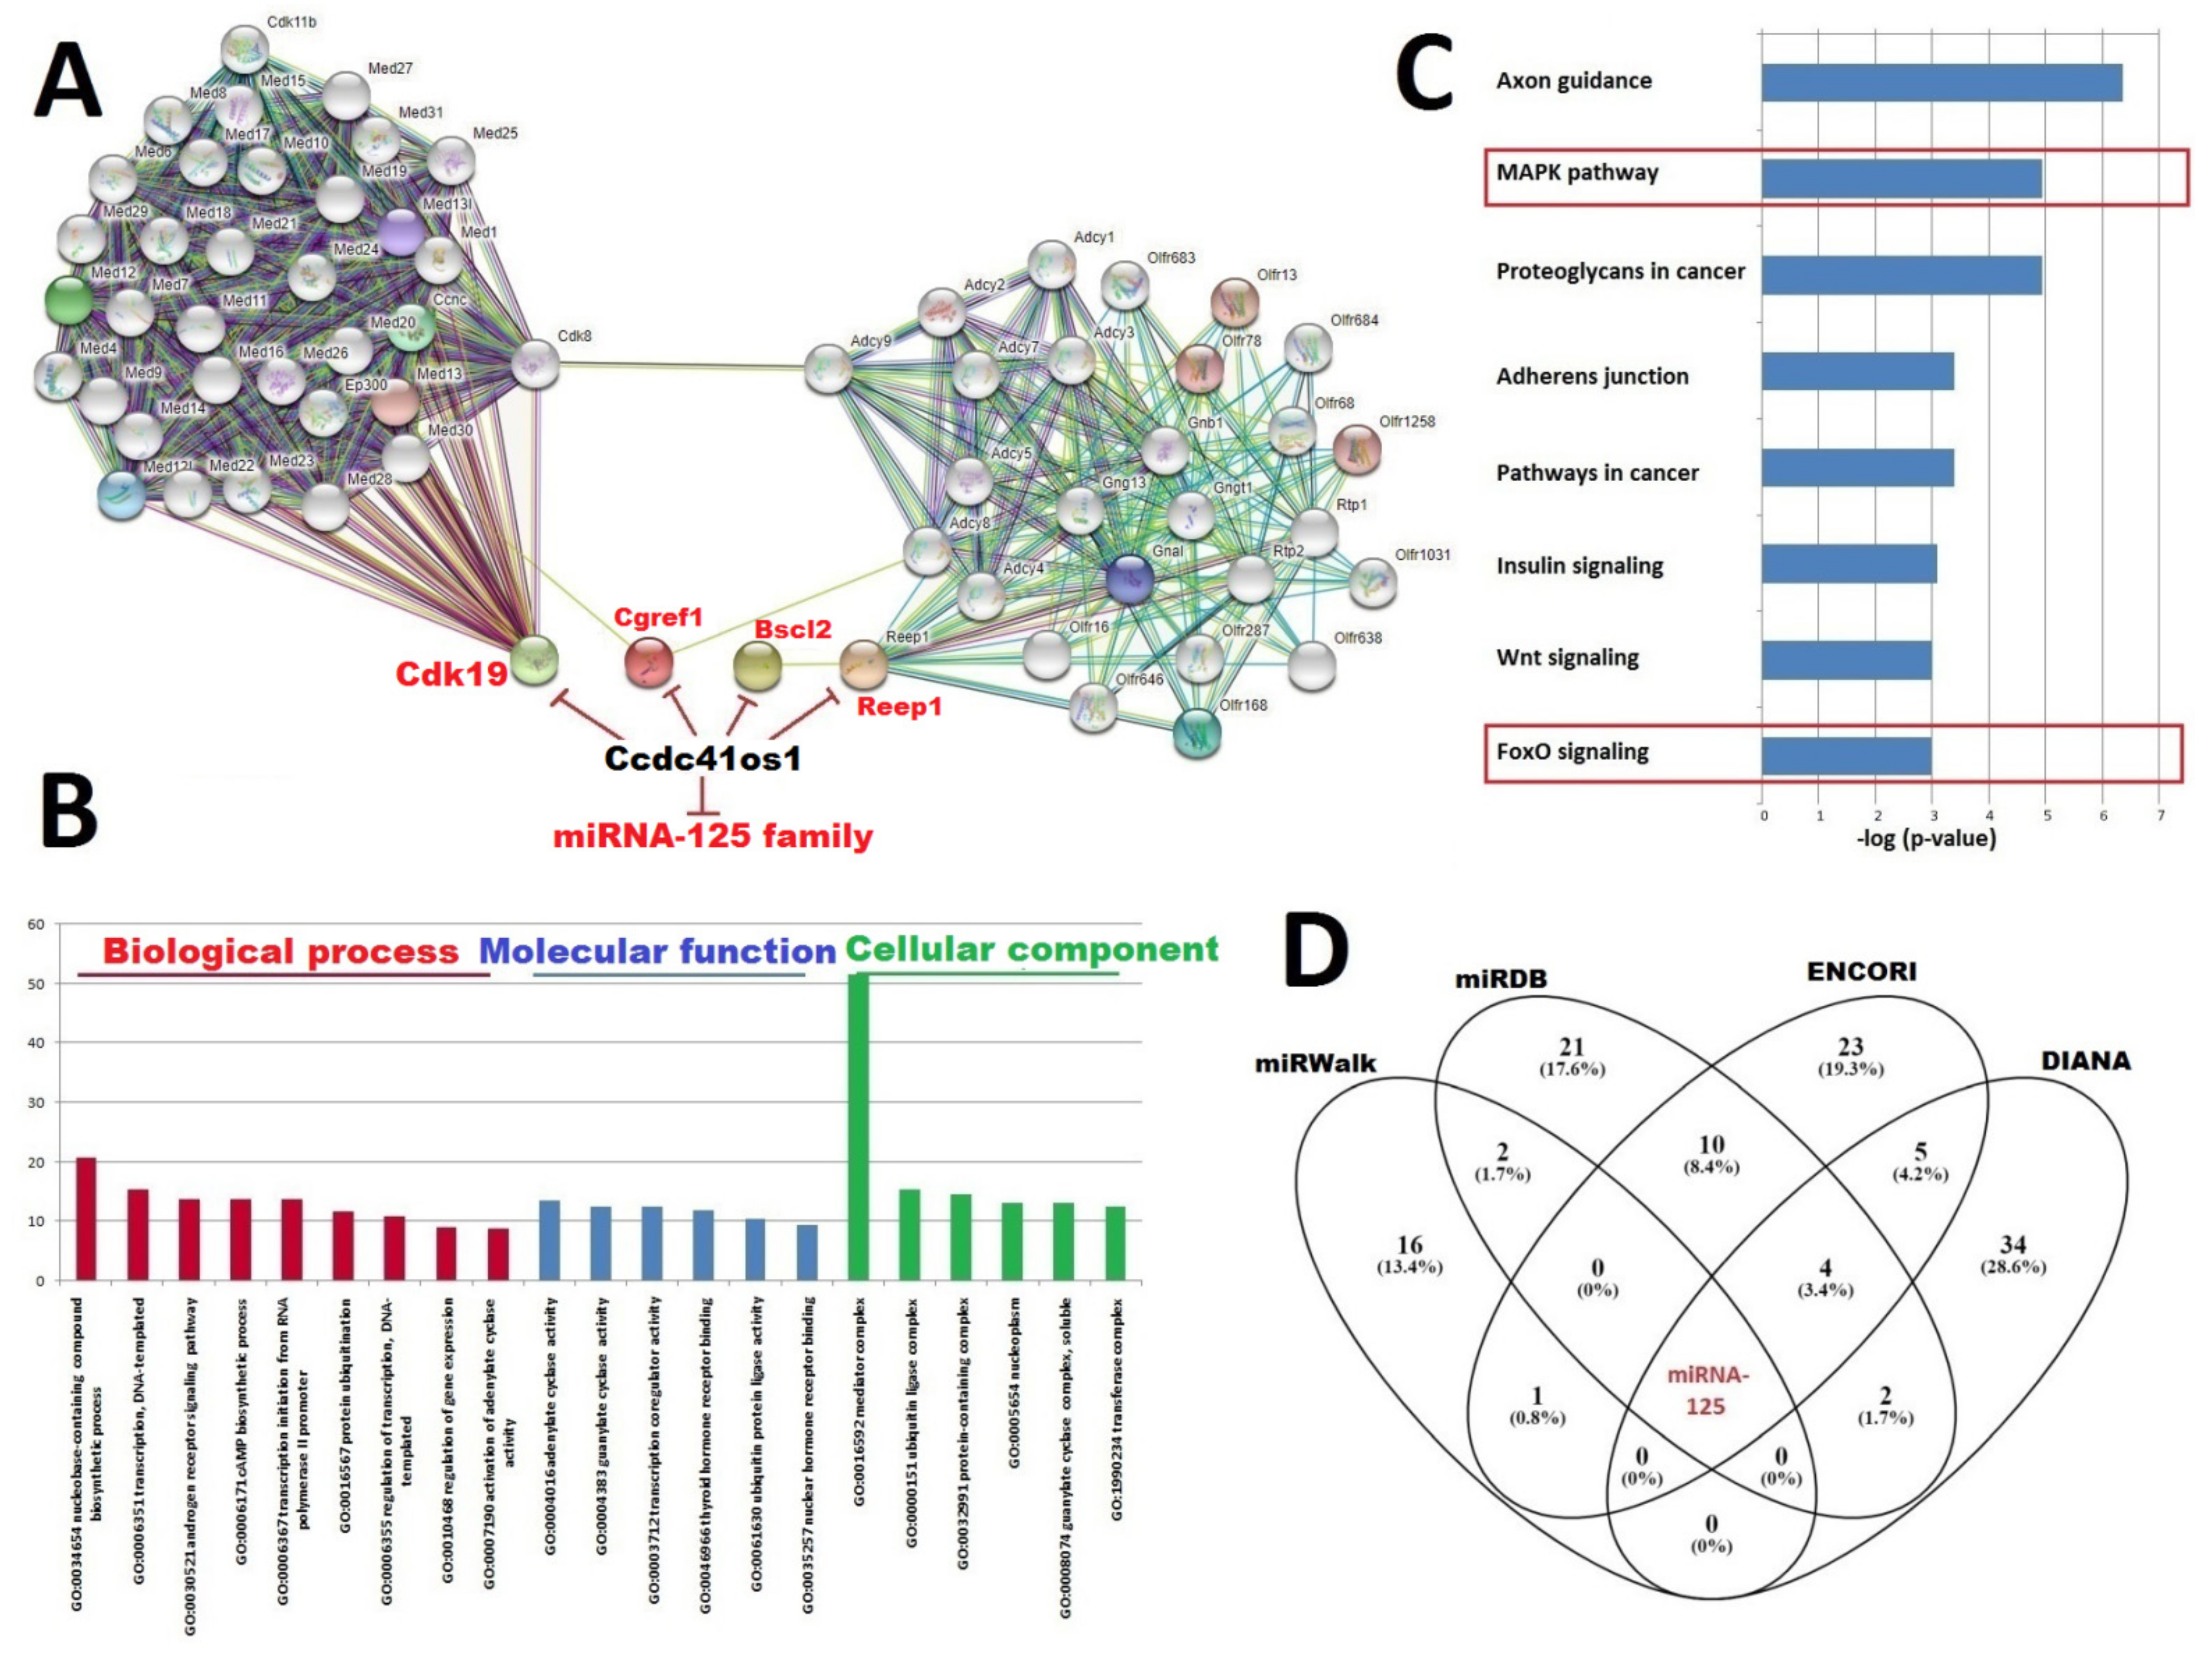
2.6. Ccdc41os1/Cep83os: ENSMUSG00000097164
2.7. 5830418P13Rik: ENSMUSG00000086236
3. Discussion
4. Materials and Methods
4.1. Cell Culture and Differentiation
4.2. Atrophy Model
4.3. LncRNAs’ Profiling and Data Analysis
4.4. Dynamics in Expression Change of Selected lncRNA
4.5. Construction of DElncRNA Regulatory Network
4.6. Functional Annotation of Key Protein–Protein Network Construction
5. Conclusions
Supplementary Materials
Author Contributions
Funding
Institutional Review Board Statement
Informed Consent Statement
Data Availability Statement
Conflicts of Interest
References
- Schiaffino, S.; Dyar, K.A.; Ciciliot, S.; Blaauw, B.; Sandri, M. Mechanisms regulating skeletal muscle growth and atrophy. FEBS J. 2013, 208, 4294–4314. [Google Scholar] [CrossRef] [PubMed]
- Egerman, M.A.; Glass, D.J. Signaling pathways controlling skeletal muscle mass. Crit. Rev. Biochem. Mol. Biol. 2014, 49, 59–68. [Google Scholar] [CrossRef] [PubMed] [Green Version]
- Cohen, S.; Nathan, J.A.; Goldberg, A.L. Muscle wasting in disease: Molecular mechanisms and promising therapies. Nat. Rev. Drug Discov. 2015, 14, 58–74. [Google Scholar] [CrossRef] [PubMed]
- Ebner, N.; Slizuk, V.; Scherbakov, N.; Sandek, A. Muscle wasting in ageing and chronic illness. ESC Heart Fail. 2015, 2, 58–68. [Google Scholar] [CrossRef]
- Palus, S.; von Haehling, S.; Springer, J. Muscle wasting: An overview of recent developments in basic research. Int. J. Cardiol. 2014, 176, 640–644. [Google Scholar] [CrossRef] [Green Version]
- Londhe, P.; Guittridge, D.C. Inflammation induced loss of skeletal muscle. Bone 2015, 80, 131–142. [Google Scholar] [CrossRef] [Green Version]
- Webster, J.M.; Kempen, L.J.; Hardy, R.S.; Langen, R.C. Inflammation and Skeletal Muscle Wasting During Cachexia. Front. Physiol. 2020, 11, 597675. [Google Scholar] [CrossRef]
- Reid, M.B.; Li, Y.P. Tumor necrosis factor-alpha and musclewasting: A cellularperspective. Respir. Res. 2001, 2, 269–272. [Google Scholar] [CrossRef]
- Cai, D.; Frantz, J.D.; Tawa, N.E., Jr.; Tawa, N.E.; Melendez, P.A.; Oh, B.-C.; Lidov, H.G.W.; Hasselgren, P.-O.; Frontera, W.R.; Lee, J.; et al. IKK beta/NF-kappaB activation causes severe muscle wasting in mice. Cell 2004, 119, 285–298. [Google Scholar] [CrossRef] [Green Version]
- Thoma, A.; Lightfoot, A.P. NF-κB and Inflammatory Cytokine Signalling: Role in Skeletal Muscle Atrophy. Adv. Exp. Med. Biol. 2018, 1088, 267–279. [Google Scholar]
- Lee, D.; Goldberg, A.L. Muscle Wasting in Fasting Requires Activation of NF-κB and Inhibition of AKT/Mechanistic Target of Rapamycin (mTOR) by the Protein Acetylase. GCN J. Biol. Chem. 2015, 290, 30269–30279. [Google Scholar] [CrossRef] [PubMed] [Green Version]
- Lu, A.; Proto, J.D.; Guo, L.; Tang, Y.; Lavasani, M.; Tilstra, J.S.; Niedernhofer, L.J.; Wang, B.; Guttridge, D.C.; Robbins, P.D.; et al. NF-κB Negatively Impacts the Myogenic Potential of Muscle-derived Stem Cells. Mol. Ther. 2012, 20, 661–668. [Google Scholar] [CrossRef] [PubMed] [Green Version]
- Zhang, X.; Wang, W.; Zhu, W.; Dong, J.; Cheng, Y.; Yin, Z.; Shen, F. Mechanisms and Functions of Long Non-CodingRNAs at Multiple Regulatory Levels. Int. J. Mol. Sci. 2019, 20, 5573. [Google Scholar] [CrossRef] [Green Version]
- Statello, L.; Guo, C.J.; Chen, L.L.; Huarte, M. Gene regulation by long non-coding RNAs and its biological functions. Nat. Rev. Mol. Cell Biol. 2021, 22, 96–118. [Google Scholar] [CrossRef] [PubMed]
- Liu, Q.; Deng, J.; Qiu, Y.; Gao, J.; Li, J.; Guan, L.; Lee, H.; Zhou, Q.; Xiao, J. Non-coding RNA basis of muscle atrophy. Mol. Ther. Nucleic. Acids. 2021, 26, 1066–1078. [Google Scholar] [CrossRef] [PubMed]
- Ghafouri-Fard, S.; Abak, A.; Khademi, S.; Shoorei, H.; Bahroudi, Z.; Taheri, M.; Dilmaghani, N.A. Functional roles of non-codingRNAs in atrophy. Biomed. Pharmacother. 2021, 141, 111820. [Google Scholar] [CrossRef]
- Li, Z.; Cai, B.; Abdalla, B.A.; Zhu, X.; Zheng, M.; Han, P.; Nie, Q.; Zhang, X. LncIRS1 controls muscle atrophy via sponging miR-15 family to activate IGF1-PI3K/AKT pathway. J. Cachexia Sarcopenia Muscle 2019, 10, 391–410. [Google Scholar] [CrossRef] [Green Version]
- Cesana, M.; Cacchiarelli, D.; Legnini, I.; Santini, T.; Sthandier, O.; Chinappi, M.; Tramontano, A.; Bozzoni, I. A long non coding RNA controls muscle differentiation by functioning as a competing endogenous RNA. Cell 2011, 147, 358–369. [Google Scholar] [CrossRef] [Green Version]
- Sartori, R.; Romanello, V.; Sandri, M. Mechanisms of muscle atrophy and hypertrophy: Implications in health and disease. Nat. Comm. 2021, 12, 330. [Google Scholar] [CrossRef]
- Bonaldo, P.; Sandri, M. Cellular and molecular mechanisms of muscle atrophy. Dis. Model. Mech. 2013, 6, 25–39. [Google Scholar] [CrossRef] [Green Version]
- Wang, X.H. MicroRNA in myogenesis and muscle atrophy. Curr. Opin. Clin. Nutr. Metab. Care 2013, 16, 258–266. [Google Scholar] [CrossRef] [PubMed] [Green Version]
- Li, Y.; Meng, X.; Li, G.; Zhou, Q.; Xiao, J. Noncoding RNAs in Muscle Atrophy. In Muscle Atrophy. Advances in Experimental Medicine and Biology; Springer: Singapore, 2018. [Google Scholar] [CrossRef]
- Zhu, M.; Liu, J.; Xiao, J.; Yang, L.; Cai, M.; Shen, H.; Chen, X.; Ma, Y.; Hu, S.; Wang, Z.; et al. Lnc-mg is a long non-coding RNA that promotes myogenesis. Nat. Comm. 2017, 8, 14718. [Google Scholar] [CrossRef] [PubMed] [Green Version]
- Sun, L.; Si, M.; Liu, X.; Choi, J.; Wang, Y.; Thomas, S.; Peng, H.; Hu, Z. Long-noncoding RNA Atrolnc-1 promotes muscle wasting in mice with chronic kidney disease. J. Cachexia Sarcopenia Muscle 2018, 9, 962–974. [Google Scholar] [CrossRef] [PubMed]
- Lei, S.; She, Y.; Zeng, J.; Chen, R.; Zhou, S.; Shi, H. Expression patterns of regulatory lncRNAs and miRNAs in muscular atrophy models induced by starvation in vitro and in vivo. Mol. Med. Rep. 2019, 20, 4175–4185. [Google Scholar] [CrossRef]
- Hitachi, K.; Nakatani, M.; Funasaki, S.; Hijikata, I.; Maekawa, M.; Honda, M.; Tsuchida, K. Expression Levels of Long Non-Coding RNAs Change in Models of Altered Muscle Activity and Muscle Mass. Int. J. Mol. Sci. 2020, 21, 1628. [Google Scholar] [CrossRef] [Green Version]
- Abe, M.; Lin, J.; Nagata, K.; Okuwaki, M. Selective regulation of type II interferon-inducible genes by NPM1/nucleophosmin. FEBS Lett. 2018, 592, 244–255. [Google Scholar] [CrossRef] [Green Version]
- Jiang, W.; Zhang, C.; Kang, Y.; Yu, X.; Peng, P.; Li, G.; Feng, Y. MRPL42 is activated by YY1 to promote lung adenocarcinoma progression. J. Cancer 2021, 12, 2403–2411. [Google Scholar] [CrossRef]
- Crippa, S.; Cassano, M.; Messina, G.; Galli, D.; Galvez, B.; Curk, T.; Altomare, C.; Ronzoni, F.; Toelen, J.; Gijsbers, R.; et al. miR669a and miR669q prevent skeletal muscle differentiation in postnatal cardiac progenitors. J. Cell Biol. 2011, 193, 1197–1212. [Google Scholar] [CrossRef]
- Yamamoto, S.; Hagihara, T.; Horiuchi, Y.; Okui, A.; Wani, S.; Yoshida, T.; Inoue, T.; Tanaka, A.; Ito, T.; Hirose, Y.; et al. Mediator cyclin-dependent kinases upregulate transcription of inflammatory genes in cooperation with NF-κB and C/EBPβ on stimulation of Toll-like receptor 9. Genes. Cells 2017, 22, 265–276. [Google Scholar] [CrossRef] [Green Version]
- Deng, W.; Wang, L.; Xiong, Y.; Li, J.; Wang, Y.; Shi, T.; Ma, D. The novel secretory protein CGREF1 inhibits the activation of AP-1 transcriptional activity and cell proliferation. Int. J. Biochem. Cell Biol. 2015, 65, 32–39. [Google Scholar] [CrossRef]
- Yu, Y.; Chu, W.; Chai, J.; Li, X.; Liu, L.; Ma, L. Critical role of miRNAs in mediating skeletal muscle atrophy (Review). Mol. Med. Rep. 2016, 13, 1470–1474. [Google Scholar] [CrossRef] [PubMed]
- Chen, Y.; Zhang, X.; Li, J.; Zhou, M. Immune-related eight-lncRNA signature for improving prognosis prediction of lung adenocarcinoma. J. Clin. Lab. Anal. 2021, 35, e24018. [Google Scholar] [CrossRef] [PubMed]
- Goedhart, J.; Luijsterburg, M.S. VolcaNoseR is a web app for creating, exploring, labeling and sharing volcano plots. Sci. Rep. 2020, 10, 20560. [Google Scholar] [CrossRef] [PubMed]
- Zhou, K.R.; Liu, S.; Cai, L.; Bin, L. ENCORI: The Encyclopedia of RNA Interactomes. Available online: https://starbase.sysu.edu.cn/index.php (accessed on 10 December 2021).
- Li, J.H.; Liu, S.; Zhou, H.; Qu, L.H.; Yang, J.H. starBase v2.0: Decoding miRNA-ceRNA, miRNA-ncRNA and protein-RNA interaction networks from large-scale CLIP-Seq data. Nucleic Acids Res. 2014, 42, D92–D97. [Google Scholar] [CrossRef] [Green Version]
- Smith, J.R.; Hayman, G.T.; Wang, S.J.; Laulederkind, S.J.F.; Hoffman, M.J.; Kaldunski, M.L.; Tutaj, M.; Thota, J.; Nalabolu, H.S.; Ellanki, S.L.R.; et al. The Year of the Rat: The Rat Genome Database at 20: A multi-species knowledgebase and analysis platform. Nucleic Acids Res. 2019, 12, gkz1041. [Google Scholar] [CrossRef]
- Sticht, C.; De La Torre, C.; Parveen, A.; Gretz, N. miRWalk: An online resource for prediction of microRNA binding sites. PLoS ONE 2018, 13, e0206239. [Google Scholar] [CrossRef]
- Paraskevopoulou, M.D.; Vlachos, I.S.; Karagkouni, D.; Georgakilas, G.; Kanellos, I.; Vergoulis, T.; Zagganas, K.; Tsanakas, P.; Floros, E.; Dalamagas, T.; et al. DIANA-LncBase v2: Indexing microRNA targets on non-coding transcripts. Nucleic Acids Res. 2016, 44, D231–D238. [Google Scholar] [CrossRef] [Green Version]
- Kanehisa, M.; Goto, S. KEGG: Kyoto encyclopedia of genes and genomes. Nucleic Acids Res. 2000, 28, 27–30. [Google Scholar] [CrossRef]
- Vlachos, I.S.; Kostoulas, N.; Vergoulis, T.; Georgakilas, G.; Reczko, M.; Maragkakis, M.; Paraskevopoulou, M.D.; Prionidis, K.; Dalamagas, T.; Hatzigeorgiou, A.G. DIANA miRPath v.2.0: Investigating the combinatorial effect of microRNAs in pathways. Nucleic Acids Res. 2012, 40, W498–W504. [Google Scholar] [CrossRef]
- Szklarczyk, D.; Gable, A.L.; Nastou, K.C.; Lyon, D.; Kirsch, R.; Pyysalo, S.; Doncheva, N.T.; Legeay, M.; Fang, T.; Bork, P.; et al. The STRING database in 2021: Customizable protein–protein networks, and functional characterization of user-uploaded gene/measurement sets. Nucleic Acids Res. 2021, 49, D605–D612. [Google Scholar] [CrossRef]
- Ge, S.X.; Jung, D.; Yao, R. ShinyGO: A graphical gene-set enrichment tool for animals and plants. Bioinformatics 2020, 36, 2628–2629. [Google Scholar] [CrossRef] [PubMed]


Publisher’s Note: MDPI stays neutral with regard to jurisdictional claims in published maps and institutional affiliations. |
© 2022 by the authors. Licensee MDPI, Basel, Switzerland. This article is an open access article distributed under the terms and conditions of the Creative Commons Attribution (CC BY) license (https://creativecommons.org/licenses/by/4.0/).
Share and Cite
Powrózek, T.; Pigoń-Zając, D.; Mazurek, M.; Ochieng Otieno, M.; Rahnama-Hezavah, M.; Małecka-Massalska, T. TNF-α Induced Myotube Atrophy in C2C12 Cell Line Uncovers Putative Inflammatory-Related lncRNAs Mediating Muscle Wasting. Int. J. Mol. Sci. 2022, 23, 3878. https://doi.org/10.3390/ijms23073878
Powrózek T, Pigoń-Zając D, Mazurek M, Ochieng Otieno M, Rahnama-Hezavah M, Małecka-Massalska T. TNF-α Induced Myotube Atrophy in C2C12 Cell Line Uncovers Putative Inflammatory-Related lncRNAs Mediating Muscle Wasting. International Journal of Molecular Sciences. 2022; 23(7):3878. https://doi.org/10.3390/ijms23073878
Chicago/Turabian StylePowrózek, Tomasz, Dominika Pigoń-Zając, Marcin Mazurek, Michael Ochieng Otieno, Mansur Rahnama-Hezavah, and Teresa Małecka-Massalska. 2022. "TNF-α Induced Myotube Atrophy in C2C12 Cell Line Uncovers Putative Inflammatory-Related lncRNAs Mediating Muscle Wasting" International Journal of Molecular Sciences 23, no. 7: 3878. https://doi.org/10.3390/ijms23073878