
Combining Metabolomics and Experimental Evolution Reveals Key Mechanisms Underlying Longevity Differences in Laboratory Evolved Drosophila melanogaster Populations

 , , , and
Abstract
:1. Introduction
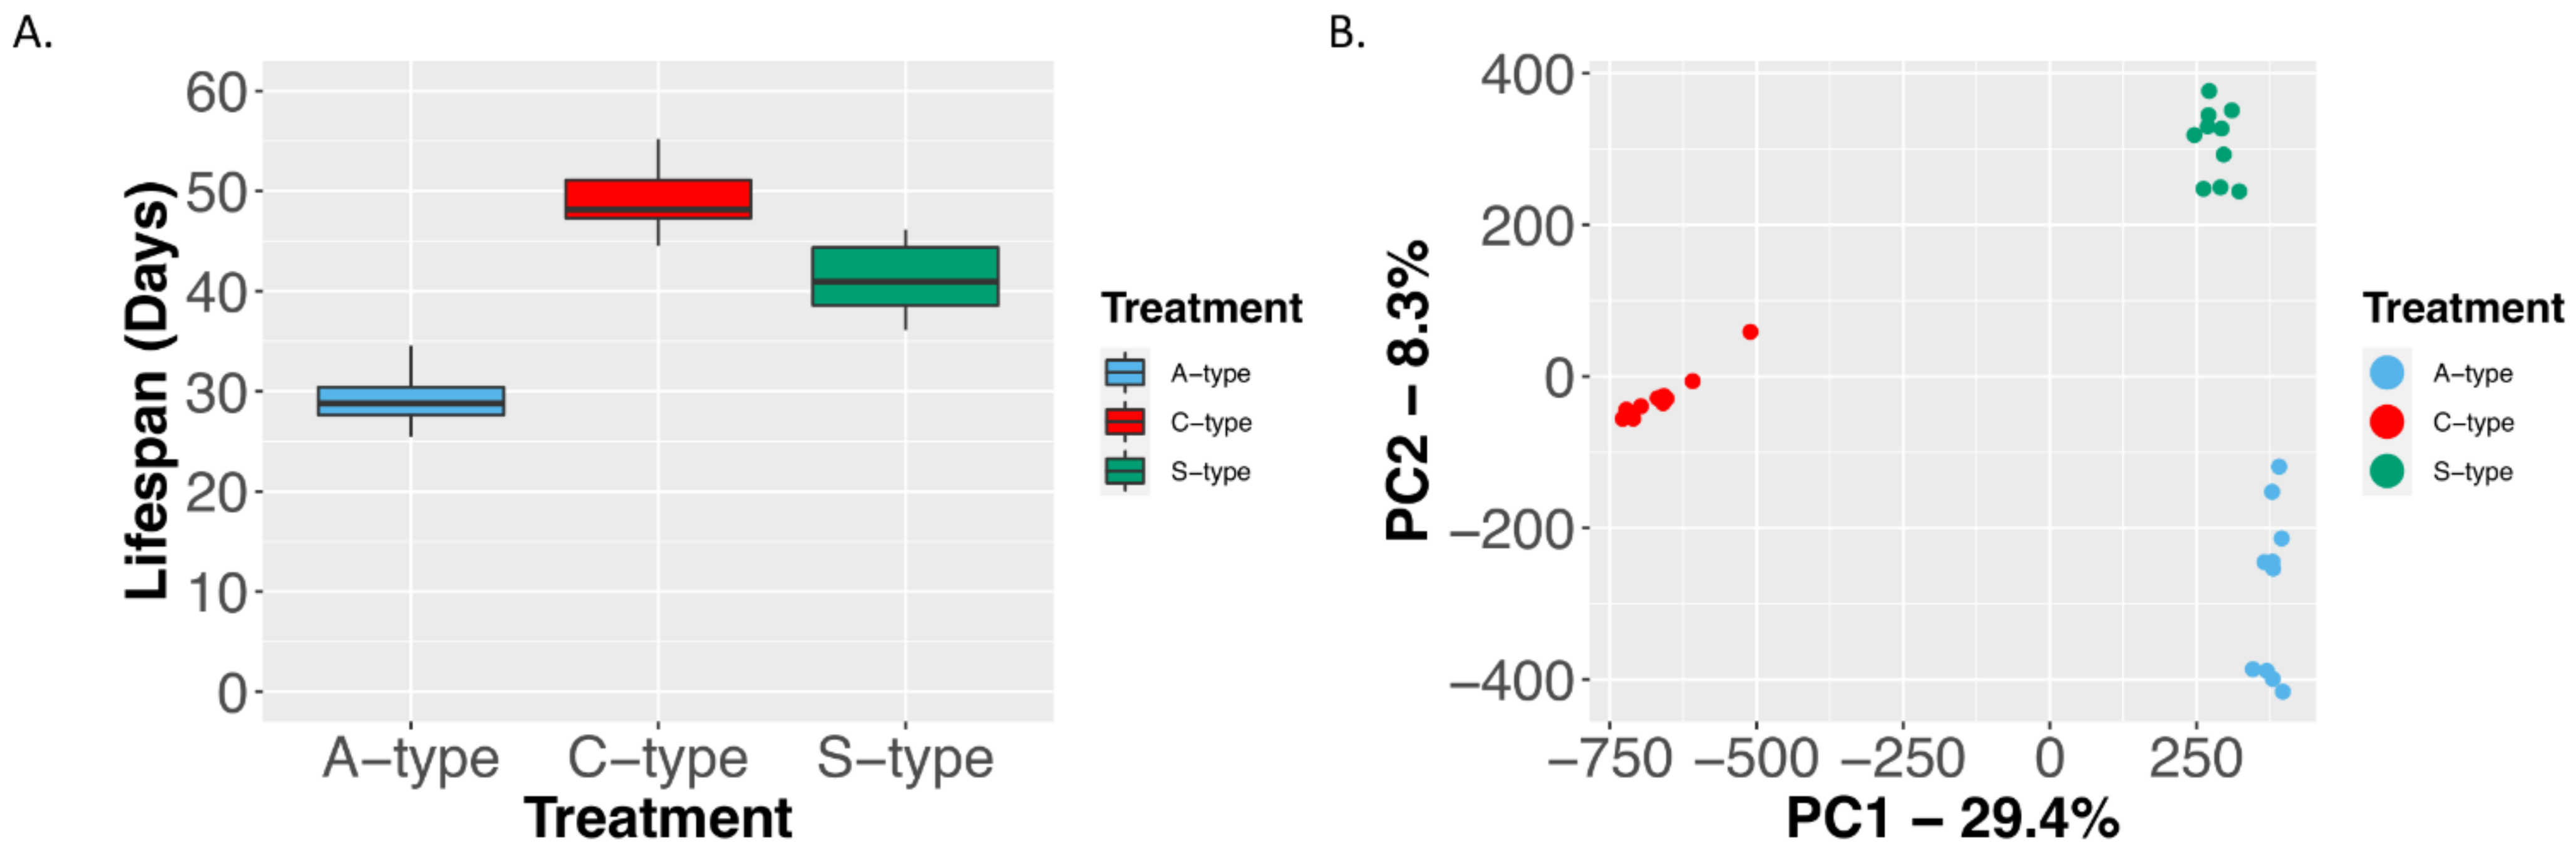
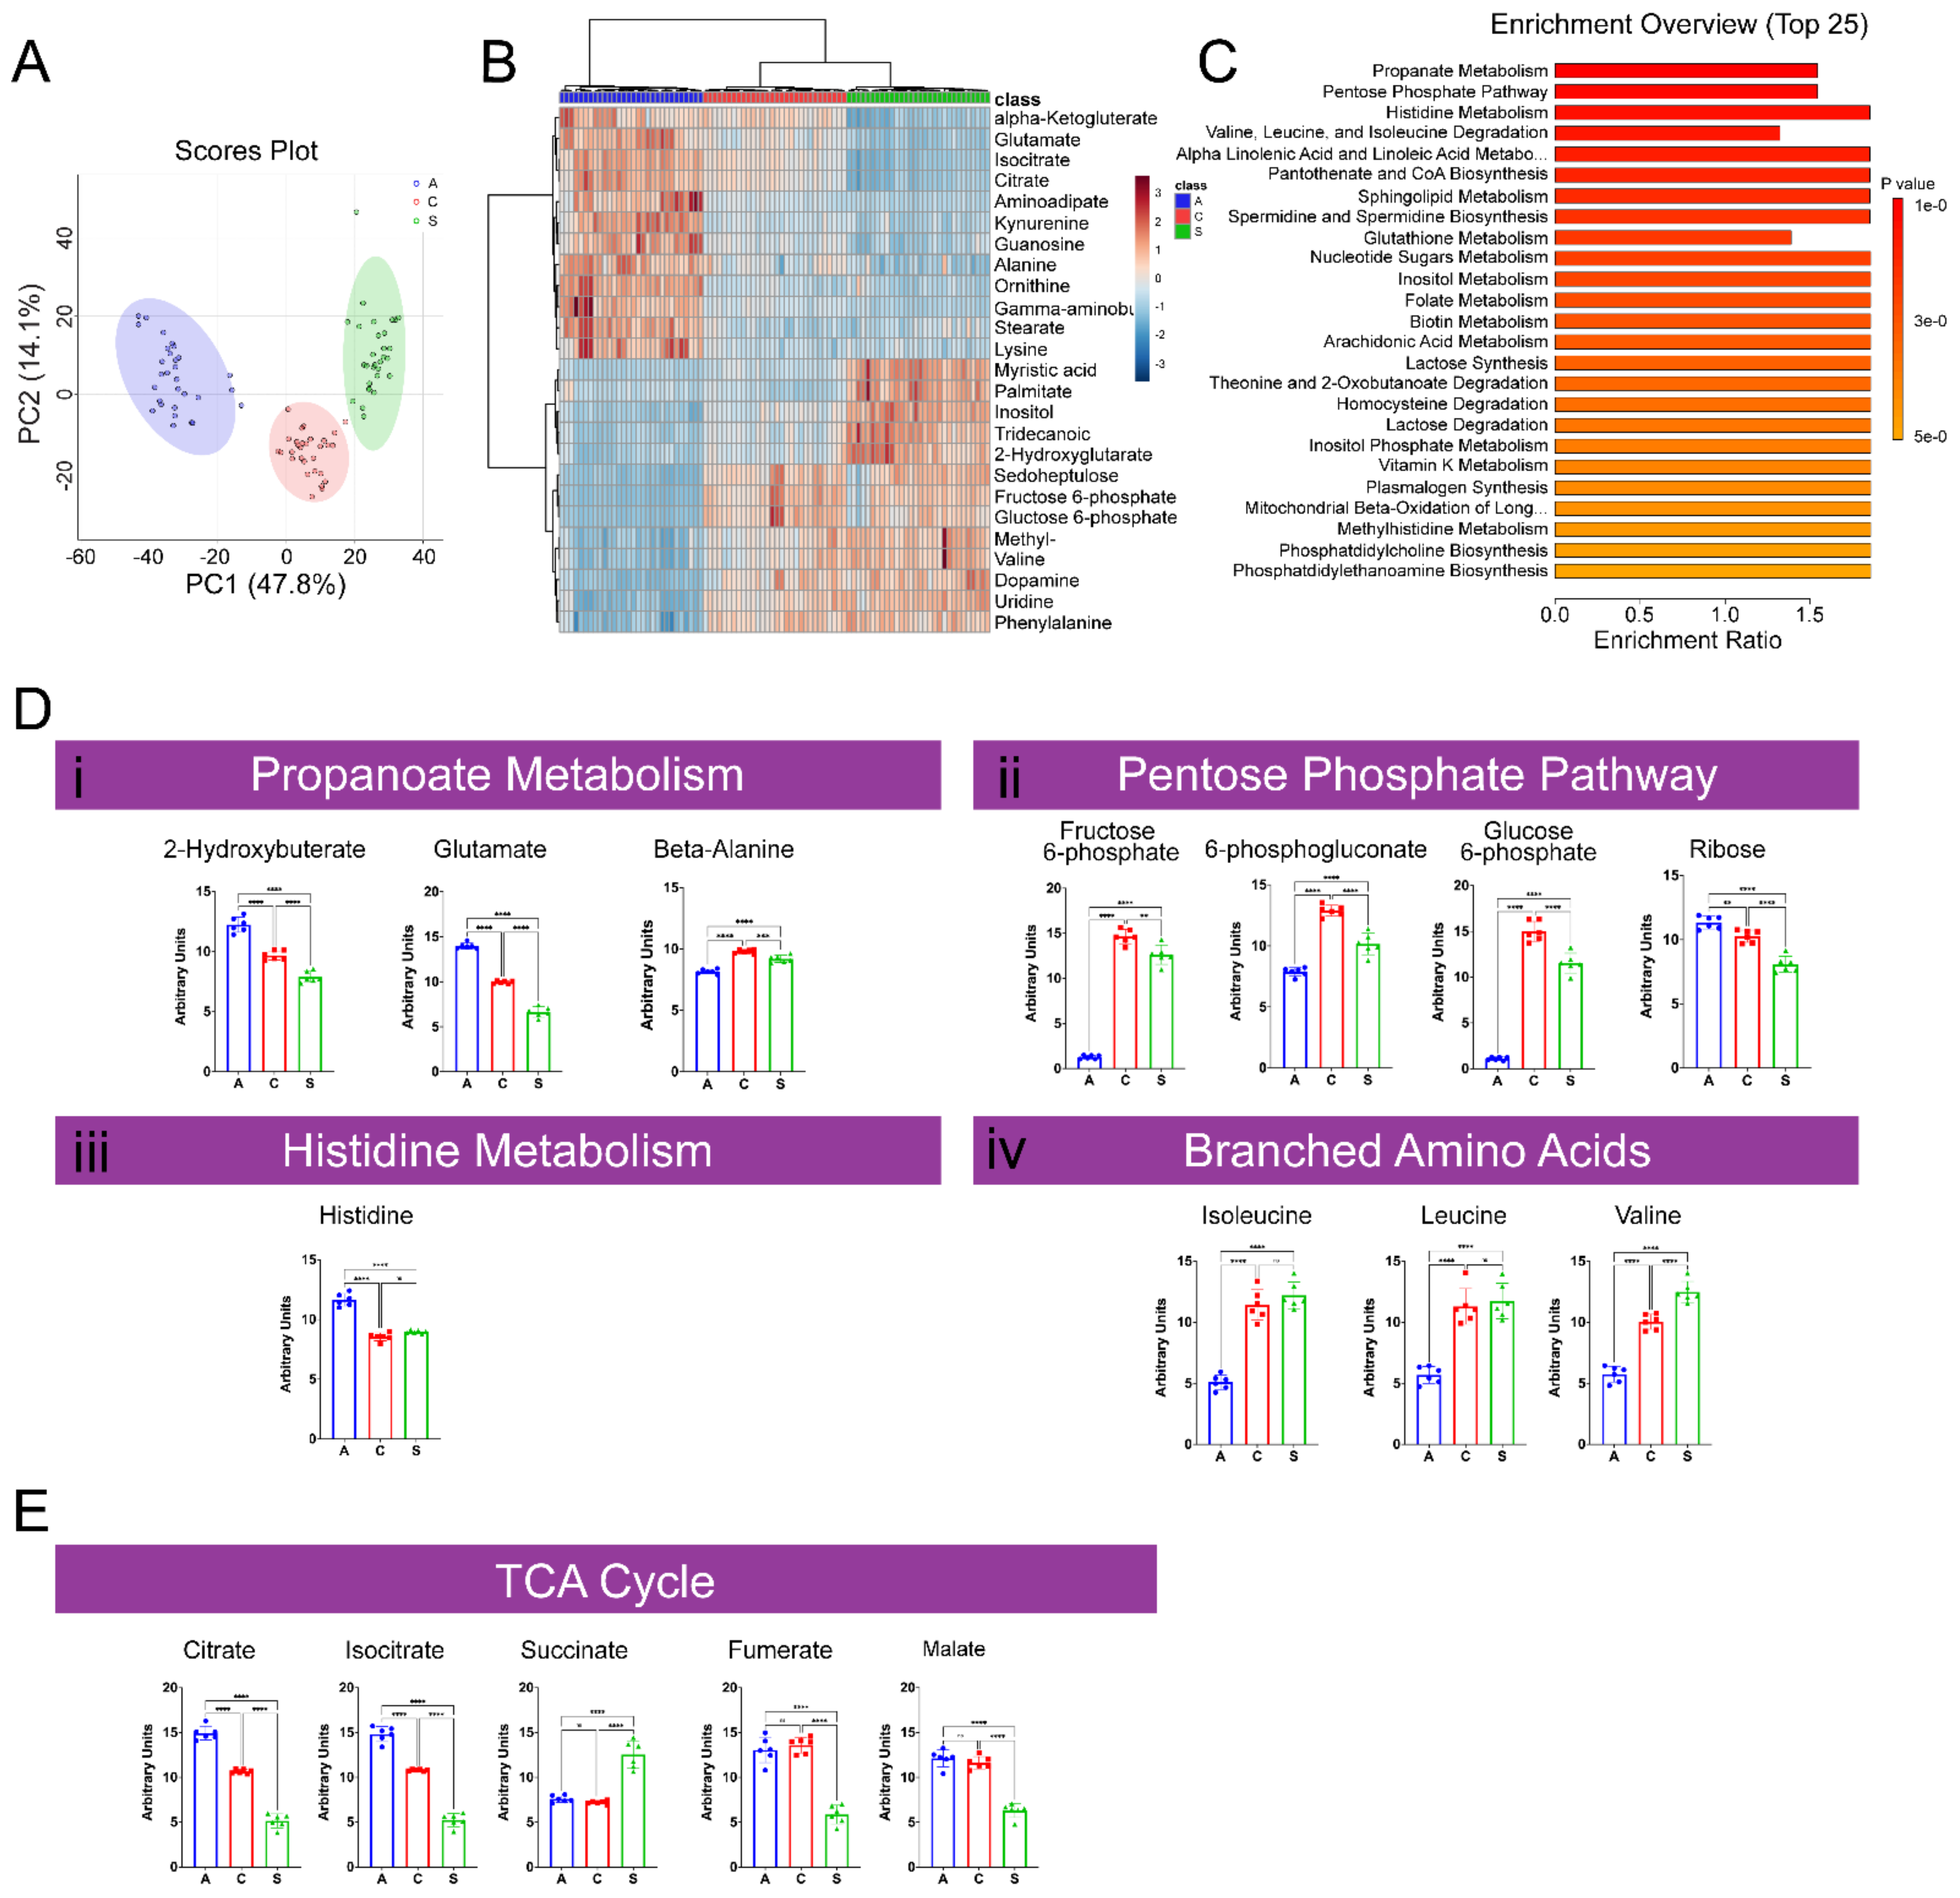
2. Results
2.1. Metabolomic Results
2.1.1. Characterization of GC–MS Metabolomic Profiling of A, C, and S Populations
2.1.2. Characterization of LC–MS Metabolomic Profiling of A, C, and S Populations
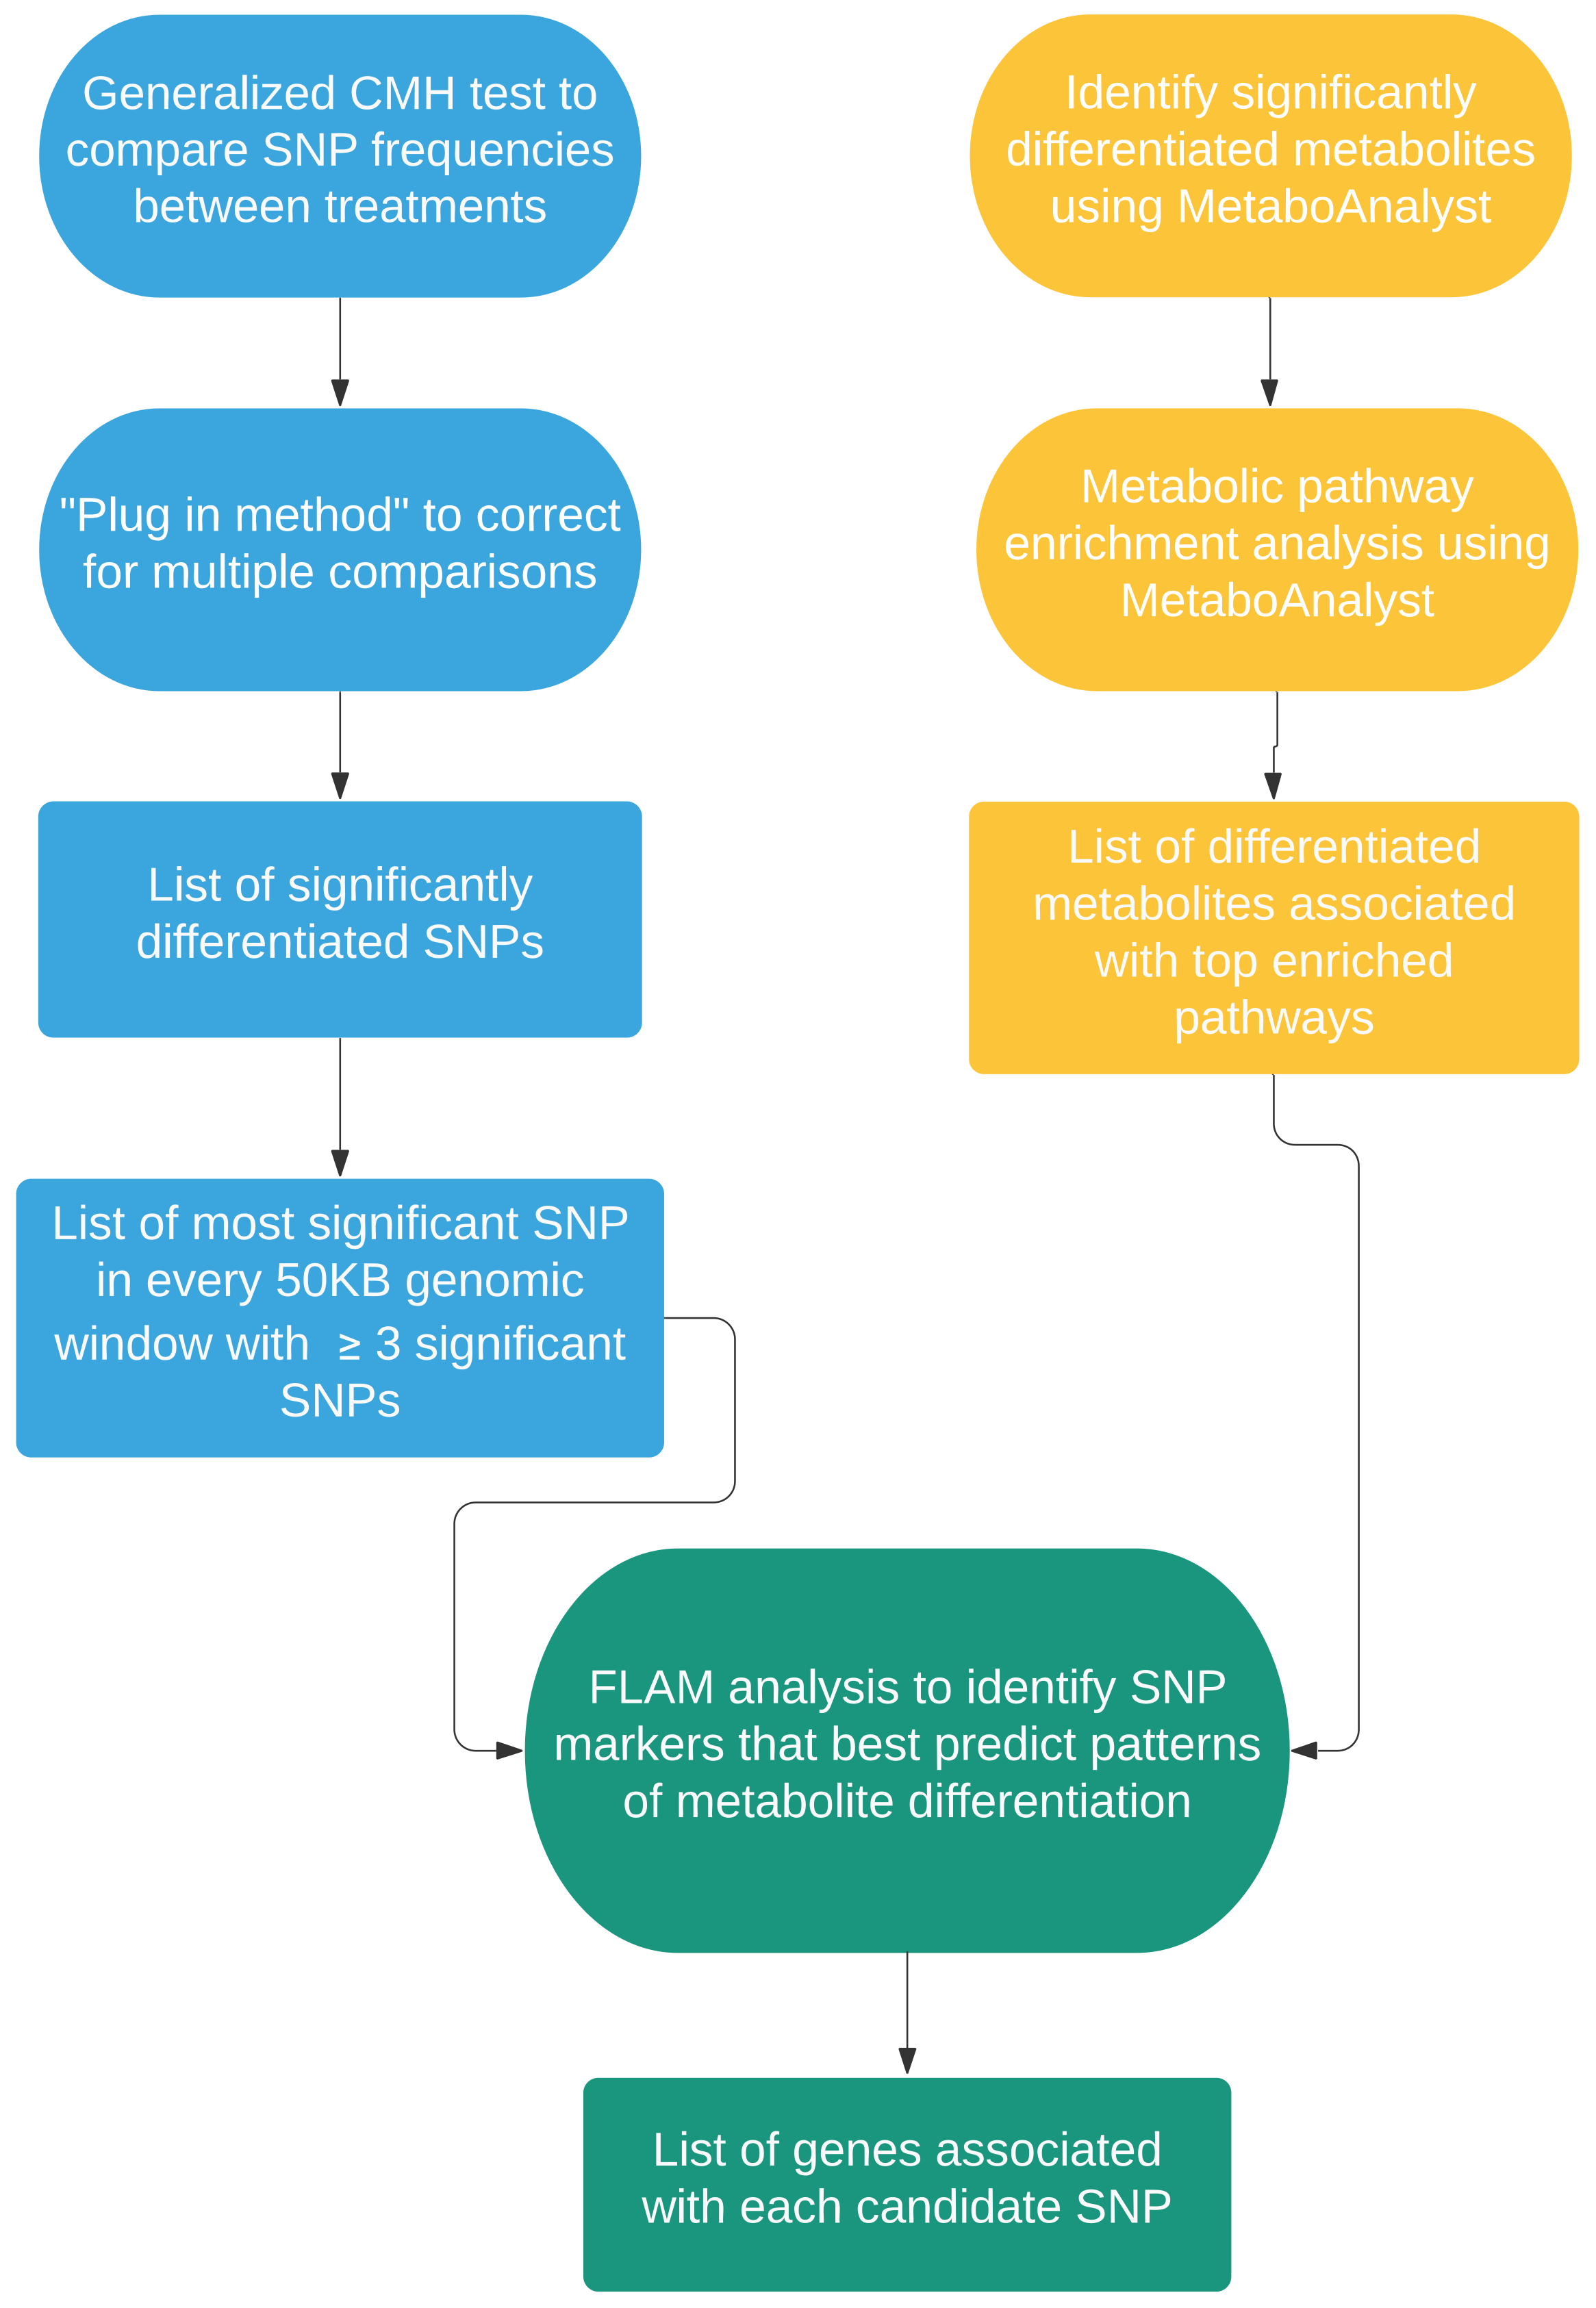
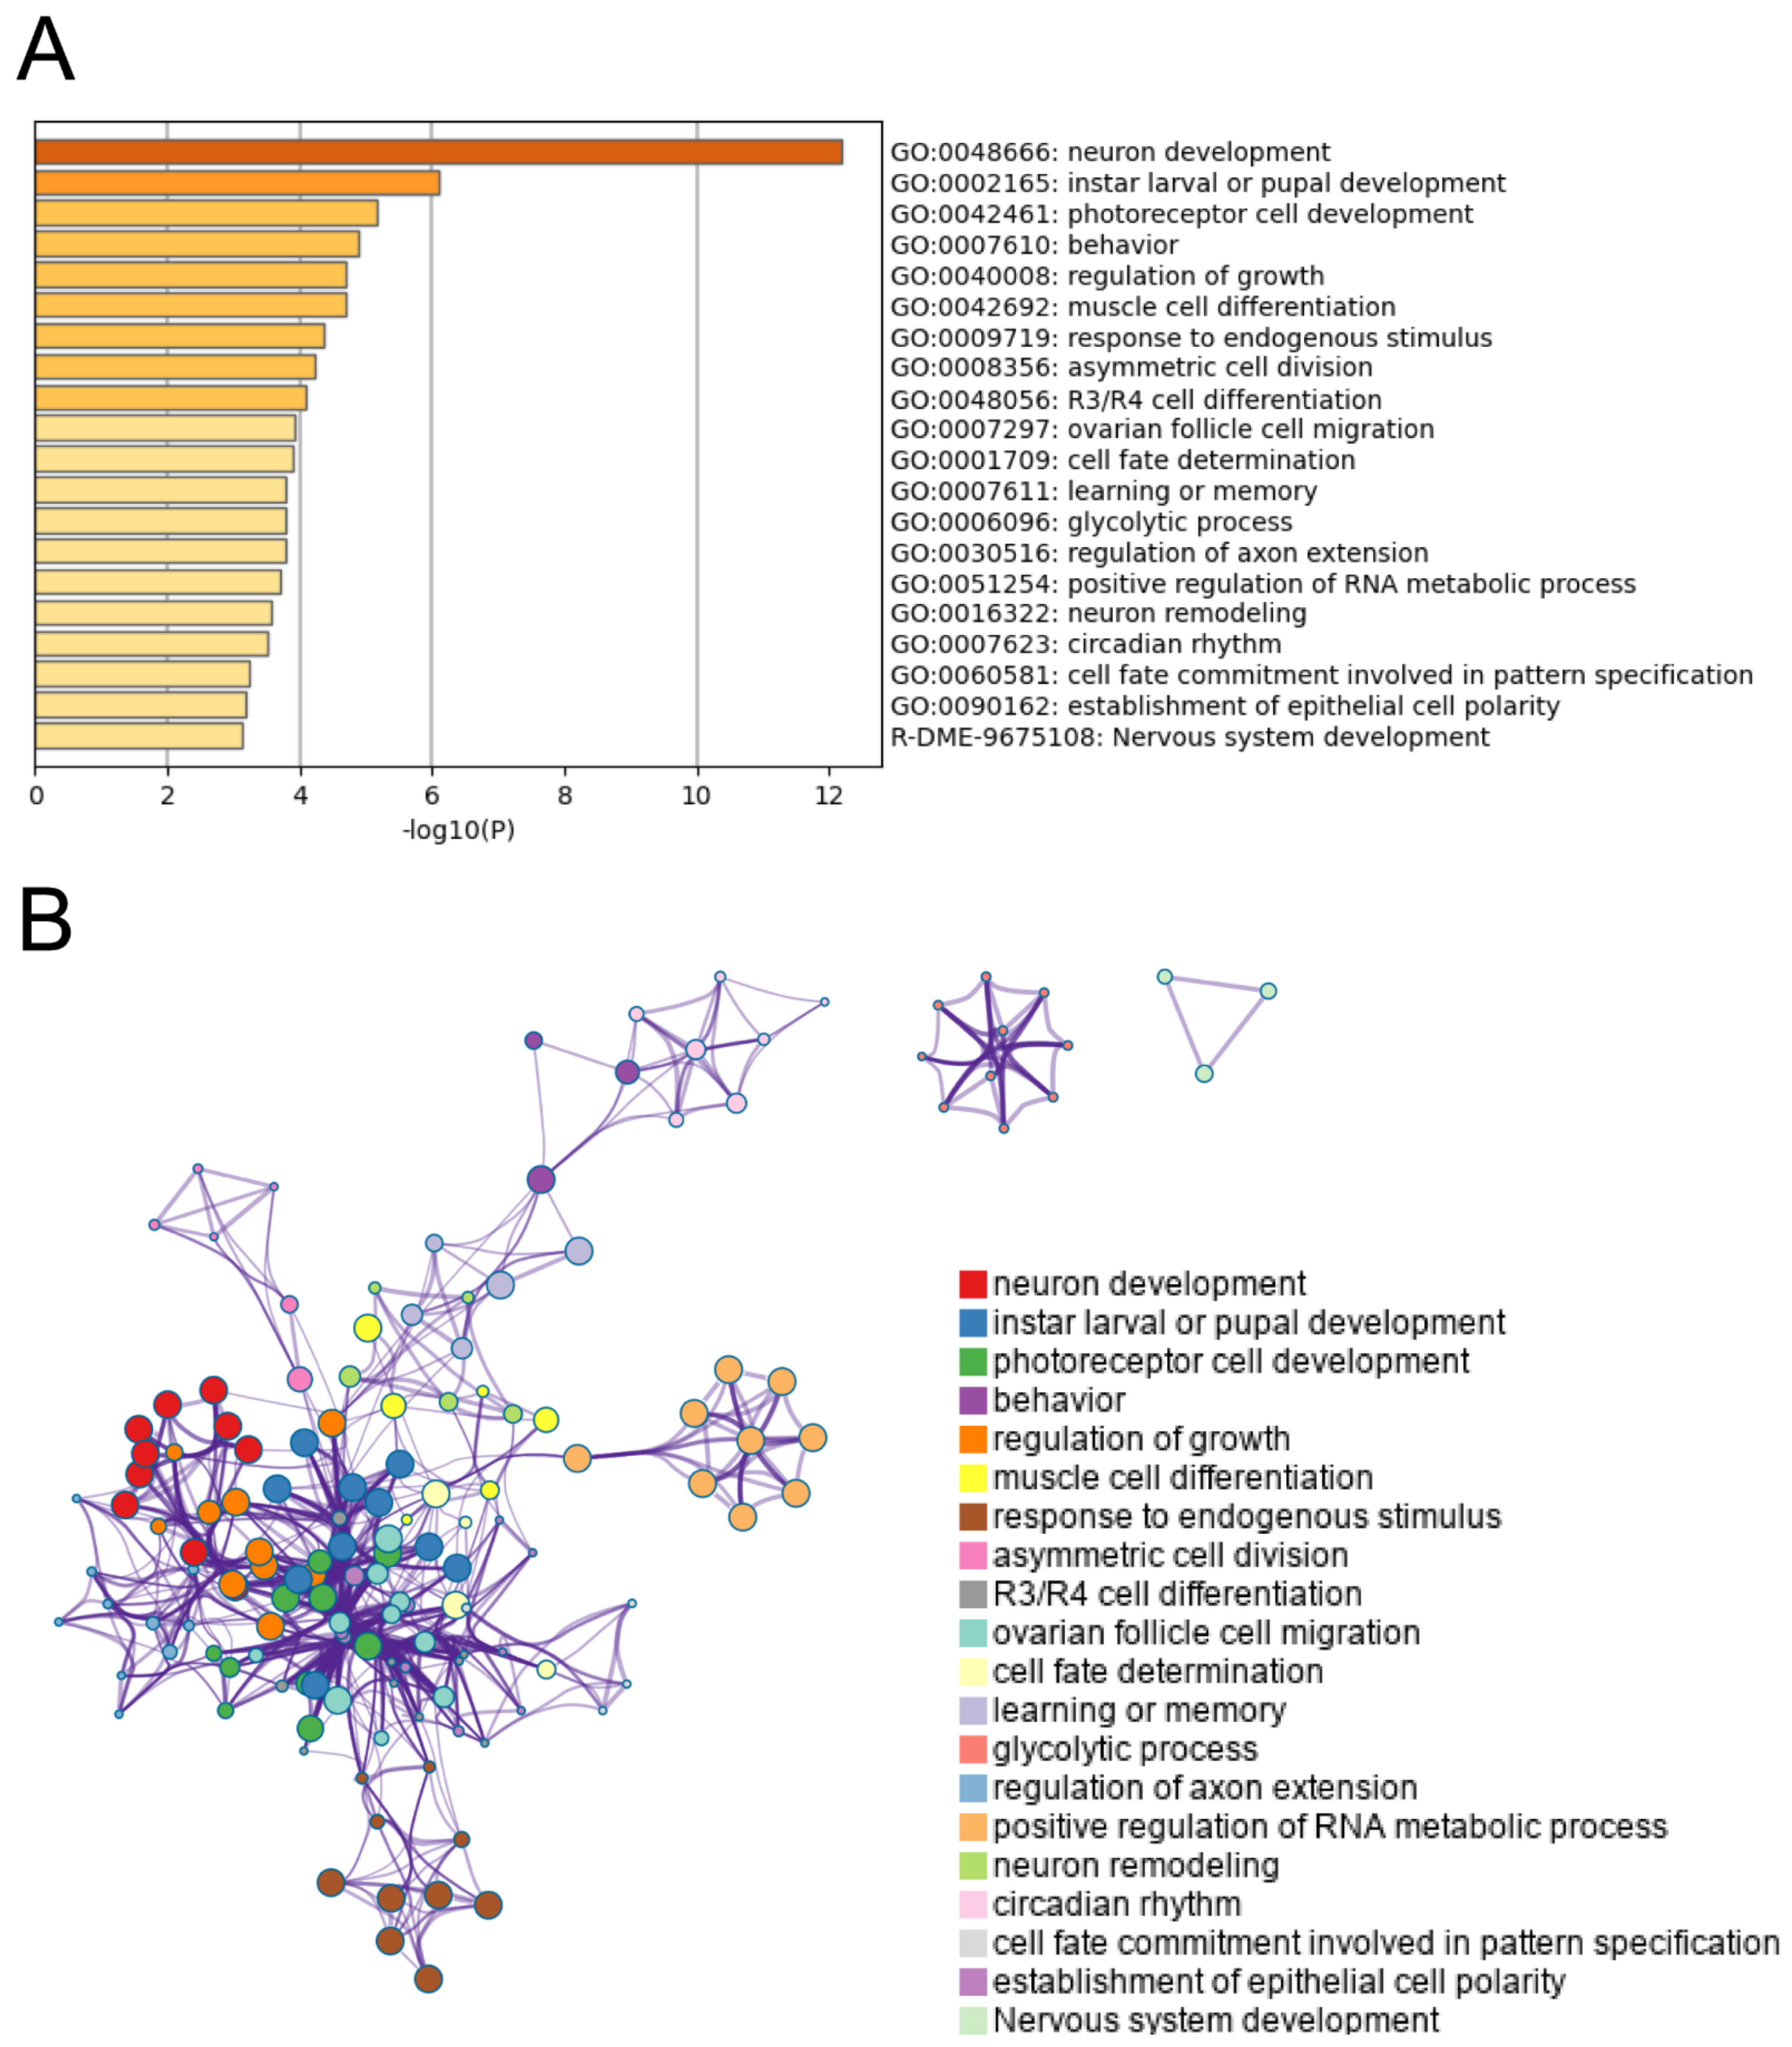
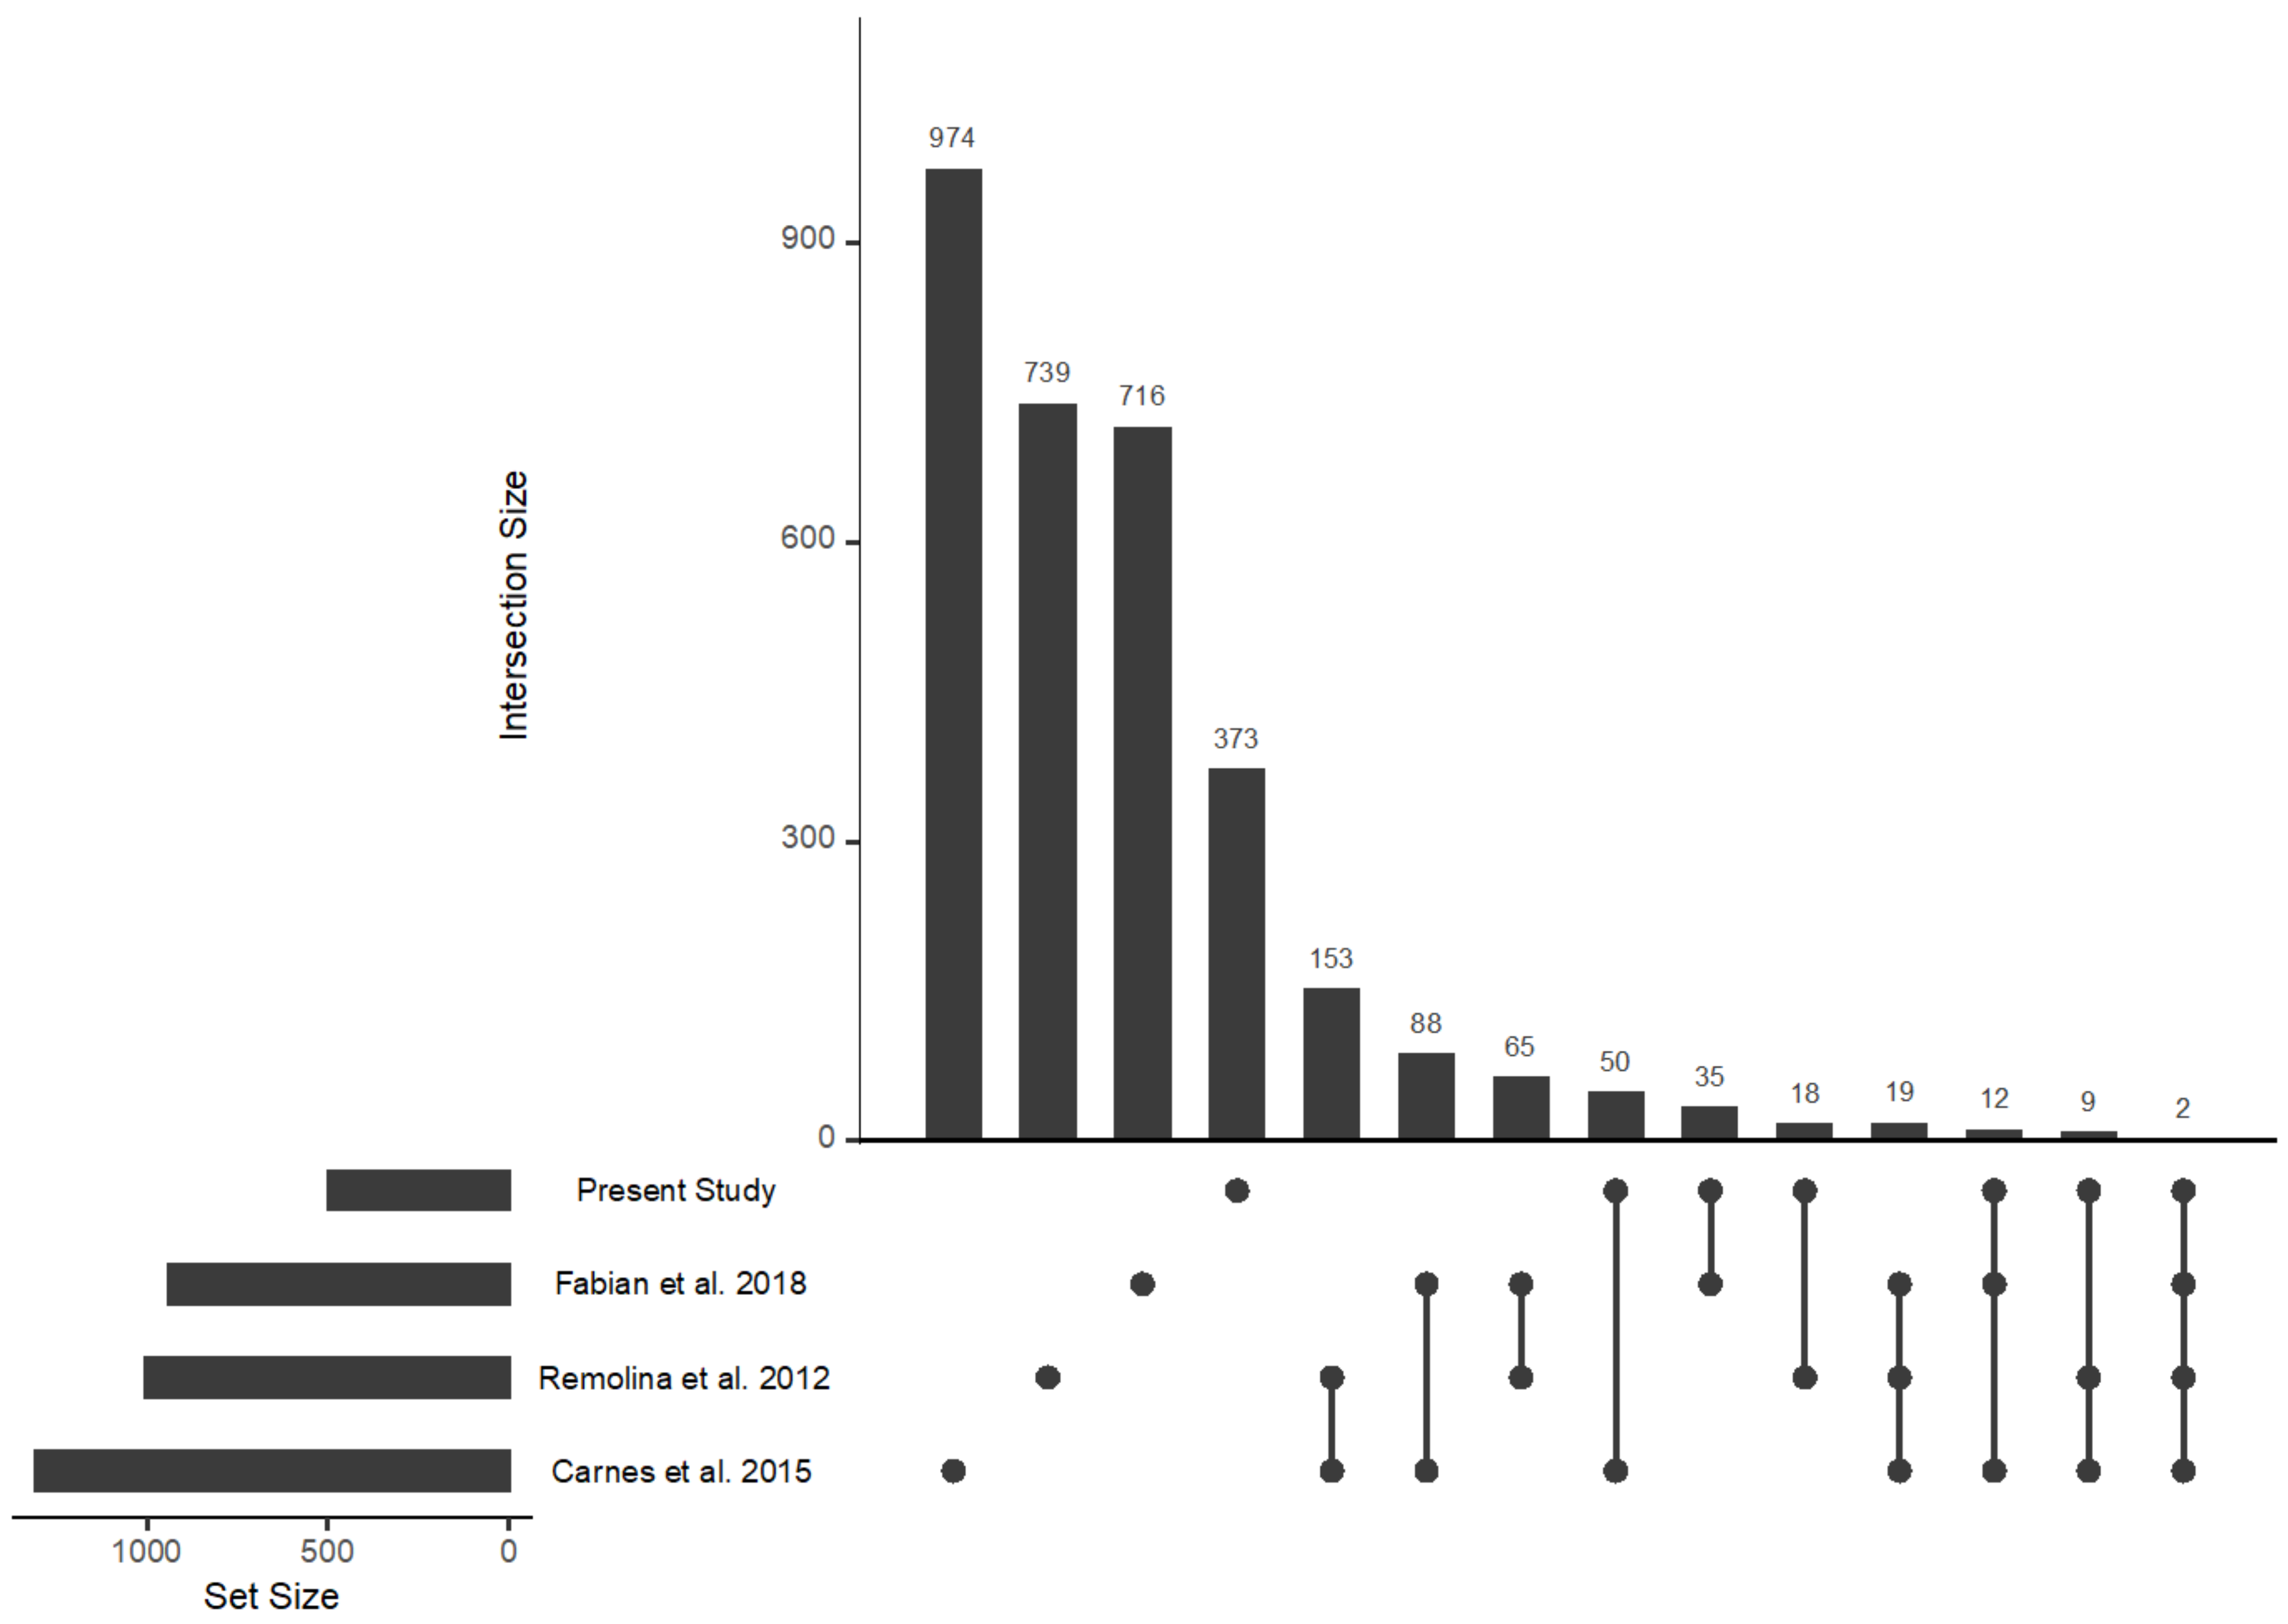
2.2. Genome to Metabolome
3. Discussion
3.1. Metabolomic Characterization
3.2. Genomics to Metabolomics
4. Materials and Methods
4.1. Experimental Populations
4.2. Collecting Flies for Metabolite Extraction
4.3. Metabolomic Characterization
4.3.1. Gas Chromatography-Mass Spectrometry (GC–MS)
4.3.2. Liquid Chromatography-Mass Spectrometry (LC–MS)
4.3.3. Analyzing Metabolomic Data
4.4. Linking Genome to Metabolome
5. Conclusions
Supplementary Materials
Author Contributions
Funding
Institutional Review Board Statement
Informed Consent Statement
Data Availability Statement
Acknowledgments
Conflicts of Interest
References
- Rose, M.R. Evolutionary Biology of Aging; 1. Paperback Issue; Oxford University Press: New York, NY, USA, 1994; ISBN 978-0-19-509530-2. [Google Scholar]
- Stearns, S.C. Life History Evolution: Successes, Limitations, and Prospects. Naturwissenschaften 2000, 87, 476–486. [Google Scholar] [CrossRef] [PubMed]
- Hughes, K.A.; Reynolds, R.M. Evolutionary And Mechanistic Theories Of Aging. Annu. Rev. Entomol. 2005, 50, 421–445. [Google Scholar] [CrossRef] [PubMed] [Green Version]
- Flatt, T.; Partridge, L. Horizons in the Evolution of Aging. BMC Biol. 2018, 16, 93. [Google Scholar] [CrossRef] [PubMed]
- Mueller, L.D.; Ayala, F.J. Trade-off between r-Selection and K-Selection in Drosophila Populations. Proc. Natl. Acad. Sci USA 1981, 78, 1303–1305. [Google Scholar] [CrossRef] [PubMed] [Green Version]
- Luckinbill, L.S.; Arking, R.; Clare, M.J.; Cirocco, W.C.; Buck, S.A. Selection For Delayed Senescence In Drosophila melanogaster. Evolution 1984, 38, 996–1003. [Google Scholar] [CrossRef] [PubMed]
- Rose, M.R. Laboratory Evolution of Postponed Senescence in Drosophila melanogaster. Evolution 1984, 38, 1004–1010. [Google Scholar] [CrossRef] [PubMed]
- Chippindale, A.K.; Alipaz, J.A.; Chen, H.-W.; Rose, M.R. Experimental Evolution of Accelerated Development in Drosophila. 1. Developmental Speed And Larval Survival. Evolution 1997, 51, 1536–1551. [Google Scholar] [CrossRef]
- Burke, M.K.; Barter, T.T.; Cabral, L.G.; Kezos, J.N.; Phillips, M.A.; Rutledge, G.A.; Phung, K.H.; Chen, R.H.; Nguyen, H.D.; Mueller, L.D.; et al. Rapid Divergence and Convergence of Life-history in Experimentally Evolved Drosophila melanogaster. Evolution 2016, 70, 2085–2098. [Google Scholar] [CrossRef]
- Rose, M.R.; Passananti, H.B.; Matos, M. Methuselah Flies: A Case Study in the Evoultion of Aging; World Scientific Pub: Hackensack, NJ, USA, 2004; ISBN 978-981-238-741-7. [Google Scholar]
- Service, P.M.; Hutchinson, E.W.; MacKinley, M.D.; Rose, M.R. Resistance to Environmental Stress in Drosophila melanogaster Selected for Postponed Senescence. Physiol. Zool. 1985, 58, 380–389. [Google Scholar] [CrossRef] [Green Version]
- Chippindale, A.K.; Chu, T.J.F.; Rose, M.R. Complex Trade-Offs and the Evolution of Starvation Resistance in Drosophila melanogaster. Evolution 1996, 50, 753–766. [Google Scholar] [CrossRef]
- Harshman, L.G.; Hoffmann, A.A.; Clark, A.G. Selection for Starvation Resistance in Drosophila melanogaster: Physiological Correlates, Enzyme Activities and Multiple Stress Responses. J. Evolut. Biol. 1999, 12, 370–379. [Google Scholar] [CrossRef]
- Schwasinger-Schmidt, T.E.; Kachman, S.D.; Harshman, L.G. Evolution of Starvation Resistance in Drosophila melanogaster: Measurement of Direct and Correlated Responses to Artificial Selection: Evolution of Starvation Resistance. J. Evol. Biol. 2012, 25, 378–387. [Google Scholar] [CrossRef] [PubMed] [Green Version]
- Kezos, J.N.; Phillips, M.A.; Thomas, M.D.; Ewunkem, A.J.; Rutledge, G.A.; Barter, T.T.; Santos, M.A.; Wong, B.D.; Arnold, K.R.; Humphrey, L.A.; et al. Genomics of Early Cardiac Dysfunction and Mortality in Obese Drosophila melanogaster. Physiol. Biochem. Zool. 2019, 92, 591–611. [Google Scholar] [CrossRef] [PubMed]
- Graves, J.L.; Toolson, E.C.; Jeong, C.; Vu, L.N.; Rose, M.R. Desiccation, Flight, Glycogen, and Postponed Senescence in Drosophila melanogaster. Physiol. Zool. 1992, 65, 268–286. [Google Scholar] [CrossRef] [Green Version]
- Gibbs, A.G.; Chippindale, A.K.; Rose, M.R. Physiological Mechanisms of Evolved Desiccation Resistance in Drosophila melanogaster. In Methuselah Flies; World Scientific: New York, NY, USA, 2004; pp. 89–100. ISBN 978-981-238-741-7. [Google Scholar]
- Chippindale, A.K.; Gibbs, A.G.; Sheik, M.; Yee, K.J.; Djawdan, M.; Bradley, T.J.; Rose, M.R. Resource Acquisition and the Evolution of Stress Resistance in Drosophila melanogaster. Evolution 1998, 52, 1342–1352. [Google Scholar] [CrossRef]
- Djawdan, M.; Chippindale, A.K.; Rose, M.R.; Bradley, T.J. Metabolic Reserves and Evolved Stress Resistance in Drosophila melanogaster. Physiol. Zool. 1998, 71, 584–594. [Google Scholar] [CrossRef]
- Schlötterer, C.; Kofler, R.; Versace, E.; Tobler, R.; Franssen, S.U. Combining Experimental Evolution with Next-Generation Sequencing: A Powerful Tool to Study Adaptation from Standing Genetic Variation. Heredity 2015, 114, 431–440. [Google Scholar] [CrossRef] [Green Version]
- Long, A.; Liti, G.; Luptak, A.; Tenaillon, O. Elucidating the Molecular Architecture of Adaptation via Evolve and Resequence Experiments. Nat. Rev. Genet. 2015, 16, 567–582. [Google Scholar] [CrossRef] [Green Version]
- Jha, A.R.; Miles, C.M.; Lippert, N.R.; Brown, C.D.; White, K.P.; Kreitman, M. Whole-Genome Resequencing of Experimental Populations Reveals Polygenic Basis of Egg-Size Variation in Drosophila melanogaster. Mol. Biol. Evol. 2015, 32, 2616–2632. [Google Scholar] [CrossRef] [PubMed] [Green Version]
- Mueller, L.D.; Phillips, M.A.; Barter, T.T.; Greenspan, Z.S.; Rose, M.R. Genome-Wide Mapping of Gene–Phenotype Relationships in Experimentally Evolved Populations. Mol. Biol. Evol. 2018, 35, 2085–2095. [Google Scholar] [CrossRef] [PubMed]
- Burke, M.K.; Dunham, J.P.; Shahrestani, P.; Thornton, K.R.; Rose, M.R.; Long, A.D. Genome-Wide Analysis of a Long-Term Evolution Experiment with Drosophila. Nature 2010, 467, 587–590. [Google Scholar] [CrossRef]
- Carnes, M.U.; Campbell, T.; Huang, W.; Butler, D.G.; Carbone, M.A.; Duncan, L.H.; Harbajan, S.V.; King, E.M.; Peterson, K.R.; Weitzel, A.; et al. The Genomic Basis of Postponed Senescence in Drosophila melanogaster. PLoS ONE 2015, 10, e0138569. [Google Scholar] [CrossRef] [PubMed] [Green Version]
- Graves, J.L.; Hertweck, K.L.; Phillips, M.A.; Han, M.V.; Cabral, L.G.; Barter, T.T.; Greer, L.F.; Burke, M.K.; Mueller, L.D.; Rose, M.R. Genomics of Parallel Experimental Evolution in Drosophila. Mol. Biol. Evol. 2017, 34, 831–842. [Google Scholar] [CrossRef] [Green Version]
- Hardy, C.M.; Burke, M.K.; Everett, L.J.; Han, M.V.; Lantz, K.M.; Gibbs, A.G. Genome-Wide Analysis of Starvation-Selected Drosophila melanogaster—A Genetic Model of Obesity. Mol. Biol. Evol. 2018, 35, 50–65. [Google Scholar] [CrossRef] [Green Version]
- Remolina, S.C.; Chang, P.L.; Leips, J.; Nuzhdin, S.V.; Hughes, K.A. Genomic Basis Of Aging And Life-History Evolution In Drosophila melanogaster: Genomics Of Life-History Evolution. Evolution 2012, 66, 3390–3403. [Google Scholar] [CrossRef] [Green Version]
- Barter, T.T.; Greenspan, Z.S.; Phillips, M.A.; Mueller, L.D.; Rose, M.R.; Ranz, J.M. Drosophila Transcriptomics with and without Ageing. Biogerontology 2019, 20, 699–710. [Google Scholar] [CrossRef]
- Srivastava, S. Emerging Insights into the Metabolic Alterations in Aging Using Metabolomics. Metabolites 2019, 9, 301. [Google Scholar] [CrossRef] [Green Version]
- Cox, J.E.; Thummel, C.S.; Tennessen, J.M. Metabolomic Studies in Drosophila. Genetics 2017, 206, 1169–1185. [Google Scholar] [CrossRef] [Green Version]
- Hoffman, J.M.; Soltow, Q.A.; Li, S.; Sidik, A.; Jones, D.P.; Promislow, D.E.L. Effects of Age, Sex, and Genotype on High-sensitivity Metabolomic Profiles in the Fruit Fly, D. Rosophila melanogaster. Aging Cell 2014, 13, 596–604. [Google Scholar] [CrossRef] [PubMed]
- Laye, M.J.; Tran, V.; Jones, D.P.; Kapahi, P.; Promislow, D.E.L. The Effects of Age and Dietary Restriction on the Tissue-specific Metabolome of D. Rosophila. Aging Cell 2015, 14, 797–808. [Google Scholar] [CrossRef] [PubMed]
- Hanai, Y.; Matsuo, K.; Kosugi, T.; Kusano, A.; Ohashi, H.; Kimura, I.; Hirayama, S.; Nanjo, Y.; Ishii, Y.; Sato, T.; et al. Rapid, Simple, and Clinically Applicable High-Performance Liquid Chromatography Method for Clinical Determination of Plasma Colistin Concentrations. J. Pharm. Health Care Sci. 2018, 4, 22. [Google Scholar] [CrossRef] [PubMed]
- Pollak, N.; Dölle, C.; Ziegler, M. The Power to Reduce: Pyridine Nucleotides—Small Molecules with a Multitude of Functions. Biochem. J. 2007, 402, 205–218. [Google Scholar] [CrossRef] [PubMed]
- Yang, Y.; Sauve, A.A. NAD + Metabolism: Bioenergetics, Signaling and Manipulation for Therapy. Biochim. Biophys. Acta (BBA) Proteins Proteom. 2016, 1864, 1787–1800. [Google Scholar] [CrossRef] [PubMed] [Green Version]
- Chini, C.C.S.; Peclat, T.R.; Warner, G.M.; Kashyap, S.; Espindola-Netto, J.M.; de Oliveira, G.C.; Gomez, L.S.; Hogan, K.A.; Tarragó, M.G.; Puranik, A.S.; et al. CD38 Ecto-Enzyme in Immune Cells Is Induced during Aging and Regulates NAD+ and NMN Levels. Nat. Metab. 2020, 2, 1284–1304. [Google Scholar] [CrossRef]
- Chini, C.; Hogan, K.A.; Warner, G.M.; Tarragó, M.G.; Peclat, T.R.; Tchkonia, T.; Kirkland, J.L.; Chini, E. The NADase CD38 Is Induced by Factors Secreted from Senescent Cells Providing a Potential Link between Senescence and Age-Related Cellular NAD+ Decline. Biochem. Biophys. Res. Commun. 2019, 513, 486–493. [Google Scholar] [CrossRef] [PubMed]
- Chini, C.C.S.; Tarragó, M.G.; Chini, E.N. NAD and the Aging Process: Role in Life, Death and Everything in Between. Mol. Cell. Endocrinol. 2017, 455, 62–74. [Google Scholar] [CrossRef]
- McReynolds, M.R.; Chellappa, K.; Baur, J.A. Age-Related NAD+ Decline. Exp. Gerontol. 2020, 134, 110888. [Google Scholar] [CrossRef]
- Gomes, A.P.; Price, N.L.; Ling, A.J.Y.; Moslehi, J.J.; Montgomery, M.K.; Rajman, L.; White, J.P.; Teodoro, J.S.; Wrann, C.D.; Hubbard, B.P.; et al. Declining NAD+ Induces a Pseudohypoxic State Disrupting Nuclear-Mitochondrial Communication during Aging. Cell 2013, 155, 1624–1638. [Google Scholar] [CrossRef] [Green Version]
- Yoshino, J.; Baur, J.A.; Imai, S. NAD+ Intermediates: The Biology and Therapeutic Potential of NMN and NR. Cell Metab. 2018, 27, 513–528. [Google Scholar] [CrossRef] [Green Version]
- Zhang, H.; Ryu, D.; Wu, Y.; Gariani, K.; Wang, X.; Luan, P.; DAmico, D.; Ropelle, E.R.; Lutolf, M.P.; Aebersold, R.; et al. NAD+ Repletion Improves Mitochondrial and Stem Cell Function and Enhances Life Span in Mice. Science 2016, 352, 1436–1443. [Google Scholar] [CrossRef] [PubMed] [Green Version]
- McReynolds, M.R.; Chellappa, K.; Chiles, E.; Jankowski, C.; Shen, Y.; Chen, L.; Descamps, H.C.; Mukherjee, S.; Bhat, Y.R.; Lingala, S.R.; et al. NAD+ Flux Is Maintained in Aged Mice despite Lower Tissue Concentrations. Cell Syst. 2021, 12, 1160–1172.e4. [Google Scholar] [CrossRef] [PubMed]
- Lee, S.-J.; Murphy, C.T.; Kenyon, C. Glucose Shortens the Life Span of C. Elegans by Downregulating DAF-16/FOXO Activity and Aquaporin Gene Expression. Cell Metab. 2009, 10, 379–391. [Google Scholar] [CrossRef] [PubMed] [Green Version]
- Mouchiroud, L.; Houtkooper, R.H.; Moullan, N.; Katsyuba, E.; Ryu, D.; Cantó, C.; Mottis, A.; Jo, Y.-S.; Viswanathan, M.; Schoonjans, K.; et al. The NAD+/Sirtuin Pathway Modulates Longevity through Activation of Mitochondrial UPR and FOXO Signaling. Cell 2013, 154, 430–441. [Google Scholar] [CrossRef] [PubMed] [Green Version]
- Chen, S.; Whetstine, J.R.; Ghosh, S.; Hanover, J.A.; Gali, R.R.; Grosu, P.; Shi, Y. The Conserved NAD(H)-Dependent Corepressor CTBP-1 Regulates Caenorhabditis Elegans Life Span. Proc. Natl. Acad. Sci. USA 2009, 106, 1496–1501. [Google Scholar] [CrossRef] [Green Version]
- Salvatori, I.; Valle, C.; Ferri, A.; Carrì, M.T. SIRT3 and Mitochondrial Metabolism in Neurodegenerative Diseases. Neurochem. Int. 2017, 109, 184–192. [Google Scholar] [CrossRef]
- Verdin, E. NAD+ in Aging, Metabolism, and Neurodegeneration. Science 2015, 350, 1208–1213. [Google Scholar] [CrossRef]
- Mohar, D.S.; Malik, S. The Sirtuin System: The Holy Grail of Resveratrol? J. Clin. Exp. Cardiol. 2012, 3, 216. [Google Scholar] [CrossRef] [Green Version]
- Lombard, D.B.; Tishkoff, D.X.; Bao, J. Mitochondrial Sirtuins in the Regulation of Mitochondrial Activity and Metabolic Adaptation. In Histone Deacetylases: The Biology and Clinical Implication; Yao, T.-P., Seto, E., Eds.; Handbook of Experimental Pharmacology; Springer: Berlin/Heidelberg, Germany, 2011; Volume 206, pp. 163–188. ISBN 978-3-642-21630-5. [Google Scholar]
- Xie, N.; Zhang, L.; Gao, W.; Huang, C.; Huber, P.E.; Zhou, X.; Li, C.; Shen, G.; Zou, B. NAD+ Metabolism: Pathophysiologic Mechanisms and Therapeutic Potential. Signal Transduct. Target. Ther. 2020, 5, 227. [Google Scholar] [CrossRef]
- Covarrubias, A.J.; Perrone, R.; Grozio, A.; Verdin, E. NAD+ Metabolism and Its Roles in Cellular Processes during Ageing. Nat. Rev. Mol. Cell Biol. 2021, 22, 119–141. [Google Scholar] [CrossRef]
- Zhang, J.; Xiang, H.; Liu, J.; Chen, Y.; He, R.-R.; Liu, B. Mitochondrial Sirtuin 3: New Emerging Biological Function and Therapeutic Target. Theranostics 2020, 10, 8315–8342. [Google Scholar] [CrossRef]
- Giralt, A.; Villarroya, F. SIRT3, a Pivotal Actor in Mitochondrial Functions: Metabolism, Cell Death and Aging. Biochem. J. 2012, 444, 1–10. [Google Scholar] [CrossRef] [Green Version]
- Kincaid, B.; Bossy-Wetzel, E. Forever Young: SIRT3 a Shield against Mitochondrial Meltdown, Aging, and Neurodegeneration. Front. Aging Neurosci. 2013, 5, 48. [Google Scholar] [CrossRef] [Green Version]
- Bonkowski, M.S.; Sinclair, D.A. Slowing Ageing by Design: The Rise of NAD+ and Sirtuin-Activating Compounds. Nat. Rev. Mol. Cell Biol. 2016, 17, 679–690. [Google Scholar] [CrossRef]
- Li, X.; Kazgan, N. Mammalian Sirtuins and Energy Metabolism. Int. J. Biol. Sci. 2011, 7, 575–587. [Google Scholar] [CrossRef] [Green Version]
- Chong, Z.Z.; Shang, Y.C.; Wang, S.; Maiese, K. SIRT1: New Avenues of Discovery for Disorders of Oxidative Stress. Exp. Opin. Ther. Targets 2012, 16, 167–178. [Google Scholar] [CrossRef]
- Rajabi, N.; Auth, M.; Troelsen, K.R.; Pannek, M.; Bhatt, D.P.; Fontenas, M.; Hirschey, M.D.; Steegborn, C.; Madsen, A.S.; Olsen, C.A. Mechanism-Based Inhibitors of the Human Sirtuin 5 Deacylase: Structure-Activity Relationship, Biostructural, and Kinetic Insight. Angew. Chem. Int. Ed. 2017, 56, 14836–14841. [Google Scholar] [CrossRef] [Green Version]
- Weng, H.; Ma, Y.; Chen, L.; Cai, G.; Chen, Z.; Zhang, S.; Ye, Q. A New Vision of Mitochondrial Unfolded Protein Response to the Sirtuin Family. Curr. Neuropharmacol. 2020, 18, 613–623. [Google Scholar] [CrossRef]
- Sadria, M.; Layton, A.T. Interactions among MTORC, AMPK and SIRT: A Computational Model for Cell Energy Balance and Metabolism. Cell Commun. Signal. 2021, 19, 57. [Google Scholar] [CrossRef]
- Jiang, D.; Cui, H.; Xie, N.; Banerjee, S.; Liu, R.-M.; Dai, H.; Thannickal, V.J.; Liu, G. ATF4 Mediates Mitochondrial Unfolded Protein Response in Alveolar Epithelial Cells. Am. J. Respir. Cell Mol. Biol. 2020, 63, 478–489. [Google Scholar] [CrossRef]
- Schröder, M.; Kaufman, R.J. ER Stress and the Unfolded Protein Response. Mutat. Res./Fundament. Mol. Mech. Mutagen. 2005, 569, 29–63. [Google Scholar] [CrossRef]
- Rutkowski, D.T.; Kaufman, R.J. A Trip to the ER: Coping with Stress. Trends Cell Biol. 2004, 14, 20–28. [Google Scholar] [CrossRef] [PubMed]
- Rutkowski, D.T.; Wu, J.; Back, S.-H.; Callaghan, M.U.; Ferris, S.P.; Iqbal, J.; Clark, R.; Miao, H.; Hassler, J.R.; Fornek, J.; et al. UPR Pathways Combine to Prevent Hepatic Steatosis Caused by ER Stress-Mediated Suppression of Transcriptional Master Regulators. Dev. Cell 2008, 15, 829–840. [Google Scholar] [CrossRef] [PubMed] [Green Version]
- Rutkowski, D.T.; Kaufman, R.J. All Roads Lead to ATF4. Dev. Cell 2003, 4, 442–444. [Google Scholar] [CrossRef] [Green Version]
- Yoon, M.-S. The Emerging Role of Branched-Chain Amino Acids in Insulin Resistance and Metabolism. Nutrients 2016, 8, 405. [Google Scholar] [CrossRef] [Green Version]
- Moberg, M.; Apró, W.; Ekblom, B.; van Hall, G.; Holmberg, H.-C.; Blomstrand, E. Activation of MTORC1 by Leucine Is Potentiated by Branched-Chain Amino Acids and Even More so by Essential Amino Acids Following Resistance Exercise. Am. J. Physiol.-Cell Physiol. 2016, 310, C874–C884. [Google Scholar] [CrossRef] [PubMed] [Green Version]
- Chen, K.; Zhang, Z.; Li, J.; Xie, S.; Shi, L.-J.; He, Y.-H.; Liang, X.-F.; Zhu, Q.-S.; He, S. Different Regulation of Branched-Chain Amino Acid on Food Intake by TOR Signaling in Chinese Perch (Siniperca chuatsi). Aquaculture 2021, 530, 735792. [Google Scholar] [CrossRef]
- Zhang, S.; Zeng, X.; Ren, M.; Mao, X.; Qiao, S. Novel Metabolic and Physiological Functions of Branched Chain Amino Acids: A Review. J. Anim. Sci. Biotechnol. 2017, 8, 10. [Google Scholar] [CrossRef] [Green Version]
- Pakos-Zebrucka, K.; Koryga, I.; Mnich, K.; Ljujic, M.; Samali, A.; Gorman, A.M. The Integrated Stress Response. EMBO Rep. 2016, 17, 1374–1395. [Google Scholar] [CrossRef] [Green Version]
- Pereira, R.O.; Tadinada, S.M.; Zasadny, F.M.; Oliveira, K.J.; Pires, K.M.P.; Olvera, A.; Jeffers, J.; Souvenir, R.; Mcglauflin, R.; Seei, A.; et al. OPA 1 Deficiency Promotes Secretion of FGF 21 from Muscle That Prevents Obesity and Insulin Resistance. EMBO J. 2017, 36, 2126–2145. [Google Scholar] [CrossRef]
- Byles, V.; Cormerais, Y.; Kalafut, K.; Barrera, V.; Hughes Hallett, J.E.; Sui, S.H.; Asara, J.M.; Adams, C.M.; Hoxhaj, G.; Ben-Sahra, I.; et al. Hepatic MTORC1 Signaling Activates ATF4 as Part of Its Metabolic Response to Feeding and Insulin. Mol. Metab. 2021, 53, 101309. [Google Scholar] [CrossRef]
- Torrence, M.E.; MacArthur, M.R.; Hosios, A.M.; Valvezan, A.J.; Asara, J.M.; Mitchell, J.R.; Manning, B.D. The MTORC1-Mediated Activation of ATF4 Promotes Protein and Glutathione Synthesis Downstream of Growth Signals. eLife 2021, 10, e63326. [Google Scholar] [CrossRef] [PubMed]
- Costa-Mattioli, M.; Walter, P. The Integrated Stress Response: From Mechanism to Disease. Science 2020, 368, eaat5314. [Google Scholar] [CrossRef] [PubMed]
- Pereira, R.O.; Marti, A.; Olvera, A.C.; Tadinada, S.M.; Bjorkman, S.H.; Weatherford, E.T.; Morgan, D.A.; Westphal, M.; Patel, P.H.; Kirby, A.K.; et al. OPA1 Deletion in Brown Adipose Tissue Improves Thermoregulation and Systemic Metabolism via FGF21. eLife 2021, 10, e66519. [Google Scholar] [CrossRef] [PubMed]
- Averous, J.; Lambert-Langlais, S.; Mesclon, F.; Carraro, V.; Parry, L.; Jousse, C.; Bruhat, A.; Maurin, A.-C.; Pierre, P.; Proud, C.G.; et al. GCN2 Contributes to MTORC1 Inhibition by Leucine Deprivation through an ATF4 Independent Mechanism. Sci. Rep. 2016, 6, 27698. [Google Scholar] [CrossRef]
- Longchamp, A.; Mirabella, T.; Arduini, A.; MacArthur, M.R.; Das, A.; Treviño-Villarreal, J.H.; Hine, C.; Ben-Sahra, I.; Knudsen, N.H.; Brace, L.E.; et al. Amino Acid Restriction Triggers Angiogenesis via GCN2/ATF4 Regulation of VEGF and H2S Production. Cell 2018, 173, 117–129.e14. [Google Scholar] [CrossRef] [Green Version]
- Ye, J.; Kumanova, M.; Hart, L.S.; Sloane, K.; Zhang, H.; De Panis, D.N.; Bobrovnikova-Marjon, E.; Diehl, J.A.; Ron, D.; Koumenis, C. The GCN2-ATF4 Pathway Is Critical for Tumour Cell Survival and Proliferation in Response to Nutrient Deprivation. EMBO J. 2010, 29, 2082–2096. [Google Scholar] [CrossRef] [Green Version]
- López-Otín, C.; Blasco, M.A.; Partridge, L.; Serrano, M.; Kroemer, G. The Hallmarks of Aging. Cell 2013, 153, 1194–1217. [Google Scholar] [CrossRef] [Green Version]
- Harrison, B.R.; Hoffman, J.M.; Samuelson, A.; Raftery, D.; Promislow, D.E.L. Modular Evolution of the Drosophila Metabolome. Mol. Biol. Evol. 2021, 39, msab307. [Google Scholar] [CrossRef]
- Kaya, A.; Phua, C.Z.J.; Lee, M.; Wang, L.; Tyshkovskiy, A.; Ma, S.; Barre, B.; Liu, W.; Harrison, B.R.; Zhao, X.; et al. Evolution of Natural Lifespan Variation and Molecular Strategies of Extended Lifespan. eLife 2021, 10, e64860. [Google Scholar] [CrossRef]
- Houtkooper, R.H.; Argmann, C.; Houten, S.M.; Cantó, C.; Jeninga, E.H.; Andreux, P.A.; Thomas, C.; Doenlen, R.; Schoonjans, K.; Auwerx, J. The Metabolic Footprint of Aging in Mice. Sci. Rep. 2011, 1, 134. [Google Scholar] [CrossRef]
- Haddadi, M.; Jahromi, S.R.; Sagar, B.K.C.; Patil, R.K.; Shivanandappa, T.; Ramesh, S.R. Brain Aging, Memory Impairment and Oxidative Stress: A Study in Drosophila melanogaster. Behav. Brain Res. 2014, 259, 60–69. [Google Scholar] [CrossRef] [PubMed]
- Omelyanchuk, L.V.; Shaposhnikov, M.V.; Moskalev, A.A. Drosophila Nervous System as a Target of Aging and Anti-Aging Interventions. Front. Genet. 2015, 6, 89. [Google Scholar] [CrossRef] [PubMed] [Green Version]
- Fabian, D.K.; Garschall, K.; Klepsatel, P.; Santos-Matos, G.; Sucena, É.; Kapun, M.; Lemaitre, B.; Schlötterer, C.; Arking, R.; Flatt, T. Evolution of Longevity Improves Immunity in Drosophila. Evol. Lett. 2018, 2, 567–579. [Google Scholar] [CrossRef] [PubMed] [Green Version]
- Kapahi, P.; Zid, B.M.; Harper, T.; Koslover, D.; Sapin, V.; Benzer, S. Regulation of Lifespan in Drosophila by Modulation of Genes in the TOR Signaling Pathway. Curr. Biol. 2004, 14, 885–890. [Google Scholar] [CrossRef] [PubMed] [Green Version]
- Evans, D.S.; Kapahi, P.; Hsueh, W.-C.; Kockel, L. TOR Signaling Never Gets Old: Aging, Longevity and TORC1 Activity. Ageing Res. Rev. 2011, 10, 225–237. [Google Scholar] [CrossRef] [PubMed] [Green Version]
- Partridge, L.; Alic, N.; Bjedov, I.; Piper, M.D.W. Ageing in Drosophila: The Role of the Insulin/Igf and TOR Signalling Network. Exp. Gerontol. 2011, 46, 376–381. [Google Scholar] [CrossRef] [Green Version]
- Nakamura, S.; Yoshimori, T. Autophagy and Longevity. Mol. Cells 2018, 41, 65–72. [Google Scholar] [CrossRef]
- Vincow, E.S.; Thomas, R.E.; Merrihew, G.E.; Shulman, N.J.; Bammler, T.K.; MacDonald, J.W.; MacCoss, M.J.; Pallanck, L.J. Autophagy Accounts for Approximately One-Third of Mitochondrial Protein Turnover and Is Protein Selective. Autophagy 2019, 15, 1592–1605. [Google Scholar] [CrossRef]
- Vincow, E.S.; Merrihew, G.; Thomas, R.E.; Shulman, N.J.; Beyer, R.P.; MacCoss, M.J.; Pallanck, L.J. The PINK1-Parkin Pathway Promotes Both Mitophagy and Selective Respiratory Chain Turnover in Vivo. Proc. Natl. Acad. Sci. USA 2013, 110, 6400–6405. [Google Scholar] [CrossRef] [PubMed] [Green Version]
- Kim, J.; Lee, S.; Ko, S.; Kim-Ha, J. DGIPC Is Required for the Locomotive Activity and Longevity in Drosophila. Biochem. Biophys. Res. Commun. 2010, 402, 565–570. [Google Scholar] [CrossRef]
- Pereira, G.B.; Valente, V.; de Queiroz, M.S.; Vianna, M.C.B.; Paçó-Larson, M.L. Overexpression of Kermit/DGIPC Is Associated with Lethality in Drosophila melanogaster. Braz. J. Med. Biol. Res. 2011, 44, 283–290. [Google Scholar] [CrossRef] [PubMed]
- Buchanan, R.L.; Benzer, S. Defective Glia in the Drosophila Brain Degeneration Mutant Drop-Dead. Neuron 1993, 10, 839–850. [Google Scholar] [CrossRef]
- Kretzschmar, D.; Hasan, G.; Sharma, S.; Heisenberg, M.; Benzer, S. The Swiss Cheese Mutant Causes Glial Hyperwrapping and Brain Degeneration in Drosophila. J. Neurosci. 1997, 17, 7425–7432. [Google Scholar] [CrossRef] [Green Version]
- Lu, B.; Vogel, H. Drosophila Models of Neurodegenerative Diseases. Annu. Rev. Pathol. Mech. Dis. 2009, 4, 315–342. [Google Scholar] [CrossRef] [Green Version]
- Alcedo, J.; Flatt, T.; Pasyukova, E.G. Neuronal Inputs and Outputs of Aging and Longevity. Front. Genet. 2013, 4, 71. [Google Scholar] [CrossRef] [Green Version]
- Haselton, A.T.; Fridell, Y.-W.C. Adult Drosophila melanogaster as a Model for the Study of Glucose Homeostasis. Aging 2010, 2, 523–526. [Google Scholar] [CrossRef] [Green Version]
- Ravera, S.; Podestà, M.; Sabatini, F.; Dagnino, M.; Cilloni, D.; Fiorini, S.; Barla, A.; Frassoni, F. Discrete Changes in Glucose Metabolism Define Aging. Sci. Rep. 2019, 9, 10347. [Google Scholar] [CrossRef] [Green Version]
- Niwa, R.; Niwa, Y.S. Enzymes for Ecdysteroid Biosynthesis: Their Biological Functions in Insects and Beyond. Biosci. Biotechnol. Biochem. 2014, 78, 1283–1292. [Google Scholar] [CrossRef] [Green Version]
- Conway, J.R.; Lex, A.; Gehlenborg, N. UpSetR: An R Package for the Visualization of Intersecting Sets and Their Properties. Bioinformatics 2017, 33, 2938–2940. [Google Scholar] [CrossRef] [Green Version]
- Barghi, N.; Hermisson, J.; Schlötterer, C. Polygenic Adaptation: A Unifying Framework to Understand Positive Selection. Nat. Rev. Genet. 2020, 21, 769–781. [Google Scholar] [CrossRef]
- Ives, P.T. Further Genetic Studies of the South Amherst Population of Drosophila melanogaster. Evolution 1970, 24, 507–518. [Google Scholar] [CrossRef]
- Rose, M.; Charlesworth, B. A Test of Evolutionary Theories of Senescence. Nature 1980, 287, 141–142. [Google Scholar] [CrossRef] [PubMed]
- Rose, M.R.; Charlesworth, B. Genetics of life history in Drosophila melanogaster. II. Exploratory selection experiments. Genetics 1981, 97, 187–196. [Google Scholar] [CrossRef]
- Kofler, R.; Orozco-terWengel, P.; De Maio, N.; Pandey, R.V.; Nolte, V.; Futschik, A.; Kosiol, C.; Schlötterer, C. PoPoolation: A Toolbox for Population Genetic Analysis of Next Generation Sequencing Data from Pooled Individuals. PLoS ONE 2011, 6, e15925. [Google Scholar] [CrossRef] [Green Version]
- Li, B.; Tang, J.; Yang, Q.; Li, S.; Cui, X.; Li, Y.; Chen, Y.; Xue, W.; Li, X.; Zhu, F. NOREVA: Normalization and Evaluation of MS-Based Metabolomics Data. Nucleic Acids Res. 2017, 45, W162–W170. [Google Scholar] [CrossRef] [Green Version]
- Chong, J.; Soufan, O.; Li, C.; Caraus, I.; Li, S.; Bourque, G.; Wishart, D.S.; Xia, J. MetaboAnalyst 4.0: Towards More Transparent and Integrative Metabolomics Analysis. Nucleic Acids Res. 2018, 46, W486–W494. [Google Scholar] [CrossRef] [Green Version]
- Chong, J.; Xia, J. MetaboAnalystR: An R Package for Flexible and Reproducible Analysis of Metabolomics Data. Bioinformatics 2018, 34, 4313–4314. [Google Scholar] [CrossRef] [Green Version]
- Xia, J.; Wishart, D.S. MSEA: A Web-Based Tool to Identify Biologically Meaningful Patterns in Quantitative Metabolomic Data. Nucleic Acids Res. 2010, 38, W71–W77. [Google Scholar] [CrossRef] [Green Version]
- Xia Lab—McGill University. Frequently Asked Questions (FAQs). Available online: https://www.mcgill.ca/coronavirus/faqs (accessed on 20 November 2021).
- Li, H.; Handsaker, B.; Wysoker, A.; Fennell, T.; Ruan, J.; Homer, N.; Marth, G.; Abecasis, G.; Durbin, R.; 1000 Genome Project Data Processing Subgroup. The Sequence Alignment/Map Format and SAMtools. Bioinformatics 2009, 25, 2078–2079. [Google Scholar] [CrossRef] [Green Version]
- Landis, J.R.; Heyman, E.R.; Koch, G.G. Average Partial Association in Three-Way Contingency Tables: A Review and Discussion of Alternative Tests. Int. Stat. Rev. 1978, 46, 237. [Google Scholar] [CrossRef]
- Core R Team. R: A Language and Environment for Statistical Computing. R Foundation for Statistical Computing, Vienna, Austria. Available online: https://www.R-Project.Org/ (accessed on 30 November 2021).
- Petersen, A.; Witten, D.; Simon, N. Fused Lasso Additive Model. J. Comput. Graph. Stat. 2016, 25, 1005–1025. [Google Scholar] [CrossRef] [PubMed] [Green Version]
- Baldwin-Brown, J.G.; Long, A.D.; Thornton, K.R. The Power to Detect Quantitative Trait Loci Using Resequenced, Experimentally Evolved Populations of Diploid, Sexual Organisms. Mol. Biol. Evol. 2014, 31, 1040–1055. [Google Scholar] [CrossRef] [PubMed] [Green Version]
- Zhou, Y.; Zhou, B.; Pache, L.; Chang, M.; Khodabakhshi, A.H.; Tanaseichuk, O.; Benner, C.; Chanda, S.K. Metascape Provides a Biologist-Oriented Resource for the Analysis of Systems-Level Datasets. Nat. Commun. 2019, 10, 1523. [Google Scholar] [CrossRef]
- Shannon, P. Cytoscape: A Software Environment for Integrated Models of Biomolecular Interaction Networks. Gen. Res. 2003, 13, 2498–2504. [Google Scholar] [CrossRef] [PubMed]
- Ng’oma, E.; Williams-Simon, P.A.; Rahman, A.; King, E.G. Diverse Biological Processes Coordinate the Transcriptional Response to Nutritional Changes in a Drosophila melanogaster Multiparent Population. BMC Genom. 2020, 21, 84. [Google Scholar] [CrossRef] [Green Version]


| GO | Description | log (p Value) | ||
|---|---|---|---|---|
| Protein-protein interaction network | GO:0030182 | neuron differentiation | −16.5 | |
| GO:0048666 | neuron development | −15.5 | ||
| GO:0048667 | cell morphogenesis involved in neuron differentiation | −12.3 | ||
| MCODE Cluster | ||||
| MCODE networks | R-DME-70171 | Glycolysis | −6.6 | MCODE_1 |
| R-DME-70326 | Glucose metabolism | −6 | MCODE_1 | |
| R-DME-6798695 | Neutrophil degranulation | −5.8 | MCODE_1 | |
| R-DME-5620924 | Intraflagellar transport | −8.8 | MCODE_2 | |
| R-DME-5617833 | Cilium Assembly | −7.7 | MCODE_2 | |
| GO:0007018 | microtubule-based movement | −7.7 | MCODE_2 | |
| R-DME-983168 | Antigen processing: Ubiquitination & Proteasome degradation | −4.7 | MCODE_4 | |
| R-DME-983169 | Class I MHC mediated antigen processing & presentation | −4.7 | MCODE_4 | |
| GO:0043161 | proteasome-mediated ubiquitin-dependent protein catabolic process | −4.5 | MCODE_4 | |
| R-DME-72312 | rRNA processing | −5.9 | MCODE_5 | |
| R-DME-8868773 | rRNA processing in the nucleus and cytosol | −5.9 | MCODE_5 | |
| R-DME-6791226 | Major pathway of rRNA processing in the nucleolus and cytosol | −5.9 | MCODE_5 | |
| R-DME-156827 | L13a-mediated translational silencing of Ceruloplasmin expression | −5.7 | MCODE_6 | |
| R-DME-72613 | Eukaryotic Translation Initiation | −5.6 | MCODE_6 | |
| R-DME-72737 | Cap-dependent Translation Initiation | −5.6 | MCODE_6 | |
| R-DME-8856828 | Clathrin-mediated endocytosis | −8.4 | MCODE_7 | |
| GO:0072583 | clathrin-dependent endocytosis | −7.4 | MCODE_7 | |
| GO:0006898 | receptor-mediated endocytosis | −6.4 | MCODE_7 | |
| dme03020 | RNA polymerase | −7.9 | MCODE_8 | |
| ko03020 | RNA polymerase | −7.9 | MCODE_8 | |
| ko00240 | Pyrimidine metabolism | −6.5 | MCODE_8 | |
| R-DME-8877627 | Vitamin E | −8.4 | MCODE_9 | |
| R-DME-6806667 | Metabolism of fat-soluble vitamins | −8 | MCODE_9 | |
| R-DME-196854 | Metabolism of vitamins and cofactors | −5.8 | MCODE_9 | |
| GO:0045944 | positive regulation of transcription by RNA polymerase II | −4.7 | MCODE_10 | |
| GO:1902680 | positive regulation of RNA biosynthetic process | −4.3 | MCODE_10 | |
| GO:1903508 | positive regulation of nucleic acid-templated transcription | −4.3 | MCODE_10 |
Publisher’s Note: MDPI stays neutral with regard to jurisdictional claims in published maps and institutional affiliations. |
© 2022 by the authors. Licensee MDPI, Basel, Switzerland. This article is an open access article distributed under the terms and conditions of the Creative Commons Attribution (CC BY) license (https://creativecommons.org/licenses/by/4.0/).
Share and Cite
Phillips, M.A.; Arnold, K.R.; Vue, Z.; Beasley, H.K.; Garza-Lopez, E.; Marshall, A.G.; Morton, D.J.; McReynolds, M.R.; Barter, T.T.; Hinton, A., Jr. Combining Metabolomics and Experimental Evolution Reveals Key Mechanisms Underlying Longevity Differences in Laboratory Evolved Drosophila melanogaster Populations. Int. J. Mol. Sci. 2022, 23, 1067. https://doi.org/10.3390/ijms23031067
Phillips MA, Arnold KR, Vue Z, Beasley HK, Garza-Lopez E, Marshall AG, Morton DJ, McReynolds MR, Barter TT, Hinton A Jr. Combining Metabolomics and Experimental Evolution Reveals Key Mechanisms Underlying Longevity Differences in Laboratory Evolved Drosophila melanogaster Populations. International Journal of Molecular Sciences. 2022; 23(3):1067. https://doi.org/10.3390/ijms23031067
Chicago/Turabian StylePhillips, Mark A., Kenneth R. Arnold, Zer Vue, Heather K. Beasley, Edgar Garza-Lopez, Andrea G. Marshall, Derrick J. Morton, Melanie R. McReynolds, Thomas T. Barter, and Antentor Hinton, Jr. 2022. "Combining Metabolomics and Experimental Evolution Reveals Key Mechanisms Underlying Longevity Differences in Laboratory Evolved Drosophila melanogaster Populations" International Journal of Molecular Sciences 23, no. 3: 1067. https://doi.org/10.3390/ijms23031067