
Activation of the Monocyte/Macrophage System and Abnormal Blood Levels of Lymphocyte Subpopulations in Individuals with Autism Spectrum Disorder: A Systematic Review and Meta-Analysis

 , ,
, ,
Abstract
:1. Introduction
2. Methods
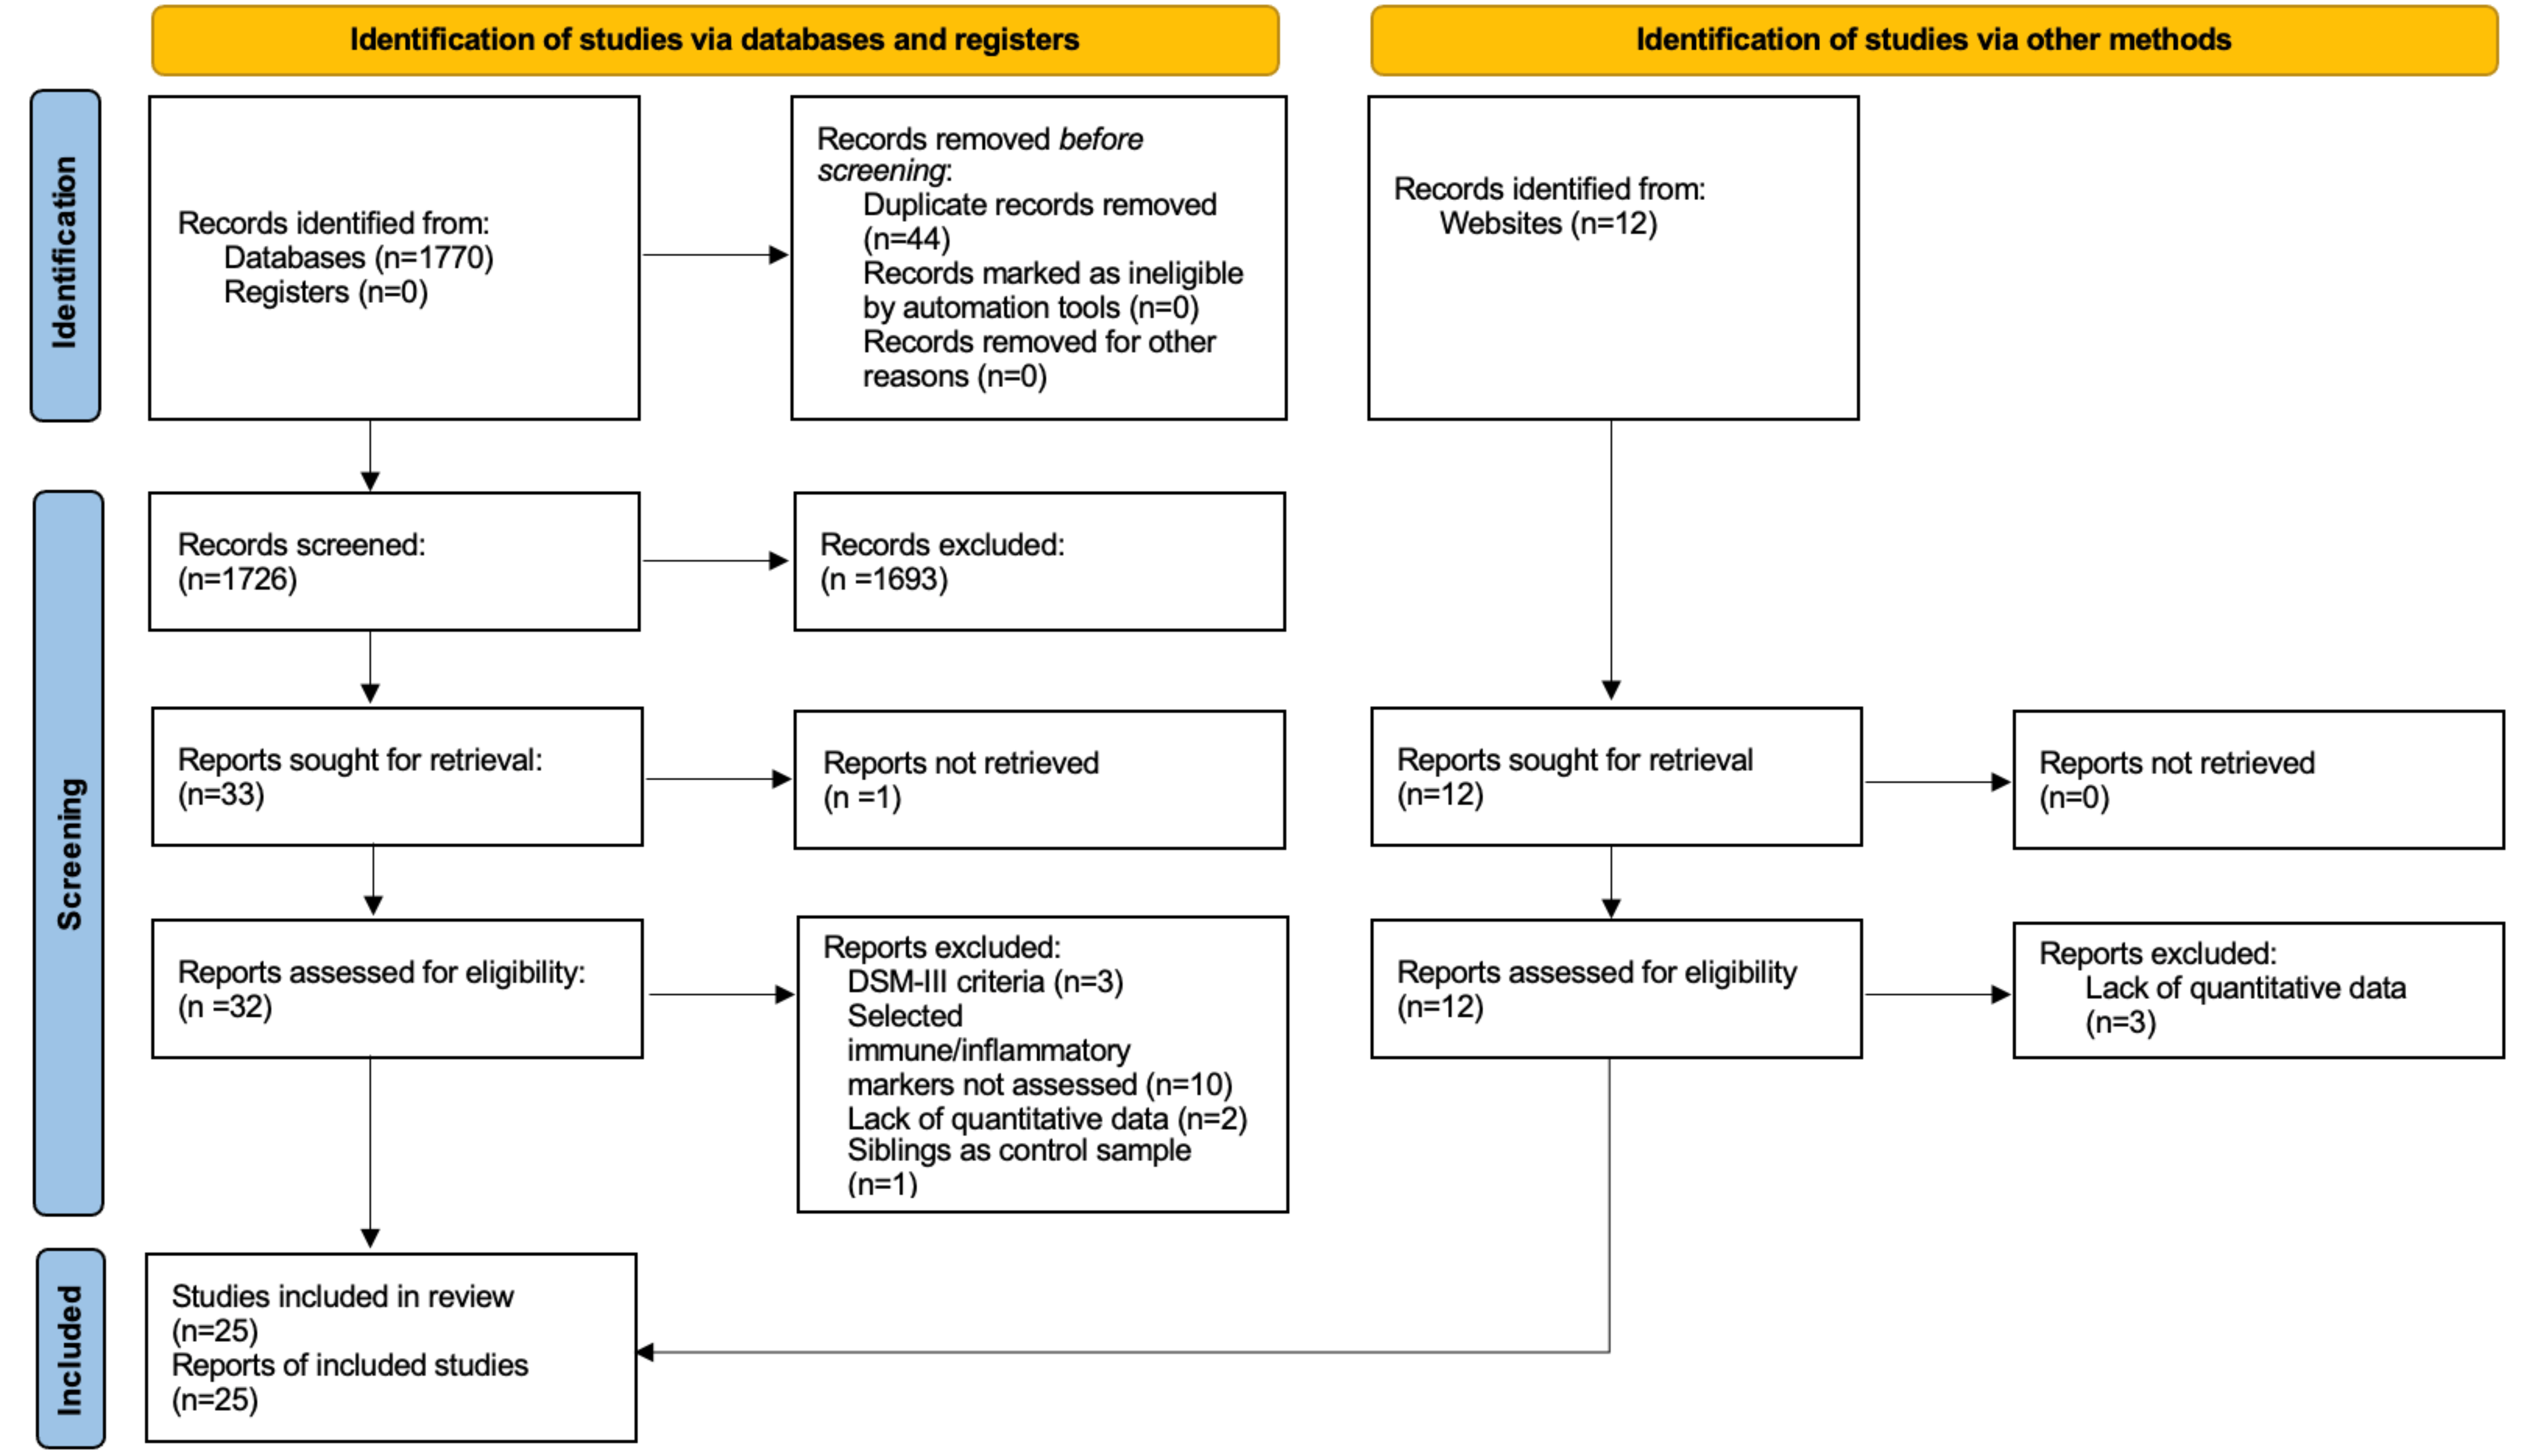
2.1. Study Selection
2.1.1. Eligibility Criteria
2.1.2. Search Strategy
2.2. Data Extraction
2.3. Quality Assessment
2.4. Data Analysis
3. Results
3.1. General Characteristics of Eligible Studies
3.2. WBC
3.3. Neutrophils
3.4. Monocytes
3.5. Lymphocytes
3.6. B Cells
3.7. NK Cells
3.8. T Cells
3.9. Tc Cells
3.10. Th Cells
3.11. Th/Tc Cells Ratio
3.12. Th17 Cells
3.13. Treg Cells
3.14. NLR
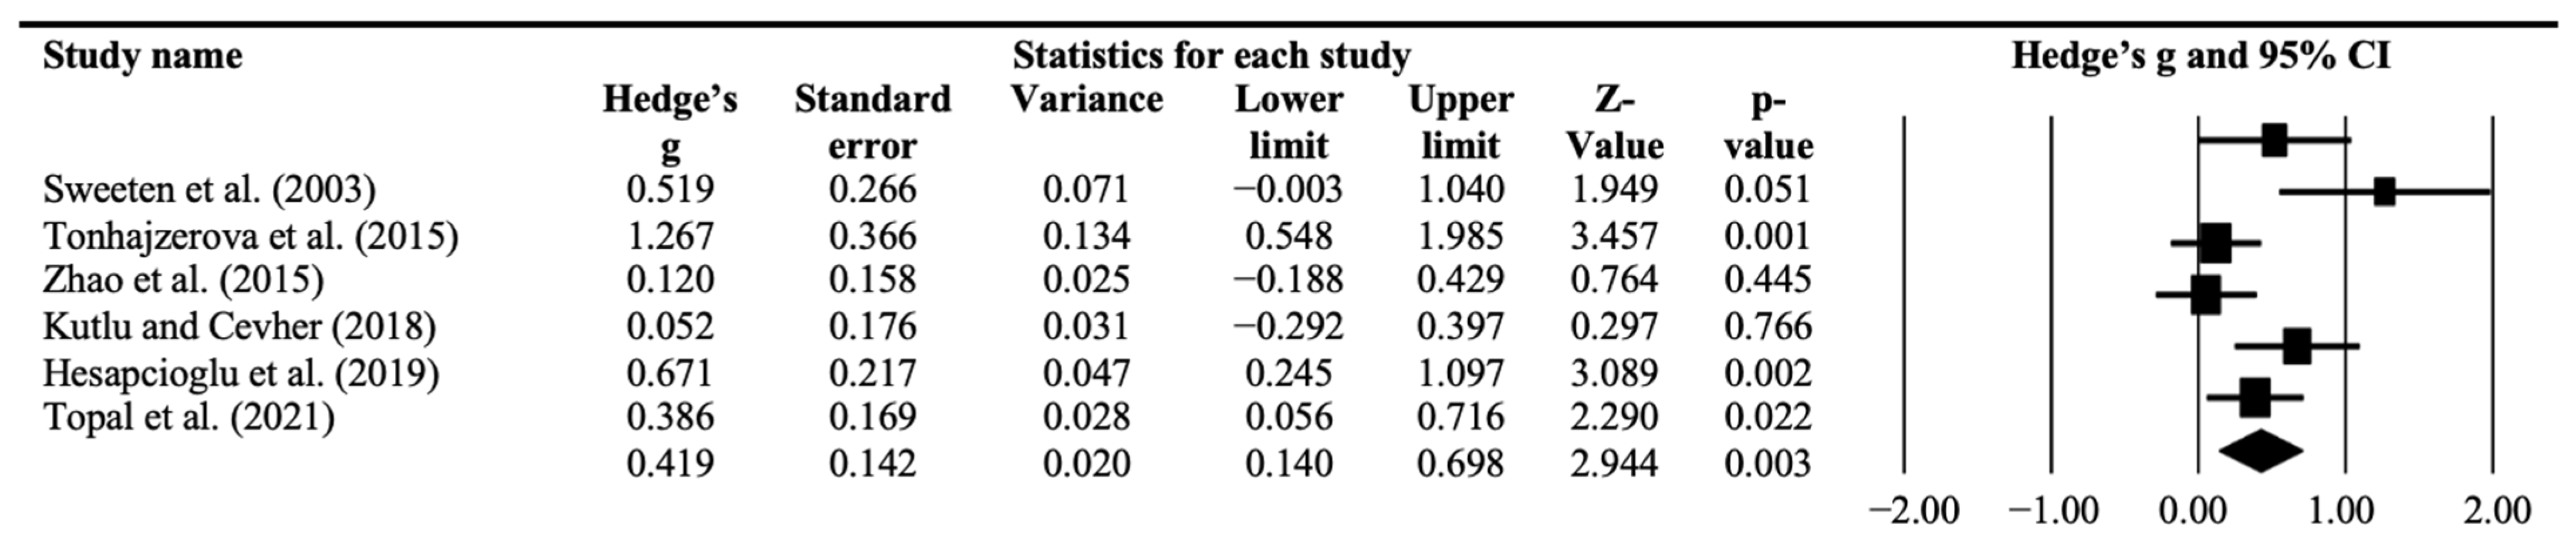
3.15. Neopterin
4. Discussion
5. Conclusions
Supplementary Materials
Author Contributions
Funding
Institutional Review Board Statement
Informed Consent Statement
Acknowledgments
Conflicts of Interest
References
- Lord, C.; Elsabbagh, M.; Baird, G.; Veenstra-Vanderweele, J. Autism spectrum disorder. Lancet 2018, 392, 508–520. [Google Scholar] [CrossRef]
- Blanchard, A.; Chihuri, S.; DiGuiseppi, C.G.; Li, G. Risk of Self-harm in children and adults with Autism Spectrum Disorder: A systematic Review and Meta-Analysis. JAMA Netw. Open 2021, 4, e2130272. [Google Scholar] [CrossRef] [PubMed]
- Lyall, K.; Schmidt, R.J.; Hertz-Piccioto, I. Maternal lifestyle and environmental risk factors for autism spectrum disorders. Int. J. Epidemiol. 2014, 43, 443–464. [Google Scholar] [CrossRef] [PubMed] [Green Version]
- Lombardo, M.V.; Moon, H.M.; Su, J.; Palmer, T.D.; Courchesne, E.; Pramparo, T. Maternal immune activation dysregulation of the fetal brain transcriptome and relevance to the pathophysiology of autism spectrum disorder. Mol. Psychiatry 2017, 23, 1001–1013. [Google Scholar] [CrossRef] [PubMed] [Green Version]
- Bennabi, M.; Gaman, A.; Delorme, R.; Boukouaci, W.; Manier, C.; Scheid, I.; Mohammed, N.S.; Bengoufa, D.; Charron, D.; Krishnamoorthy, R.; et al. HLA-class II haplotypes and Autism Spectrum Disorders. Sci. Rep. 2018, 8, 7639. [Google Scholar] [CrossRef] [PubMed] [Green Version]
- Harville, T.; Rhodes-Clark, B.; Bennuri, S.C.; Delhey, L.; Slattery, J.; Tippett, M.; Wynne, R.; Rose, S.; Kahler, S.; Frye, R.E. Inheritance of HLA-Cw7 Associated with Autism Spectrum Disorder (ASD). Front. Psychiatry 2019, 10, 612. [Google Scholar] [CrossRef] [PubMed]
- Careaga, M.; Van De Water, J.; Ashwood, P. Immune dysfunction in autism: A pathway to treatment. Neurotherapeutics 2010, 7, 283–292. [Google Scholar] [CrossRef] [Green Version]
- Zerbo, O.; Leong, A.; Barcellos, L.; Bernal, P.; Fireman, B.; Croen, L.A. Immune mediated conditions in autism spectrum disorders. Brain Behav. Immun. 2015, 46, 232–236. [Google Scholar] [CrossRef] [Green Version]
- Masi, A.; Quintana, D.S.; Glozier, N.; Lloyd, A.R.; Hickie, I.B.; Guastella, A.J. Cytokine aberrations in autism spectrum disorder: A systematic review and meta-analysis. Mol. Psychiatry 2014, 20, 440–446. [Google Scholar] [CrossRef]
- Saghazadeh, A.; Ataeinia, B.; Keynejad, K.; Abdolalizadeh, A.; Hirbod-Mobarakeh, A.; Rezaei, N. A meta-analysis of pro-inflammatory cytokines in autism spectrum disorders: Effects of age, gender, and latitude. J. Psychiatr. Res. 2019, 115, 90–102. [Google Scholar] [CrossRef]
- Saghazadeh, A.; Ataeinia, B.; Keynejad, K.; Abdolalizadeh, A.; Hirbod-Mobarakeh, A.; Rezaei, N. Anti-inflammatory cytokines in autism spectrum disorders: A systematic review and meta-analysis. Cytokine 2019, 123, 154740. [Google Scholar] [CrossRef] [PubMed]
- Wueest, S.; Konrad, D. The role of adipocyte-specific IL-6-type cytokine signaling in FFA and leptin release. Adipocyte 2018, 7, 226–228. [Google Scholar] [CrossRef] [PubMed] [Green Version]
- Murr, C.; Widner, B.; Wirleitner, B.; Fuchs, D. Neopterin as a marker for immune system activation. Curr. Drug Metab. 2002, 3, 175–187. [Google Scholar] [CrossRef] [PubMed]
- Moher, D.; Shamseer, L.; Clarke, M.; Ghersi, D.; Liberati, A.; Petticrew, M.; Shekelle, P.; Stewart, L.A. Preferred reporting items for systematic review and meta-analysis protocols (prisma-p) 2015 statement. Syst. Rev. 2015, 4, 1. [Google Scholar] [CrossRef] [PubMed] [Green Version]
- Higgins, J.; Green, S. Cochrane Handbook for Systematic Reviews of Interventions Version 5.1.0; Cochrane Collab: London, UK, 2011; Available online: www.handbook.cochrane.org (accessed on 7 September 2022).
- Hozo, S.P.; Djulbegovic, B.; Hozo, I. Estimating the mean and variance from the median, range, and the size of a sample. BMC Med. Res. Methodol. 2005, 5, 13. [Google Scholar] [CrossRef] [PubMed] [Green Version]
- Wells, G.; Shea, B.; O’Connell, D.; Peterson, J.; Welch, V.; Losos, M.; Tugwell, P. Newcastle-Ottawa Scale Assess. Qual Nonrandomized Stud Meta-Analyses. Available online: https://www.ohri.ca/programs/clinical_epidemiology/oxford.asp (accessed on 7 September 2022).
- Tufanaru, C.; Munn, Z.; Stephenson, M.; Aromataris, E. Fixed or random effects meta-analysis? Common methodological issues in systematic reviews of effectiveness. Int. J. Evid.-Based Health 2015, 13, 196–207. [Google Scholar] [CrossRef] [Green Version]
- Higgins, J.P.T.; Thompson, S.G.; Deeks, J.J.; Altman, D.G. Measuring inconsistency in meta-analyses. BMJ 2003, 327, 557–560. [Google Scholar] [CrossRef] [Green Version]
- Sterne, J.A.; Egger, M.; Moher, D. Addressing Reporting Biases in: Cochrane Handbook for Sytematic Reviews of Interventions; Cochrane Book Series; Cochrane: London, UK, 2008. [Google Scholar] [CrossRef]
- Fu, R.; Gartlehner, G.; Grant, M.; Shamliyan, T.; Sedrakyan, A.; Wilt, T.J.; Griffith, L.; Oremus, M.; Raina, P.; Ismaila, A.; et al. Conducting quantitative synthesis when comparing medical interventions: AHRQ and the Effective Health Care Program. J. Clin. Epidemiol. 2011, 64, 1187–1197. [Google Scholar] [CrossRef]
- Sweeten, T.L.; Posey, D.J.; McDougle, C.J. High blood monocyte counts and neopterin levels in children with autistic disorder. Am. J. Psychiatry 2003, 160, 1691–1693. [Google Scholar] [CrossRef]
- Enstrom, A.M.; Lit, L.; Onore, C.E.; Gregg, J.P.; Hansen, R.L.; Pessah, I.N.; Hertz-Picciotto, I.; Van de Water, J.A.; Sharp, F.R.; Ashwood, P. Altered geneexpression and function of peripheral blood natural killer cells in children with autism. Brain Behav. Immun. 2009, 23, 124–133. [Google Scholar] [CrossRef] [Green Version]
- Onore, C.; Enstrom, A.; Krakowiak, P.; Hertz-Picciotto, I.; Hansen, R.; Van De Water, J.; Ashwood, P. Decreased cellular IL-23 but not IL-17 production in children with autism spectrum disorders. J. Neuroimmunol. 2009, 216, 126–129. [Google Scholar] [CrossRef] [PubMed] [Green Version]
- Saresella, M.; Marventano, I.; Guerini, F.R.; Mancuso, R.; Ceresa, L.; Zanzottera, M.; Rusconi, B.; Maggioni, E.; Tinelli, C.; Clerici, M. Anautistic endophenotype results in complex immune dysfunction in healthy siblings of autistic children. Biol. Psychiatry 2009, 66, 978–984. [Google Scholar] [CrossRef] [PubMed]
- Mostafa, G.A.; Al Shehab, A.; Fouad, N.R. Frequency of CD4+CD25high regulatory T cells inthe peripheral blood of Egyptian children with autism. J. Child Neurol. 2010, 25, 328–335. [Google Scholar] [CrossRef] [PubMed]
- Ashwood, P.; Corbett, B.A.; Kantor, A.; Schulman, H.; Van de Water, J.; Amaral, D.G. In search of cellular immunophenotypes in the blood of children with autism. PLoS ONE 2011, 6, e19299. [Google Scholar] [CrossRef] [Green Version]
- Heuer, L.S.; Rose, M.; Ashwood, P.; Van de Water, J. Decreased levels of total immunoglobulin in children with autism are not a result of B cell dysfunction. J. Neuroimmunol. 2012, 251, 94–102. [Google Scholar] [CrossRef] [Green Version]
- Wasilewska, J.; Kaczmarski, M.; Stasiak-Barmuta, A.; Tobolczyk, J.; Kowalewska, E. Low serum IgA and increased expression of CD23 on B lymphocytes in peripheral blood in children with regressive autism aged 3-6 years old. Arch. Med. Sci. 2012, 8, 324–331. [Google Scholar] [CrossRef]
- Bodur, S.; Ceylan, M.F.; Iseri, E.; Sener, S.; Yucel, A.A. Serum neopterin levels in patients with autism. Int. J. Dev. Disabil. 2013, 60, 109–115. [Google Scholar] [CrossRef]
- Tonhajzerova, I.; Ondrejka, I.; Mestanik, M.; Mikolka, P.; Hrtanek, I.; Mestanikova, A.; Bujnakova, I.; Mokra, D. Inflammatory Activity in Autism Spectrum Disorder. Adv. Exp. Med. Biol. 2015, 861, 93–98. [Google Scholar]
- Zhao, H.; Yin, S.; Fan, J. High plasma neopterin levels in Chinese children with autism spectrum disorders. Int. J. Dev. Neurosci. 2015, 41, 92–97. [Google Scholar] [CrossRef]
- Ahmad, S.F.; Zoheir, K.; Ansari, M.A.; Nadeem, A.; Bakheet, S.A.; Al-Ayadhi, L.Y.; Alzahrani, M.Z.; Al-Shabanah, O.A.; Al-Harbi, M.M.; Attia, S.M. Dysregulation of Th1, Th2, Th17, and T regulatory cell-related transcription factor signaling in children with autism. Mol. Neurobiol. 2016, 54, 4390–4400. [Google Scholar] [CrossRef]
- López-Cacho, J.M.; Gallardo, S.; Posada, M.; Aguerri, M.; Calzada, D.; Mayayo, T.; Lahoz, C.; Cárdaba, B. Characterization of immune cell phenotypes in adults with autism spectrum disorders. J. Investig. Med. 2016, 64, 1179–1185. [Google Scholar] [CrossRef] [PubMed]
- Siniscalco, D.; Mijatovic, T.; Bosmans, E.; Cirillo, A.; Kruzliak, P.; Lombardi, V.C.; De Meirleir, K.; Antonucci, N. Decreased Numbers of CD57+CD3- Cells Identify Potential Innate Immune Differences in Patients with Autism Spectrum Disorder. In Vivo 2016, 30, 83–89. [Google Scholar] [PubMed]
- Ashaat, E.A.; Taman, K.H.; Kholoussi, N.; El Ruby, M.O.; Zaki, M.E.; El Wakeel, M.A.; Ashaat, N.A.; Ibrahim, S.I. Altered Adaptive Cellular Immune Function in a Group of Egyptian Children with Autism. J. Clin. Diagn. Res. 2017, 11, SC14–SC17. [Google Scholar] [CrossRef]
- Pardo, C.A.; Farmer, C.A.; Thurm, A.; Shebl, F.M.; Ilieva, J.; Kalra, S.; Swedo, S. Serum and cerebrospinal fluid immune mediators in children with autistic disorder: A longitudinal study. Mol. Autism 2017, 8, 1. [Google Scholar] [CrossRef] [PubMed] [Green Version]
- Kutlu, A.; Cevher Binici, N. Does increased neutrophil-lymphocyte ratio predict autism spectrum disorder? Anadolu Psikiyatr. Derg. 2018, 19, 607–614. [Google Scholar] [CrossRef]
- Hesapcioglu, S.T.; Kasak, M.; Kurt, A.N.C.; Ceylan, M.F. High monocyte level and low lymphocyte to monocyte ratio in autism spectrum disorders. Int. J. Dev. Disabil. 2019, 65, 73–81. [Google Scholar] [CrossRef]
- Moaaz, M.; Youssry, S.; Elfatatry, A.; El Rahman, M.A. Th17/Treg cells imbalance and their related cytokines (IL-17, IL-10 and TGF-β) in children with autism spectrum disorder. J. Neuroimmunol. 2019, 337, 577071. [Google Scholar] [CrossRef]
- Abd-Allah, N.A.; Ibrahim, O.M.; Elmalt, H.A.; Shehata, M.A.; Hamed, R.A.; Elsaadouni, N.M.; Hawary, B. Thioredoxin level and inflammatory markers in children with autism spectrum disorders. Middle East Curr. Psychiatry 2020, 27, 11. [Google Scholar] [CrossRef]
- Alpay, M.; Yektaş; Karacor, K. The systemic cell apoptotic-based neutrophil–lymphocyte ratio: Experience in children diagnosed with ADHD and Autism Spectrum Disorder. Konuralp Med. J. 2021, 13, 74–81. [Google Scholar] [CrossRef]
- Rose, D.R.; Yang, H.; Careaga, M.; Angkustsiri, K.; Van de Water, J.; Ashwood, P. T cell populations in children with autism spectrum disorder and co-morbid gastrointestinal symptoms. Brain Behav. Immun.-Health 2020, 2, 100042. [Google Scholar] [CrossRef]
- Ceylan, M.F.; Tural Hesapcioglu, S.; Yavas, C.P.; Senat, A.; Erel, O. Serum Ischemia-Modified Albumin Levels, Myeloperoxidase Activity and Peripheral Blood Mononuclear cells in Autism Spectrum Disorder (ASD). J. Autism. Dev. Disord. 2021, 51, 2511–2517. [Google Scholar] [CrossRef] [PubMed]
- De Giacomo, A.; Gargano, C.D.; Simone, M.; Petruzzelli, M.G.; Pedaci, C.; Giambersio, D.; Margari, L.; Ruggieri, M. B and T immunoregulation: A New Insight of B Regulatory Lymphocytes in Autism Spectrum Disorder. Front. Neurosci. 2021, 15, 732611. [Google Scholar] [CrossRef] [PubMed]
- Topal, Z.; Tufan, A.E.; Karadag, M.; Gokcen, C.; Akkaya, C.; Sarp, A.S.; Bahsi, I.; Kilinc, M. Evaluation of peripheral inflammatory markers, serum B12, folate, ferritin levels and clinical correlations in children with autism spectrum disorder (ASD) and attention deficit hyperactivity disorder (ADHD). Nord. J. Psychiatry 2021, 76, 150–157. [Google Scholar] [CrossRef]
- Kounis, N.G.; Soufras, G.D.; Tsigkas, G.; Hahalis, G. White Blood Cell Counts, Leukocyte Ratios, and Eosinophils as Inflammatory Markers in Patients with Coronary Artery Disease. Clin. Appl. Thromb. 2014, 21, 139–143. [Google Scholar] [CrossRef]
- Berdowska, A.; Zwirska-Korczala, K. Neopterin measurement in clinical diagnosis. J. Clin. Pharm. Ther. 2001, 26, 319–329. [Google Scholar] [CrossRef] [PubMed]
- Bhat, P.; Leggatt, G.; Waterhouse, N.; Frazer, I.H. Interferon-γ derived from cytotoxic lymphocytes directly enhances their motility and cytotoxicity. Cell Death Dis. 2017, 8, e2836. [Google Scholar] [CrossRef] [PubMed] [Green Version]
- DiStasio, M.M.; Nagakura, I.; Nadler, M.J.; Anderson, M.P. T lymphocytes and cytotoxic astrocyte blebs correlate across autism brains. Ann. Neurol. 2019, 86, 885–898. [Google Scholar] [CrossRef] [PubMed]
- Drexhage, R.C.; Knijff, E.M.; Padmos, R.C.; Van Der Heul-Nieuwenhuijzen, L.; Beumer, W.; A Versnel, M.; A Drexhage, H. The mononuclear phagocyte system and its cytokine inflammatory networks in schizophrenia and bipolar disorder. Expert Rev. Neurother. 2010, 10, 59–76. [Google Scholar] [CrossRef]
- Vargas, D.L.; Nascimbene, C.; Krishnan, C.; Zimmerman, A.W.; Pardo, C.A. Neuroglial activation and neuroinflammation in the brain of patients with autism. Ann. Neurol. 2004, 57, 67–81. [Google Scholar] [CrossRef]
- Morgan, J.T.; Chana, G.; Pardo, C.A.; Achim, C.; Semendeferi, K.; Buckwalter, J.; Courchesne, E.; Everall, I.P. Microglial Activation and Increased Microglial Density Observed in the Dorsolateral Prefrontal Cortex in Autism. Biol. Psychiatry 2010, 68, 368–376. [Google Scholar] [CrossRef]
- Shi, F.-D.; Ljunggren, H.-G.; La Cava, A.; Van Kaer, L. Organ-specific features of natural killer cells. Nat. Rev. Immunol. 2011, 11, 658–671. [Google Scholar] [CrossRef] [PubMed]
- Warren, R.P.; Foster, A.; Margaretten, N.C. Reduced Natural Killer Cell Activity in Autism. J. Am. Acad. Child Adolesc. Psychiatry 1987, 26, 333–335. [Google Scholar] [CrossRef] [PubMed]
- Vojdani, A.; Mumper, E.; Granpeesheh, D.; Mielke, L.; Traver, D.; Bock, K.; Hirani, K.; Neubrander, J.; Woeller, K.N.; O’Hara, N.; et al. Low natural killer cell cytotoxic activity in autism: The role of glutathione, IL-2 and IL-15. J. Neuroimmunol. 2008, 205, 148–154. [Google Scholar] [CrossRef] [PubMed]
- Scifo, R.; Cioni, M.; Nicolosi, A.; Batticane, N.; Tirolo, C.; Testa, N.; Quattropani, M.C.; Morale, M.C.; Gallo, F.; Marchetti, B. Opioid-immune interactions in autism: Behavioural and immunological assessment during a double-blind treatment with naltrexone. Annali dell–Istituto Superiore di Sanita 1996, 32, 351–359. [Google Scholar] [PubMed]
- Castillo, L.; Carcillo, J. Secondary hemophagocytic lymphohistiocytosis and severe sepsis/systemic inflammatory response syndrome/multiorgan dysfunction syndrome/macrophage activaton syndrome share common intermediate phenotypes on a spectrum of inflammation. Pediatr. Crit. Care Med. 2009, 10, 387–392. [Google Scholar] [CrossRef]
- Huet, L.; Delgado, I.; Dexpert, S.; Sauvant, J.; Aouizerate, B.; Beau, C.; Forestier, D.; Ledaguenel, P.; Magne, E.; Capuron, L. Relationship between body mass index and neuropsychiatric symptoms: Evidence and inflammatory correlates. Brain Behav. Immun. 2021, 94, 104–110. [Google Scholar] [CrossRef]
- Beurel, E.; Toups, M.; Nemeroff, C.B. The Bidirectional Relationship of Depression and Inflammation: Double Trouble. Neuron 2020, 107, 234–256. [Google Scholar] [CrossRef]

| Name of First Autor (Date of Publication) | Country | Diagnostic Criteria (Diagnose) | (S)S Interview (Name) | N (ASD, TD) | Mean Age (SD) | % of Males | Medication |
|---|---|---|---|---|---|---|---|
| Sweeten et al. (2003) [22] | USA | DSM-IV (autistic disorder) | ADI-R | ASD (n = 31) TD (n = 28) | 6.0 (2.80) 6.5 (2.50) | 87% 86% | No No |
| Enstrom et al. (2009) [23] | USA | DSM-IV (autistic disorder) | ADI-R ADOS | ASD (n = 17) TD (n = 16) | 3.9 (0.7) 3.3 (0.62) | 82% 81% | NG NG |
| Onore et al. (2009) [24] | USA | DSM-IV (autistic disorder) | ADI-R ADOS | ASD (n = 34) TD (n = 26) | 3.83 (0.27) 3.71 (0.37) | 85% 81% | NG NG |
| Saresella et al. (2009) [25] | Italy | DSM-IV (autistic disorder) | NG | ASD (n = 29) TD (n = 20) | 13 (3.00) 11 (3.00) | 70% 55% | No No |
| Mostafa et al. (2010) [26] | Egypt | DSM-IV (autistic disorder) | NG | ASD (n = 30) TD (n = 30) | 8.27 (2.66) 8.03 (2.50) | 73% 73% | NG NG |
| Ashwood et al. (2011) [27] | USA | DSM-IV (autistic disorder) | ADI-R ADOS | ASD (n = 70) TD (n = 35) | 3.8 (NG) 3.5 (NG) | 83% 83% | NG NG |
| Heuer et al. (2012) [28] | USA | DSM-IV (autistic disorder) | ADI-R ADOS | ASD (n = 42) TD (n = 31) | 6.83 (NG) 6.00 (NG) | 88% 77% | NG NG |
| Wasilewska et al. (2012) [29] | Poland | DSM-IV/ICD-10 (regressive autism) | NG | ASD (n = 24) TD (n = 24) | 4.25 (1.70) 4.25 (2.20) | 96% 96% | No No |
| Bodur et al. (2014) [30] | Turkey | DSM-IV (autistic disorder) | NG | ASD (n = 23) TD (n = 21) | 5.9 (2.6) 5.8 (2.3) | 96% 81% | NG NG |
| Tonhajzerova et al. (2015) [31] | Slovakia | DSM-5 (ASD, no-regression) | NG | ASD (n = 15) TD (n = 20) | 9.3 (0.7) 9.6 (0.8) | 87% sex-matched | No No |
| Zhao et al. (2015) [32] | China | DSM-IV n = 75 autistic disorder, n = 3 Asperger’s n = 2 PDD-NOS | NG | ASD (n = 80) TD (n = 80) | 3.69 (1.30) 3.69 (1.30) | 80% 80% | No No |
| Ahmad et al. (2016) [33] | KSA | DSM-5 (ASD) | NG | ASD (n = 40) TD (n = 32) | 7.69 (2.26) 7.76 (2.45) | 75% 75% | No No |
| Lopez-Cacho et al. (2016) [34] | Spain | DSM-5 (ASD) | NG | ASD (n = 59) TD (n = 26) | 24.44 (6.24) 30.69 (6.28) | 73% 27% | NG NG |
| Siniscalco et al. (2016) [35] | Italy | DSM-5 (ASD; No Asperger’s) | ADOS | ASD (n = 104) TD (n = 31) | 6.7 (3.6) 5.2 (3.4) | 75% 61% | No No |
| Ashaat et al. (2017) [36] | Egypt | ICD-10 (autistic disorder) | NG | ASD (n = 60) TD (n = 60) | 8.7 (1.3) 7.9 (1.6) | 93% 77% | NG NG |
| Pardo et al. (2017) [37] | USA | DSM-IV-TR (autistic disorder) | ADI-R, ADOS | ASD (n = 104) TD (n = 54) | 4.41 (1.27) 3.64 (1.11) | 83% 76% | NG |
| Kutlu and Cehver (2018) [38] | Turkey | ICD-10 n = 11 autistic disorder n = 53 PDD-NOS | NG | ASD (n = 64) TD (n = 64) | 3.43 (1.03) age-matched | 81% sex-matched | No No |
| Hesapcioglu et al. (2019) [39] | Turkey | DSM-IV/ICD-10 n = 30 autistic disorder n = 15 PDD-NOS | NG | ASD (n = 45) TD (n = 43) | 13.51 (4.21) 11.90 (3.73) | 80% 77% | No NG |
| Moaaz et al. (2019) [40] | Egypt | DSM-5 (ASD) | NG | ASD (n = 44) TD (n = 45) | 7.2 (2.2) 7.1 (2.1) | 79% sex-matched | NG NG |
| Abd-Allah et al. (2020) [41] | Egypt | DSM-5 (ASD) | NG | ASD (n = 35) TD (n = 35) | 4.7 (2.4) 5.4 (2.4) | 69% 54% | NG NG |
| Alpay et al. (2020) [42] | Turkey | NG (ASD) | NG | ASD (n = 30) TD (n = 30) | children | NG | NG NG |
| Rose et al. (2020) [43] | USA | DSM-IV (ASD) | ADI-R ADOS | ASD (n = 10) TD (n = 15) | children | sex-matched | No No |
| Ceylan et al. (2021) [44] | Turkey | DSM-5 (ASD) | NG | ASD (n = 48) TD (n = 38) | 9.4 (4.1) 9.8 (4.1) | 77% 60% | Yes (n = 27) NG |
| De Giacomo et al. (2021) [45] | Italy | DSM-5 (ASD) | ADOS | ASD (n = 26) TD (n = 16) | 8.3 (3.6) 9.9 (5.7) | 81% 81% | No No |
| Topal et al. (2021) [46] | Turkey | DSM-5 (ASD) | K-SADS-PL (6–18 years) No (<6 years) | ASD (n = 72) TD (n = 70) | 8.3 (3.2) 8.4 (3.8) | 76% 70% | No No |
| Marker | k | N ASD | N TD | Effect Size (ASD vs. TD) | Heterogeneity | ||||
|---|---|---|---|---|---|---|---|---|---|
| Hedge’s g (95% CI) | Z Value | p-Value | Q | p-Value | I2 | ||||
| WBC | 10 | 526 | 436 | 0.286 (0.125–0.448) | 3.477 | 0.001 | 13.644 | 0.136 | 34.04% |
| Neutrophils | 6 | 314 | 270 | 0.287 (0.085–0.488) | 2,784 | 0.005 | 7.272 | 0.201 | 31.25% |
| Monocytes | 11 | 629 | 488 | 0.355 (0.173–0.536) | 3.825 | <0.001 | 21.696 | 0.017 | 53.91% |
| Lymphocytes | 6 | 374 | 329 | −0.055 (−0.229–0.119) | −0.624 | 0.533 | 6.599 | 0.252 | 24.23% |
| B cells | 5 | 215 | 136 | −0.090 (−0.583–0.404) | −0.356 | 0.722 | 19.816 | 0.001 | 79.81% |
| NK cells | 7 | 320 | 168 | 0.364 (0.021–0.706) | 2.083 | 0.037 | 17.998 | 0.006 | 66.66% |
| T cells | 5 | 215 | 136 | 0.024 (−0.367–0.414) | 0.119 | 0.905 | 12.491 | 0.014 | 67.98% |
| Tc cells | 4 | 173 | 105 | 0.726 (0.111–1.342) | 2.313 | 0.021 | 16.692 | 0.001 | 82.03% |
| Th cells | 5 | 233 | 165 | −0.346 (−1.102–0.410) | −0.896 | 0.370 | 49.481 | <0.001 | 91.92% |
| Th/Tc cells ratio | 3 | 103 | 70 | −0.419 (−0.728–−0.110) | −2.661 | 0.008 | 0.923 | 0.630 | 0.00% |
| Tregs | 7 | 233 | 188 | −1.304 (−2.611–0.004) | −1.954 | 0.051 | 183.821 | <0.001 | 96.74% |
| Th17 | 3 | 102 | 93 | 2.058 (−0.250–4.366) | 1.747 | 0.081 | 75.642 | <0.001 | 97.36% |
| NLR | 4 | 181 | 177 | 0.686 (0.033–1.339) | 2.058 | 0.040 | 30.834 | <0.001 | 90.27% |
| Neopterin | 3 | 134 | 129 | 1.159 (0.624–1.693) | 4.246 | <0.001 | 7.095 | 0.029 | 71.809 |
Publisher’s Note: MDPI stays neutral with regard to jurisdictional claims in published maps and institutional affiliations. |
© 2022 by the authors. Licensee MDPI, Basel, Switzerland. This article is an open access article distributed under the terms and conditions of the Creative Commons Attribution (CC BY) license (https://creativecommons.org/licenses/by/4.0/).
Share and Cite
Arteaga-Henríquez, G.; Lugo-Marín, J.; Gisbert, L.; Setién-Ramos, I.; Martínez-Gallo, M.; Pujol-Borrell, R.; Ramos-Quiroga, J.A. Activation of the Monocyte/Macrophage System and Abnormal Blood Levels of Lymphocyte Subpopulations in Individuals with Autism Spectrum Disorder: A Systematic Review and Meta-Analysis. Int. J. Mol. Sci. 2022, 23, 14329. https://doi.org/10.3390/ijms232214329
Arteaga-Henríquez G, Lugo-Marín J, Gisbert L, Setién-Ramos I, Martínez-Gallo M, Pujol-Borrell R, Ramos-Quiroga JA. Activation of the Monocyte/Macrophage System and Abnormal Blood Levels of Lymphocyte Subpopulations in Individuals with Autism Spectrum Disorder: A Systematic Review and Meta-Analysis. International Journal of Molecular Sciences. 2022; 23(22):14329. https://doi.org/10.3390/ijms232214329
Chicago/Turabian StyleArteaga-Henríquez, Gara, Jorge Lugo-Marín, Laura Gisbert, Imanol Setién-Ramos, Mónica Martínez-Gallo, Ricardo Pujol-Borrell, and Josep Antoni Ramos-Quiroga. 2022. "Activation of the Monocyte/Macrophage System and Abnormal Blood Levels of Lymphocyte Subpopulations in Individuals with Autism Spectrum Disorder: A Systematic Review and Meta-Analysis" International Journal of Molecular Sciences 23, no. 22: 14329. https://doi.org/10.3390/ijms232214329