
Quantitative Proteomic Analysis Reveals the Key Molecular Events Driving Phaeocystis globosa Bloom and Dissipation

Abstract
:1. Introduction
2. Results
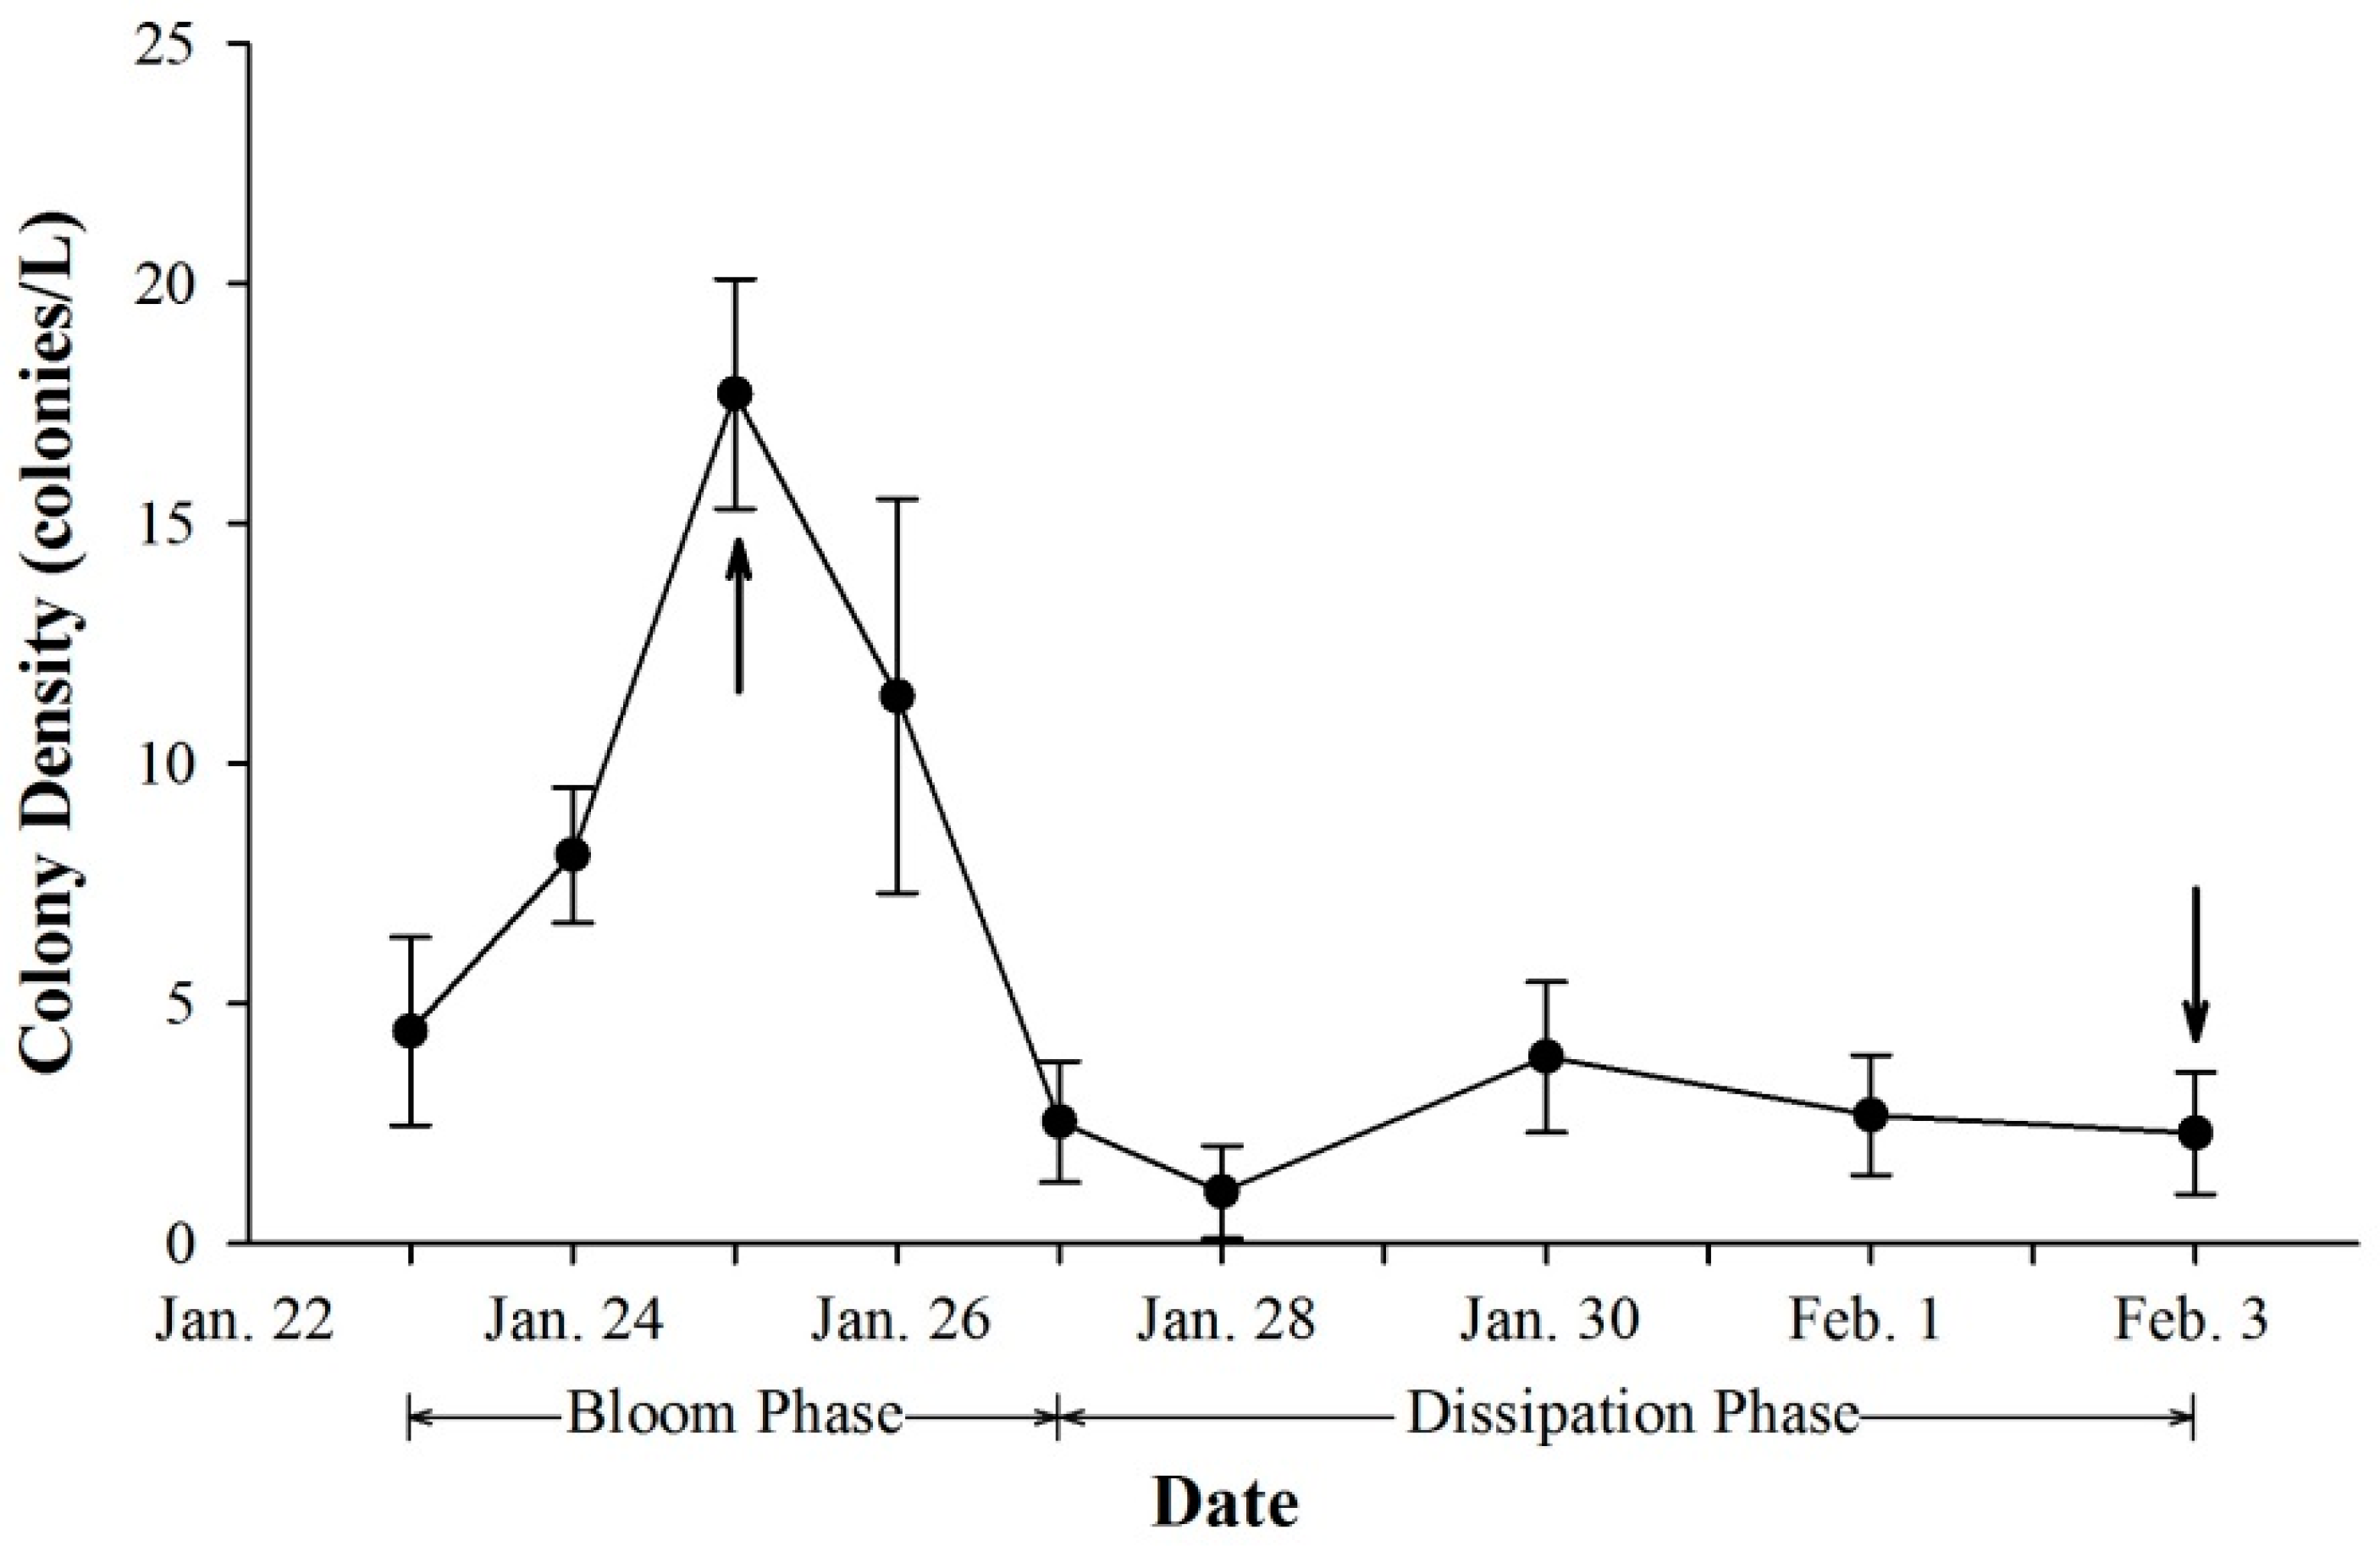
2.1. Colony Density and Vertical Distribution
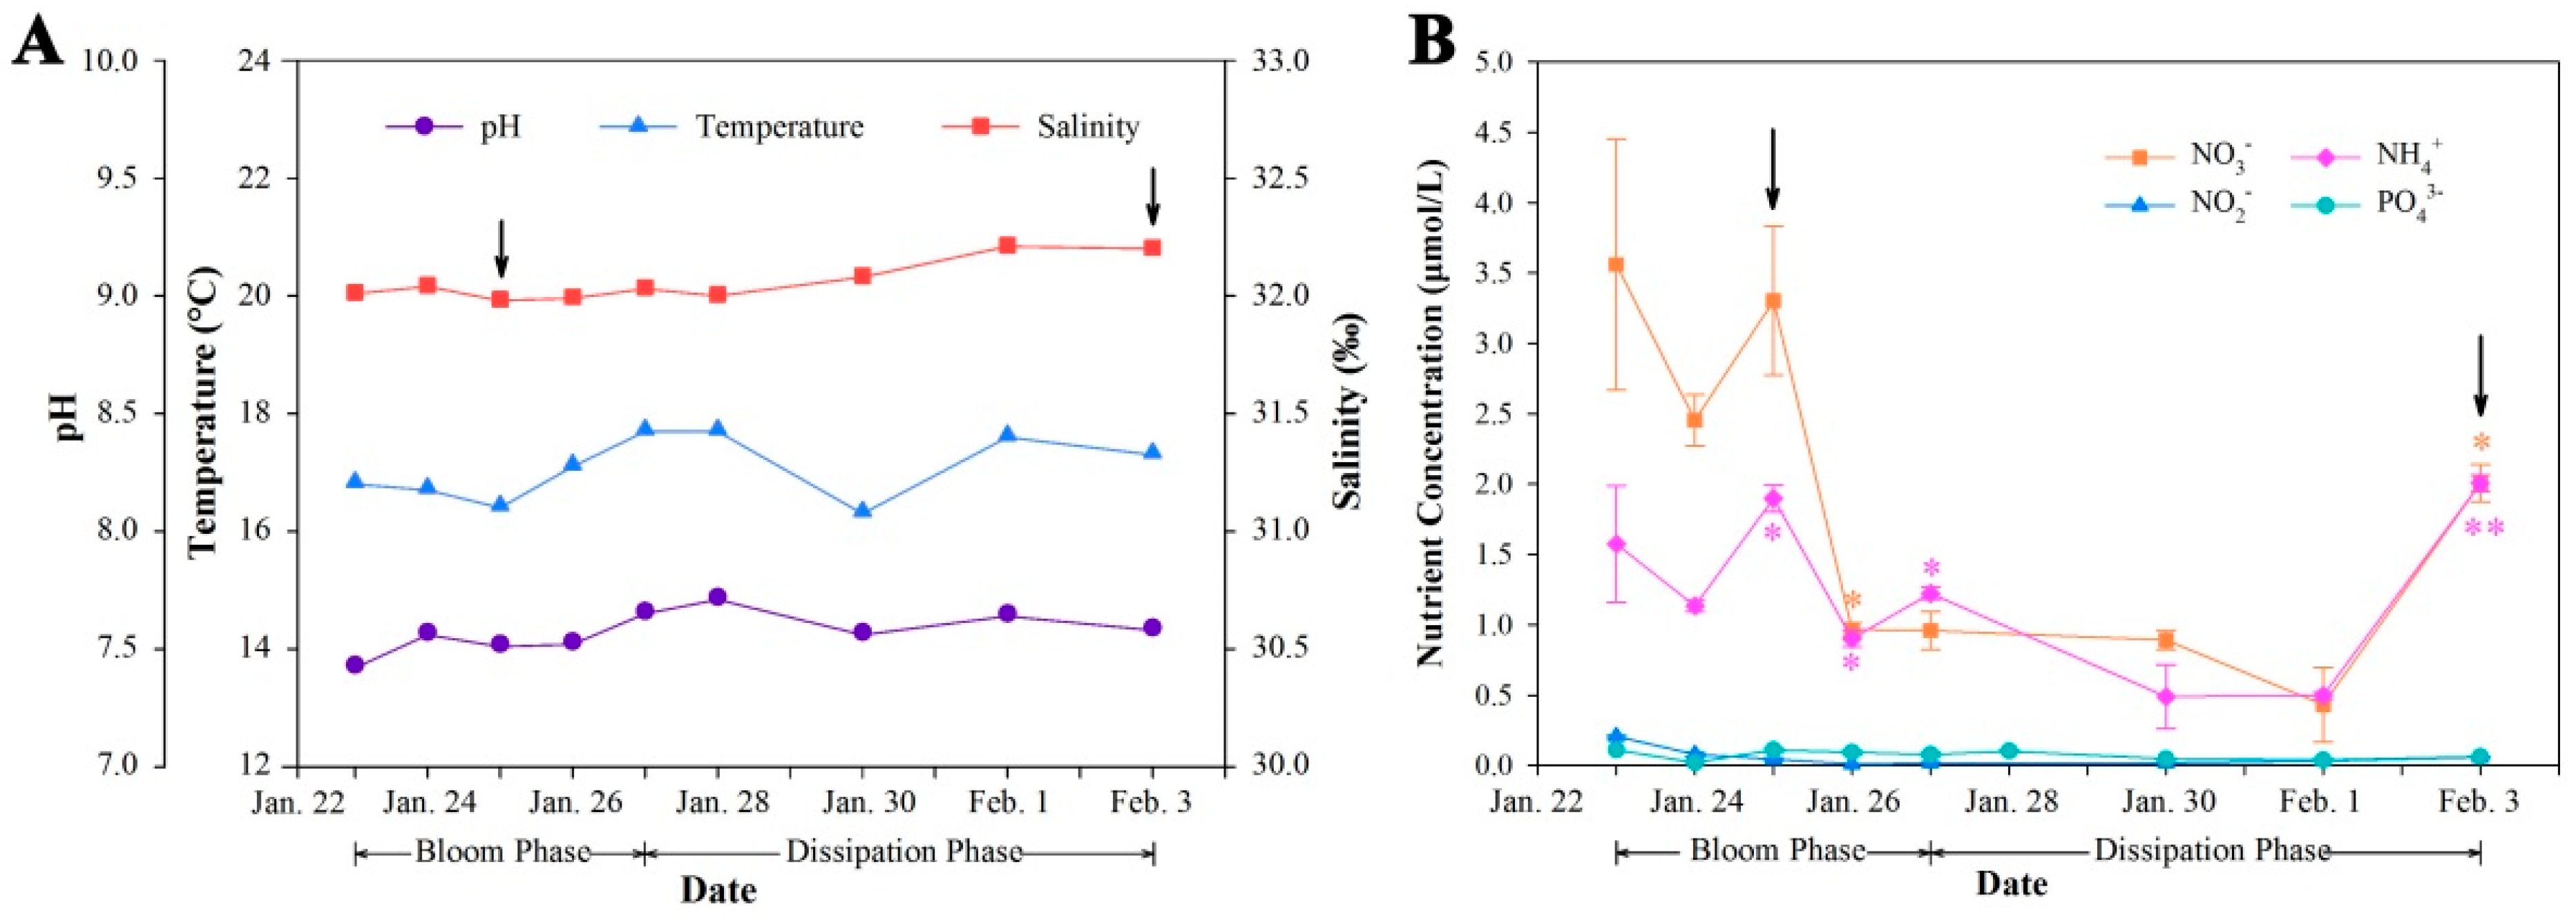
2.2. Dynamics of Physical and Chemical Parameters
2.3. Protein Identification and Differentially Abundant Proteins
3. Discussion
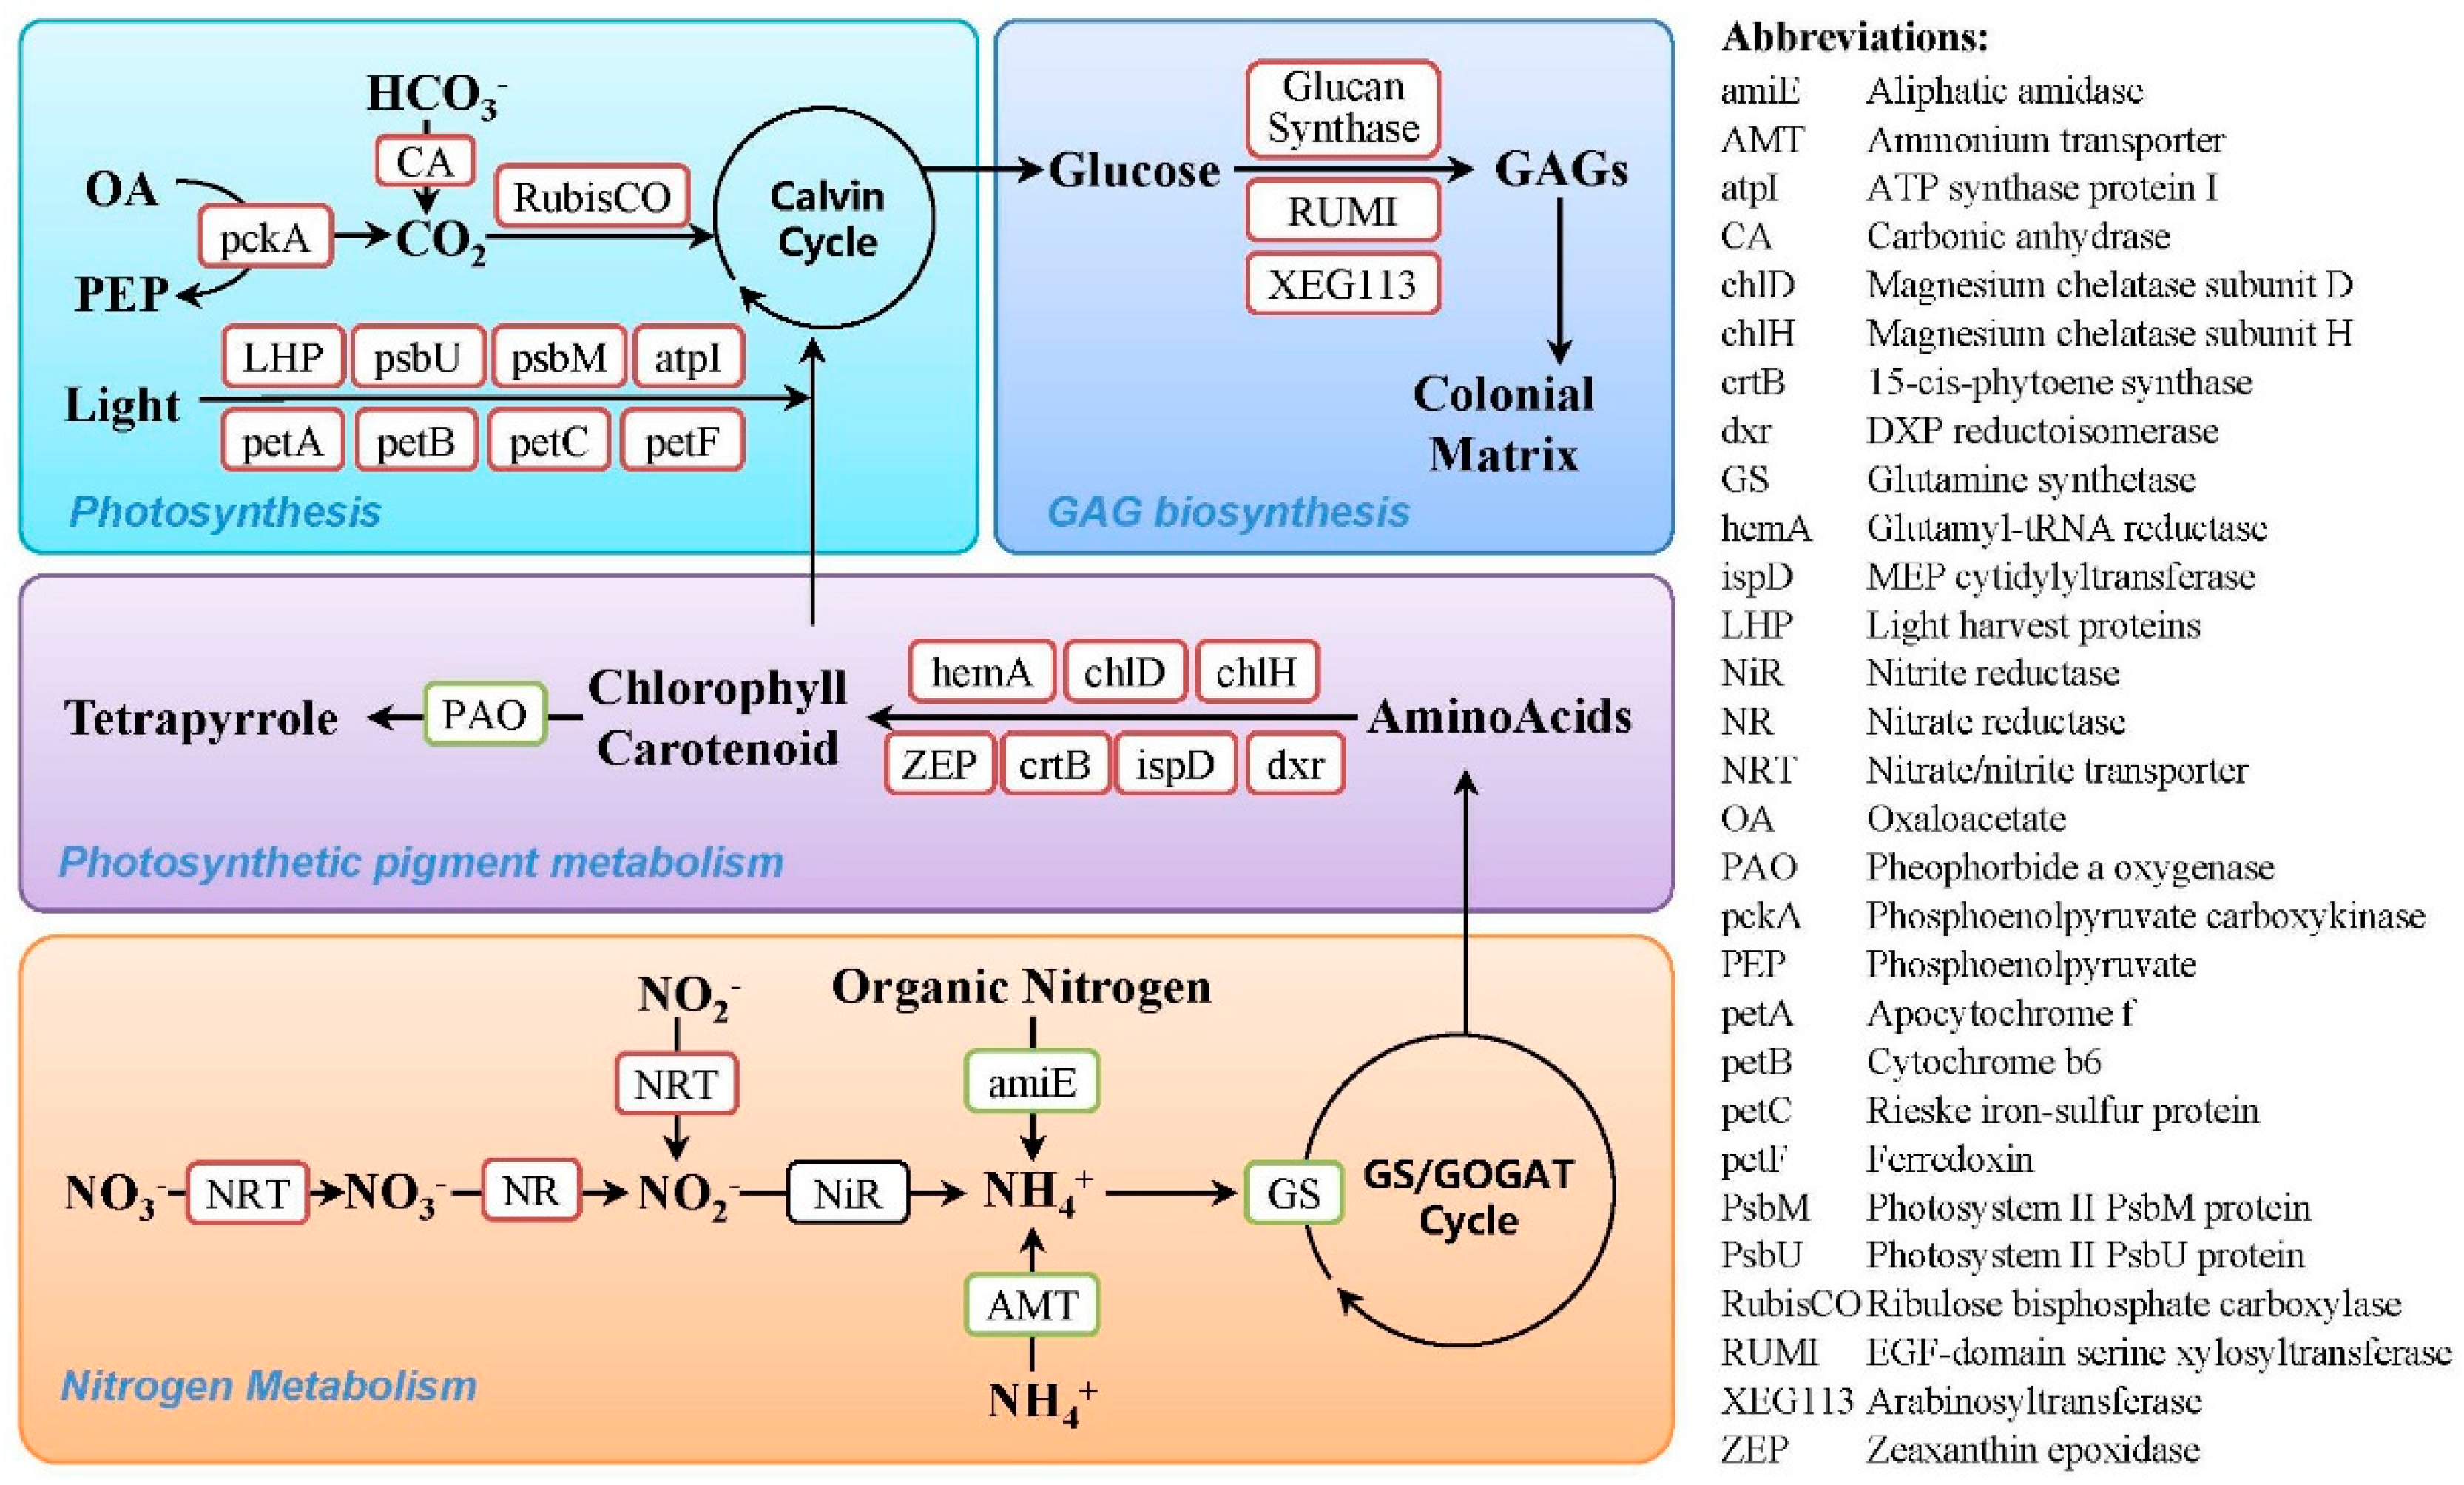
3.1. Photosynthesis
3.2. Photosynthetic Pigment Metabolism
3.3. Nitrogen Metabolism
3.4. Glycosaminoglycan Biosynthesis and Transportation
4. Materials and Methods
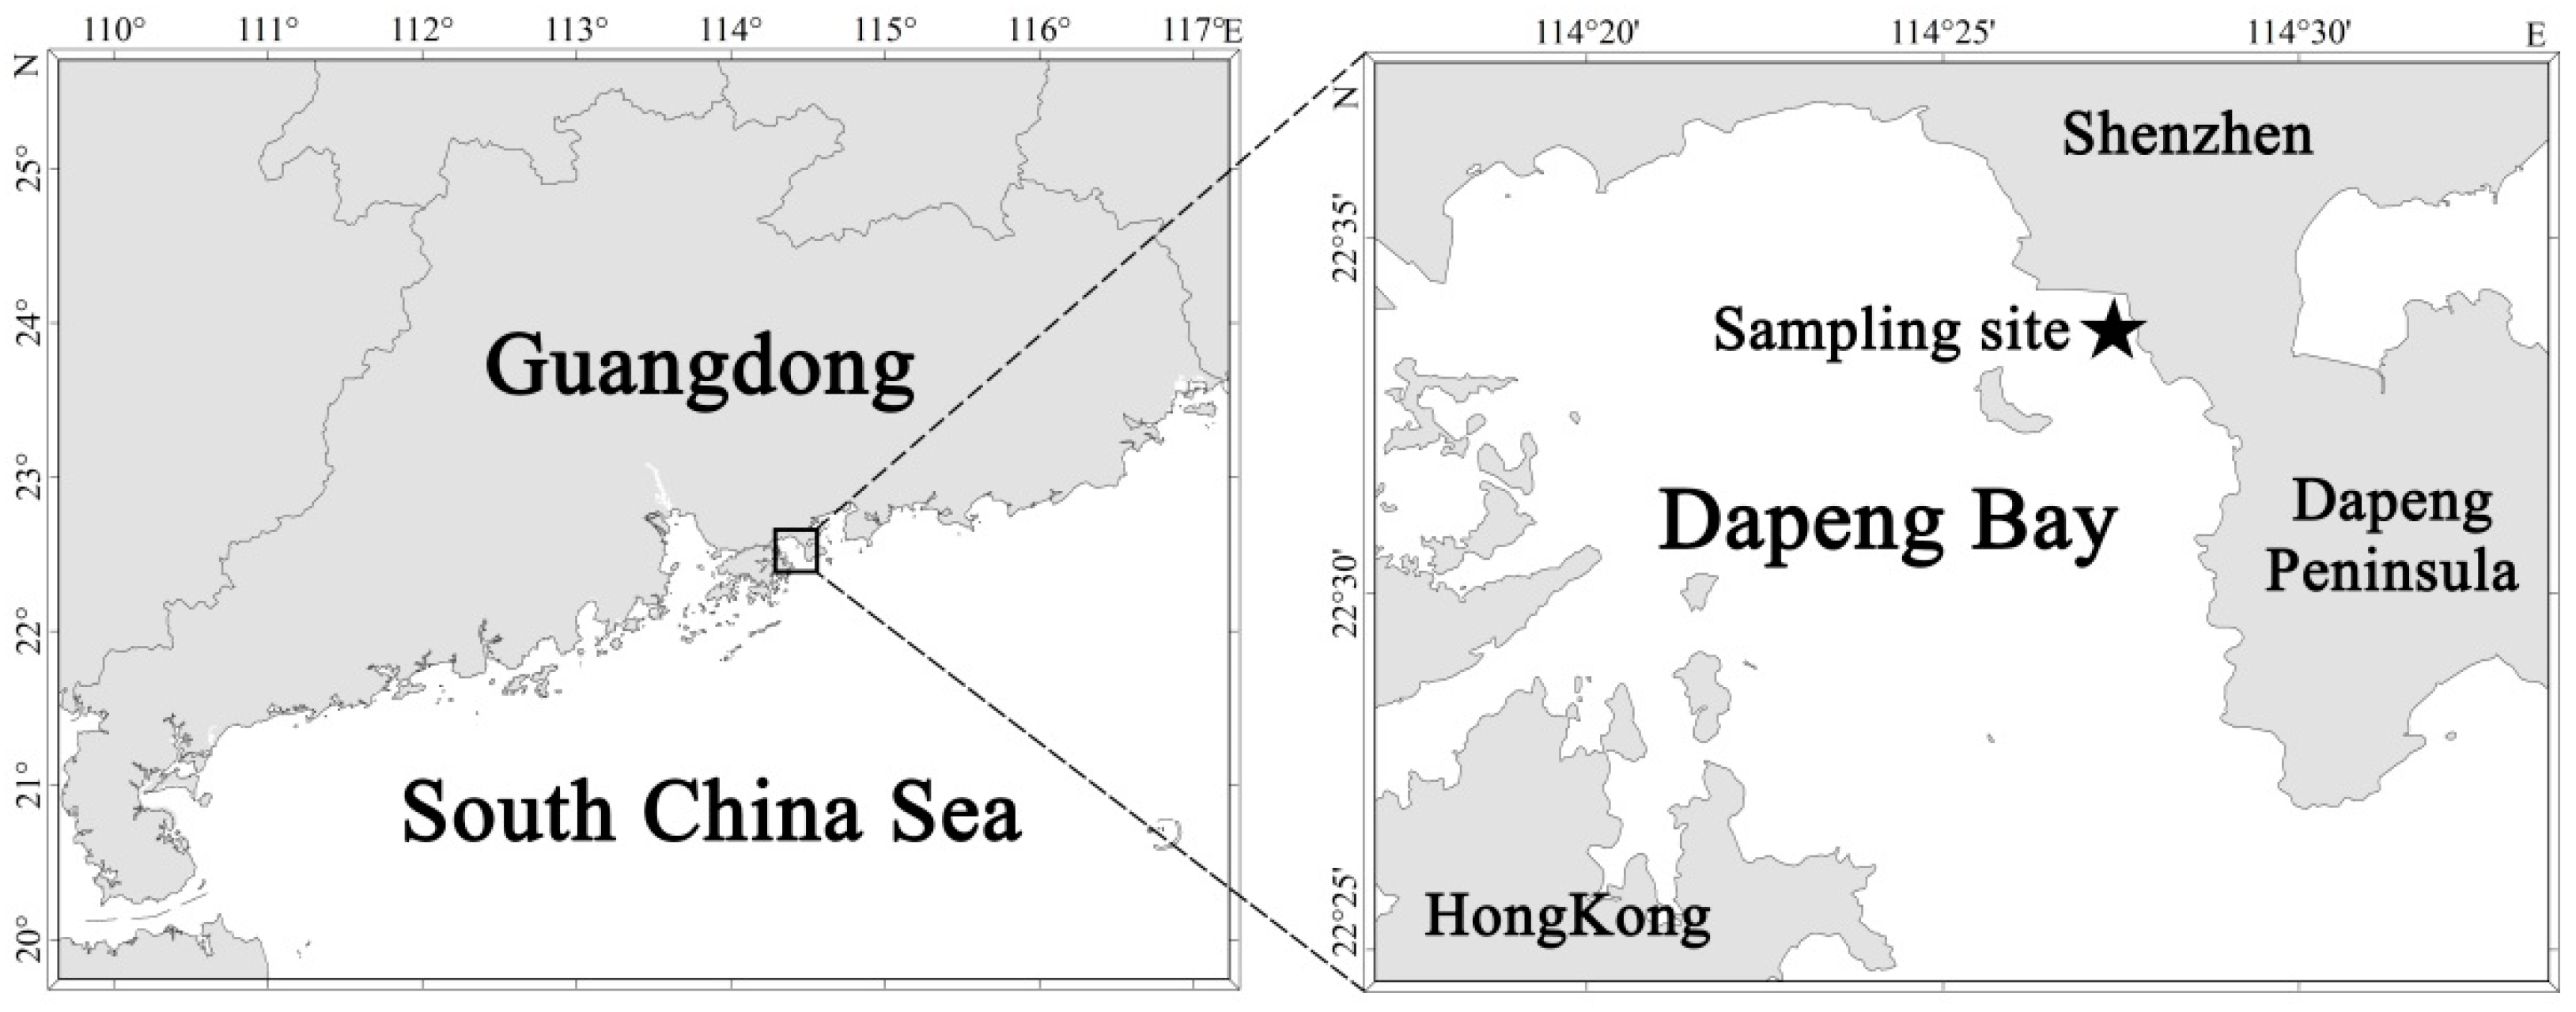
4.1. Investigation and Sampling of Phaeocystis globosa Blooms
4.2. Protein Preparation and Mass Spectrometry
4.3. Bioinformatics Analysis
5. Conclusions
Supplementary Materials
Author Contributions
Funding
Institutional Review Board Statement
Informed Consent Statement
Data Availability Statement
Acknowledgments
Conflicts of Interest
References
- Wang, X.; Song, H.; Wang, Y.; Chen, N. Research on the biology and ecology of the harmful algal bloom species Phaeocystis globosa in China: Progresses in the last 20 years. Harmful Algae 2021, 107, 102057. [Google Scholar] [CrossRef] [PubMed]
- Rousseau, V.; Chrétiennot-Dinet, M.-J.; Jacobsen, A.; Verity, P.; Whipple, S. The life cycle of Phaeocystis: State of knowledge and presumptive role in ecology. Biogeochemistry 2007, 83, 29–47. [Google Scholar] [CrossRef]
- Qi, Y.; Chen, J.; Wang, Z.; Xu, N.; Wang, Y.; Shen, P.; Lu, S.; Hodgkiss, I.J. Some observations on harmful algal bloom (HAB) events along the coast of Guangdong, southern China in 1998. Hydrobiologia 2004, 512, 209–214. [Google Scholar] [CrossRef]
- Smith, W.O.; Codispoti, L.A.; Nelson, D.M.; Manley, T.; Buskey, E.J.; Niebauer, H.J.; Cota, G.F. Importance of Phaeocystis blooms in the high-latitude ocean carbon cycle. Nature 1991, 352, 514–516. [Google Scholar] [CrossRef]
- Anderson, D.M.; Cembella, A.D.; Hallegraeff, G.M. Physiological Ecology of Harmful Algal Blooms; Anderson, D.M., Cembella, A.D., Hallegraeff, G.M., Eds.; Springer: Berlin, Germany, 1998. [Google Scholar]
- Charlson, R.J.; Lovelock, J.E.; Andreae, M.O.; Warren, S.G. Oceanic phytoplankton, atmospheric sulphur, cloud albedo and climate. Nature 1987, 326, 655–661. [Google Scholar] [CrossRef]
- Wang, K.; Chen, B.; Gao, Y.; Lin, H. Harmful algal blooms caused by Phaeocystis globosa from 1997 to 2018 in Chinese coastal waters. Mar. Pollut. Bull. 2021, 173, 112949. [Google Scholar] [CrossRef] [PubMed]
- Lancelot, C.; Rousseau, V.; Schoemann, V.; Becquevort, S. On the Ecological Role of the Different Life Forms of Phaeocystis; European Commission Publication: Luxembourg, 2002; pp. 71–75. [Google Scholar]
- Hamm, C.E.; Simson, D.A.; Merkel, R.; Smetacek, V. Colonies of Phaeocystis globosa are protected by a thin but tough skin. Mar. Ecol. Prog. Ser. 1999, 187, 101–111. [Google Scholar] [CrossRef] [Green Version]
- Hamm, C.E. Architecture, ecology and biogeochemistry of Phaeocystis colonies. J. Sea Res. 2000, 43, 307–315. [Google Scholar] [CrossRef] [Green Version]
- Jacobsen, A.; Bratbak, G.; Heldal, M. Isolation and characterization of a virus infecting Phaeocystis pouchetii (Prymnesiophyceae). J. Phycol. 1996, 32, 923–927. [Google Scholar] [CrossRef]
- Veldhuis, M.J.W.; Colijn, F.; Admiraal, W. Phosphate Utilization in Phaeocystis pouchetii (Haptophyceae). Mar. Ecol. 1991, 12, 53–62. [Google Scholar] [CrossRef]
- Schoemann, V.; Wollast, R.; Chou, L.; Lancelot, C. Effects of photosynthesis on the accumulation of Mn and Fe by Phaeocystis colonies. Limnol. Oceanogr. 2001, 46, 1065–1076. [Google Scholar] [CrossRef]
- Schoemann, V.; Becquevort, S.; Stefels, J.; Rousseau, V.; Lancelot, C. Phaeocystis blooms in the global ocean and their controlling mechanisms: A review. J. Sea Res. 2005, 53, 43–66. [Google Scholar] [CrossRef]
- Blauw, A.N.; Los, F.J.; Huisman, J.; Peperzak, L. Nuisance foam events and Phaeocystis globosa blooms in Dutch coastal waters analyzed with fuzzy logic. J. Mar. Syst. 2010, 83, 115–126. [Google Scholar] [CrossRef]
- Zhang, S.F.; Zhang, K.; Cheng, H.M.; Lin, L.; Wang, D.Z. Comparative transcriptomics reveals colony formation mechanism of a harmful algal bloom species Phaeocystis globosa. Sci. Total Environ. 2020, 719, 137454. [Google Scholar] [CrossRef] [PubMed]
- Wang, X.; Tang, K.W. Buoyancy regulation in Phaeocystis globosa Scherffel colonies. Open Mar. Biol. J. 2010, 4, 115–121. [Google Scholar] [CrossRef] [Green Version]
- Fragoso, G.M.; Poulton, A.J.; Yashayaev, I.M.; Head, E.J.H.; Stinchcombe, M.C.; Purdie, D.A. Biogeographical patterns and environmental controls of phytoplankton communities from contrasting hydrographical zones of the Labrador Sea. Prog. Oceanogr. 2016, 141, 212–226. [Google Scholar] [CrossRef] [Green Version]
- Riegman, R.; Noordeloos, A.A.M.; Cadée, G.C. Phaeocystis blooms and eutrophication of the continental coastal zones of the North Sea. Mar. Biol. 1992, 112, 479–484. [Google Scholar] [CrossRef]
- Smith, W.O.; Carlson, C.A.; Ducklow, H.W.; Hansell, D.A. Growth dynamics of Phaeocystis antarctica-dominated plankton assemblages from the Ross Sea. Mar. Ecol. Prog. Ser. 1998, 168, 229–244. [Google Scholar] [CrossRef] [Green Version]
- Bradley, P.; Sanderson, M.; Nejstgaard, J.; Sazhin, A.; Frischer, M.; Killberg-Thoreson, L.; Verity, P.; Campbell, L.; Bronk, D. Nitrogen uptake by phytoplankton and bacteria during an induced Phaeocystis pouchetii bloom, measured using size fractionation and flow cytometric sorting. Aquat. Microb. Ecol. 2010, 61, 89–104. [Google Scholar] [CrossRef] [Green Version]
- Wang, X.; Wang, Y.; Smith, W.O. The role of nitrogen on the growth and colony development of Phaeocystis globosa (Prymnesiophyceae). Eur. J. Phycol. 2011, 46, 305–314. [Google Scholar] [CrossRef]
- Cariou, V.; Casotti, R.; Birrien, J.-L.; Vaulot, D. The initiation of Phaeocystis colonies. J. Plankton Res. 1994, 16, 457–470. [Google Scholar] [CrossRef]
- Ma, J.; Chen, T.; Wu, S.; Yang, C.; Bai, M.; Shu, K.; Li, K.; Zhang, G.; Jin, Z.; He, F.; et al. iProX: An integrated proteome resource. Nucleic Acids Res. 2018, 47, D1211–D1217. [Google Scholar] [CrossRef] [PubMed] [Green Version]
- Chin, W.-C.; Orellana, M.V.; Quesada, I.; Verdugo, P. Secretion in unicellular marine phytoplankton: Demonstration of regulated exocytosis in Phaeocystis globosa. Plant Cell Physiol. 2004, 45, 535–542. [Google Scholar] [CrossRef] [PubMed] [Green Version]
- Reinfelder, J.R. Carbon concentrating mechanisms in eukaryotic marine phytoplankton. Annu. Rev. Mar. Sci. 2011, 3, 291–315. [Google Scholar] [CrossRef] [PubMed] [Green Version]
- Roberts, K.; Granum, E.; Leegood, R.C.; Raven, J.A. C3 and C4 pathways of photosynthetic carbon assimilation in marine diatoms are under genetic, not environmental, control. Plant Physiol. 2007, 145, 230–235. [Google Scholar] [CrossRef] [Green Version]
- Rost, B.; Riebesell, U.; Burkhardt, S.; Sültemeyer, D. Carbon acquisition of bloom-forming marine phytoplankton. Limnol. Oceanogr. 2003, 48, 55–67. [Google Scholar] [CrossRef] [Green Version]
- Elzenga, J.T.M.; Prins, H.B.; Stefels, J. The role of extracellular carbonic anhydrase activity in inorganic carbon utilization of Phaeocystis globosa (Prymnesiophyceae): A comparison with other marine algae using the isotopic disequilibrium technique. Limnol. Oceanogr. 2000, 45, 372–380. [Google Scholar] [CrossRef]
- Tortell, P.D.; DiTullio, G.R.; Sigman, D.M.; Morel, F.M. CO2 effects on taxonomic composition and nutrient utilization in an Equatorial Pacific phytoplankton assemblage. Mar. Ecol. Prog. Ser. 2002, 236, 37–43. [Google Scholar] [CrossRef]
- Alderkamp, A.-C.; Nejstgaard, J.C.; Verity, P.G.; Zirbel, M.J.; Sazhin, A.F.; van Rijssel, M. Dynamics in carbohydrate composition of Phaeocystis pouchetii colonies during spring blooms in mesocosms. J. Sea Res. 2006, 55, 169–181. [Google Scholar] [CrossRef]
- Ploug, H.; Stolte, W.; Jørgensen, B.B. Diffusive boundary layers of the colony-forming plankton alga Phaeocystis sp.—Implications for nutrient uptake and cellular growth. Limnol. Oceanogr. 1999, 44, 1959–1967. [Google Scholar] [CrossRef]
- Wassmann, P.; Vernet, M.; Mitchell, B.G.; Rey, F. Mass sedimentation of Phaeocystis pouchetii in the Barents Sea. Mar. Ecol. Prog. Ser. 1990, 66, 183–195. [Google Scholar] [CrossRef] [Green Version]
- Kuczynska, P.; Jemiola-Rzeminska, M.; Strzalka, K. Photosynthetic pigments in diatoms. Mar. Drugs 2015, 13, 5847–5881. [Google Scholar] [CrossRef] [PubMed]
- Eckhardt, U.; Grimm, B.; Hörtensteiner, S. Recent advances in chlorophyll biosynthesis and breakdown in higher plants. Plant Mol. Biol. 2004, 56, 1–14. [Google Scholar] [CrossRef] [PubMed]
- Porra, R.J. Recent progress in porphyrin and chlorophyll biosynthesis. Photochem. Photobiol. 1997, 65, 492–516. [Google Scholar] [CrossRef]
- Bertrand, M. Carotenoid biosynthesis in diatoms. Photosynth. Res. 2010, 106, 89–102. [Google Scholar] [CrossRef] [PubMed]
- Pružinská, A.; Tanner, G.; Anders, I.; Roca, M.; Hörtensteiner, S. Chlorophyll breakdown: Pheophorbide a oxygenase is a Rieske-type iron–sulfur protein, encoded by the accelerated cell death 1 gene. Proc. Natl. Acad. Sci. USA 2003, 100, 15259–15264. [Google Scholar] [CrossRef] [Green Version]
- Serra, J.L.; Llama, M.J.; Cadenas, E. Nitrate utilization by the diatom Skeletonema costatum: II. regulation of nitrate uptake. Plant Physiol. 1978, 62, 991–994. [Google Scholar] [CrossRef] [Green Version]
- Smith, S.R.; Dupont, C.L.; McCarthy, J.K.; Broddrick, J.T.; Obornik, M.; Horak, A.; Fussy, Z.; Cihlar, J.; Kleessen, S.; Zheng, H.; et al. Evolution and regulation of nitrogen flux through compartmentalized metabolic networks in a marine diatom. Nat. Commun. 2019, 10, 4552. [Google Scholar] [CrossRef] [Green Version]
- Arrigo, K.R.; Robinson, D.H.; Worthen, D.L.; Dunbar, R.B.; DiTullio, G.R.; VanWoert, M.; Lizotte, M.P. Phytoplankton community structure and the drawdown of nutrients and CO2 in the Southern Ocean. Science 1999, 283, 365–367. [Google Scholar] [CrossRef] [Green Version]
- Howden, A.J.M.; Preston, G.M. Nitrilase enzymes and their role in plant-microbe interactions. Microb. Biotechnol. 2009, 2, 441–451. [Google Scholar] [CrossRef]
- Chen, X.H.; Li, Y.Y.; Zhang, H.; Liu, J.L.; Xie, Z.X.; Lin, L.; Wang, D.Z. Quantitative proteomics reveals common and specific responses of a marine diatom Thalassiosira pseudonana to different macronutrient deficiencies. Front. Microbiol. 2018, 9, 2761. [Google Scholar] [CrossRef] [PubMed]
- Palenik, B.; Henson, S.E. The use of amides and other organic nitrogen sources by the phytoplankton Emiliania Huxleyi. Limnol. Oceanogr. 1997, 42, 1544–1551. [Google Scholar] [CrossRef] [Green Version]
- Longworth, J.; Wu, D.; Huete-Ortega, M.; Wright, P.C.; Vaidyanathan, S. Proteome response of Phaeodactylum tricornutum, during lipid accumulation induced by nitrogen depletion. Algal Res. 2016, 18, 213–224. [Google Scholar] [CrossRef] [Green Version]
- Van Rijssel, M.; Hamm, C.E.; Gieskes, W.W.C. Phaeocystis globosa (Prymnesiophyceae) colonies: Hollow structures built with small amounts of polysaccharides. Eur. J. Phycol. 1997, 32, 185–192. [Google Scholar]
- Lancelot, C.; Wassmann, P.; Barth, H. Ecology of Phaeocystis-dominated ecosystems. J. Mar. Syst. 1994, 5, 1–4. [Google Scholar] [CrossRef]
- DeAngelis, P.L. Glycosaminoglycan polysaccharide biosynthesis and production: Today and tomorrow. Appl. Microbiol. Biotechnol. 2012, 94, 295–305. [Google Scholar] [CrossRef]
- Alderkamp, A.-C.; Buma, A.G.J.; van Rijssel, M. The carbohydrates of Phaeocystis and their degradation in the microbial food web. Biogeochemistry 2007, 83, 99–118. [Google Scholar] [CrossRef] [Green Version]
- Grasshoff, K.; Kremling, K.; Ehrhardt, M. Methods of Seawater Analysis; Grasshoff, K., Kremling, K., Ehrhardt, M., Eds.; John Wiley & Sons: Hoboken, NJ, USA, 1999. [Google Scholar]
- Liu, Y.; Li, L.; Zhai, X.; Zhou, J.; Ye, P.; Huang, S. Analysis of the bloom caused by colonial Phaeocystis globosa in Mirs Bay. J. Trop. Oceanogr. 2022, 41, 164–171. (In Chinese) [Google Scholar]
- Zhang, S.F.; Zhang, Y.; Lin, L.; Wang, D.Z. iTRAQ-based quantitative proteomic analysis of a toxigenic dinoflagellate Alexandrium catenella and its non-toxigenic mutant exposed to a cell cycle inhibitor colchicine. Front. Microbiol. 2018, 9, 650. [Google Scholar] [CrossRef] [Green Version]
- Wiśniewski, J.R.; Zougman, A.; Nagaraj, N.; Mann, M. Universal sample preparation method for proteome analysis. Nat. Methods 2009, 6, 359–362. [Google Scholar] [CrossRef]


Publisher’s Note: MDPI stays neutral with regard to jurisdictional claims in published maps and institutional affiliations. |
© 2022 by the authors. Licensee MDPI, Basel, Switzerland. This article is an open access article distributed under the terms and conditions of the Creative Commons Attribution (CC BY) license (https://creativecommons.org/licenses/by/4.0/).
Share and Cite
Zhang, S.-F.; Han, B.-B.; Shi, R.-J.; Wu, F.-X.; Rao, Y.-Y.; Dai, M.; Huang, H.-H. Quantitative Proteomic Analysis Reveals the Key Molecular Events Driving Phaeocystis globosa Bloom and Dissipation. Int. J. Mol. Sci. 2022, 23, 12668. https://doi.org/10.3390/ijms232012668
Zhang S-F, Han B-B, Shi R-J, Wu F-X, Rao Y-Y, Dai M, Huang H-H. Quantitative Proteomic Analysis Reveals the Key Molecular Events Driving Phaeocystis globosa Bloom and Dissipation. International Journal of Molecular Sciences. 2022; 23(20):12668. https://doi.org/10.3390/ijms232012668
Chicago/Turabian StyleZhang, Shu-Fei, Bei-Bei Han, Rong-Jun Shi, Feng-Xia Wu, Yi-Yong Rao, Ming Dai, and Hong-Hui Huang. 2022. "Quantitative Proteomic Analysis Reveals the Key Molecular Events Driving Phaeocystis globosa Bloom and Dissipation" International Journal of Molecular Sciences 23, no. 20: 12668. https://doi.org/10.3390/ijms232012668