
Correlation between In Vitro Neutralization Assay and Serological Tests for Protective Antibodies Detection

 , , ,
, , ,
Abstract
:1. Introduction
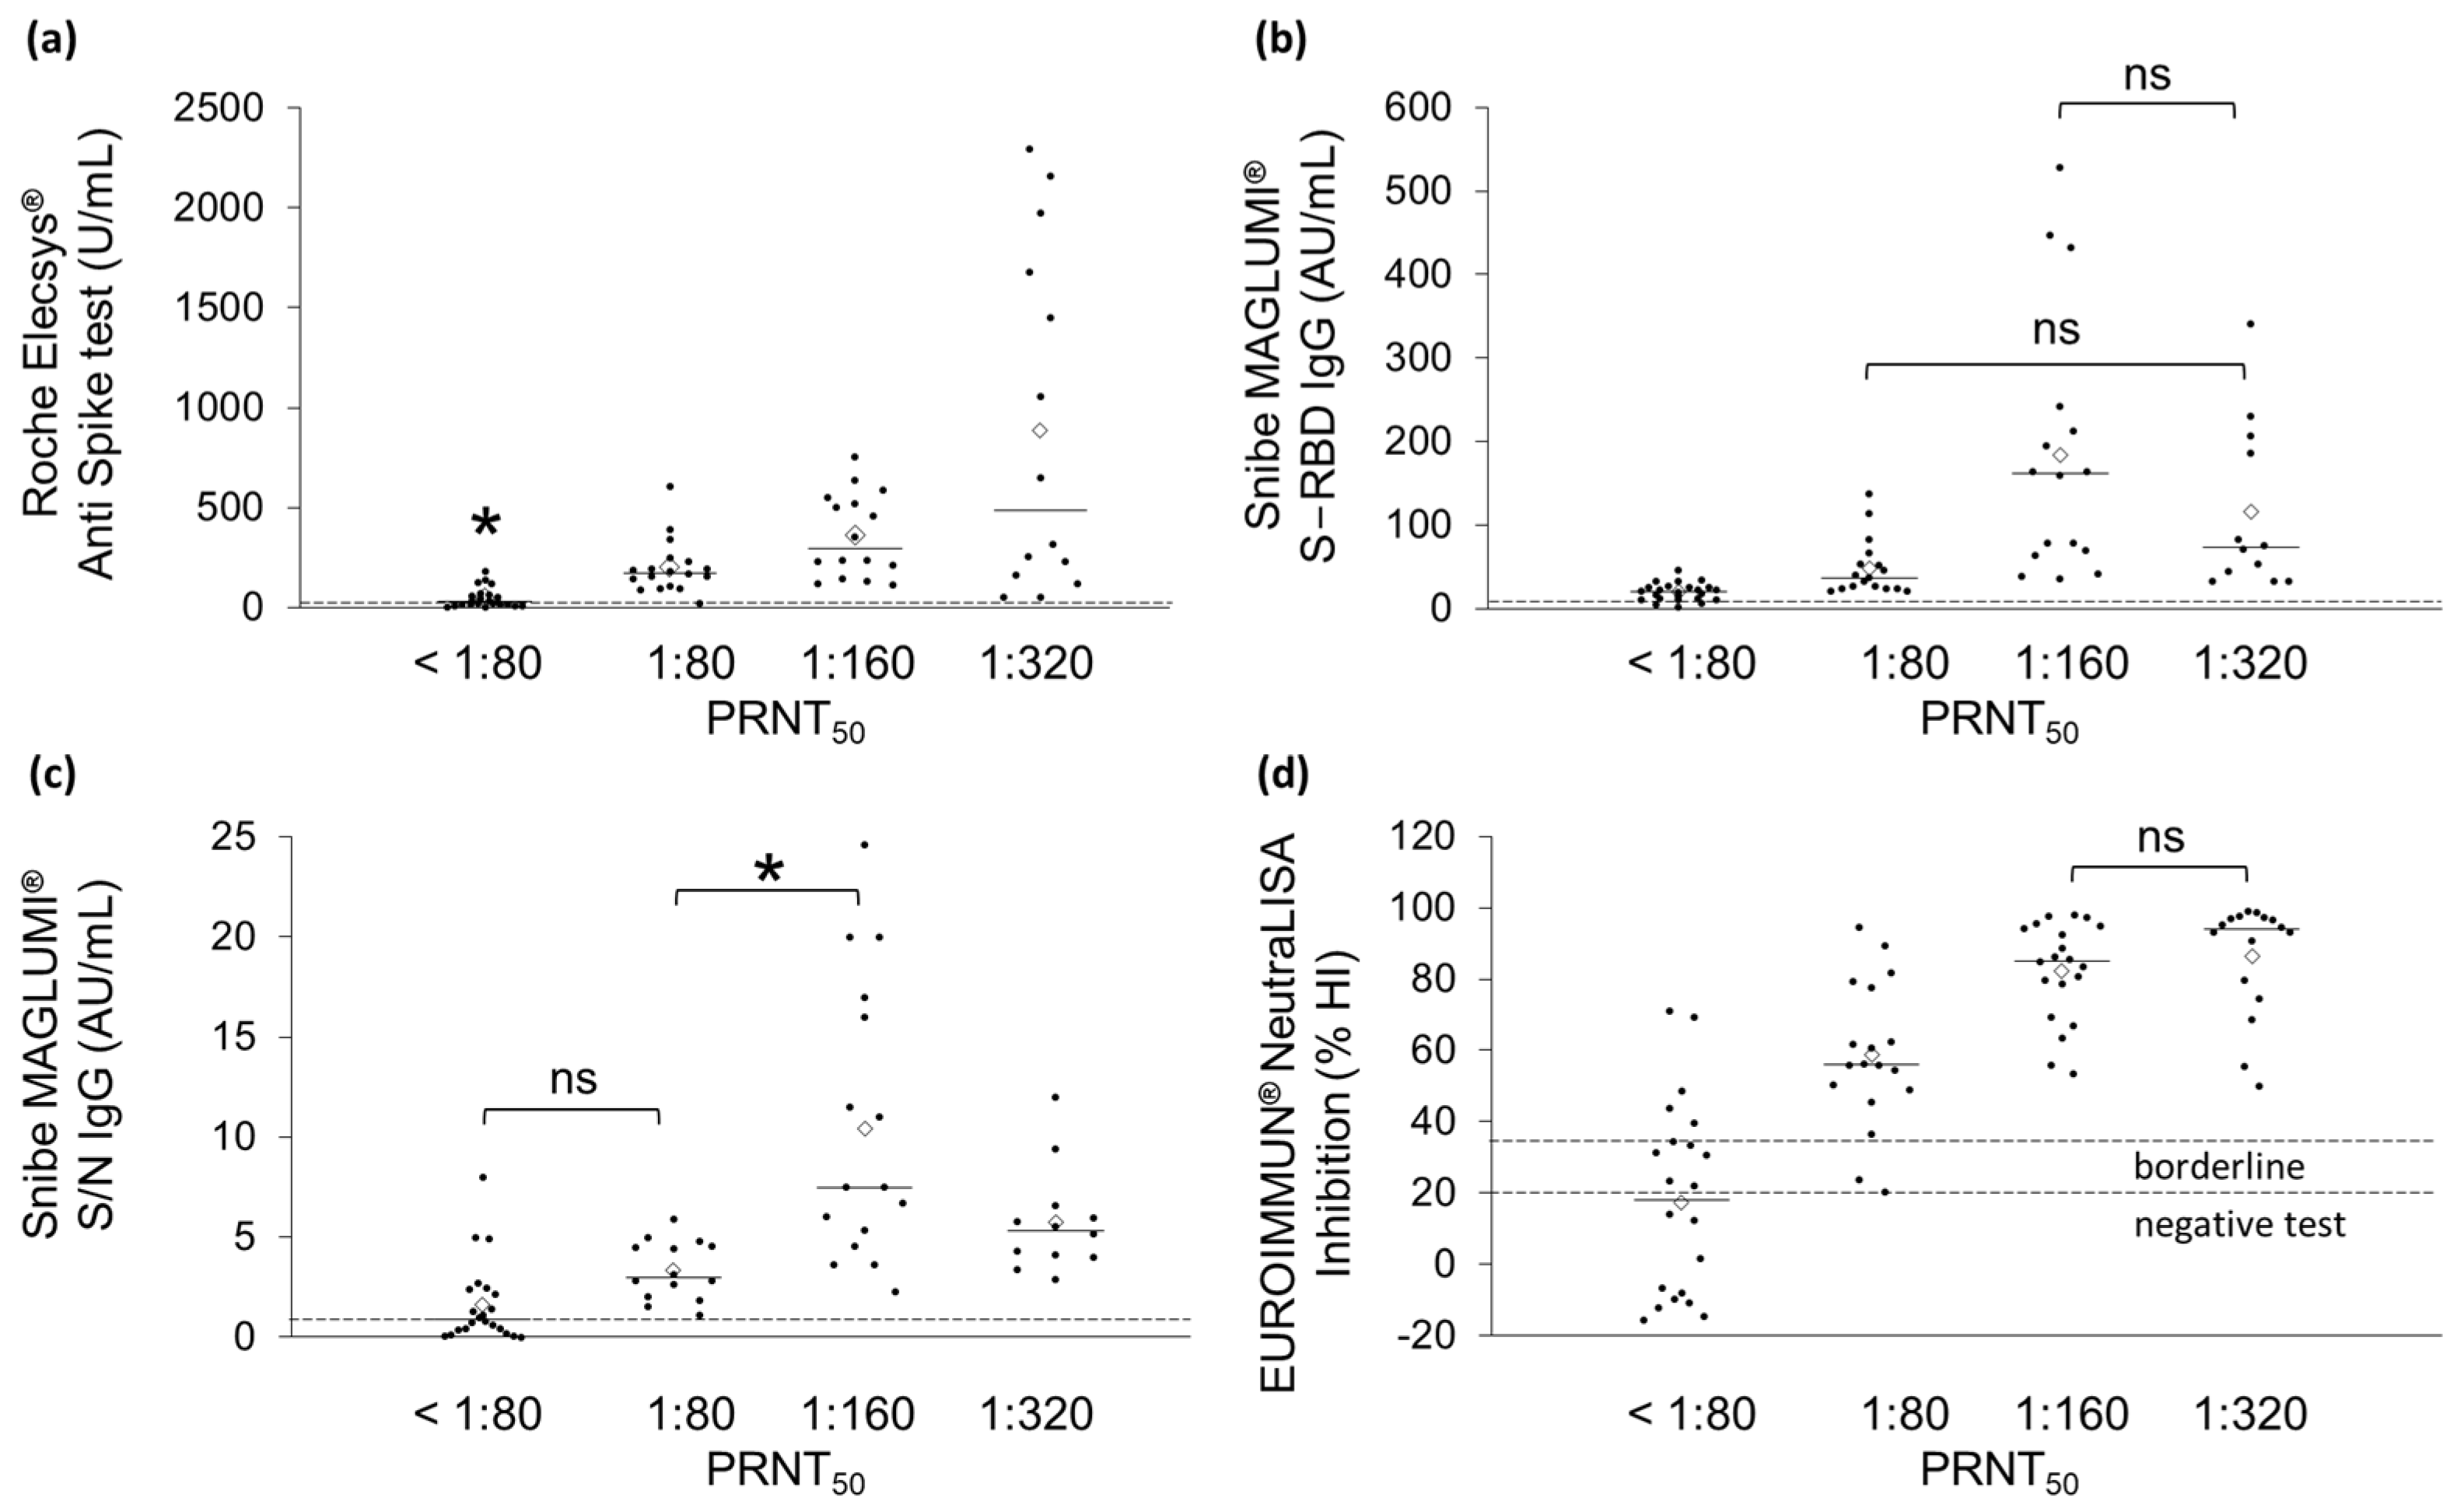
2. Results
3. Discussion
4. Materials and Methods
4.1. Samples Collection
4.2. Serological Tests
4.2.1. Roche Elecsys® Anti Spike Test
4.2.2. Snibe MAGLUMI® SARS-CoV-2 S-RBD IgG Test
4.2.3. Snibe MAGLUMI® 2019-nCoV IgG Test
4.2.4. EUROIMMUN® NeutraLISA Test
4.3. Plaque-Reduction Neutralization Test (PRNT50)
4.4. Statistical Analyses
Supplementary Materials
Author Contributions
Funding
Institutional Review Board Statement
Informed Consent Statement
Data Availability Statement
Conflicts of Interest
References
- Stadlbauer, D.; Amanat, F.; Chromikova, V.; Jiang, K.; Strohmeier, S.; Arunkumar, G.A.; Tan, J.; Bhavsar, D.; Capuano, C.; Kirkpatrick, E.; et al. SARS-CoV-2 seroconversion in humans: A detailed protocol for a serological assay, antigen production, and test setup. Curr. Protoc. Microbiol. 2020, 57, e100. [Google Scholar] [CrossRef] [PubMed] [Green Version]
- Kubina, R.; Dziedzic, A. Molecular and serological tests for COVID-19. A comparative review of SARS-CoV-2 coronavirus laboratory and point-of-care diagnostics. Diagnostics 2020, 10, 434. [Google Scholar] [CrossRef] [PubMed]
- Kumar, G.; Sterrett, S.; Hall, L.; Tabengwa, E.; Honjo, K.; Larimer, M.; Davis, R.S.; Goepfert, P.A.; Larimer, B.M. Comprehensive mapping of SARS-CoV-2 peptide epitopes for development of a highly sensitive serological test for total and neutralizing antibodies. Protein Eng. Des. Sel. 2022, 35, gzab033. [Google Scholar] [CrossRef] [PubMed]
- Ernst, E.; Wolfe, P.; Stahura, C.; Edwards, K.A. Technical considerations to development of serological tests for SARS-CoV-2. Talanta 2021, 224, 121883. [Google Scholar] [CrossRef] [PubMed]
- Bond, K.; Nicholson, S.; Lim, S.M.; Karapanagiotidis, T.; Williams, E.; Johnson, D.; Hoang, T.; Sia, C.; Purcell, D.; Mordant, F.; et al. Evaluation of serological tests for SARS-CoV-2: Implications for serology testing in a low-prevalence setting. J. Infect. Dis. 2020, 222, 1280–1288. [Google Scholar] [CrossRef]
- Wu, X.; Fu, B.; Chen, L.; Feng, Y. Serological tests facilitate identification of asymptomatic SARS-CoV-2 infection in Wuhan, China. J. Med. Virol. 2020. [Google Scholar] [CrossRef] [Green Version]
- European Centre for Disease Prevention and Control. Considerations for the Use of Antibody Tests for SARSCoV-2–First Update; ECDC: Stockholm, Sweden, 2022.
- Milne, G.; Hames, T.; Scotton, C.; Gent, N.; Johnsen, A.; Anderson, R.M.; Ward, T. Does infection with or vaccination against SARS-CoV-2 lead to lasting immunity? Lancet Respir. Med. 2021, 9, 1450–1466. [Google Scholar] [CrossRef]
- Jordan, S.C. Innate and adaptive immune responses to SARS-CoV-2 in humans: Relevance to acquired immunity and vaccine responses. Clin. Exp. Immunol. 2021, 204, 310–320. [Google Scholar] [CrossRef]
- Galipeau, Y.; Greig, M.; Liu, G.; Driedger, M.; Langlois, M.A. Humoral responses and serological assays in SARS-CoV-2 infections. Front. Immunol. 2020, 11, 610688. [Google Scholar] [CrossRef]
- Cromer, D.; Steain, M.; Reynaldi, A.; Schlub, T.E.; Wheatley, A.K.; Juno, J.A.; Kent, S.J.; A Triccas, J.; Khoury, D.S.; Davenport, M.P. Neutralising antibody titres as predictors of protection against SARS-CoV-2 variants and the impact of boosting: A meta-analysis. Lancet Microbe 2022, 3, e52–e61. [Google Scholar] [CrossRef]
- Laterza, R.; Schirinzi, A.; Bruno, R.; Genco, R.; Contino, R.; Ostuni, A.; Di Serio, F. SARS-CoV-2 antibodies: Comparison of three high-throughput immunoassays versus the neutralization test. Eur. J. Clin. Investig. 2021, 51, e13573. [Google Scholar] [CrossRef] [PubMed]
- Bewley, K.R.; Coombes, N.S.; Gagnon, L.; McInroy, L.; Baker, N.; Shaik, I.; St-Jean, J.R.; St-Amant, N.; Buttigieg, K.R.; Humphries, H.E.; et al. Quantification of SARS-CoV-2 neutralizing antibody by wild-type plaque reduction neutralization, microneutralization and pseudotyped virus neutralization assays. Nat. Protoc. 2021, 16, 3114–3140. [Google Scholar] [CrossRef] [PubMed]
- Xie, X.; Nielsen, M.C.; Muruato, A.E.; Fontes-Garfias, C.R.; Ren, P. Evaluation of a SARS-CoV-2 lateral flow assay using the plaque reduction neutralization test. Diagn. Microbiol. Infect. Dis. 2021, 99, 115248. [Google Scholar] [CrossRef]
- Liu, J.; Liu, Y.; Xia, H.; Zou, J.; Weaver, S.C.; Swanson, K.A.; Cai, H.; Cutler, M.; Cooper, D.; Muik, A.; et al. BNT162b2-elicited neutralization of B. 1.617 and other SARS-CoV-2 variants. Nature 2021, 596, 273–275. [Google Scholar] [CrossRef] [PubMed]
- Tan, C.W.; Chia, W.N.; Qin, X.; Liu, P.; Chen, M.I.C.; Tiu, C.; Hu, Z.; Chih-Wei Chen, V.; Young, B.E.; Sia, W.R.; et al. A SARS-CoV-2 surrogate virus neutralization test based on antibody-mediated blockage of ACE2–spike protein–protein interaction. Nat. Biotechnol. 2020, 38, 1073–1078. [Google Scholar] [CrossRef]
- Lynch, K.L.; Zhou, S.; Kaul, R.; Walker, R.; Wu, A.H. Evaluation of neutralizing antibodies against SARS-CoV-2 variants after infection and vaccination using a multiplexed surrogate virus neutralization test. Clin. Chem. 2022, 68, 702–712. [Google Scholar] [CrossRef] [PubMed]
- Suhandynata, R.T.; Hoffman, M.A.; Huang, D.; Tran, J.T.; Kelner, M.J.; Reed, S.L.; McLawhon, R.W.; Voss, J.E.; Nemazee, D.; Fitzgerald, R.L. Commercial serology assays predict neutralization activity against SARS-CoV-2. Clin. Chem. 2021, 67, 404–414. [Google Scholar] [CrossRef]
- Ong, D.S.; Keuren, F.; van der Vliet, M.; Boxma–de Klerk, B.M.; Koeleman, J.G. SARS-CoV-2 antibody response dynamics and heterogeneous diagnostic performance of four serological tests and a neutralization test in symptomatic healthcare workers with non-severe COVID-19. J. Clin. Virol. 2021, 141, 104904. [Google Scholar] [CrossRef]
- Rowntree, L.C.; Chua, B.Y.; Nicholson, S.; Koutsakos, M.; Hensen, L.; Douros, C.; Selva, K.; Mordant, F.L.; Wong, C.Y.; Habel, J.R.; et al. Robust correlations across six SARS-CoV-2 serology assays detecting distinct antibody features. Clin. Transl. Immunol. 2021, 10, e1258. [Google Scholar] [CrossRef]
- McHugh, M.L. Interrater reliability: The kappa statistic. Biochem. Med. 2012, 22, 276–282. [Google Scholar] [CrossRef]
- Mabey, D.; Peeling, R.W.; Ustianowski, A.; Perkins, M.D. Diagnostics for the developing world. Nat. Rev. Microbiol. 2004, 2, 231–240. [Google Scholar] [CrossRef] [PubMed]
- Yi, C.; Sun, X.; Ye, J.; Ding, L.; Liu, M.; Yang, Z.; Lu, X.; Zhang, Y.; Ma, L.; Gu, W.; et al. Key residues of the receptor binding motif in the spike protein of SARS-CoV-2 that interact with ACE2 and neutralizing antibodies. Cell Mol. Immunol. 2020, 17, 621–630. [Google Scholar] [CrossRef] [PubMed]
- Tragni, V.; Preziusi, F.; Laera, L.; Onofrio, A.; Mercurio, I.; Todisco, S.; Volpicella, M.; De Grassi, A.; Pierri, C.L. Modeling SARS-CoV-2 spike/ACE2 protein–protein interactions for predicting the binding affinity of new spike variants for ACE2, and novel ACE2 structurally related human protein targets, for COVID-19 handling in the 3PM context. EPMA J. 2022, 13, 149–175. [Google Scholar] [CrossRef]
- Fujimoto, A.; Lyu, Y.; Kinjo, M.; Kitamura, A. Interaction between Spike Protein of SARS-CoV-2 and Human Virus Receptor ACE2 Using Two-Color Fluorescence Cross-Correlation Spectroscopy. Appl. Sci. 2021, 11, 10697. [Google Scholar] [CrossRef]
- Rusanen, J.; Kareinen, L.; Levanov, L.; Mero, S.; Pakkanen, S.H.; Kantele, A.; Amanat, F.; Krammer, F.; Hedman, K.; Vapalahti, O.; et al. A 10-Minute “Mix and Read” Antibody Assay for SARS-CoV-2. Viruses 2021, 13, 143. [Google Scholar] [CrossRef]
- Harvala, H.; Robb, M.L.; Watkins, N.; Ijaz, S.; Dicks, S.; Patel, M.; Supasa, P.; Wanwisa, D.; Liu, C.; Mongkolsapaya, J.; et al. Convalescent plasma therapy for the treatment of patients with COVID-19: Assessment of methods available for antibody detection and their correlation with neutralising antibody levels. Transfus. Med. 2021, 31, 167–175. [Google Scholar] [CrossRef] [PubMed]
- Girl, P.; Zwirglmaier, K.; von Buttlar, H.; Wölfel, R.; Müller, K. Evaluation of Two Rapid Lateral Flow Tests and Two Surrogate ELISAs for the Detection of SARS-CoV-2 Specific Neutralizing Antibodies. Front. Med. 2022, 9, 820151. [Google Scholar] [CrossRef] [PubMed]
- Bal, A.; Pozzetto, B.; Trabaud, M.A.; Escuret, V.; Rabilloud, M.; Langlois-Jacques, C.; Paul, A.; Guibert, N.; D’Aubarède-Frieh, C.; Massardier-Pilonchery, A.; et al. COVID SER Study Group. Evaluation of high-throughput SARS-CoV-2 serological assays in a longitudinal cohort of patients with mild COVID-19: Clinical sensitivity, specificity, and association with virus neutralization test. Clin. Chem. 2021, 67, 742–752. [Google Scholar] [CrossRef]
- Saker, K.; Pozzetto, B.; Bal, A.; Valette, M.; Fassier, J.B.; Saade, C.; Trabaud, M.A.; Trouillet-Assant, S.; COVID SER Study Group. Are Anti-Receptor–Binding Domain Antibodies Still a Relevant Proxy for Monitoring SARS-CoV-2 Neutralizing Activity in the Omicron Era? Clin. Chem. 2022, 68, 984–986. [Google Scholar] [CrossRef]
- Townsend, A.; Rijal, P.; Xiao, J.; Tan, T.K.; Huang, K.-Y.A.; Schimanski, L.; Huo, J.; Gupta, N.; Rahikainen, R.; Matthews, P.C.; et al. A haemagglutination test for rapid detection of antibodies to SARS-CoV-2. Nat. Commun. 2021, 12, 1951. [Google Scholar] [CrossRef]
- Kruse, R.L.; Huang, Y.; Lee, A.; Zhu, X.; Shrestha, R.; Laeyendecker, O.; Littlefield, K.; Pekosz, A.; Bloch, E.M.; Tobian, A.A.R.; et al. A Hemagglutination-Based Semiquantitative Test for Point-of-Care Determination of SARS-CoV-2 Antibody Levels. J. Clin. Microbiol. 2021, 59, 12. [Google Scholar] [CrossRef] [PubMed]
- Focosi, D.; Franchini, M.; Maggi, F. Modified Hemagglutination Tests for COVID-19 Serology in Resource-Poor Settings: Ready for Prime-Time? Vaccines 2022, 10, 406. [Google Scholar] [CrossRef] [PubMed]
- Jochum, S.; Kirste, I.; Hortsch, S.; Grunert, V.P.; Legault, H.; Eichenlaub, U.; Kashlan, B.; Pajon, R. Clinical utility of Elecsys Anti-SARS-CoV-2 S assay in COVID-19 vaccination: An exploratory analysis of the mRNA-1273 phase 1 trial. Front. Immunol. 2021, 12. [Google Scholar] [CrossRef] [PubMed]
- Soleimani, R.; Khourssaji, M.; Gruson, D.; Rodriguez-Villalobos, H.; Berghmans, M.; Belkhir, L.; Yombi, J.; Kabamba-Mukadi, B. Clinical usefulness of fully automated chemiluminescent immunoassay for quantitative antibody measurements in COVID-19 patients. J. Med. Virol. 2021, 93, 1465–1477. [Google Scholar] [CrossRef]
- Lippi, G.; Salvagno, G.L.; Pegoraro, M.; Militello, V.; Caloi, C.; Peretti, A.; Gaino, S.; Bassi, A.; Bovo, C.; Cascio, G.L. Assessment of immune response to SARS-CoV-2 with fully automated MAGLUMI 2019-nCoV IgG and IgM chemiluminescence immunoassays. Clin. Chem. Lab. Med. 2020, 58, 1156–1159. [Google Scholar] [CrossRef] [Green Version]
- Hofmann, N.; Grossegesse, M.; Neumann, M.; Schaade, L.; Nitsche, A. Evaluation of a commercial ELISA as alternative to plaque reduction neutralization test to detect neutralizing antibodies against SARS-CoV-2. Sci. Rep. 2022, 12, 1–9. [Google Scholar] [CrossRef]
- Wölfel, R.; Corman, V.M.; Guggemos, W.; Seilmaier, M.; Zange, S.; Müller, M.A.; Niemeyer, D.; Jones, T.C.; Vollmar, P.; Rothe, C.; et al. Virological assessment of hospitalized patients with COVID-2019. Nature 2020, 581, 465–469. [Google Scholar] [CrossRef] [PubMed] [Green Version]
- Wang, S.; Sakhatskyy, P.; Chou, T.H.W.; Lu, S. Assays for the assessment of neutralizing antibody activities against Severe Acute Respiratory Syndrome (SARS) associated coronavirus (SCV). J. Immunol. Methods 2005, 301, 21–30. [Google Scholar] [CrossRef] [PubMed]
- Wickham, H. Ggplot2: Elegant Graphics for Data Analysis, 2nd ed.; Springer: New York, NY, USA, 2016; ISBN 978-3-319-24277-4. [Google Scholar]
- Sing, T.; Sander, O.; Beerenwinkel, N.; Lengauer, T. ROCR: Visualizing classifier performance in R. Bioinformatics 2005, 21, 3940–3941. [Google Scholar] [CrossRef]
- Thiele, C.; Hirschfeld, G. The cutpointr package: Improved and tidy estimation of optimal cutpoints. In Proceedings of the Statistical Computing 2017, Ulmer Informatik-Berichte, Günzburg, Germany, 23–25 July 2017. [Google Scholar]
- Robin, X.; Turck, N.; Hainard, A.; Tiberti, N.; Lisacek, F.; Sanchez, J.C.; Müller, M. pROC: An open-source package for R and S+ to analyze and compare ROC curves. BMC Bioinform. 2011, 12, 77. [Google Scholar] [CrossRef]
- Meyer, D.; Zeileis, A.; Hornik, K. The strucplot framework: Visualizing multi-way contingency tables with vcd. J. Stat. Softw. 2007, 17, 1–48. [Google Scholar] [CrossRef]

| Neutralizing Antibody Titers | Number of Samples |
|---|---|
| <80 | 25 |
| >80 | 20 |
| >160 | 21 |
| >320 | 17 |
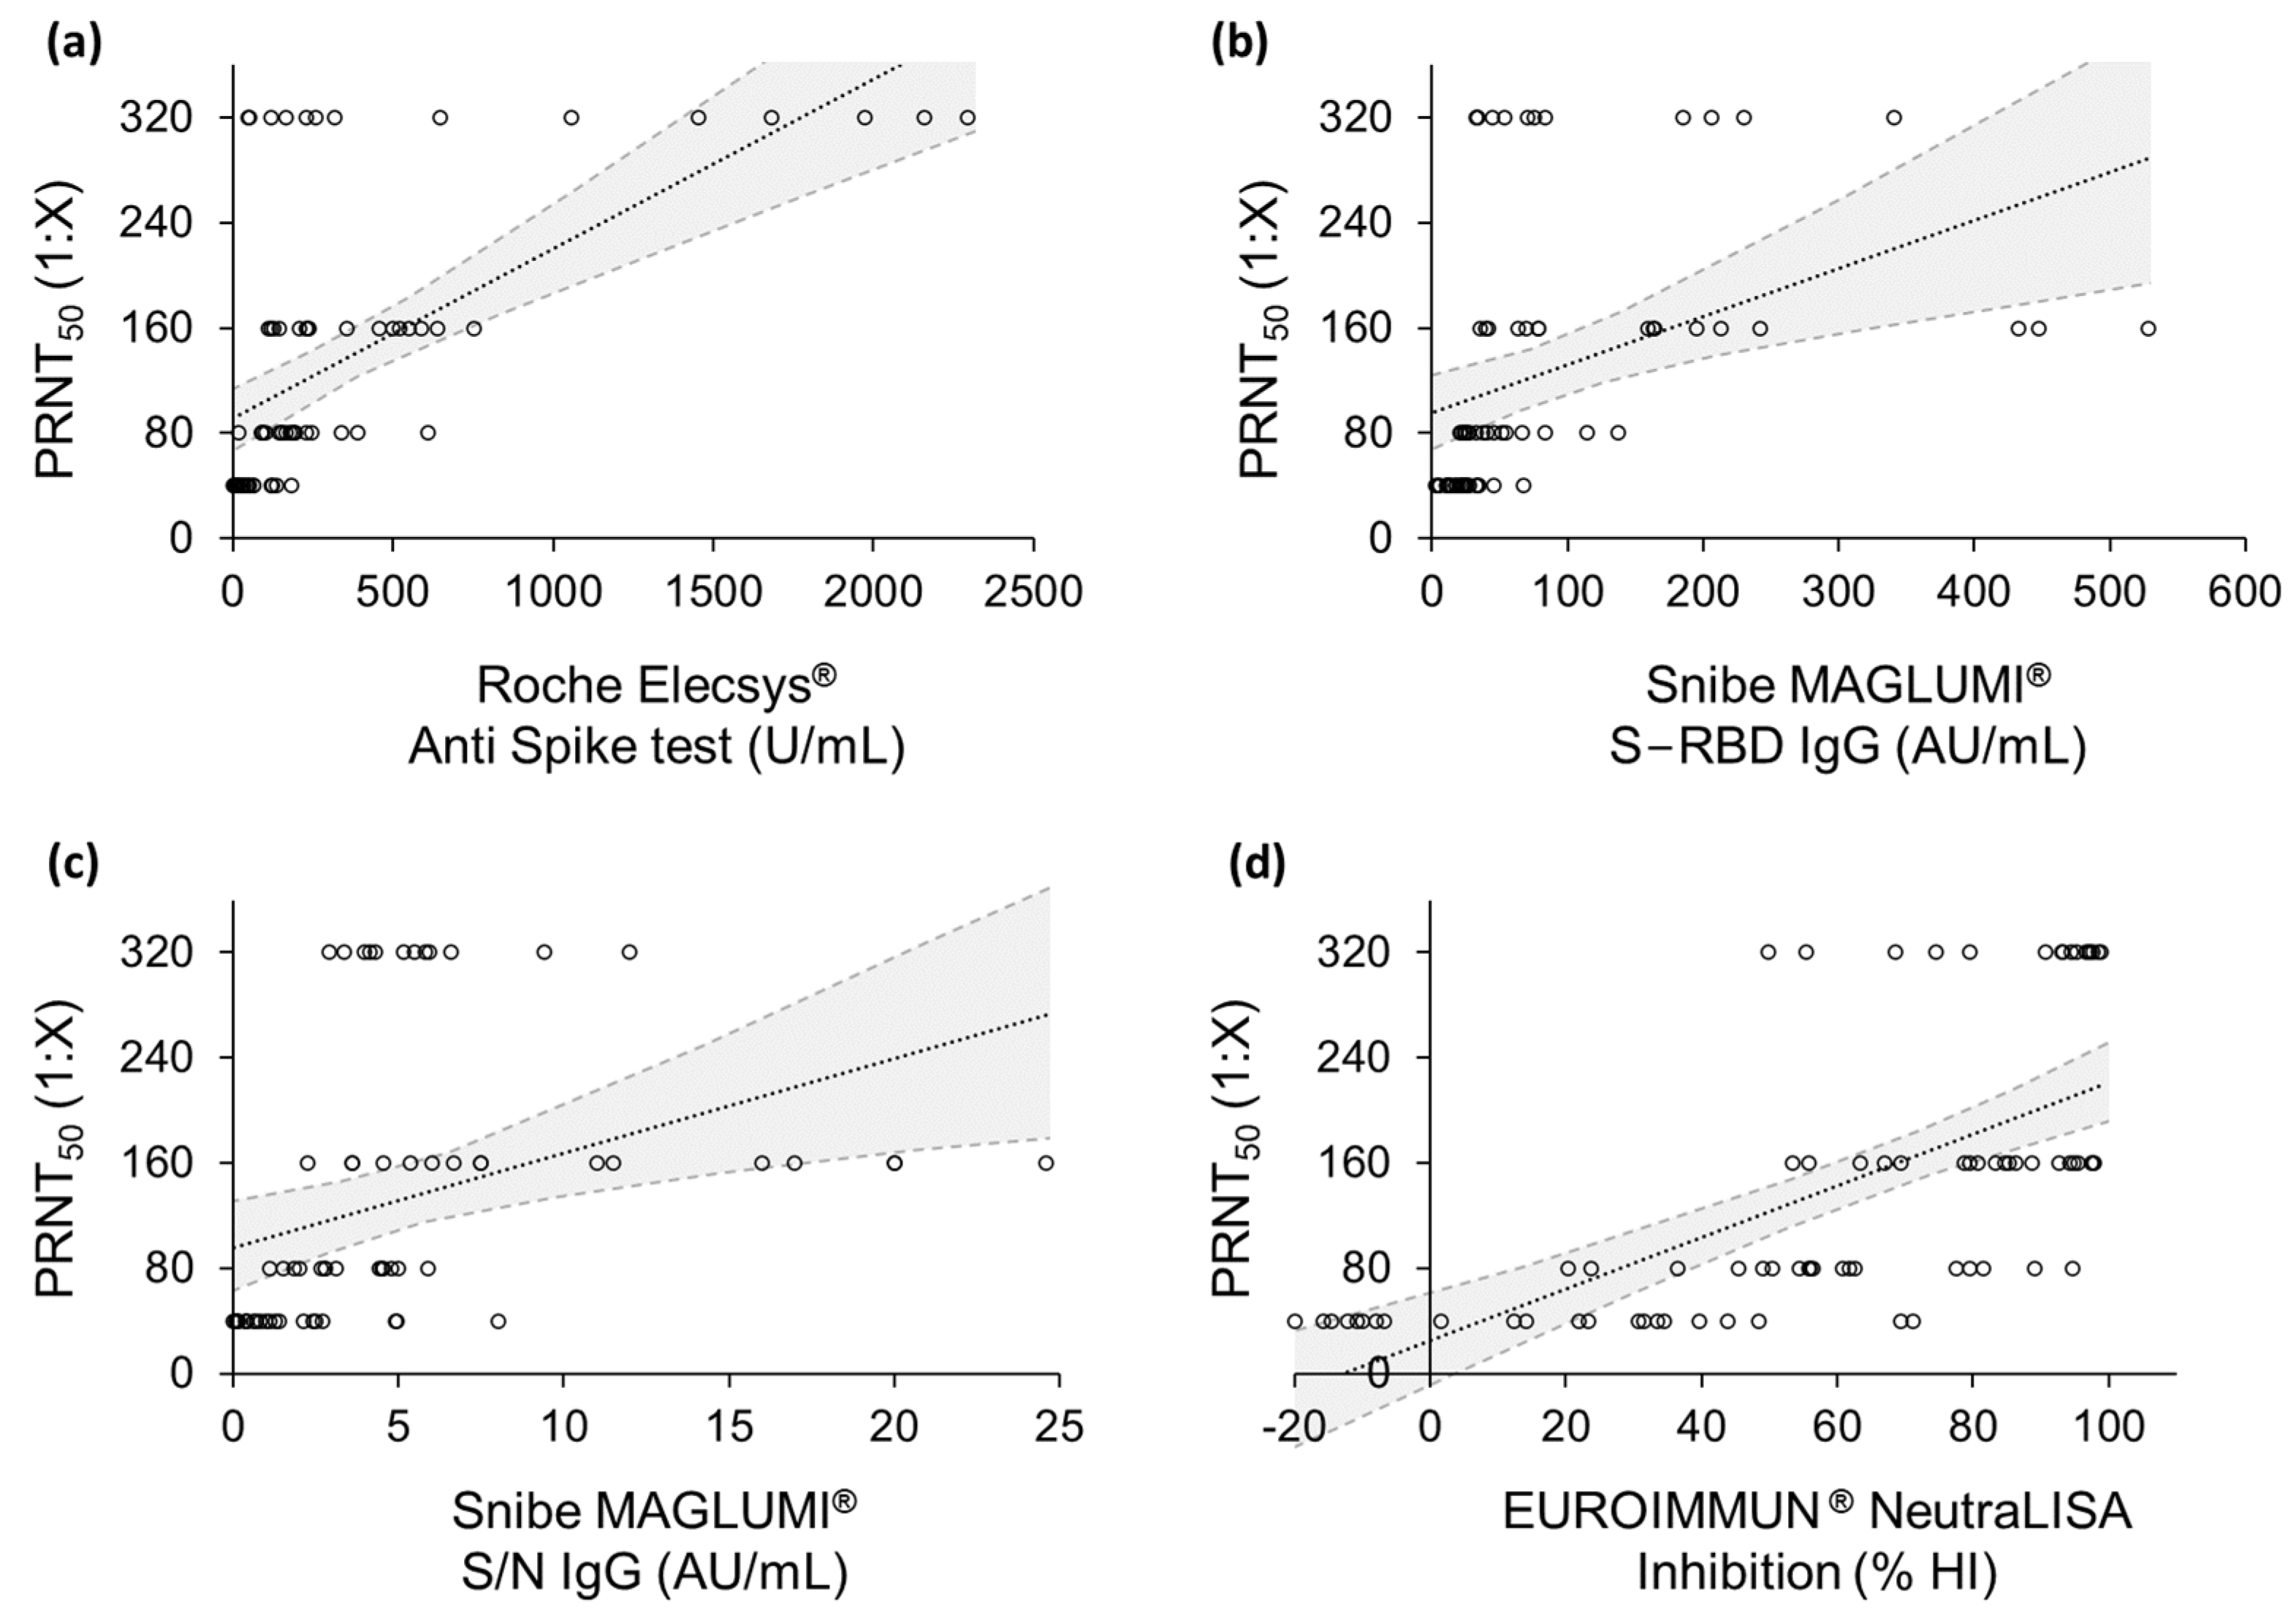
| Test | r | R2 | p-Value | β0 | β1 |
|---|---|---|---|---|---|
| Roche Elecsys® Anti Spike test | 0.617 | 0.381 | 1 × 10⁻⁸ | 0.129 | 90.735 |
| Snibe MAGLUMI® S-RBD IgG test | 0.392 | 0.153 | 1 × 10⁻³ | 0.365 | 95.386 |
| Snibe MAGLUMI® S/N IgG test | 0.364 | 0.132 | 3 × 10⁻³ | 7.192 | 95.383 |
| EUROIMMUN® NeutraLISA assay | 0.660 | 0.436 | 9 × 10⁻¹¹ | 1.959 | 25.044 |
| Test | r | p-Value |
|---|---|---|
| Roche Elecsys® Anti Spike test | 0.726 | 8 × 10⁻¹³ |
| Snibe MAGLUMI® S-RBD IgG test | 0.730 | 8 × 10⁻¹³ |
| Snibe MAGLUMI® S/N IgG test | 0.681 | 6 × 10⁻¹⁰ |
| EUROIMMUN® NeutraLISA assay | 0.784 | 2 × 10⁻¹⁶ |
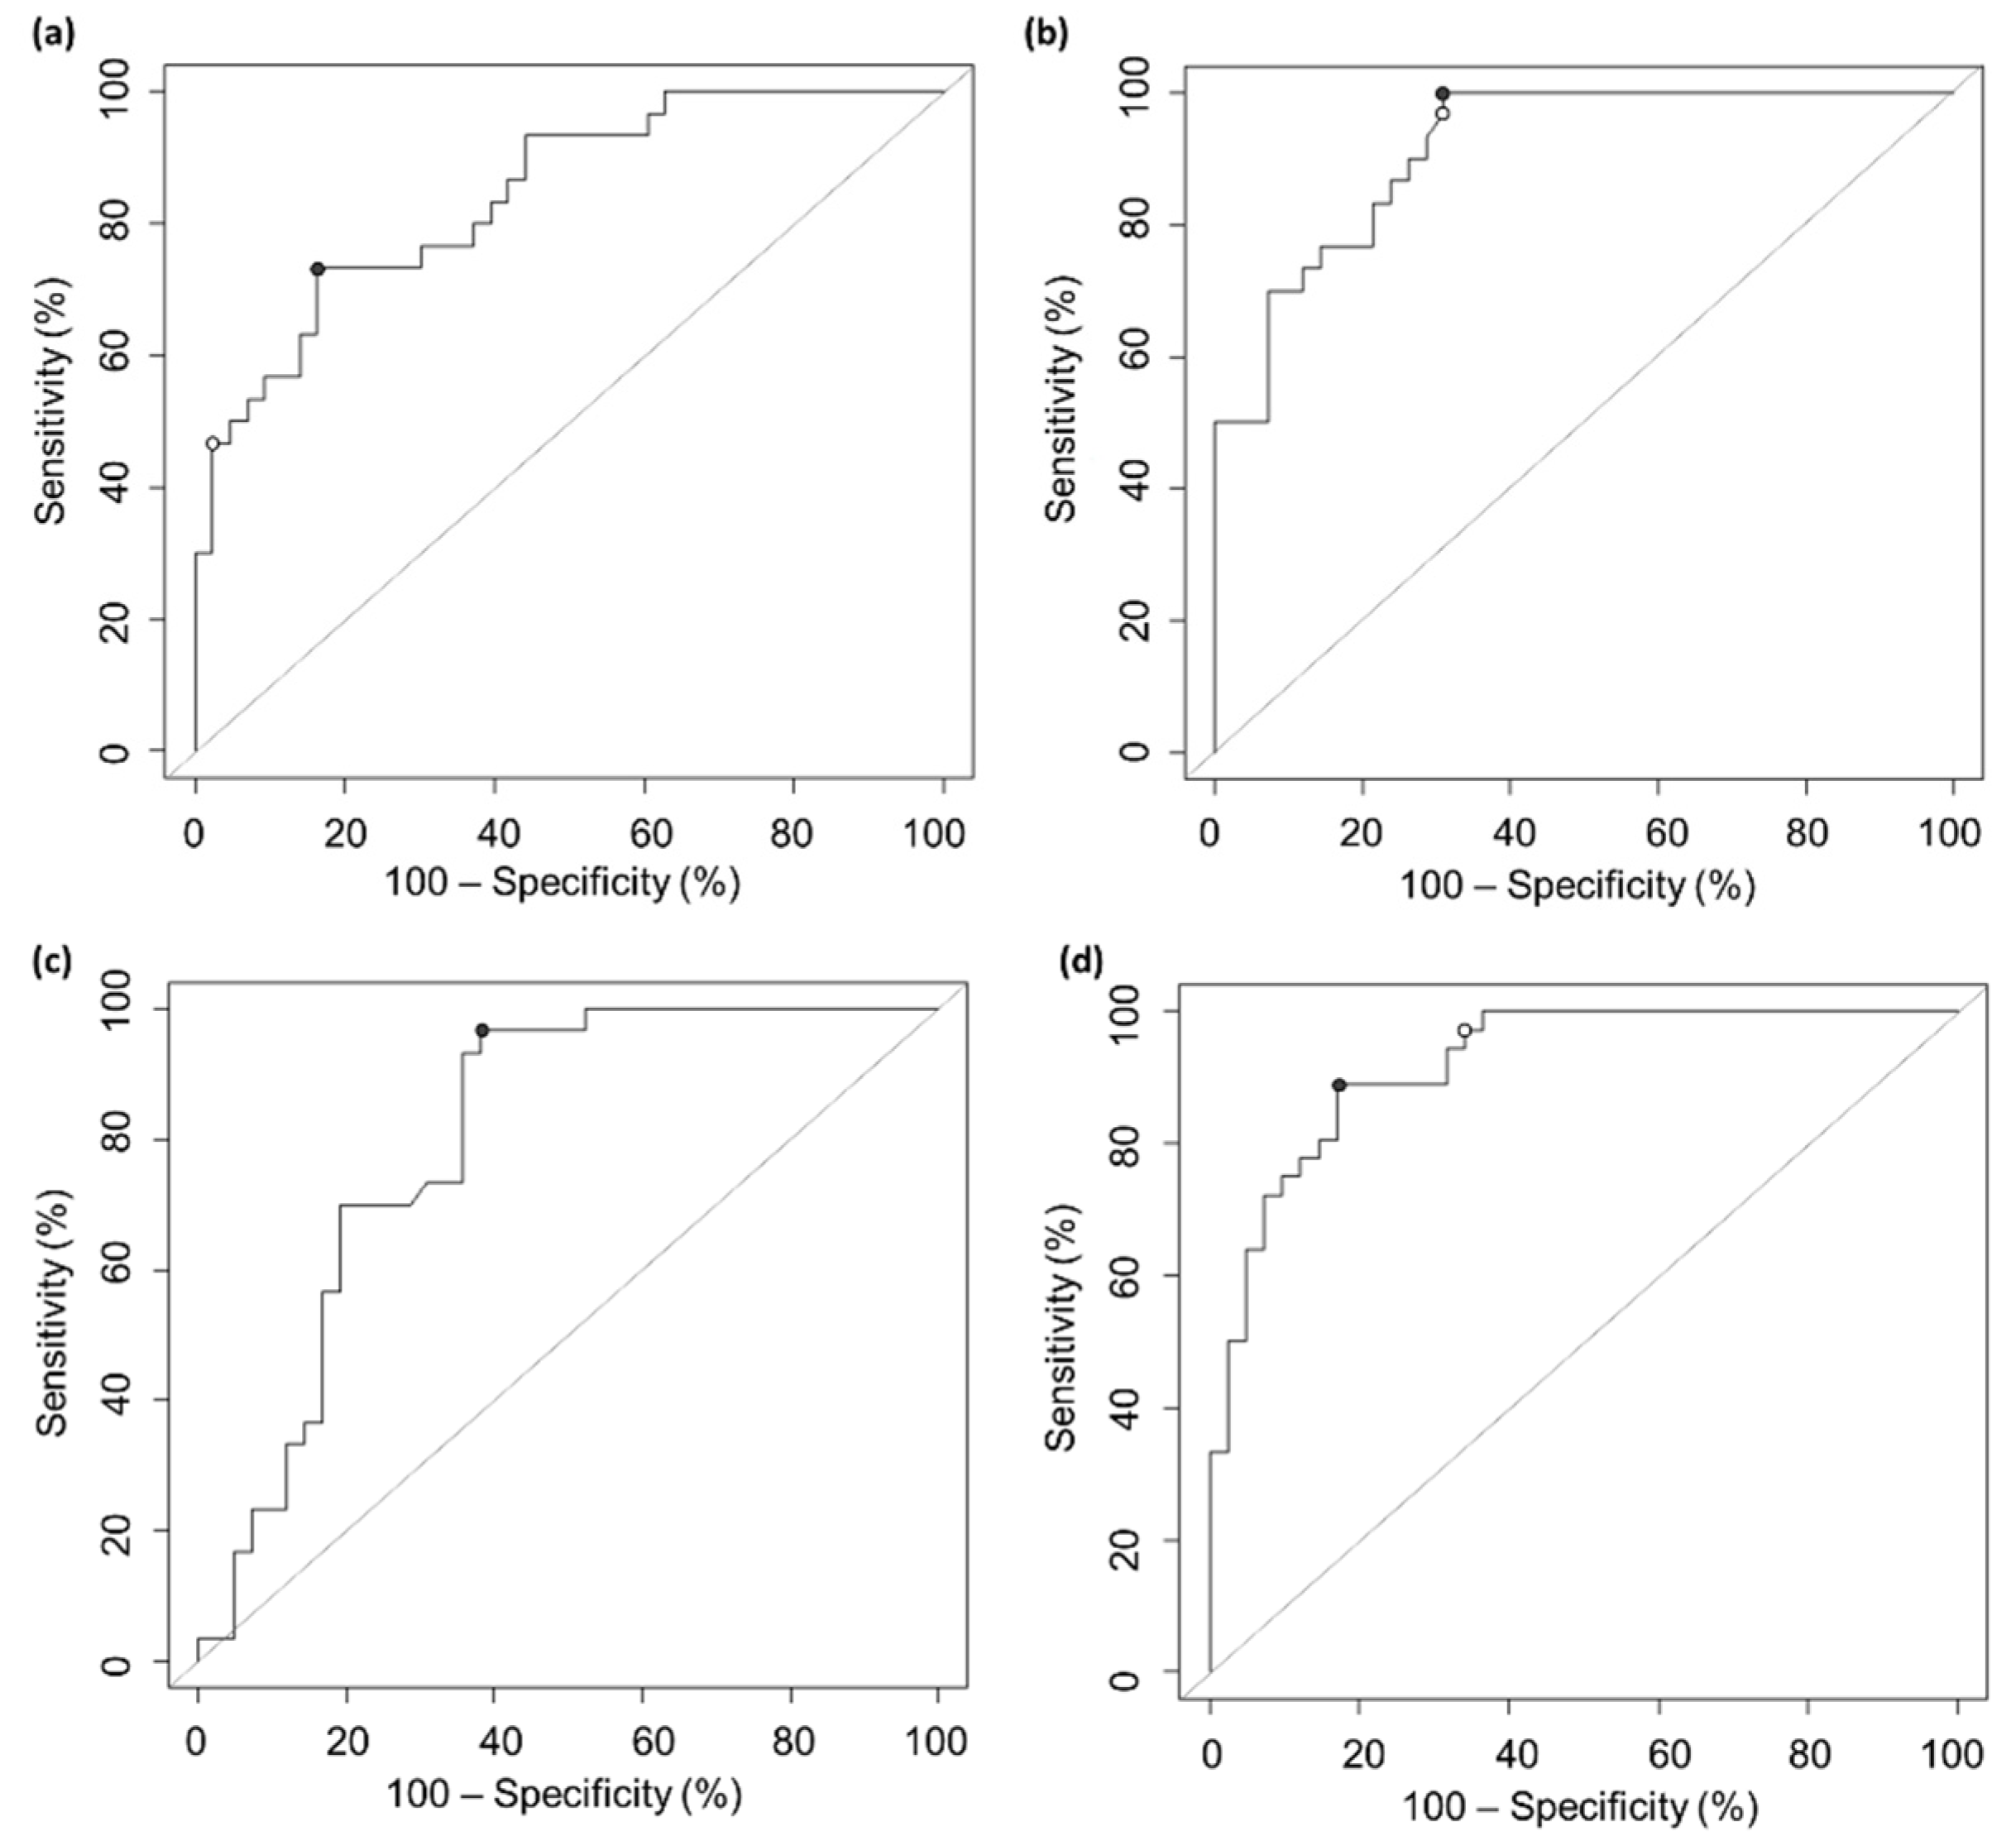
| Test | AUC | Cut-off | Accuracy | Sensitivity | Specificity |
|---|---|---|---|---|---|
| Roche Elecsys® Anti Spike test | 0.843 | 210 U/mL | 0.794 | 0.733 | 0.837 |
| Snibe MAGLUMI® S-RBD IgG test | 0.916 | 32.7AU/mL | 0.819 | 1.000 | 0.691 |
| Snibe MAGLUMI® S/N IgG test | 0.802 | 2.9 AU/mL | 0.764 | 0.967 | 0.619 |
| EUROIMMUN® NeutraLISA assay | 0.921 | 63.3% | 0.857 | 0.889 | 0.829 |
| Test | Cohen’s Kappa Coefficient (CI) | Positive Predictive Agreement |
|---|---|---|
| Roche Elecsys® Anti Spike test | 0.972 (0.916–1.000) | 96.7% |
| Snibe MAGLUMI® S-RBD IgG test | 0.650 (0.489–0.811) | 69.8% |
| Snibe MAGLUMI® S/N IgG test | 0.913 (0.817–1.000) | 93.3% |
| EUROIMMUN® NeutraLISA assay | 0.975 (0.925–1.000) | 97.4% |
Publisher’s Note: MDPI stays neutral with regard to jurisdictional claims in published maps and institutional affiliations. |
© 2022 by the authors. Licensee MDPI, Basel, Switzerland. This article is an open access article distributed under the terms and conditions of the Creative Commons Attribution (CC BY) license (https://creativecommons.org/licenses/by/4.0/).
Share and Cite
Bonifacio, M.A.; Laterza, R.; Vinella, A.; Schirinzi, A.; Defilippis, M.; Di Serio, F.; Ostuni, A.; Fasanella, A.; Mariggiò, M.A. Correlation between In Vitro Neutralization Assay and Serological Tests for Protective Antibodies Detection. Int. J. Mol. Sci. 2022, 23, 9566. https://doi.org/10.3390/ijms23179566
Bonifacio MA, Laterza R, Vinella A, Schirinzi A, Defilippis M, Di Serio F, Ostuni A, Fasanella A, Mariggiò MA. Correlation between In Vitro Neutralization Assay and Serological Tests for Protective Antibodies Detection. International Journal of Molecular Sciences. 2022; 23(17):9566. https://doi.org/10.3390/ijms23179566
Chicago/Turabian StyleBonifacio, Maria Addolorata, Riccardo Laterza, Angela Vinella, Annalisa Schirinzi, Mariangela Defilippis, Francesca Di Serio, Angelo Ostuni, Antonio Fasanella, and Maria Addolorata Mariggiò. 2022. "Correlation between In Vitro Neutralization Assay and Serological Tests for Protective Antibodies Detection" International Journal of Molecular Sciences 23, no. 17: 9566. https://doi.org/10.3390/ijms23179566