Article

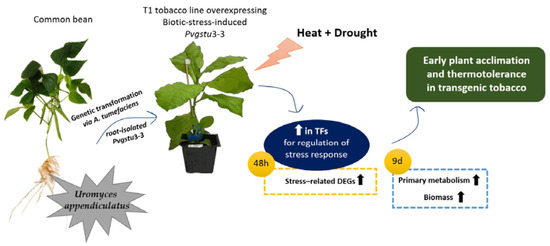
Overexpression of A Biotic Stress-Inducible Pvgstu Gene Activates Early Protective Responses in Tobacco under Combined Heat and Drought

by
Evangelia Stavridou
1,2,
Georgia Voulgari
1,
Michail Michailidis
3,
Stefanos Kostas
4,
Evangelia G. Chronopoulou
5,
Nikolaos E. Labrou
5,
Panagiotis Madesis
2,6 and
Irini Nianiou-Obeidat
1,*
1
Laboratory of Genetics and Plant Breeding, School of Agriculture, Forestry and Natural Environment, Aristotle University of Thessaloniki, P.O. Box 261, GR-54124 Thessaloniki, Greece
2
Institute of Applied Biosciences, CERTH, 6th km Charilaou-Thermis Road, Thermi, P.O. Box 361, GR-57001 Thessaloniki, Greece
3
Laboratory of Pomology, Department of Horticulture, School of Agriculture, Aristotle University of Thessaloniki, GR-54124 Thessaloniki, Greece
4
Laboratory of Floriculture, School of Agriculture, Forestry and Natural Environment, Aristotle University of Thessaloniki, GR-54124 Thessaloniki, Greece
5
Laboratory of Enzyme Technology, Department of Biotechnology, School of Food, Biotechnology and Development, Agricultural University of Athens, 75 Iera Odos Street, 11855 Athens, Greece
6
Laboratory of Molecular Biology of Plants, School of Agricultural Sciences, University of Thessaly, 38446 Thessaly, Greece
*
Author to whom correspondence should be addressed.
Int. J. Mol. Sci. 2021, 22(5), 2352; https://doi.org/10.3390/ijms22052352
Submission received: 11 January 2021 / Revised: 22 February 2021 / Accepted: 24 February 2021 / Published: 26 February 2021
(This article belongs to the Special Issue Mechanisms of Drought, Temperature and Salinity Tolerance in Plants)

Abstract

:
Drought and heat stresses are major factors limiting crop growth and productivity, and their effect is more devastating when occurring concurrently. Plant glutathione transferases (GSTs) are differentially expressed in response to different stimuli, conferring tolerance to a wide range of abiotic stresses. GSTs from drought-tolerant Phaseolus vulgaris var. “Plake Megalosperma Prespon” is expected to play an important role in the response mechanisms to combined and single heat and drought stresses. Herein, we examined wild-type N. tabacum plants (cv. Basmas Xanthi) and T1 transgenic lines overexpressing the stress-induced Pvgstu3–3 and Pvgstu2–2 genes. The overexpression of Pvgstu3–3 contributed to potential thermotolerance and greater plant performance under combined stress. Significant alterations in the primary metabolism were observed in the transgenic plants between combined stress and stress-free conditions. Stress-responsive differentially expressed genes (DEGs) and transcription factors (TFs) related to photosynthesis, signal transduction, starch and sucrose metabolism, osmotic adjustment and thermotolerance, were identified under combined stress. In contrast, induction of certain DEGs and TF families under stress-free conditions indicated that transgenic plants were in a primed state. The overexpression of the Pvgstu3–3 is playing a leading role in the production of signaling molecules, induction of specific metabolites and activation of the protective mechanisms for enhanced protection against combined abiotic stresses in tobacco.

Graphical Abstract

1. Introduction

Drought and high temperature are two of the most severe environmental factors as they usually occur concurrently, causing a reduction in crop growth and productivity worldwide [1,2], and their combined effect is greater than when occurring individually [3]. Identifying distinctive or common mechanisms necessary for plant acclimatization and tolerance under combined abiotic stresses is a prerequisite for mitigating the negative effects of climate change.
The molecular and morphophysiological responses of plants to drought and heat stress combination are considered unique and cannot be directly extrapolated from the response of plants exposed to either a single drought or heat stress [4,5,6]. Various sensors involved in systemic responses to stress are transduced by metabolic and other signaling pathways, including transcription factors, photosynthetic mechanisms, antioxidant mechanisms, pathogen responses, hormone signaling, and osmolyte synthesis [7,8,9]. Anatomical and morphological changes in response to drought stress include the reduction in leaf number and leaf area to reduce water loss and the increase in root growth for enhanced water uptake, whereas, in heat stress, the increased transpiration is achieved by increasing leaf number and area [10].
However, much remains to be discovered about the underlying mechanisms of systemic plant response to combinations of stress [10,11,12]. In such an endeavor, an integrated systems biology approach would potentially shed light on the gene function towards a better understanding of the abiotic stress response mechanisms for developing climate-change-oriented breeding strategies.
A wide spectrum of abiotic stresses, either single or combined, can impair plant function by inhibiting essential processes and induce overproduction of ROS, which are extremely reactive and toxic, causing damage to proteins, lipids, carbohydrates and DNA and ultimately resulting in oxidative stress [13]. Antioxidant mechanisms play an important role in the response of plants to a combination of drought and heat stress, with higher antioxidant capacity being associated with plant tolerance against stress combination [6,14]. Glutathione-S-transferases (GST, EC 2.5.1.18.) are members of the enzymatic defense system exhibiting high divergence with multiple functions in stress-tolerance [15], and their expression is tissue and/or developmental stage-specific and differs in response to stresses [16]. Especially members of the Tau and Phi classes have been shown to mitigate the effects of environmental stress factors, such as water deficit stress [17], salinity [18], heavy metal toxicity [19,20] and pathogen attack [21].
Several GST, both constitutive and induced, are expressed in plants, and their expression in different plant tissues (leaves and roots) is dependent on the sensed stimuli [22]. Thus, far, studies regarding the effect of combined or single drought and heat stresses reinforce the evidence of the significant role of antioxidant enzymes in a combination of drought and heat stress. For instance, the cytosolic ascorbate peroxidase 1 (APX1) has been found to play a key role in the acclimation of plants to a combination of drought and heat stress [23]. Even more, the protection of the antioxidative enzymes, such as the superoxide dismutase (SOD) and guaiacol peroxidase (GPX) involved in the control of ROS in stress conditions has been found to reduce the negative effects of heat, drought and light stresses and their combinations [24]. Increased GST activity has been observed under high temperature and/or drought stress, compared to control mung bean seedlings [25], or was induced under combined and single drought and heat stresses in an abscisic acid (ABA)-independent manner, yet when combined stress occurred, the effect on GST expression was interactive [26]. Recent studies on tobacco plants overexpressing the Gmgstu4 suggest pleiotropic effects on plant metabolism under salt stress, where the transgenic plants exhibited an increased concentration of protective metabolites, such as proline and trehalose [27], little is known about the regulatory functions of GSTs in combined stress plant response.
Phaseolus vulgaris (common bean) is a major grain legume crop and is among the five cultivated species from the genus Phaseolus with great economic and commercial importance after soybean and peanut [28]. The common bean crop is cultivated in diverse environments, such as drought-prone areas, and studies have shown that it is sensitive to many abiotic stresses, including water limitation [29]. Both drought and salinity stresses have a negative impact on the common bean crop production, especially when the stress occurs in specific growth stages of the crop [30]. However, there is some variability within P. vulgaris for salt and drought-tolerance [31,32]. Herein, the stress-induced Pvgstu [21,33] was isolated from a Greek drought-tolerant variety “Plake Μegalosperma Prespon” of protected geographic indication (PGI) (reg. 18.07.1998) [34,35] cultivated in the areas around Prespa lakes, North West Greece and its mature white seeds are harvested as dry beans. GSTs are major stress regulators playing an important role in the tolerance mechanism involved under abiotic stresses. The transgenic-based approaches have been, thus far, applied to enable the understanding of mechanisms against mainly single abiotic stress damage for the development of tolerant plant species and varieties [36]. The aim of this study was to better understand the functional role of the Pvgstu as a target gene in plant stress response against heat, water deficit and combined heat and drought stresses via overexpression into the model plant tobacco. Our hypothesis is that abiotic- or herbicide-inducible gstu genes would potentially confer systemic protection against abiotic stresses and was relied on preliminary data indicating that the Pvgstu transgenic plants exhibited an enhanced performance under a series of single abiotic and oxidative stresses (unpublished results). More specifically, we have used a biotic-stress -inducible (Uromyces appendiculatus—responsible for bean rust) glutathione transferase isolated from the roots (Pvgstu3–3) and a herbicide (fluazifop-p-butyl)-inducible GST isolated from the leaves (Pvgstu2–2) of P. vulgaris PGI variety “Plake Μegalosperma Prespon” for their high antioxidant catalytic function and action as hydroperoxides, thioltransferases, and dehydroascorbate reductases [21,33]. By overexpressing each of these genes in the model plant, N. tabacum, we aimed at unraveling whether and how such GSTs derived from different plant tissues of the common bean may affect the response to drought, high temperature and their combination. To our knowledge, the role of gstu genes from the common bean (P. vulgaris) has not yet been investigated. Unravelling the metabolomic and transcriptomic aspects of plant response to the combination of heat and drought will elucidate the pathways involved in the in planta potential of PvGSTU isoenzymes to mitigate the negative impacts of combined abiotic stresses in stress-prone areas and especially under the current predictions of global climate change.

2. Results

2.1. Evaluation, Relative Expression and Enzymatic Activity of the Transgenes

Double digestion and ligation were performed to generate the recombinant plasmids pART27-Pvgstu3–3 and pART27-Pvgstu2–2 under the control of the CaMV35S promoter and were verified by PCR (Figure S1a). The recombinant plasmids were transferred to E. coli, and the colonies were screened for successful insertion of the plasmid (Figure S1b,c) (More details can be found in the supplementary material). The positive colonies were further tested by restriction enzyme analysis and were sequenced.
For the genetic transformation of the leaf explants, an initial co-cultivation with the A. tumefaciens was performed, followed by four weeks in the selection medium MSR1. In total, 21 and 10 putative genetically transformed independent T0 lines overexpressing the Pvgstu2–2 and Pvgstu3–3 genes, respectively, with resistance to kanamycin, were obtained. RT–PCR analysis verified that 19 out of 21 putative transgenic lines were positive for the Pvgstu2–2 (~90.5% success) and 9 out of 10 (~90% success) for the Pvgstu3–3. The expected 853 bp and 822 bp fragments were detected in the independently transformed tobacco lines for the Pvgstu2–2 and Pvgstu3–3, respectively, whereas no band was observed in the wild-type (WT) plants (Figure S2).
Quantitative RTPCR revealed varied transcript levels among the transgenic lines as compared to the non-detectable expression in WT plants. More specifically, in comparison to the β-actin expression levels, the Pvgstu2–2 gene showed higher levels of expression in lines Pvgstu2–2.9 (1.99 ± 0.33), Pvgstu2–2.16 (1.00 ± 0.04), Pvgstu2–2.19 (0.99 ± 0.25) and Pvgstu2–2.13 (0.93 ± 0.55). The Pvgstu3–3 gene was highly expressed in the T0 Pvgstu3–3.4 (77.71 ± 0.51), Pvgstu3–3.10 (51.62 ± 0.47), Pvgstu3–3.2 (38.05 ± 0.40), Pvgstu3–3.8 (22.63 ± 0.61) and Pvgstu3–3.28 (20.11 ± 0.74) lines (Figure S3; Table S1).
For the enzymatic activity, eight lines overexpressing the Pvgstu2–2 gene were tested on the NBD-CI substrate, with seven lines showing similar enzyme activity and Pvgstu2–2.13 line having 2-times higher enzymatic activity compared to the rest. Respectively, from the nine lines overexpressing the Pvgstu3–3 gene, the Pvgstu3–3.1, Pvgstu3–3.4 and Pvgstu3–3.8 showed the highest enzymatic activity compared to non-genetically transformed plants in CDNB substrate (Figure S4). These results confirmed that the T0 transgenic lines encode for active GST proteins.

2.2. Morpho-Physiological Responses

The T1 independent transgenic tobacco lines Pvgstu2–2.19 and Pvgstu3–3.4 were selected for this study based on two factors: (i) the high relative expression and enzymatic activity of the transgenes (Figures S3 and S4; Table S1) and (ii) their previous performance under salinity and drought stresses (unpublished results as part of the GST-TOOLS research project, THALES Program). Therefore, to further assess the in planta role in abiotic stress response mechanisms of the two Pvgstu genes isolated from the roots and the leaves of P. vulgaris, we assessed the morphophysiological, transcriptomic and metabolomic response of WT and transgenic tobacco lines Pvgstu2–2.19 and Pvgstu3–3.4 in vivo after applying combined (DT) and single drought (D) and heat (T) stresses in growth chamber-controlled conditions.
To investigate the specific effects of the single drought and heat stresses and their combinatorial effect on growth parameters, two harvests were performed: at nine days (mid-harvest) and 16 days (final harvest). Additionally, the transgenic lines and WT plants under DT stress showed significant leaf wilting from day nine onward. Therefore, re-watering was applied on day 9 to half of the DT-treated plants to assess whether the plants would effectively recover in comparison to the DT plants on day 16 (final harvest). The plants remained under heat to test whether the wilting was attributed to drought or heat stress, given that plants under single D or T stresses did not show any significant wilting. Overall, we observed that (i) the combined stress treatment was more severe compared to single stress effects, as early as on day six (Figure S5) and (ii) the Pvgstu3–3.4 was more tolerant compared to Pvgstu2–2.19 and WT plants. It is interesting that under single D or T stress, neither the transgenic lines nor the WT plants showed any significant wilting compared to the DT treatment as observed on mid-harvest (day 9) (Figure 1). This was consistent with maintaining their dry weight under single stress treatments (Figure 2), yet under DT stress, the Pvgstu3–3.4 dry weight was significantly higher compared to WT (Figure 2). The Pvgstu3–3.4 was generally more tolerant to the stresses compared to WT plants and Pvgstu2–2.19, with the latter showing a more intermediate response (Table 1). Specifically, under D and DT treatments, both the Pvgstu3–3.4 and WT had a similar response trend in terms of fresh weight and leaf number (Figure 2; Table 1). However, the major difference was observed in root length, with Pvgstu3–3.4 being unaffected even under severe combined DT stress, whereas the Pvgstu2–2.19 and WT plants showed a moderate reduction under the single stresses (T, D) and a 54.4 and 53.8% reduction under combined DT stress and C conditions, respectively (Table 1).
Based on the final harvest data (day 16), Pvgstu3–3.4 outperformed the Pvgstu2–2.19 and WT plants under single T stress in all morphological parameters (Table 2; Table S2), with greater root length, fresh- and dry weights and by showing significantly greater dry weight in combined DT stress and fresh weight at recovery (Figure 2; Table 2). Nevertheless, the utmost advantage of the Pvgstu2–2.19 line was the significantly higher leaf number not only under control conditions but also under severe combined DT stress when compared to WT plants (Table 2). Single D treatment did not have any negative effect on the morphological parameters measured, however under combined DT stress, the root length was significantly reduced in Pvgstu2–2.19, whereas the WT plants showed significant leaf loss (Table 2) and a significant reduction in dry matter (MD) (Figure 2). The recovery of both transgenic lines and WT plants previously subjected to DT treatment was successful, as observed on the final harvest (day 16), with Pvgstu3–3.4 exhibiting increased turgor manifested with significantly increased MF (Table 2). MF was improved at recovery to a greater extent than plants under single D or combined DT treatments, and leaf loss was more severe under DT stress in all transgenic lines and WT plants (Table S2).
The combination of DT stress negatively affected the functionality of PSII in both transgenic and WT plants with a dramatic decrease in maximum quantum yield of PSII on day 9 (mid-harvest), while during the final harvest (day 16), we could not obtain any data due to the extensive leaf wilting and senescence (Figure 3). Nevertheless, both transgenic lines showed a greater maximum quantum yield of PSII under single D stress on days 9 and 16 compared to the WT plants (Figure 3; Table S3). At nine days, the relative chlorophyll content increased in Pvgstu3–3.4 under single T stress, whereas it was not affected under any stress treatment in Pvgstu2–2.19 and WT plants compared to stress-free plants. However, at 16 days, Pvgstu3–3.4 increased the relative chlorophyll content under single D and T stresses, while Pvgstu2–2.19 only under single T stress and the WT plants under D stress compared to the stress-free control plants (Figure 3; Table S3). In the combined DT stress, the leaves of all transgenic lines and WT plants senesced (Figure 3); yet, the recovery of the physiological parameters on day 16, after seven days from the beginning of re-watering (day 9), was significant for all transgenic and WT plants compared to the DT plants on day 9, given that no physiological data could be obtained from DT treatment at 16 days (Table S4).

2.3. Effect of Pvgstu3–3 Overexpression on the Transcriptome in Control and Combined Drought and Heat Stress Conditions

Based on the morphophysiological results, the Pvgstu3–3.4 line showed better response under a combination of heat and drought stresses, and therefore, it was selected for further investigation of the alterations in transcriptome and metabolome levels to understand the potential response of a biotic-induced gene under concurrent heat and drought stress. The comparison was performed among the WT plants under control conditions (group 1) and transgenic line Pvgstu3–3.4 under control (group 2) and 8 h (group 3) and 48 h (group 4) after exposure to combined DT with an average of 75.64% reads being mapped to the reference genome. The uniformity of the mapping result for each sample reinforced that the expression profile was similar, thus allowing for their comparative analysis. The analysis of all 4 groups generated 42,538 million clean reads in total with a quality score Q20 (error probability of 1%) at 98.27%. In terms of gene expression, the total mapping rate was on average 83.79%, with a unique mapping rate being at 20.24%. The total number of identified genes was, on average, 77.5 million, of which 49.2 million are known genes.
The differentially expressed genes (DEGs) were selected according to the standard of p< 0.05, and the false discovery rate (FDR) was set to 0.001 to determine the threshold of the p-value for multiple tests. The absolute value of |log2Ratio| ≥ 1 was used to determine the difference between the gene expression transcription group and the database. Analysis of the DEGs between the stress-free (control conditions) WT and transgenic plants (group 1 vs. group 2) showed that there are 73,505 commonly expressed DEGs, 8503 unique DEGs expressed in Pvgstu3–3.4 and 3038 in WT (Figure 4a). However, when the combined DT stress was applied, we observed that Pvgstu3–3.4 under control conditions compared to 48 h under combined DT stress (group 2 vs. group 4) had more commonly expressed DEGs (77,657), 4351 unique DEGs for Pvgstu3–3.4 in stress-free conditions and 6800 for Pvgstu3–3.4 at 48 h under DT stress (Figure 4b). A slight increase in the uniquely expressed DEGs (10,989) was observed in Pvgstu3–3.4 at 48 h under DT stress (Figure 4d) compared to 10,523 after 8 h under DT stress (Figure 4c), which were greater than the uniquely expressed DEGs of stress-free Pvgstu3–3.4 (Figure 4a). After comparing the commonly expressed genes between stress-free conditions (Figure 4a), 8 h under DT stress (Figure 4c) and 48 h under DT stress (Figure 4d), we observed an increase of 154 commonly expressed DEGs at 8 h (Figure 4c) and a decrease of 37 commonly expressed DEGs at 48 h under DT stress (Figure 4c) compared to the stress-free conditions (Figure 4a).
A total of 4355 unigenes were identified between WT and Pvgstu3–3.4 (groups 1 against 2, respectively) under stress-free conditions, including 2454 up- and 1901 downregulated genes (Figure 5a). However, when we compared the Pvgstu3–3.4 under C conditions against combined DT stress at 48 h, a total of 21,221 unigenes (~5-fold greater than stress-free Pvgstu3–3.4 against WT) were identified with 13,838 up- and 7383 downregulated genes (Figure 5b). Between Pvgstu3–3.4 at 8 h (Figure 5c) and 48 h (Figure 5d) under DT stress, the identified unigenes increased by 2-fold with a total of 6007 and 11,954 unigenes, respectively.
Gene Ontology (GO) assignments (biological process, cellular component and molecular function) were used to classify the predicted functions of WT and Pvgstu3–3.4 line under control and DT conditions at the different time points (Figure S6). Between stress-free WT (C) and Pvgstu3–3.4 under C (Figure S6a) and DT conditions at 8 h (Figure S6c) and 48 h (Figure S6d), we observed a progressive increase in the DEGs. Overall, similar GO assignments were represented among the WT against Pvgstu3–3.4 in stress-free conditions (Figure S6a) and Pvgstu3–3.4 under DT conditions at 8 h (Figure S6c) and 48 h (Figure S6d), yet the associated DEGs increased with the longer exposure to DT stress (8 h against 48 h). Among the biological processes, DEGs involved in the nitrogen utilization, rhythmic processes and pigmentation were induced under DT stress at both 8 h (Figure S6c) and 48 h (Figure S6d) when compared to the control conditions (Figure S6a). In addition, cell aggregation, cell proliferation, detoxification and cell junction were induced after 48 h of DT imposition. Interestingly, the Pvgstu3–3.4 DT against control conditions (Figure S6b) exhibited a higher number of DEGs for all GO terms.
The DEGs were assigned by the KEGG according to functional classification and biochemical pathways, as shown in Table 3 for the WT and Pvgstu3–3.4 under stress-free and DT conditions in the different time points (8 and 48 h). KEGG pathway analysis revealed that between the Pvgstu3–3.4 and the WT plants under stress-free conditions, the representative pathways included: the metabolic pathways (24.56%), mitogen-activated protein kinase (MAPK) signaling pathway (6.01%) and NF-kappa B signaling pathway (5.48%). Additionally, 2.47% of the DEGs were assigned to the arachidonic acid metabolism, tryptophan metabolism and peroxisome pathways (Table 3). However, when comparing the WT under stress-free conditions against the Pvgstu3–3.4 at 8 h under DT, the metabolic pathways were at a slightly increased percentage (26.05%) and included other pathways, such as the starch and sucrose metabolism (2.99%), amino sugar and nucleotide sugar metabolism (2.69%), the galactose metabolism, arachidonic acid metabolism, retinol metabolism at 2.10% and the metabolism of xenobiotics by cytochrome P450 and tryptophan metabolism at 1.95% (Table 3). At 48 h under DT, the represented pathways aside from metabolic pathways (24.87%) included the carbon metabolism (3.46%), biosynthesis of amino acids (2.52%), starch and sucrose metabolism (2.46%), tryptophan metabolism (1.76%), arachidonic acid metabolism (1.70%), amino sugar and nucleotide sugar metabolism, retinol metabolism at 1.64%, whereas metabolism of xenobiotics by cytochrome P450, glycolysis/gluconeogenesis and glyoxylate and dicarboxylate metabolism at 1.51% (Table 3). Interestingly, when comparing Pvgstu3–3.4 under DT at 48 h in reference to control conditions, DEGs of carbon metabolism (3.43%), AMPK signaling pathway, biosynthesis of amino acids and ABC transporters at 2.17%, pyruvate metabolism (1.79%), starch and sucrose metabolism (1.17%) and citrate cycle (TCA cycle) (1.39%) were involved in response to combined drought and heat stresses (Table 3).
In stress-free conditions (Table 3 and Table S7a), the genes coding cytochrome P450 families 1 and 2 involved in the metabolism of xenobiotics by cytochrome P450 and tryptophan metabolism were upregulated in the transgenic plants overexpressing Pvgstu3–3.4 (group 2) as compared to WT (group 1), along with the genes for glucuronosyltransferase involved in both ascorbate and aldarate metabolism, retinol metabolism, porphyrin and chlorophyll metabolism, metabolism of xenobiotics by cytochrome P450 and pentose-glucuronate interconversions. Increased transcript levels coding MAPK, an important signal transduction cascade that responds to an external signal, were shown in the stress-free transgenic Pvgstu3–3.4 plants. More specifically, the dual-specificity MAP kinase phosphatase (MKP), serine/threonine-protein phosphatase 2B catalytic subunit (PPP3C) and protein phosphatase 1B (PP2CB) were upregulated, whereas the mitogen-activated protein kinase 4 (MEKK4) and MEKK2/3 were downregulated. Interestingly, 31 genes involved in the NF-kappa B signaling pathway were differentially expressed in the transgenic plants, with the ubiquitin-conjugating enzyme E2 I (UBC9) BGI_novel_G037382 gene (2.8-fold) (Table S7a) and the interleukin-1 receptor-associated kinase 1/4 (EC:2.7.11.1) coding genes being upregulated even under stress-free conditions. In the arachidonic acid metabolism, the downregulated genes in Pvgstu3–3.4 included those encoding for arachidonate 5-lipoxygenase (EC:1.13.11.34) and arachidonate 15-lipoxygenase (EC:1.13.11.33), whereas leukotriene-B4 20-monooxygenase related genes were upregulated. Gene expression alterations were detected in the linoleic acid metabolism and, more specifically, in the genes encoding for linoleate 9S-lipoxygenase (EC:1.13.11.58), which is also involved in lipid metabolism and was found to be downregulated. In the tryptophan metabolism, the genes encoding for L-amino-acid oxidase (EC:1.4.3.2) and enoyl-CoA hydratase (EC:4.2.1.17) were also downregulated, suggesting a possible reduction in acetyl CoA and, therefore, reduction in the glycolysis rate. In the amino sugar and nucleotide sugar metabolism pathway, the chitinase and N-acetylglucosamine kinase involved in the synthesis of UDP-sugars, which are considered important for biomass production, were upregulated. In the same pathway, genes for the reversibly glycosylated polypeptide, UDP-arabinose 4-epimerase, UDP-glucose 4-epimerase, xylan 1,4-beta-xylosidase and alpha-1,4-galacturonosyltransferase were downregulated. The peroxisome xanthine dehydrogenase/oxidase in purine metabolism, the dehydrogenase/reductase SDR family member 4 in the retinol metabolism along with superoxide dismutase (SOD), Cu-Zn family (EC:1.15.1.1) in the antioxidant system were upregulated. In phenylalanine metabolism, the L-amino-acid oxidase (EC:1.4.3.2) genes also involved in other modules of the amino acid metabolism were downregulated, mainly leading to reduced phenylpyruvate or increased tyrosine through the conversion of phenylalanine. Yet, the 4-coumarate--CoA ligase (EC:6.2.1.12), caffeoyl-CoA O-methyltransferase (EC:2.1.1.104) and cytoplasmic aspartate aminotransferase (EC:2.6.1.1) were upregulated.
Between stress-free WT (group 1) and Pvgstu3–3.4 at 48 h under DT (group 4) (Table 3 and Table S7c), we observed that glutathione S-transferase (EC:2.5.1.18) and glucuronosyltransferase (EC:2.4.1.17) genes were upregulated in the metabolism of xenobiotics by cytochrome P450 pathway. Furthermore, in the starch and sucrose metabolism, the sucrose-phosphate synthase (EC:2.4.1.14), beta-glucosidase (EC:3.2.1.21), isoamylase (EC:3.2.1.68) and alpha-trehalase (EC:3.2.1.28) were upregulated along with alpha-amylase (EC:3.2.1.1) (increased maltose) and maltooligosyl trehalose trehalohydrolase (EC:3.2.1.141), whereas only glycogen phosphorylase and trehalose 6-phosphate synthase were downregulated. Moreover, in the glycolysis/gluconeogenesis pathway, the glucose-6-phosphate 1-epimerase, fructose-1,6-bisphosphatase I and 6-phosphofructokinase 1 were upregulated, indicating a possible increase in pyruvate and along with the upregulated pyruvate dehydrogenase E1 component, acetyl-CoA synthetase and isocitrate dehydrogenase (NAD + ) in the TCA cycle, they may contribute to the protective role against oxidative stress. It is also interesting that for the hexokinase fructose-bisphosphate aldolase, both up- (BGI_novel_G016405 (3.1-fold)) and downregulated (BGI_novel_G016404 (−2.9-fold), BGI_novel_G016402 (−1.9-fold)) (Table S7c) genes were observed, indicating possible perturbations in the production of fructose in Pvgstu3–3.4 after 48 h under combined DT stress compared to the WT plants. Regarding the tryptophan metabolism pathway, amidase was also involved in the arginine and proline metabolism, and phenylalanine metabolism was upregulated. Additionally, genes encoding for acetyl-CoA C-acetyltransferase (EC:2.3.1.9), also implicated in other pathways, such as fatty acid degradation, valine, leucine and isoleucine degradation, lysine degradation and tryptophan metabolism, were downregulated. Interestingly, shikimate kinase (EC:2.7.1.71) was upregulated along with the anthranilate phosphoribosyltransferase (EC:2.4.2.18) and indole-3-glycerol phosphate (IGP) [4.1.1.48] in the tryptophan biosynthetic pathway, indicating a potential role in the tryptophan-independent IAA de novo biosynthetic pathway. Several genes in the AMPK signaling pathway encoding for the 5′-AMP-activated protein kinase, catalytic alpha subunit (EC:2.7.11.11) were upregulated as a result of the upregulated genes of calcium/calmodulin-dependent protein kinase 2 (EC:2.7.11.17), serine/threonine-protein phosphatase 2A catalytic subunit (EC:3.1.3.16), acetyl-CoA carboxylase/biotin carboxylase 1 and MFS transporter (facilitated glucose transporter). The increased regulation of these genes possibly led to the upregulation of fructose-1,6-bisphosphatase I (EC:3.1.3.11), 6-phosphofructokinase 1 (PFK1) (EC:2.7.1.11) and 6-phosphofructo-2-kinase/fructose-2,6-biphosphatase 1 (EC:2.7.1.105/3.1.3.46], which are related to the glycolysis/gluconeogenesis pathway. Notably, genes related to the biosynthesis of amino acids, such as proline biosynthesis in arginine and proline metabolism, valine, leucine and isoleucine biosynthesis, cysteine and methionine metabolism and histidine metabolism were induced in response to DT treatment at 48 h in the Pvgstu3–3.4 plants.
To further understand the combined DT effect on the transcriptome of the Pvgstu3–3.4 transgenic line, we compared the transgenic control plants (group 2) against the transgenic plants under combined DT (group 4), which revealed significant alterations in the regulation of several genes involved in different metabolic pathways (Table 3 and Table S7d). Among the metabolic pathways, carbon metabolism was largely enriched under DT conditions in Pvgstu3–3.4 plants. Genes coding 6-phosphofructokinase 1 (EC:2.7.1.11), fructose-1,6-bisphosphatase I (EC:3.1.3.11), phosphoribulokinase (EC:2.7.1.19), ribose 5-phosphate isomerase A (EC:5.3.1.6), ribulose-phosphate 3-epimerase (EC:5.1.3.1) being involved in pentose phosphate cycle and Calvin cycle were upregulated. Additionally, genes coding pyruvate kinase (EC:2.7.1.40), phosphoglycerate kinase (EC:2.7.2.3) and glyceraldehyde 3-phosphate dehydrogenase (EC:1.2.1.12) involved in glycolysis (Embden–Meyerhof pathway) for the conversion of glucose to pyruvate were also upregulated. However, the hexokinase (EC:2.7.1.3) and fructose-bisphosphate aldolase, class I (EC:4.1.2.13) involved genes were downregulated, and fructose-1,6-bisphosphatase I (FBP) (EC:3.1.3.11), fructose-2,6-bisphosphatase (EC:3.1.3.46), GDP-L-fucose synthase (EC:1.1.1.271) and fucokinase (EC:2.7.1.52) were upregulated. Another important metabolic pathway implicated in stress-tolerance is starch and sucrose metabolism, in which we observed that the genes encoding for maltase-glucoamylase were upregulated (participating in fructose biosynthesis), as well as those of beta-glucosidase and maltase-glucoamylase, leading to glucose biosynthesis and alpha-amylase leading to enhanced maltose biosynthesis. In the glycolysis/gluconeogenesis pathway, genes coding pyruvate oxidation, such as aldehyde dehydrogenase (NAD(P) + ) (EC:1.2.1.5), among others, were also mainly upregulated. In addition, the upregulation of pyruvate kinase implicated not only in glycolysis/gluconeogenesis but also in pyruvate metabolism may lead to increased pyruvate. In parallel, the upregulation of glycerate dehydrogenase and hydroxypyruvate reductase in glycine, serine and threonine metabolism could also enhance pyruvate production. At the same pathway, the gene encoding tryptophan synthase alpha chain, along with genes in the tryptophan metabolism, were upregulated, leading to tryptophan production.
Biosynthesis of amino acids was also strongly induced under DT stress; the glutamate family pathway was upregulated under stress, such as the glutamate 5-kinase and glutamate-5-semialdehyde dehydrogenase related gene BGI_novel_G018845 (2.1-fold increase) and pyrroline-5-carboxylate reductase BGI_novel_G038528 gene (1.3-fold increase), leading to the accumulation of the compatible osmolyte, proline (Table S7d). Upregulation of the pyruvate family pathway genes (BGI_novel_G023627 (2.9-fold increase), BGI_novel_G004872 (1.1-fold increase)) and enhanced production and accumulation of alanine, and the branched-chain amino acids, isoleucine, leucine and valine (BGI_novel_G019491 (6.9-fold), BGI_novel_G019481 (4.4-fold), BGI_novel_G002984 (3.5-fold), BGI_novel_G019480 (3.1-fold), BGI_novel_G002987 (3.0-fold), BGI_novel_G018935 (2.9-fold), BGI_novel_G020821 (2.5-fold), BGI_novel_G014739 (1.8-fold) and BGI_novel_G025500 (2.4-fold)) (Table S7d), which under stress function as compatible solutes may provide an alternative source of respiratory substrates. However, genes related to the aspartate family pathway, essential for generating energy mainly via lysine catabolism, appeared to be either upregulated, such as BGI_novel_G012015 (3.6-fold) BGI_novel_G007764 (1.8-fold) and BGI_novel_G029903 (1.5-fold) or downregulated, such as BGI_novel_G007765 (−1.2-fold) and BGI_novel_G025320 (−3.6-fold) (Table S7d). In the arginine biosynthesis and alanine, aspartate and glutamate metabolism pathways, the glutamine synthetase (EC:6.3.1.2), alanine transaminase (EC:2.6.1.2) and cytoplasmic aspartate aminotransferase (EC:2.6.1.1) related transcripts were upregulated, leading to an increase in arginine and alanine, which may lead to fumarate involved in the citrate cycle (TCA cycle).
This was confirmed by the induction of TCA cycle metabolism-related genes involved in the second carbon oxidation cycle, methylaspartate cycle and pyruvate oxidation which were upregulated. In the photorespiration metabolism gene expression was upregulated between 7.8- and 1-fold (BGI_novel_G002321 (7.8-fold), BGI_novel_G004953 (5.3) coding for glycine dehydrogenase (EC:1.4.4.2), BGI_novel_G035362 (3.4-fold), BGI_novel_G006553 (2.8-fold), BGI_novel_G035361 (2.6-fold), BGI_novel_G001601 (2.1-fold) and BGI_novel_G028763 (1.1-fold)) (Table S7d) compared to the control conditions. It is also worth mentioning that the genes involved in the generation of acetyl coenzyme A (acetyl-CoA) pools were also upregulated under DT conditions. The endocytosis mechanism required for nutrient uptake and signaling transduction was largely affected under DT conditions, with a large number of genes being upregulated. ATP-binding cassette (ABC) transporters were mainly upregulated. In addition, genes encoding for antioxidant enzymes, such as superoxide dismutase (SOD) (BGI_novel_G028763 (1.1-fold)) and Catalase (CAT) (BGI_novel_G028808 (2.7-fold), BGI_novel_G009557 (1.8-fold), BGI_novel_G029941 (1.3-fold) and BGI_novel_G004146 (1.3-fold)) (Table S7d) were overexpressed in the peroxisome. In the linoleic acid pathway, the BGI_novel_G023971 gene encoding secretory phospholipase A2 (EC:3.1.1.4), which is involved in lecithin production, was 2.6-fold upregulated in the DT combined stress treatment (Table S7d). In the metabolism of xenobiotics by cytochrome P450, glutathione S-transferase (GST) (EC:2.5.1.18), aldehyde dehydrogenase (NAD(P) + ) (EC:1.2.1.5) and glucuronosyltransferase (EC:2.4.1.17) and carbonyl reductase 1 (EC:1.1.1.184) were upregulated at 48 h under combined DT stresses.
The DEGs involved in transcriptional regulation were surveyed to investigate the role of Pvgstu3–3.4 overexpression in response to combined DT stress. Major transcription factors involved the NAC, MYB, ERF, bZIP, WRKY and HSP types (Table 4). Among the DEGs, a total of 2918 TFs grouped into 56 families were identified. In total, 218 were upregulated, and 210 downregulated in Pvgstu3–3.4 under control conditions compared to the WT plants. At 48 h under DT stress, the TFs in Pvgstu3–3.4 increased to 463 up- and 445 downregulated, compared to WT under control conditions. However, we observed a higher activity in the TFs of Pvgstu3–3.4 under DT conditions against stress-free conditions (816 up- and 766 downregulated). In general, the number of TFs increased in accordance with the length of exposure to DT conditions (48 h >8 h under DT > stress-free conditions). The most abundant and active TFs were the MYB, mTERF, MYB-related, AP2-EREBP, and NAC families (Table 4). However, other stress-related TFs were among the top 15 TF families, such as the FAR1, MADS, AP2-EREBP, NAC, Trihelix, ARF, HSF, ARR-B, WRKY, bZIP, SBP and Sigma70-like (Table 4). Interestingly, DEGs from the MYB, MYB-related, AP2-EREBP, NAC, HSF and WRKY TF families were expressed even under nonstress conditions and were increased in Pvgstu3–3.4 plants after exposure to a combination of DT stress.

2.4. Changes in the Metabolome

The increased stress-tolerance of Pvgstu3–3.4 to drought and high temperatures was investigated further through the metabolic changes under control and combined stress conditions on day nine for investigating stress response and plant acclimation under these conditions. Plants overexpressing the Pvgstu3–3.4 upregulated the central metabolism, as levels of sugars, amino acids and TCA cycle intermediates were in general increased. We identified a total of 50 (Supplementary Table S6) polar metabolites, which correspond to soluble sugars (9), soluble alcohols (5), organic acids (8), amino acids (20) and other compounds (7) (Figure 6; Supplementary Tables S5 and S6). Significant alterations in the metabolites between Pvgstu3–3.4 and WT plants under control and combined stress conditions were observed due to genotypic (66%), treatment (80%) and treatment × genotype interaction (60%) effects, respectively.
Overexpression of the Pvgstu3–3.4 had a significant effect on the metabolic profile of transgenic plants under nonstressed conditions as indicated by the 23 out of 50 metabolites being significantly different from the WT plants, 20 of which were downregulated and only three were upregulated (Table 4; Figure 6). The metabolites that were downregulated were mainly soluble sugars (five), such as sucrose, fructose and glucose, amino acids (nine), such as valine, proline, oxoproline, the soluble alcohols mannitol, sorbitol and myo-inositol and the organic acids malic and glyceric acid.
The effect of severe combined DT stress on the WT plants induced significant alterations in 30 out of the 50 metabolites, of which 28 were upregulated, and sucrose and myo-inositol were downregulated compared to the stress-free plants (Table S6). Soluble sugars, such as galactose and fructose were greatly increased (approximately 700- and 10-fold respectively), along with organic acids, such as 2-oxoglutaric acid and the TCA cycle intermediate citric acid (160- and 46-fold respectively) and amino acids, such as valine, isoleucine, proline (249-fold) and oxoproline (116-fold), lysine (523-fold) and tryptophan (93.7-fold).
The metabolic response of the Pvgstu3–3.4 plants revealed that more metabolites (37) were significantly altered in comparison to WT plants under combined drought and heat (DT) stress treatment (Figure 7; Table S6). Pvgstu3–3.4 plants upregulated 36 metabolites, of which 9 were soluble sugars (mainly mannose-6-deoxy, sucrose, galactose, glucose, fructose), four soluble alcohols (mainly mannitol, sorbitol), five organic acids (such as glyceric, 2-oxoglutaric and malic acids) and 14 amino acids (mainly proline and oxoproline) and downregulated only nicotine. Further comparison showed that 16 metabolites are unique to Pvgstu3–3.4 under stress combination, including the compatible solute mannitol involved in osmoregulation and sugars, such as sucrose mannose-6-deoxy and erythrose (Figure 7; Table S6).
The 14 metabolites that contributed to the distinction between Pvgstu3–3.4 and wild type plants under combined DT stress conditions were mainly upregulated, 4 of which were soluble sugars (fructose, glucose, sucrose and xylose), 2 were soluble alcohols, including sorbitol (2.1-fold) and myo-inositol (2.9-fold), threonic organic acid and amino acids, including arginine (20.5-fold), glycine (3.2-fold), tyrosine (2.2-fold) and proline (1.3-fold) (Table 5).

3. Discussion

The effect of combined abiotic stresses on plant responses remains elusive, despite the importance of developing crops able to acclimate and be productive in a rapidly changing environment [6]. Studies on combinations of drought and heat stresses have revealed that physiological and molecular responses of plants subjected to combined stress are different from that of the single stresses [5,10]. GSTs are key antioxidant enzymes that can be induced by diverse environmental stimuli [15]. Overexpressing gst genes in plants has elucidated their role in response mechanisms contributing to abiotic stress tolerance [15]. Up to date, the role of gst genes from the common bean and, in particular, the EU PGI variety of “Plake Megalosperma Prespon” has not yet been investigated. In this work, we have used two genes, isolated from leaves (Pvgstu2–2) and roots (Pvgstu3–3) of P. vulgaris L., for their high antioxidant catalytic function [21,33]. Our results show that overexpression of both Pvgstu genes in tobacco enhances plant tolerance to single heat stress and the Pvgstu3–3.4 to a combination of heat and drought stress. The metabolic and whole-genome transcript profiling identified stress-induced pathways that possibly contribute to plants’ performance under stress conditions.
A single or combined abiotic stress response in plants involves changes in morphological, physiological and biochemical properties [2]. Underwater limitation, the leaf fresh and dry weights are significantly reduced [37], and low photosynthetic rate and reduced turgor pressure restrict leaf extension [38]. Herein, the combined stress treatment was more severe compared to single stress effects, and Pvgstu3–3.4 was more tolerant compared to Pvgstu2–2.19 and WT plants. We observed a similar morpho-physiological response pattern between Pvgstu3–3.4 and WT plants in nine days under single drought and combined DT stress, manifested as a reduction in MF under single D and DT stresses and loss of leaves under severe DT stress. However, the differentiated response was the maintenance of root length in Pvgstu3–3.4 even under combined DT stress compared to a severe approximately 54% reduction observed in WT plants. Growth response after 16 days in single heat stress (T) was also greater in Pvgstu3–3.4, showing increased root length and MF, but we did not observe any significant differences between genotypes under single drought stress (D). This may indicate that either the duration of drought did not trigger any responses or that oriental tobacco cv Basmas Xanthi may have acquired acclimation over time as it is a variety cultivated in drought-prone areas. These results support the observations from previous studies, which have demonstrated an increase in the growth of plants overexpressing GSTs under salt stress [27,39,40]. It is worth mentioning that when severe DT treatment induced significant wilting on day 9 (mid-harvest), plants were re-watered but remained under heat stress to assess whether the wilting was associated with drought or heat stress, given that plants under single D or T stresses did not show any significant wilting. All plants effectively recovered compared to the DT plants on day 16 for all transgenic and WT plants indicating that despite the non-significant effect of single drought treatment on the morphological parameters, it showed a predominant negative effect over heat stress when the stresses were combined (DT). Similar results were observed in tomatoes under individual heat and drought and their combination [41]. Pvgstu3–3.4 increased photosynthetic efficiency as an early response to single heat (T) and drought (D) stresses after 16 days compared to WT plants. Interestingly, the Pvgstu2–2.19 transgenic line also showed a greater maximum quantum yield of PSII under single drought stress (D) compared to WT. Studies have shown that reduction in photosynthetic activity is a common response to single heat and drought stresses; nevertheless, photosynthesis is less affected by heat stress, and only temperatures over 40 °C are known to have a detrimental effect [10]. Similarly, heat stress did not reduce the photosynthetic activity of tobacco plants, but drought stress and combined heat and drought stress led to more than 80% reduction in photosynthetic activity [4]. Herein, combined DT stress led to a significant reduction in photosynthetic activity on day 9, and no measurements were able to be performed on day 16 due to extensive wilting for both transgenic lines and WT plants.
The morphophysiological results indicate the contribution of Pvgstu3–3.4 overexpression to possible thermotolerance, expressed as greater plant performance under heat stress and higher leaf number under combined DT stress compared to WT. Overexpression of HSPs in tobacco plants has led to increased tolerance to heat stress [42]. Thus, far, there are limited reports on GSTs contribution to thermo-tolerance, despite the evidence for cold-induced GSTs demonstrated in Brassica oleracea [43], Cucurbita maxima [44], overexpression in Arabidopsis [45] and in rice [46], whereas in transgenic tobacco [47] resulted in enhanced tolerance to high temperature. The combined treatment effect was too severe for the photosynthetic capacity of both transgenic lines and WT plants after 16 days of combined drought and heat (DT) stress. Similar results were observed in transgenic tobacco plants subjected to short-term (5 days) drought and one additional day of heat stress, where it was shown that single heat stress alone did not affect the plants significantly but intensified the effect of drought when combined [24].
We then proceeded with analyzing the molecular alteration that occurred in the Pvgstu3–3.4 transgenic plants under control and combined DT conditions in comparison to WT under control conditions aiming at investigating the molecular mechanism underlying the stress-tolerance phenotype of the transgenic plants. Thus, we analyzed, through next-generation sequencing, the entire transcriptome of the Pvgstu3–3.4 and WT plants under control and combined DT conditions. The comparison between the WT plants and Pvgstu3–3.4 under stress-free conditions revealed significant changes in the transcription profile of Pvgstu3–3.4 even before the application of the stress. More specifically, the comparison of WT and transgenic tobacco plants overexpressing Pvgstu3–3.4, prior to the application of concurrent DT stress, indicated that in the metabolism of xenobiotics by cytochrome P450 pathway, the gene encoding cytochrome P450 family 1 (which is an uncharacterized monooxygenase) is overexpressed in the GST plants, and this gene is also involved in tryptophan metabolism. This is in accordance with [48], where the overexpression of a P450 (CYP) 714 protein family monooxygenase in rice provided enhanced tolerance to salt stress. The NF-kappa B signaling pathway has been shown to be implicated in drought response [49]; herein, the 2.8-fold upregulated ubiquitin-conjugating enzyme E2 I (UBC9) genes in the Pvgstu3–3.4 have been previously reported to play an important role in plant response to heat [50] and drought [51,52] stresses. Furthermore, gene expression alterations were detected in the linoleic acid metabolic pathway and, more specifically, the gene encoding linoleate 9S-lipoxygenase that can use linoleic acid or linolenic acid as substrates. Plant lipoxygenases are considered to play a role in plant physiology like growth and development, as well as in pest resistance and senescence or response to wounding. In Arabidopsis thaliana seedlings, treatment with 9-Hydroxyoctadecatrienoic acid (the byproduct of lipoxygenase action) resulted in a reduction in lateral roots and activated events common to developmental and defense responses. Yet, the downregulation of the gene may suggest that the overexpression of the Pvgstu3–3.4 compensates the action of this lipoxygenase, at least with regards to stress-tolerance [53]. The acylglycerol lipase gene was also found to be upregulated in the glycerolipid metabolism, suggesting an increase in glycerol, which is the backbone of triacylglycerols. In A. thaliana, under heat stress, an increase in triacylglycerol levels was observed, which operates as an intermediate of lipid turnover, and results in a decrease in membrane polyunsaturated fatty acids [54]. The gene for phospholipase D1/2 in the phospholipase D signaling pathway was downregulated, which may lead to reduced cell proliferation and differentiation. This finding is in accordance with Distéfano et al. [55], showing that phospholipase D1/2 mutants may behave as drought-primed, leading to their tolerance under severe drought stress. The above results suggest that the Pvgstu3–3.4 transgenic plants may be in a stress-tolerant primed condition.
Regarding the changes in transcriptomes between stress-free WT plants and transgenic Pvgstu3–3.4 under DT at 48 h, we observed that glutathione S-transferase and glucuronosyltransferase genes were upregulated in the metabolism of xenobiotics by the cytochrome P450 pathway in the transgenic plants. This is not surprising as the combined DT stress is severe and possibly triggers a plant response through activating the detoxification systems like GST and P450, which play a prominent role in the crosstalk between abiotic stress responses [56]. The involvement of GSTs in stress-tolerance is well documented [18,27,57,58,59,60,61,62,63,64]. Comparison between the stress-free and combined DT stress conditions after 48 h in the transgenic line Pvgstu3–3.4 showed that similar to the stress-free condition, genes encoding enzymes in the metabolism of xenobiotics by cytochrome P450, such as GST and glucuronosyltransferase, as well as SOD and Catalase, were found to be upregulated in Pvgstu3–3.4 plants after 48 h of stress-induction. SOD and CAT enzymes are well-known enzymes involved in the detoxification of organisms from ROS [65,66,67]. This may be due to the severity of the combined stress, suggesting that GST overexpression on its own may not be capable of detoxifying the plant and thus, an increase in other detoxification enzymes is required. Under DT stress, the Pvgstu3–3.4 showed enhanced carbon metabolism, despite being considered to be affected by water limitation and increased temperatures [68]. Adaptation in primary metabolic pathways, such as the TCA cycle, may contribute to the protective role against oxidative stress through maintaining C/N balance by converting glutamate in the cytosol to succinate and by generating NADH and succinate [69], as it was observed in the Pvgstu3–3.4 plants under DT conditions.
An increase in the expression of genes in the photorespiration pathway was observed under DT conditions, which is considered to protect photosynthesis from photoinhibition and prevent ROS accumulation in leaves [70], indicating preservation of the photosynthetic efficiency under the concurrent occurrence of drought and heat stress. In the fructose and mannose metabolism, as well as glycolysis/gluconeogenesis pathways, the 6-phosphofructokinase 1 (PFK1) coordinating the photosynthetic carbon flow into sucrose and starch biosynthesis [71] was upregulated in Pvgstu3–3.4 under DT at 48 h. Another enzyme involved not only in glycolysis/gluconeogenesis but also in pyruvate metabolism responsible for increased pyruvate is pyruvate kinase, which was increased in Pvgstu3–3.4 line under combined DT treatment. Pyruvate kinase has been found to be increased during mild stress [72] and during heat stress in fungus Metarhizium robertsii as the first line of defense [73]. The conversion of pyruvate to acetyl-CoA in the chloroplasts is the start of the fatty acid biosynthesis, such as Triacylglycerol (TAG), which are linked to plant stress response (Lu et al. 2020). Herein, the genes involved in the generation of acetyl-CoA, the key intermediate in a number of different metabolic pathways (Oliver et al. 2009), were upregulated under DT conditions in the Pvgstu3–3.4 plants.
The ATP-binding cassette (ABC) transporters, which among others are involved in the detoxification process, transport of the phytohormones auxin and abscisic acid and maintaining homeostasis under abiotic stresses (Dajuja et al. 2020), herein were upregulated under DT conditions (48 h) in Pvgstu3–3.4. Similarly, the indole-3-glycerol phosphate (IGP) of the tryptophan (Trp) biosynthetic pathway was upregulated, which may play a central role in the Trp-independent IAA de novo biosynthetic pathway as it was previously shown in A. thaliana [74] and therefore, in signal transduction pathway under stress conditions [75]. Soluble sugars were highly sensitive to environmental stresses and, most importantly, sucrose and hexoses, which are involved not only in the regulation of growth-related genes but also in downregulation of stress-related genes as reviewed by Rosa et al. [76], suggesting again that the plant may be in a primed condition due to the overexpression of a Pvgstu3–3.4. The same applies to the maltase-glucoamylase, which was upregulated under DT conditions in Pvgstu3–3.4 transgenic plants, suggesting increased biosynthesis of fructose and beta-glucosidase and maltase-glucoamylase leading to glucose biosynthesis; in addition, alpha-amylase was also upregulated, potentially leading to enhanced maltose biosynthesis [76].
Transcription factors (TFs) are key regulators of signal transduction and gene expression by modulating essential aspects of plant function, including plant adaptation to adverse environments [77,78,79]. The early expression of MYB, MYB-related, AP2-EREBP, NAC, HSF, and WRKY TF families in Pvgstu3–3.4 plants even in stress-free conditions and their increase under DT stress-indicate that the Pvgstu3–3.4 transgenic plants were in a primed condition prior to the induction DT stress. The MYB TFs are known to be involved in the transcriptional control of physiological and biochemical processes, including plant development, cell fate determination, and secondary metabolism along with mediating abiotic stress responses [78,80], such as during heat stress in eggplant [81] or combined heat and drought stress in soybean [82]. Ethylene-responsive element-binding protein (AP2-EREBP) TF family is involved in the biotic and abiotic stress response via the Jasmonic acid pathway and ABA biosynthetic pathway, respectively [83] and have been shown to be involved in early-stage drought stress responses [84,85,86]. NAC TFs are also involved in both abiotic and biotic stress responses [78], and herein they were both presents in stress-free conditions and to a greater extent under DT stress. Heat shock transcription factors (HSF) exert a central regulatory role in alleviating the negative effects of not only high temperature [87,88] but also drought and salt stress [87]. The WRKY family is a key component of pathways, such as carbohydrate synthesis, senescence, development, and secondary metabolites synthesis and also of the plant–pathogen interaction pathway [89]. Herein, despite being mainly downregulated under increased exposure to DT stress, confirming the negative effect of temperature stress on WRKY genes expression as an energy maintenance mechanism [88], they were also present under stress-free conditions in Pvgstu3–3.4 plants, which could be related to the biotic induced nature of the Pvgstu3–3.4 gene. Other stress-related TFs were among the top 15 TF families expressed under DT stress in Pvgstu3–3.4, such as the FAR- RED-IMPAIRED RESPONSE1 (FAR1), MADS, Trihelix, ARF, ARR-B, SBP, bZIP and Sigma70-like. FAR1 directly facilitates the light-induced inositol biosynthesis, which would otherwise be produced indirectly via photosynthesis, and suppress light-induced oxidative stress [90], indicating that FAR1 TFs may have played a protective role in the photosynthetic capacity of the Pvgstu3–3.4 plants under DT stress. Another TF family involved in light response mechanisms is the Trihelix family, which also involves responses to salt and pathogen stresses [91], cold and salt stresses [92] and salt, freezing and drought stress [93]. Auxin response factors (AFR) have been characterized as regulators of the auxin role in tomato response to high salinity and water deficit [94], which may be associated with the enhanced transcription of indole-3-glycerol phosphate (IGP) in the tryptophan (Trp) biosynthetic pathway and the Trp-independent IAA de novo biosynthetic pathway observed in the Pvgstu3–3.4 plants. Basic leucine zipper (bZIP) TFs have significant roles in the regulation of ABA-related signaling pathways [77] and are involved in abiotic stresses, such as drought, salinity, and heat stress [95]. Interestingly, a root-specific bZIP identified in both the drought-resistant tepary bean (Phaseolus acutifolius) and drought-sensitive common bean was shown to be responsive to water deficit stress possibly by coordinating gene expression [96], considering that root phenology/physiology is an essential component in P. vulgaris for performance under drought stress [97,98,99]. The significant upregulation of the Type B ARR TF family only under DT conditions in Pvgstu3–3.4 plants indicates the involvement of cytokinin signaling in response to DT stress, which in conjunction with other phytohormones at different regulatory layers [100], may be involved in the signal transduction under the combined DT stress. Similarly, Sigma70- like TFs were also upregulated under DT conditions in Pvgstu3–3.4, which confirms their role as potential regulators of plant responses to various abiotic stress conditions [101].
By increasing the accumulation of compatible solutes, metabolic acclimation is considered a key mechanism for the protection and survival of plants under abiotic stresses. The metabolic analysis showed that overexpression of Pvgstu3–3.4 might have a signaling role that was mainly stimulated under stress conditions in order to increase specific metabolites and activate the protective mechanisms, while metabolites, such as proline, oxoproline, mannitol, and sorbitol, malic acid and soluble sugars were downregulated in stress-free conditions. The accumulation of a wide range of metabolites, such as soluble sugars and amino acids, can enhance abiotic stress-tolerance and restore homeostasis [102,103]. Pvgstu3–3.4 line under combined heat and drought stress has demonstrated a distinct protective effect to the plant homeostatic mechanism by upregulating metabolites, such as the compatible solute mannitol involved in osmoregulation and sugars like sucrose and mannose-6-deoxy, a cellular redox regulator and precursor of ascorbic acid, sorbitol, malic acid and aspartic acid. The osmoprotectant mannitol was differentially increased in the Pvgstu3–3.4 plants in response to combined DT stress, but not in the WT plants. Mannitol, like other polyols, has been shown to protect membranes and enzyme complexes from ROS mainly through the glutathione–ascorbate cycle or cell signaling pathways during stress [104]. The expression of mannitol-1-phosphatedehydrogenase (mtlD) and the accumulation of mannitol in the chloroplast enhanced tolerance of transplastomic tobacco plants to oxidative stress [105]. However, transgenic tobacco plants overexpressing a GmGSTU4 decreased mannitol concentration under salinity stress. The observed increase in myo-inositol in Pvgstu3–3.4 compared to WT plants under combined stress treatment also has been shown to be accumulated under most of the abiotic stresses and is considered to contribute as a compatible solute to stress-tolerance [106].
Sorbitol is a photosynthetic compound produced in mature leaves and, along with sucrose, both translocate carbon and energy between sources and sink organs. Sorbitol content has been shown to increase in response to drought stress in Arabidopsis [107] and tobacco [108]. Accumulation of the osmoprotectant proline is also positively correlated with drought and salinity tolerance [18]. Increased accumulation of proline and sorbitol was observed by Kissoudis et al. [109] in tobacco plants overexpressing a GmGSTU4 under salinity stress. Overexpression of a GST gene from the halophyte Limonium bicolor also enhanced proline accumulation in tobacco plants under salt stress [39]. In contrast to our results, drought-induced proline did not accumulate under combined drought and heat stress in Arabidopsis and soluble sugars, such as sucrose, maltose and gulose, were increased instead [5], suggesting that during the combination of drought and heat stress, sugars replace proline in plants and functions as major osmoprotectants [110] to avoid proline toxicity in the mitochondria [5]. However, the involvement of proline in the protection of plants against combined drought and heat stress has been recently demonstrated [111]. The results of this study indicate a distinct protective role of Pvgstu3–3.4 to the plants’ homeostatic mechanisms under combined drought and heat stress. The significant, but moderate increase in proline (1.3-fold) and the greater accumulation of sugars (5.3- and 4-fold sucrose and glucose, respectively) identified herein, may be, in fact, maintaining the turgor pressure against osmotic stress and mitigating the negative effects of oxidative stress contributing to the stabilization of the photosystem II complex [112] and restore energy homeostasis [113].
Plant acclimation and maintenance of yield in response to combined abiotic stresses require the activation of multiple signaling pathways to regulate stress-inducible genes involved in stress-tolerance [114]. Previously, novel biotic-stress-inducible Pvgstu3–3.4 has been isolated from roots and herbicide induced Pvgstu2–2 from the leaves of P. vulgaris. Herein, the morphophysiological results showed potential thermotolerance of the transgenic lines overexpressing the Pvgstu genes, with the Pvgstu3–3.4 also showing enhanced tolerance to the combination of drought and heat stress. This effect was further investigated by the transcriptomic and metabolic profile of Pvgstu3–3.4 plants subjected to combined drought and heat stresses, exhibiting a unique acclimation response. The greater number of differentially expressed genes, specifically altered during combined DT stress, is in accordance with the results of [6] that the transcripts tend to be greater in number under combined abiotic stresses. Enzymes, such as GSTs, CAT and SOD, were overexpressed in the transgenic plants along with other enzymes involved in plant tolerance mechanisms. The enhanced early protective response of Pvgstu3–3.4 to combined heat and drought stress as a result of the upregulation of central metabolism, as levels of sugars, amino acids and TCA cycle intermediates were generally increased. Regulation of certain genes and the accumulation of specific metabolites indicates that the transgenic plants were probably in a stress-primed condition. The overexpression of Pvgstu3–3 may also play a signaling role in the plant that is mainly stimulated under severe stress in order to increase specific metabolites and activate the protective mechanisms. Aside from the protective role of Pvgstu3–3 attributed to the observed increased metabolism levels, the interaction of Pvgstu3–3 with the secondary metabolites could be partially attributed to the ligandin functions that several GST show [115,116]. However, further research is required to determine if any ligand-binding interactions exist for this particular GST isoenzyme.
Recently, Zandalinas et al. [11] demonstrated that plants subjected to stress combination could integrate different systemic signals and the most efficient manner in which plants perceive the different stresses is when the signals of the two stresses originate from distant parts of the plant. Similarly, under heat and drought combination, the signals originate from different parts of the plant, i.e., above- and below-ground, respectively, and based on the results presented herein, different systemic signaling pathways were activated, possibly inducing an acclimation process [117]. Major components of the regulatory networks are shared between abiotic and biotic stress signaling [118,119], including the production of ROS [120,121], calcium fluxes [122], transcription factors [78], growth regulators [123] and mitogen-activated protein kinase (MAPK) cascades [123]. Moreover, redox state, as well as metabolic compounds, have a major role in post-translational modifications, regulating the activity of target proteins and transcription factors [119]. Transcription factors, such as WRKY, MYB, ERF, NAC, bZIP and HSF that were also identified in the transgenic Pvgstu3–3 under DT stress are involved in the regulation of stress crosstalk and are considered to have similar induction patterns across various abiotic and biotic stresses [78]. In this study, we showed how a biotic-inducible Pvgstu3–3 could activate early protective response mechanisms under a combination of drought and heat stress. Such response involved complex crosstalk among different regulatory levels, including adjustment of metabolism and gene expression for biochemical and molecular adaptation.

4. Materials and Methods

4.1. Plasmid Constructs and Agrobacterium-Mediated Transformation

The Pvgstu2–2 and Pvgstu3–3 genes were isolated from two different parts of the P. vulgaris var. Plake Megalosperma Prespon (Florinas) of protected geographic indication (PGI) due to their induced expression in the different organs, i.e., in the leaves (Pvgstu2–2) after herbicide application and the roots (Pvgstu3–3) after exposure to biotic factor [17,26], respectively. Standard recombinant methods were implemented for the development of plasmid constructs after ligation into a pART27 expression vector. Ligase reactions were performed according to the New England Biolabs protocol. Primers used in PCR were for the Pvgstu2–2, the forward 5′-GAGCTACTGCAAAGCCCTTTGTTTG-3′ and the reverse 5-′CATTAGAATGAACCGAAACCGGCGG-3′, while for the Pvgstu3–3 the 5′-GAGAGCTCGAAAGTGAGGGTATTGGG-3′ and 5′-CATTAGAATGAACCGAAACCGGCGG-3′.
The resulting expression constructs (pART27-Pvgstu2–2 and pART27-Pvgstu3–3) were used to transform competent E. coli cells (strain Μach 1). The plasmid DNA of the verified positive clones was isolated with the PureLink ™ Quick plasmid miniprep kit (Invitrogen, Carlsbad, CA, USA). Plasmid pART27-Pvgstu2–2 was digested with EcoRI and BamHI, while pART27-Pvgstu3–3 was digested with HindIII. The same restriction enzyme reactions were performed on the pART27-gstu4 vector [124] used as a negative control. Reactions were performed in a 10 μL final volume mixture containing 1X restriction enzyme buffer, 180 ng μL plasmid DNA, 20 U μL EcoRI HF and BamHI or HindIII HF (New England Biolabs, Ipswich, MA, USA) and were incubated at 37 °C for 60 min. The products of the digestion reactions were electrophoresed on 1% (w/v) agarose gels in TBE solution. The selected clones were sequenced, and the analysis of the results was performed with the SeqMan Pro program. Positive colonies were amplified in liquid cultures followed by isolation of the plasmid DNA with the PureLink ™ Quick Plasmid Miniprep (Invitrogen, Carlsbad, CA, USA) kit and were cloned into Agrobacterium tumefaciens cells (strain GV3101) using the electroporation method.
Agrobacterium-mediated transformation was used to develop transgenic tobacco (cv. Basmas Xanthi) lines overexpressing the Pvgstu3–3 and Pvgstu2–2 genes. The co-cultivation phase involved the growth of A. tumefaciens in 5 mL liquid LB substrate supplemented with kanamycin (20 mg L−1), spectinomycin (100 mg L−1) and gentamicin (50 mg L−1) at 28 °C in a shaking incubator (1035 g) for 3 days, in order to select for bacteria carrying the modified plasmids pART27-Pvgstu2–2 and pART27-Pvgstu3–3. Following centrifugation at 11,200 g for 5 min, the bacterial cells and tobacco leaf discs (~1 cm2 diameter) were placed in MS supplemented with 0.1 mg L−1 ΝΑΑ and 1 mg L−1 BAP (MSR1) at 28 °C in a shaking incubator (1035 g) for 30 min. For the regeneration, the leaf discs were transferred in the selection media (MSR1 supplemented with 50 mg L−1 kanamycin + 250 mg L−1 cefotaxime).

4.2. Verification of Putative Transgenic Lines, Relative Expression of the 35S-Pvgstu2–2 and -Pvgstu3–3 and Enzymatic Activity

Genomic DNA from the putative transgenic T0 lines of Pvgstu3–3 (10 independent lines) and Pvgstu2–2 (21 independent lines) was isolated using the NucleoSpin® Plant II (Macherey–Nagel). The real-time PCR (RT–PCR) reactions were carried out with the following forward 35S 5′-GCTCCTACAAATGCCATCA-3′ and reverse nos-ter 5′-TTATCCTAGTTTGCGCGCTA-3′ primers in a Rotor-Gene 6000 real-time 5-Plex HRM PCR thermocycler (Corbett Research, Sydney, Australia), using the Rotor-Gene Q software version 2.0.2 (Corbett Life Science, Cambridge, UK). PCR reaction mixtures consisted of 50 ng genomic DNA, 1X PCR buffer, 1.5 mM MgCl2, 0.5 μM of the forward and reverse primers, 0.2 mM deoxyribonucleotide triphosphate (dNTP) mix, 0.5 mM SYTOTM 9 green fluorescent nucleic acid stain (Invitrogen, CA, USA), and 1 U Kapa Taq DNA polymerase (Kapa Biosystems, Cape Town, South Africa). The amplification was performed as follows: initial denaturation at 95 °C for 2 min, followed by 30 cycles of 95 °C for 20 s, 54 °C for 20 s, and 72 °C for 1 min with a last melting step at 65–95 °C.
The selection of the positive for the transgene T0 lines was based on: i) the relative expression level of the transgene obtained through quantitative reverse transcription PCR (q-RTPCR) analysis and ii) the activity of PvGSTU2–2 and PvGSTU3–3 enzymes. Total RNA was extracted using TRIZOL (Invitrogen, Carlsbad, CA, USA). First-strand cDNA was synthesized (0.1 μg) using the SuperScript II reverse transcriptase kit (Invitrogen, CA, USA) and 10 U Superscript II reverse transcriptase according to the manufacturer’s instructions. Primers used for q-RTPCR analysis were the forward 5′-GGGCAACAAGAGTGAACAGC-3′ and the reverse 5′-TCCACGTAGCACCCACAATC-3′ for the Pvgstu2–2, and the forward 5′-GGAAGTGTAAAGAAAAATGGCAGAGCA-3′ and reverse 5′-GACTCAGCAATGGCCTTTCC-3′ for the Pvgstu3–3 transgenes. Primers used for β-actin reference gene were the 5′- GGTGACGAACTCAGTCCAAAAGGGGT–3′ as forward and 5′-ACGGCCACTGGCGTATAGGGACAACA -3′ as the reverse. PCR reaction mixtures consisted of 50 ng cDNA, 1X PCR buffer, 1.5 mM MgCl2, 0.5 μM of the forward and reverse primers, 0.2 mM dNTP mix, 0.5 mM SYTOTM 9 green fluorescent nucleic acid stain (Invitrogen, Carlsbad, CA, USA), and 1 U Taq polymerase (Kapa Biosystems, Cape Town, South Africa). The amplification was performed in a Rotor-Gene 6000 real-time 5-Plex HRM PCR Thermocycler (Corbett Research, Sydney, Australia) with 3 technical replications per sample as follows: initial denaturation at 95 °C for 2 min, followed by 30 cycles of 95 °C for 20 s, 54 °C for 20 s, and 72 °C for 1 min with a last melting step at 65–95 °C. Five μL of reaction products were separated on 2% agarose gel, stained with ethidium bromide and visualized on UV. The expected fragment for the Pvgstu2–2 gene was 148 bp, whereas for the Pvgstu3–3 gene was 220 bp and 345 bp for the β-actin gene. The results were presented as a relative quantitative expression based on the 2-ΔΔCT method [125].
The enzymatic activity of the 9 T0 lines overexpressing the Pvgstu3–3 was assessed towards the 1-chloro-2,4-dinitrobenzene (CDNB) universal nonspecific GST substrate that showed the highest sensitivity and specificity (3.5 U mg−1), as described in Chronopoulou et al. [21]. However, some GSTs show limited activity on this substrate and, as an alternative, the 7-chloro-4-nitrobenz-2-oxa-1,3-diazole (NBD-Cl), given its involvement in the GSH complexation reactions. Therefore, the enzymatic activity of the 8 T0 lines overexpressing the Pvgstu2–2 was assessed towards only the NBD-CI, in which this isoenzyme exhibits high activity of 148.2 U mg−1 [33] according to [126,127]. The measurement of the specific enzymatic activity of the isoenzymes PvGSTU2–2 and PvGSTU3–3 was performed in leaf extract from T0 genetically transformed tobacco lines and WT plants used as negative controls. The first two fully expanded leaves were homogenized in a 5 mL aqueous solution of 100 mM Tris-HCl (pH 7.5) and 5% (w/v) polyvinylpyrrolidone (PVP) using a blender. After centrifugation at 15,000×g for 15 min at 4 °C, the supernatant was used for the enzymatic assays. GST activity towards CDNB was determined at 340 nm and towards NBD-Cl at 420 nm. The enzymatic activity was assessed spectrophotometrically and expressed as specific activity (SA Units mg−1%).
A sufficient number of independent transgenic lines were hardened and transferred in greenhouse conditions to produce the T1 generation. To avoid cross-pollination, the inflorescences were covered with paper bags shortly before the flowers bloomed. The harvest was performed by cutting the inflorescences after seed maturation and drying of the capsules was completed. The T1 generation was then used to study the involvement of Pvgstu2–2 and Pvgstu3–3 in abiotic stress tolerance, and more specifically in a combined and single heat and drought stress conditions.

4.3. Application of Abiotic Stress Treatments and Morphophysiological Measurements

The seeds of the T1 lines were initially grown in a selection MS medium supplemented with kanamycin (100 mg L−1), and the WT tobacco seeds were placed in a plain MS medium. After selection, the plantlets were transferred in MS for further growth, and when they reached four true leaves, the rooted plants were transplanted into pots containing 2:1 peat:perlite and transferred for hardening in a CRW- 500 SD growth chamber (Chirisagis, Athens, Greece) with approximately 23 ± 0.1 °C After two weeks, plants of the two different lines were subjected to stress-free (23 °C, well-watered-control; C), drought (23 °C and water deprivation; D), high temperature (38 °C, well-watered; T) and a combination of high temperature and drought (water deprivation and 38 °C; DT) conditions in a controlled growth chamber environment. The watering for the plants under C and T treatments was performed every 2 days until saturation. The photoperiod was set at 12 h, from supplemental lighting of cool-white lamps with an average of 400 μmol photons m2 s−1 photosynthetically active radiation.
The experimental design was completely randomized, with n = 8 for the WT plants and n = 18 for the two transgenic lines for each treatment. The duration of the experimental period was 16 days. The physiological measurements were performed at 0, 8 and 24 h, and on days nine (mid-harvest) and 16 (final harvest). The transgenic (n = 5) and WT (n = 4) plants that were exposed to the combined stress treatment (DT) were re-watered on day 9, due to extensive wilting, to assess their recovering efficiency, and the plants remained under heat to test whether the wilting was related to drought or heat stress. The morphological measurements of all treatments were assessed at mid- and final harvests, whereas recovery was assessed only for the DT treatment on the final harvest day (day 16). Regarding the physiological measurements, plants under combined DT treatment were not measurable on the final harvest day due to severe wilting, and, therefore, all measurements for DT were performed at 9 days and were compared with the recovery state at 16 days. Leaf samples for transcriptomics and metabolomics analysis were excised at 0, 8 and 48 h, and on day 9, respectively. Relative chlorophyll content was measured on one leaf in three technical replications averaged for each plant as described in [125] using a CCM-200 plus chlorophyll content meter (Opti-Sciences Inc., Hudson, NY, USA). Dark-adapted chlorophyll a fluorescence analysis was performed on the adaxial leaf surface using the OS30p+ chlorophyll fluorometer (Opti-Sciences Inc., Hudson, NY, USA) after 30 min dark adaptation. Harvested plants were separated into leaves, stems and roots, and the final morphological parameters, such as the stem and root length, number of leaves and fresh plant matter (MF), were measured. The plant dry matter (MD) was obtained after drying at 60 °C until constant weight.

4.4. Total RNA Extraction, Library Preparation and Sequencing

Total RNA was extracted from leaf samples of the best performing line (Pvgstu3–3.4) (n = 6) under combined DT stress at 0, 8, and 48 h and from the WT (n = 2) at 0 h using the Monarch Total RNA Miniprep kit (New England BioLabs Ltd., Ipswich, MA, USA), according to manufacturer’s instructions. The integrity of the RNA was evaluated using a 2100 Agilent Bioanalyzer and the Agilent RNA 6000 Nano Kit (Agilent Technologies, Santa Clara, CA, USA), and the RNA concentration was determined using the NanoDropTM (Thermo Scientific, Waltham, MA, USA). Following purification, the mRNA was fragmented and copied into the first-strand cDNA using reverse transcriptase and random primers. After the second strand cDNA synthesis and the addition of a single “A” base and subsequent ligation of the adapter, the products were purified and enriched with PCR amplification. The PCR yield was quantified with Qubit and was subjected to single-strand circularized DNA molecule (ssDNA circle) preparation for the final library. Each cDNA library was sequenced in a single lane of the BGISEQ-500 system with a paired-end sequencing length of 100 bp according to the manufacturer’s instructions at the Beijing Genomics Institute (BGI, Shenzhen, China). The transcriptome data in Table 6 were compared as follows: WT plants under control conditions (group 1) versus Pvgstu3–3 under control (group 2), DT at 8 h (group 3) and DT stress at 48 h (group 4). A comparison between the Pvgstu3–3 under stress-free (group 2) and combined stress at 48 h (group 4) was also performed.

Transcriptomics Data Processing and Functional Enrichment Analysis

The raw reads were filtered using SOAPnuke software. The clean reads were mapped onto the reference genome, followed by novel gene prediction, SNP and INDEL calling and gene-splicing detection. More specifically, the hierarchical indexing for spliced alignment of transcripts (HISAT) pipeline was used to align the reads against the reference genome [128]. The StringTie [129] was applied for transcript reconstruction and Cuffcompare (Cufflinks tools) [130] to compare reconstructed transcripts to reference annotation. The coding potential of novel transcripts was predicted by CPC [131] and was merged with reference transcripts to get a complete reference on which the downstream analysis was based. The clean reads were mapped to reference using Bowtie2 [132], and then the gene expression level was calculated with the software RNA-Seq by Expectation Maximization (RSEM) [133]. The detection of DEGs was performed with NOIseq, as described in Tarazona et al. [134]. The hierarchical clustering analysis of DEGs was performed using the pheatmap function in R. The subsequent GO annotation was performed and GO functional enrichment was applied using p hyper in R. The pathway analysis involved the Kyoto Encyclopedia of Genes and Genomes (KEGG) annotation analysis and the pathway functional enrichment using phyper in R. For the transcription factor prediction of DEGs, the getorf function was used to find the open reading frame (ORF) of each DEG, which was aligned to TF domains using hmmsearch [135]. For the protein–protein interactions (PPI) analysis of DEGs, the DIAMOND [136] was used to map the DEGs to the STRING database [137] to obtain the interaction between DEG-encoded proteins using homology with known proteins.

4.5. Metabolite Extraction and GC–MS Analysis

Determination of primary polar metabolites was performed as described by Lisec et al. [138] and Michailidis et al. [139] with slight modifications. Leaf lyophilized material (0.03−0.04 gr) from the best performing line under stress (Pvgstu3–3) and WT plants under control and combined DT stress treatment at 0 h and 9 days (three biological replicates). The leaf tissue was transferred in 2 mL tubes with the addition of 1400 μL precooled (−20 °C) pure methanol. An internal quantitative standard of adonitol (100 μL of 0.2 mg mL−1) was added, and solutions were incubated for 10 min at 70 °C, followed by a centrifugation step (11,000 g, 4 °C, 10 min). The collected supernatant was mixed with 750 μL chloroform (–20 °C) and 1500 μL dH2O (4 °C) and centrifuged at 2200 g, 4 °C, for 10 min. The upper polar phase (150 μL) was transferred into a 1.5 mL vial glass and placed under a vacuum until dried. The dried residues were redissolved in 40 μL of 20 mg mL−1 methoxyamine hydrochloride and incubated for 120 min at 37 °C, followed by treatment with 70 μL of N-methyl-N-(trimethylsilyl) trifluoroacetamide reagent (MSTFA) and incubation for 30 min at 37 °C. GC–MS analysis was carried out in Thermo Trace Ultra GC equipped with auto-sampler ISQ MS and TriPlus RSH (Switzerland). The mass range of m/z 550 was recorded after 5 min of solvent delay. The peak area integration and chromatogram visualization were performed using the X-calibers processing software. Standards were used for peak identification on the NIST11 database in case of unknown peaks [139]. The detected metabolites were assessed based on the relative response compared to the internal standard of adonitol and expressed as relative abundance.

4.6. Statistical Analysis

The statistical analysis for the morpho-physiological data was performed using the computing environment R-4.0.3 (R Core Team) [140]. The effects of stress treatments and the genotypes at harvest and treatments, genotypes and time (days-where applicable) on the morpho-physiological parameters were assessed using two-way and three-way ANOVA, respectively, with the ez and afex packages [141,142]. All data were tested for normality (Shapiro test), and if normality failed and transformations were attempted. Data were also tested with Mauchly’s test for sphericity, and if the assumption of sphericity was violated, the corresponding Greenhouse–Geisser corrections were performed. If significant differences were found among treatments, then Tukey’s HSD post hoc test was performed to determine specific treatment differences using the Agricolae package [143]. The analysis for the metabolites was conducted using the SPSS (IBM SPSS Statistics SPSS v24.0., Armonk, NY, USA) and metabolites, which presented statistically significant differences were based on Duncan’s multiple range test for the effect of genotype x treatment interaction and Student’s t-test for the single effects of treatment and genotype with significance level p ≤ 0.05 (Supplemental Tables S4 and S5). The raw data are presented in Table S6, and the relative response was adjusted by removing the background of the Pvgstu3–3 and WT at 0 days (control) from the respective plants on day nine.

5. Conclusions

To the best of our knowledge, this is the first transcriptomics and metabolomics characterization of the protective effect of Pvgstu against abiotic stresses, contributing towards a better understanding of the mechanisms that govern stress-tolerance and, specifically, tolerance under combined and single drought and heat stresses, under the spectrum of climate change. It is an initiative towards understanding the in planta function of common bean gstu genes with validated catalytic function [21,33]. Taking into consideration the major negative impact of drought and heat stress to crop productivity, the results presented herein would help to elucidate the role of GST in plant stress-tolerance and provide further insights into the potential functional mechanism of GST towards productive agriculture in stress affected areas and enhancing crop safety and production.

Supplementary Materials

The following are available online at https://www.mdpi.com/1422-0067/22/5/2352/s1.

Author Contributions

Conceptualization, E.S., N.E.L., P.M. and I.N.-O.; data curation, E.S., G.V. and M.M.; formal analysis, E.S., G.V. and M.M.; funding acquisition, N.E.L., P.M. and I.N.-O.; investigation, E.S., G.V., M.M. and E.G.C.; methodology, E.S., G.V., M.M. and E.G.C.; project administration, N.E.L., P.M. and I.N.-O.; resources, S.K., P.M. and I.N.-O.; supervision, N.E.L., P.M. and I.N.-O.; validation, E.S.; visualization, E.S., G.V., M.M. and E.G.C.; writing—original draft, E.S.; writing—review and editing, E.S., N.E.L., P.M. and I.N.-O. All authors have read and agreed to the published version of the manuscript.

Funding

This research has been co-financed by the European Union and Greek national funds through the Operational Program Competitiveness, Entrepreneurship and Innovation, under the call RE-SEARCH – CREATE – INNOVATE (Project Code: T1EDK-04718).

Institutional Review Board Statement

Not applicable.

Informed Consent Statement

Not applicable.

Data Availability Statement

The data presented in this study are available in the article or supplementary material.

Acknowledgments

We would like to thank the Operational Program Competitiveness, Entrepreneurship and Innovation, under the call RE-SEARCH – CREATE – INNOVATE (Project Code: T1EDK-04718), also the General Secretariat for Research and Development for the project “Intelligent and Automated systems for enabling the design, simulation and development of integrated processes and products–ODYSSEAS” (MIS) 5002462, and the GST-TOOLS research project (MIS) 380236, “Glutathione Transferases: Multifunctional Molecular Tools in Red and Green Biotechnology-GST-TOOLS”, under the frame of THALES Programme co-financed by the European Social Fund—ESF and the Greek National Strategic Reference Framework (NSRF).

Conflicts of Interest

The authors declare no conflict of interest.

References

  1. Vile, D.; Pervent, M.; Belluau, M.; Vasseur, F.; Bresson, J.; Muller, B.; Granier, C.; Simonneau, T. Arabidopsis growth under prolonged high temperature and water deficit: Independent or interactive effects? Plant Cell Environ. 2012, 35, 702–718. [Google Scholar] [CrossRef]
  2. Fahad, S.; Bajwa, A.A.; Nazir, U.; Anjum, S.A.; Farooq, A.; Zohaib, A.; Sadia, S.; Nasim, W.; Adkins, S.; Saud, S.; et al. Crop Production under Drought and Heat Stress: Plant Responses and Management Options. Front. Plant Sci. 2017, 8, 1147. [Google Scholar] [CrossRef] [Green Version]
  3. Dreesen, F.E.; De Boeck, H.J.; Janssens, I.A.; Nijs, I. Summer heat and drought extremes trigger unexpected changes in productivity of a temperate annual/biannual plant community. Environ. Exp. Bot. 2012, 79, 21–30. [Google Scholar] [CrossRef]
  4. Rizhsky, L.; Liang, H.; Mittler, R. The Combined Effect of Drought Stress and Heat Shock on Gene Expression in Tobacco. Plant Physiol. 2002, 130, 1143–1151. [Google Scholar] [CrossRef] [Green Version]
  5. Rizhsky, L.; Liang, H.; Shuman, J.; Shulaev, V.; Davletova, S.; Mittler, R. When Defense Pathways Collide. The Response of Arabidopsis to a Combination of Drought and Heat Stress. Plant Physiol. 2004, 134, 1683–1696. [Google Scholar] [CrossRef] [Green Version]
  6. Zandalinas, S.I.; Mittler, R.; Balfagón, D.; Arbona, V.; Gómez-Cadenas, A. Plant adaptations to the combination of drought and high temperatures. Physiol. Plant. 2018, 162, 2–12. [Google Scholar] [CrossRef] [Green Version]
  7. Atkinson, N.J.; Lilley, C.J.; Urwin, P.E. Identification of Genes Involved in the Response of Arabidopsis to Simultaneous Biotic and Abiotic Stresses. Plant Physiol. 2013, 162, 2028–2041. [Google Scholar] [CrossRef] [PubMed] [Green Version]
  8. Prasch, C.M.; Sonnewald, U. Simultaneous Application of Heat, Drought, and Virus to Arabidopsis Plants Reveals Significant Shifts in Signaling Networks. Plant Physiol. 2013, 162, 1849–1866. [Google Scholar] [CrossRef]
  9. Rasmussen, S.; Barah, P.; Suarez-Rodriguez, M.C.; Bressendorff, S.; Friis, P.; Costantino, P.; Bones, A.M.; Nielsen, H.B.; Mundy, J. Transcriptome Responses to Combinations of Stresses in Arabidopsis. Plant Physiol. 2013, 161, 1783–1794. [Google Scholar] [CrossRef] [PubMed] [Green Version]
  10. Pandey, P.; Ramegowda, V.; Senthil-Kumar, M. Shared and unique responses of plants to multiple individual stresses and stress combinations: Physiological and molecular mechanisms. Front. Plant Sci. 2015, 6, 723. [Google Scholar] [CrossRef] [PubMed] [Green Version]
  11. Zandalinas, S.I.; Fichman, Y.; Devireddy, A.R.; Sengupta, S.; Azad, R.K.; Mittler, R. Systemic signaling during abiotic stress combination in plants. Proc. Natl. Acad. Sci. USA 2020, 117, 13810–13820. [Google Scholar] [CrossRef]
  12. Pandey, P.; Irulappan, V.; Bagavathiannan, M.V.; Senthil-Kumar, M. Impact of Combined Abiotic and Biotic Stresses on Plant Growth and Avenues for Crop Improvement by Exploiting Physio-morphological Traits. Front. Plant Sci. 2017, 8, 537. [Google Scholar] [CrossRef] [Green Version]
  13. Gill, S.S.; Tuteja, N. Reactive oxygen species and antioxidant machinery in abiotic stress tolerance in crop plants. Plant Physiol. Biochem. 2010, 48, 909–930. [Google Scholar] [CrossRef]
  14. Suzuki, N.; Rivero, R.M.; Shulaev, V.; Blumwald, E.; Mittler, R. Abiotic and biotic stress combinations. New Phytol. 2014, 203, 32–43. [Google Scholar] [CrossRef] [PubMed]
  15. Nianiou-Obeidat, I.; Madesis, P.; Kissoudis, C.; Voulgari, G.; Chronopoulou, E.; Tsaftaris, A.; Labrou, N.E. Plant glutathione transferase-mediated stress tolerance: Functions and biotechnological applications. Plant Cell Rep. 2017, 36, 791–805. [Google Scholar] [CrossRef] [PubMed]
  16. Kumar, S.; Gupta, D.; Nayyar, H. Comparative response of maize and rice genotypes to heat stress: Status of oxidative stress and antioxidants. Acta Physiol. Plant. 2012, 34, 75–86. [Google Scholar] [CrossRef]
  17. Lo Cicero, L.; Madesis, P.; Tsaftaris, A.; Lo Piero, A.R. Tobacco plants over-expressing the sweet orange tau glutathione transferases (CsGSTUs) acquire tolerance to the diphenyl ether herbicide fluorodifen and to salt and drought stresses. Phytochem. 2015, 116, 69–77. [Google Scholar] [CrossRef] [PubMed]
  18. Xu, J.; Xing, X.-J.; Tian, Y.-S.; Peng, R.-H.; Xue, Y.; Zhao, W.; Yao, Q.-H. Transgenic Arabidopsis Plants Expressing Tomato Glutathione S-Transferase Showed Enhanced Resistance to Salt and Drought Stress. PLoS ONE 2015, 10, e0136960. [Google Scholar] [CrossRef] [PubMed]
  19. Ezaki, B.; Suzuki, M.; Motoda, H.; Kawamura, M.; Nakashima, S. Mechanism of Gene Expression of Arabidopsis in Response to Aluminum Stress. Sci. Technol. 2004, 134, 1672–1682. [Google Scholar]
  20. Pang, S.; Duan, L.; Liu, Z.; Song, X.; Li, X.; Wang, C. Co-Induction of a Glutathione-S-transferase, a Glutathione Transporter and an ABC Transporter in Maize by Xenobiotics. PLoS ONE 2012, 7, e40712. [Google Scholar] [CrossRef] [PubMed] [Green Version]
  21. Chronopoulou, E.; Madesis, P.; Tsaftaris, A.; Labrou, N.E. Cloning and Characterization of a Biotic-Stress-Inducible Glutathione Transferase from Phaseolus vulgaris. Appl. Biochem. Biotechnol. 2014, 172, 595–609. [Google Scholar] [CrossRef] [Green Version]
  22. Ding, N.; Wang, A.; Zhang, X.; Wu, Y.; Wang, R.; Cui, H.; Huang, R.; Luo, Y. Identification and analysis of glutathione S-transferase gene family in sweet potato reveal divergent GST-mediated networks in aboveground and underground tissues in response to abiotic stresses. BMC Plant Biol. 2017, 17, 1–15. [Google Scholar] [CrossRef]
  23. Koussevitzky, S.; Suzuki, N.; Huntington, S.; Armijo, L.; Sha, W.; Cortes, D.; Shulaev, V.; Mittler, R. Ascorbate Peroxidase 1 Plays a Key Role in the Response of Arabidopsis thaliana to Stress Combination. J. Biol. Chem. 2008, 283, 34197–34203. [Google Scholar] [CrossRef] [Green Version]
  24. Demirevska, K.; Simova-Stoilova, L.; Fedina, I.; Georgieva, K.; Kunert, K. Response of Oryzacystatin I Transformed Tobacco Plants to Drought, Heat and Light Stress. J. Agron. Crop. Sci. 2010, 196, 90–99. [Google Scholar] [CrossRef]
  25. Nahar, K.; Hasanuzzaman, M.; Alam, M.; Rahman, A.; Mahmud, J.-A.; Suzuki, T.; Fujita, M. Insights into spermine-induced combined high temperature and drought tolerance in mung bean: Osmoregulation and roles of antioxidant and glyoxalase system. Protoplasma 2017, 254, 445–460. [Google Scholar] [CrossRef]
  26. Liu, T.; Zhang, L.; Yuan, Z.; Hu, X.; Lu, M.; Wang, W.; Wang, Y. Identification of proteins regulated by ABA in response to combined drought and heat stress in maize roots. Acta Physiol. Plant. 2013, 35, 501–513. [Google Scholar] [CrossRef]
  27. Kissoudis, C.; Kalloniati, C.; Flemetakis, E.; Madesis, P.; Labrou, N.E.; Tsaftaris, A.; Nianiou-Obeidat, I. Stress-inducible GmGSTU4 shapes transgenic tobacco plants metabolome towards increased salinity tolerance. Acta Physiol. Plant. 2015, 37, 102. [Google Scholar] [CrossRef] [Green Version]
  28. Broughton, W.J.; Hernández, G.; Blair, M.; Beebe, S.; Gepts, P.; Vanderleyden, J. Beans (Phaseolus spp.)—Model food legumes. Plant Soil 2003, 252, 55–128. [Google Scholar] [CrossRef] [Green Version]
  29. Souter, J.R.; Gurusamy, V.; Porch, T.G.; Bett, K.E. Successful Introgression of Abiotic Stress Tolerance from Wild Tepary Bean to Common Bean. Crop Sci. 2017, 57, 1160–1171. [Google Scholar] [CrossRef] [Green Version]
  30. Mathobo, R.; Marais, D.; Steyn, J.M. The effect of drought stress on yield, leaf gaseous exchange and chlorophyll fluorescence of dry beans (Phaseolus vulgaris L.). Agric. Water Manag. 2017, 180, 118–125. [Google Scholar] [CrossRef] [Green Version]
  31. Hiz, M.C.; Canher, B.; Niron, H.; Turet, M. Transcriptome Analysis of Salt Tolerant Common Bean (Phaseolus vulgaris L.) under Saline Conditions. PLoS ONE 2014, 9, e92598. [Google Scholar] [CrossRef] [Green Version]
  32. Dipp, C.C.; Marchese, J.A.; Woyann, L.G.; Bosse, M.A.; Roman, M.H.; Gobatto, D.R.; Paludo, F.; Fedrigo, K.; Kovali, K.K.; Finatto, T. Drought stress tolerance in common bean: What about highly cultivated Brazilian genotypes? Euphytica 2017, 213, 305. [Google Scholar] [CrossRef]
  33. Chronopoulou, E.; Madesis, P.; Asimakopoulou, B.; Platis, D.; Tsaftaris, A.; Labrou, N.E. Catalytic and structural diversity of the fluazifop-inducible glutathione transferases from Phaseolus vulgaris. Planta 2012, 235, 1253–1269. [Google Scholar] [CrossRef] [Green Version]
  34. Ganopoulos, I.; Bosmali, I.; Madesis, P.; Tsaftaris, A. Microsatellite genotyping with HRM (High Resolution Melting) analysis for identification of the PGI common bean variety Plake Megalosperma Prespon. Eur. Food Res. Technol. 2012, 234, 501–508. [Google Scholar] [CrossRef]
  35. Lioi, L.; Piergiovanni, A.R. European Common Bean. In Genetic and Genomic Resources of Grain Legume Improvement, 1st ed.; Singh, M., Upadhyaya, H.D., Bisht, I.S., Eds.; Elsevier Inc.: London, UK, 2013; pp. 11–40. [Google Scholar] [CrossRef]
  36. Lamaoui, M.; Jemo, M.; Datla, R.; Bekkaoui, F. Heat and Drought Stresses in Crops and Approaches for Their Mitigation. Front. Chem. 2018, 6, 26. [Google Scholar] [CrossRef]
  37. Zhao, T.-J.; Sun, S.; Liu, Y.; Liu, J.-M.; Liu, Q.; Yan, Y.-B.; Zhou, H.-M. Regulating the Drought-responsive Element (DRE)-mediated Signaling Pathway by Synergic Functions of Trans-active and Trans-inactive DRE Binding Factors in Brassica napus. J. Biol. Chem. 2006, 281, 10752–10759. [Google Scholar] [CrossRef] [PubMed] [Green Version]
  38. Rucker, K.S.; Kvien, C.K.; Holbrook, C.C.; Hook, J.E. Identification of Peanut Genotypes with Improved Drought Avoidance Traits. Peanut Sci. 1995, 22, 14–18. [Google Scholar] [CrossRef] [Green Version]
  39. Diao, G.; Wang, Y.; Wang, C.; Yang, C. Cloning and Functional Characterization of a Novel Glutathione S-Transferase Gene from Limonium bicolor. Plant Mol. Biol. Rep. 2011, 29, 77–87. [Google Scholar] [CrossRef]
  40. Roxas, V.P.; Lodhi, S.A.; Garrett, D.K.; Mahan, J.R.; Allen, R.D. Stress Tolerance in Transgenic Tobacco Seedlings that Overexpress Glutathione S-Transferase/Glutathione Peroxidase. Plant Cell Physiol. 2000, 41, 1229–1234. [Google Scholar] [CrossRef] [PubMed]
  41. Zhou, R.; Yu, X.; Ottosen, C.-O.; Rosenqvist, E.; Zhao, L.; Wang, Y.; Yu, W.; Zhao, T.; Wu, Z. Drought stress had a predominant effect over heat stress on three tomato cultivars subjected to combined stress. BMC Plant Biol. 2017, 17, 1–13. [Google Scholar] [CrossRef] [PubMed] [Green Version]
  42. Sanmiya, K.; Suzuki, K.; Egawa, Y.; Shono, M. Mitochondrial small heat-shock protein enhances thermotolerance in tobacco plants. FEBS Lett. 2004, 557, 265–268. [Google Scholar] [CrossRef] [Green Version]
  43. Vijayakumar, H.; Thamilarasan, S.K.; Shanmugam, A.; Natarajan, S.; Jung, H.-J.; Park, J.-I.; Kim, H.; Chung, M.-Y.; Nou, I.-S. Glutathione Transferases Superfamily: Cold-Inducible Expression of Distinct GST Genes in Brassica oleracea. Int. J. Mol. Sci. 2016, 17, 1211. [Google Scholar] [CrossRef] [Green Version]
  44. Kayum, A.; Nath, U.K.; Park, J.-I.; Biswas, M.K.; Choi, E.K.; Song, J.-Y.; Kim, H.-T.; Nou, I.-S. Genome-Wide Identification, Characterization, and Expression Profiling of Glutathione S-Transferase (GST) Family in Pumpkin Reveals Likely Role in Cold-Stress Tolerance. Genes 2018, 9, 84. [Google Scholar] [CrossRef] [Green Version]
  45. Kumar, S.; Asif, M.H.; Chakrabarty, D.; Tripathi, R.D.; Dubey, R.S.; Trivedi, P.K. Expression of a rice Lambda class of glutathione S-transferase, OsGSTL2, in Arabidopsis provides tolerance to heavy metal and other abiotic stresses. J. Hazard. Mater. 2013, 248–249, 228–237. [Google Scholar] [CrossRef] [PubMed]
  46. Takesawa, T.; Ito, M.; Kanzaki, H.; Kameya, N.; Nakamura, I. Over-expression of ζ glutathione S-transferase in transgenic rice enhances germination and growth at low temperature. Mol. Breed. 2002, 9, 93–101. [Google Scholar] [CrossRef]
  47. Roxas, V.P.; Smith, R.K.; Allen, E.R.; Allen, R.D. Overexpression of glutathione S-transferase/glutathioneperoxidase enhances the growth of transgenic tobacco seedlings during stress. Nat. Biotechnol. 1997, 15, 988–991. [Google Scholar] [CrossRef]
  48. Wang, C.; Yang, Y.; Wang, H.; Ran, X.; Li, B.; Zhang, J.; Zhang, H. Ectopic expression of a cytochrome P450 monooxygenase gene PtCYP714A3 from Populus trichocarpa reduces shoot growth and improves tolerance to salt stress in transgenic rice. Plant Biotechnol. J. 2016, 14, 1838–1851. [Google Scholar] [CrossRef] [PubMed] [Green Version]
  49. Dossa, K.; Li, D.; Wang, L.; Zheng, X.; Liu, A.; Yu, J.; Wei, X.; Zhou, R.; Foncéka, D.; Diouf, D.; et al. Transcriptomic, biochemical and physio-anatomical investigations shed more light on responses to drought stress in two contrasting sesame genotypes. Sci. Rep. 2017, 7, 1–14. [Google Scholar] [CrossRef] [PubMed] [Green Version]
  50. Gao, Y.; Wang, Y.; Xin, H.; Li, S.; Liang, Z. Involvement of Ubiquitin-Conjugating Enzyme (E2 Gene Family) in Ripening Process and Response to Cold and Heat Stress of Vitis vinifera. Sci. Rep. 2017, 7, 13290. [Google Scholar] [CrossRef] [PubMed] [Green Version]
  51. Zhou, G.-A.; Chang, R.-Z.; Qiu, L.-J. Overexpression of soybean ubiquitin-conjugating enzyme gene GmUBC2 confers enhanced drought and salt tolerance through modulating abiotic stress-responsive gene expression in Arabidopsis. Plant Mol. Biol. 2010, 72, 357–367. [Google Scholar] [CrossRef] [Green Version]
  52. Lyzenga, W.J.; Stone, S.L. Abiotic stress tolerance mediated by protein ubiquitination. J. Exp. Bot. 2012, 63, 599–616. [Google Scholar] [CrossRef] [PubMed] [Green Version]
  53. Vellosillo, T.; Martínez, M.; López, M.A.; Vicente, J.; Cascón, T.; Dolan, L.; Hamberg, M.; Castresana, C. Oxylipins Produced by the 9-Lipoxygenase Pathway in Arabidopsis Regulate Lateral Root Development and Defense Responses through a Specific Signaling Cascade. Plant Cell 2007, 19, 831–846. [Google Scholar] [CrossRef] [PubMed] [Green Version]
  54. Higashi, Y.; Okazaki, Y.; Myouga, F.; Shinozaki, K.; Saito, K. Landscape of the lipidome and transcriptome under heat stress in Arabidopsis thaliana. Sci. Rep. 2015, 5, srep10533. [Google Scholar] [CrossRef] [PubMed] [Green Version]
  55. Distéfano, A.M.; Valiñas, M.A.; Scuffi, D.; LaMattina, L.; Have, A.T.; García-Mata, C.; Laxalt, A.M. Phospholipase D δ knock-out mutants are tolerant to severe drought stress. Plant Signal. Behav. 2015, 10, e1089371. [Google Scholar] [CrossRef] [PubMed] [Green Version]
  56. Pandian, B.A.; Sathishraj, R.; Djanaguiraman, M.; Prasad, P.V.; Jugulam, M. Role of Cytochrome P450 Enzymes in Plant Stress Response. Antioxidants 2020, 9, 454. [Google Scholar] [CrossRef]
  57. Labrou, N.E.; Papageorgiou, A.C.; Pavli, O.; Flemetakis, E. Plant GSTome: Structure and functional role in xenome network and plant stress response. Curr. Opin. Biotechnol. 2015, 32, 186–194. [Google Scholar] [CrossRef]
  58. Yang, G.; Wang, Y.; Xia, D.; Gao, C.; Wang, C.; Yang, C. Overexpression of a GST gene (ThGSTZ1) from Tamarix hispida im-proves drought and salinity tolerance by enhancing the ability to scavenge reactive oxygen species. Plant Cell Tissue Organ Cult. 2014, 117, 99–112. [Google Scholar] [CrossRef]
  59. Csiszár, J.; Horváth, E.; Váry, Z.; Gallé, Á.; Bela, K.; Brunner, S.; Tari, I. Glutathione transferase supergene family in tomato: Salt stress-regulated expression of representative genes from distinct GST classes in plants primed with salicylic acid. Plant Physiol. Biochem. 2014, 78, 15–26. [Google Scholar] [CrossRef] [Green Version]
  60. Madesis, P.; Nianiou-Obeidat, I.; Labrou, N.E.; Tsaftaris, A. The Use of Highly Specific GSTs towards the Development of Stress Tolerant Transgenic Plants. In Glutathione: Biochemistry, Mechanisms of Action and Biotechnological Implications; Labrou, N.E., Flemetakis, E., Eds.; Nova Science Pub Inc.: New York, NY, USA, 2013; pp. 263–274. ISBN 9781617617638. [Google Scholar]
  61. Tian, X.; Wang, Z.; Zhang, Q.; Ci, H.; Wang, P.; Yu, L.; Jia, G. Genome-wide transcriptome analysis of the salt stress tolerance mechanism in Rosa chinensis. PLoS ONE 2018, 13, e0200938. [Google Scholar] [CrossRef]
  62. George, S.; Venkataraman, G.; Parida, A. A chloroplast-localized and auxin-induced glutathione S-transferase from phreat-ophyte Prosopis juliflora confer drought tolerance on tobacco. J. Plant Physiol. 2010, 167, 311–318. [Google Scholar] [CrossRef] [PubMed]
  63. Liu, D.; Liu, Y.; Rao, J.; Wang, G.; Li, H.; Ge, F.; Chen, C. Overexpression of the glutathione S-transferase gene from Pyrus pyrifolia fruit improves tolerance to abiotic stress in transgenic tobacco plants. Mol. Biol. 2013, 47, 515–523. [Google Scholar] [CrossRef]
  64. Xu, J.; Tian, Y.S.; Xing, X.J.; Peng, R.H.; Zhu, B.; Gao, J.J.; Yao, Q.H. Over-expression of AtGSTU19 provides tolerance to salt, drought and methyl viologen stresses in Arabidopsis. Physiol. Plant. 2016, 156, 164–175. [Google Scholar] [CrossRef] [PubMed]
  65. Sekmen, A.H.; Ozgur, R.; Uzilday, B.; Turkan, I. Reactive oxygen species scavenging capacities of cotton (Gossypium hirsutum) cultivars under combined drought and heat induced oxidative stress. Environ. Exp. Bot. 2014, 99, 141–149. [Google Scholar] [CrossRef]
  66. Poage, M.; Le Martret, B.; Jansen, M.A.K.; Nugent, G.D.; Dix, P.J. Modification of reactive oxygen species scavenging capacity of chloroplasts through plastid transformation. Plant Mol. Biol. 2011, 76, 371–384. [Google Scholar] [CrossRef]
  67. Sharma, R.; Sahoo, A.; Devendran, R.; Jain, M. Over-Expression of a Rice Tau Class Glutathione S-Transferase Gene Improves Tolerance to Salinity and Oxidative Stresses in Arabidopsis. PLoS ONE 2014, 9, e92900. [Google Scholar] [CrossRef] [PubMed] [Green Version]
  68. Dusenge, M.E.; Duarte, A.G.; Way, D.A. Plant carbon metabolism and climate change: Elevated CO2 and temperature impacts on photosynthesis, photorespiration and respiration. New Phytol. 2018, 221, 32–49. [Google Scholar] [CrossRef] [Green Version]
  69. Rabara, R.C.; Tripathi, P.; Reese, R.N.; Rushton, D.L.; Alexander, D.; Timko, M.P.; Shen, Q.J.; Rushton, P.J. Tobacco drought stress responses reveal new targets for Solanaceae crop improvement. BMC Genom. 2015, 16, 1–23. [Google Scholar] [CrossRef] [PubMed] [Green Version]
  70. Voss, I.; Sunil, B.; Scheibe, R.; Raghavendra, A.S. Emerging concept for the role of photorespiration as an important part of abiotic stress response. Plant Biol. 2013, 15, 713–722. [Google Scholar] [CrossRef]
  71. Yao, K.; Wu, Y.Y. Phosphofructokinase and glucose-6-phosphate dehydrogenase in response to drought and bicarbonate stress at transcriptional and functional levels in mulberry. Russ. J. Plant Physiol. 2016, 63, 235–242. [Google Scholar] [CrossRef]
  72. Trischuk, R.G.; Schilling, B.S.; Wisniewski, M.; Gusta, L.V. Freezing stress: Systems biology to study cold tolerance. In Physiology and Molecular Biology of Stress Tolerance in Plants; Rao, K.V.M., Reddy, K.J., Raghavendra, A.S., Eds.; Springer: Dordrecht, The Netherlands, 2006; pp. 131–155. [Google Scholar]
  73. Zhang, X.; Leger, R.J.S.; Fang, W. Pyruvate Accumulation Is the First Line of Cell Defense against Heat Stress in a Fungus. mBio 2017, 8, e01284-17. [Google Scholar] [CrossRef] [Green Version]
  74. Ouyang, J.; Shao, X.; Li, J. Indole-3-glycerol phosphate, a branchpoint of indole-3-acetic acid biosynthesis from the tryptophan biosynthetic pathway in Arabidopsis thaliana. Plant J. 2000, 24, 327–334. [Google Scholar] [CrossRef]
  75. Wang, X.; Cai, X.; Xu, C.; Wang, Q.; Dai, S. Drought-Responsive Mechanisms in Plant Leaves Revealed by Proteomics. Int. J. Mol. Sci. 2016, 17, 1706. [Google Scholar] [CrossRef] [Green Version]
  76. Rosa, M.; Prado, C.; Podazza, G.; Interdonato, R.; González, J.A.; Hilal, M.; Prado, F.E. Soluble sugars-metabolism, sensing and abiotic stress a complex network in the life of plants. Plant Signal. Behav. 2009, 4, 388–393. [Google Scholar] [CrossRef] [PubMed] [Green Version]
  77. Ahmed, R.F.; Irfan, M.; Shakir, H.A.; Khan, M.; Chen, L. Engineering drought tolerance in plants by modification of transcripion and signalling factors. Biotechnol. Biotechnol. Equip. 2020, 34, 781–789. [Google Scholar] [CrossRef]
  78. Baillo, E.H.; Kimotho, R.N.; Zhang, Z.; Xu, P. Transcription Factors Associated with Abiotic and Biotic Stress Tolerance and Their Potential for Crops Improvement. Genes 2019, 10, 771. [Google Scholar] [CrossRef] [PubMed] [Green Version]
  79. Khan, S.-A.; Li, M.-Z.; Wang, S.-M.; Yin, H.-J. Revisiting the Role of Plant Transcription Factors in the Battle against Abiotic Stress. Int. J. Mol. Sci. 2018, 19, 1634. [Google Scholar] [CrossRef] [PubMed] [Green Version]
  80. Khan, R.; Zhou, P.; Ma, X.; Zhou, L.; Wu, Y.; Ullah, Z.; Wang, S. Transcriptome Profiling, Biochemical and Physiological Analyses Provide New Insights towards Drought Tolerance in Nicotiana tabacum L. Genes 2019, 10, 1041. [Google Scholar] [CrossRef] [PubMed] [Green Version]
  81. Zhang, A.; Zhu, Z.; Shang, J.; Zhang, S.; Shen, H.; Wu, X.; Zha, D. Transcriptome profiling and gene expression analyses of eggplant (Solanum melongena L.) under heat stress. PLoS ONE 2020, 15, e0236980. [Google Scholar] [CrossRef]
  82. Wang, L.; Liu, L.; Ma, Y.; Li, S.; Dong, S.; Zu, W. Transcriptome profilling analysis characterized the gene expression patterns responded to combined drought and heat stresses in soybean. Comput. Biol. Chem. 2018, 77, 413–429. [Google Scholar] [CrossRef]
  83. Pande, A.; Saxena, S.; Thapliyal, M.; Guru, S.K.; Kumar, A.; Arora, S. Role of AP2/EREBP Transcription Factor Family in Environmental Stress Tolerance. Cell Cell. Life Sci. J. 2018, 3, 1–9. [Google Scholar] [CrossRef]
  84. Dong, C.; Xi, Y.; Chen, X.; Cheng, Z.-M.M. Genome-Wide Identi cation of AP2/EREBP in Fragaria Vesca and Expression Pattern Analysis of The FvDREB Subfamily Under Drought Stress. BMC Plant Biol. 2020. [Google Scholar] [CrossRef]
  85. Liu, C.; Zhang, T. Expansion and stress responses of the AP2/EREBP superfamily in cotton. BMC Genom. 2017, 18, 1–16. [Google Scholar] [CrossRef] [PubMed] [Green Version]
  86. Dietz, K.-J.; Vogel, M.O.; Viehhauser, A. AP2/EREBP transcription factors are part of gene regulatory networks and integrate metabolic, hormonal and environmental signals in stress acclimation and retrograde signalling. Protoplasma 2010, 245, 3–14. [Google Scholar] [CrossRef] [PubMed]
  87. Liu, G.; Chai, F.; Wang, Y.; Jiang, J.; Duan, W.; Wang, Y.; Wang, F.; Li, S.; Wang, L. Genome-wide Identification and Classification of HSF Family in Grape, and Their Transcriptional Analysis under Heat Acclimation and Heat Stress. Hortic. Plant J. 2018, 4, 133–143. [Google Scholar] [CrossRef]
  88. Li, X.; Wang, Y.; Dai, Y.; He, Y.; Li, C.; Mao, P.; Ma, X. The transcription factors of tall fescue in response to temperature stress. Plant Biol. 2020. [Google Scholar] [CrossRef] [PubMed]
  89. Jiang, J.; Ma, S.; Ye, N.; Jiang, M.; Cao, J.; Zhang, J. WRKY transcription factors in plant responses to stresses. J. Integr. Plant Biol. 2017, 59, 86–101. [Google Scholar] [CrossRef]
  90. Ma, L.; Tian, T.; Lin, R.; Deng, X.W.; Wang, H.; Li, G. Arabidopsis FHY3 and FAR1 Regulate Light-Induced myo-Inositol Bi-osynthesis and Oxidative Stress Responses by Transcriptional Activation of MIPSMol. Plant 2016, 9, 541–557. [Google Scholar]
  91. Kaplan-Levy, R.N.; Brewer, P.B.; Quon, T.; Smyth, D.R. The trihelix family of transcription factors—Light, stress and devel-opment. Trends Plant Sci. 2012, 17, 163–171. [Google Scholar] [CrossRef] [PubMed]
  92. Xiao, J.; Hu, R.; Gu, T.; Han, J.; Qiu, D.; Su, P.; Feng, J.; Chang, J.; Yang, G.; He, G. Genome-wide identification and expression profiling of trihelix gene family under abiotic stresses in wheat. BMC Genom. 2019, 20, 287. [Google Scholar] [CrossRef]
  93. Xie, Z.-M.; Zou, H.-F.; Lei, G.; Wei, W.; Zhou, Q.-Y.; Niu, C.-F.; Liao, Y.; Tian, A.-G.; Ma, B.; Zhang, W.-K.; et al. Soybean Trihelix Transcription Factors GmGT-2A and GmGT-2B Improve Plant Tolerance to Abiotic Stresses in Transgenic Arabidopsis. PLoS ONE 2009, 4, e6898. [Google Scholar] [CrossRef] [Green Version]
  94. Bouzroud, S.; Gouiaa, S.; Hu, N.; Bernadac, A.; Mila, I.; Bendaou, N.; Smouni, A.; Bouzayen, M.; Zouine, M. Auxin Response Factors (ARFs) are potential mediators of auxin action in tomato response to biotic and abiotic stress (Solanum lycopersicum). PLoS ONE 2018, 13, e0193517. [Google Scholar] [CrossRef] [Green Version]
  95. Li, D.; Fu, F.; Zhang, H.; Song, F. Genome-wide systematic characterization of the bZIP transcriptional factor family in tomato (Solanum lycopersicum L.). BMC Genom. 2015, 16, 1–18. [Google Scholar] [CrossRef] [Green Version]
  96. Rodriguez-Uribe, L.; O’Connell, M.A. A root-specific bZIP transcription factor is responsive to water deficit stress in tepary bean (Phaseolus acutifolius) and common bean (P. vulgaris). J. Exp. Bot. 2006, 57, 1391–1398. [Google Scholar] [CrossRef]
  97. Polania, J.; Rao, I.M.; Cajiao, C.; Grajales, M.; Rivera, M.; Velasquez, F.; Raatz, B.; Beebe, S.E. Shoot and Root Traits Contribute to Drought Resistance in Recombinant Inbred Lines of MD 23–24 × SEA 5 of Common Bean. Front. Plant Sci. 2017, 8, 296. [Google Scholar] [CrossRef]
  98. Ramírez-Vallejo, P.; Kelly, J.D. Traits related to drought resistance in common bean. Euphytica 1998, 99, 127–136. [Google Scholar] [CrossRef]
  99. Teran, J.C.B.M.Y.; Konzen, E.R.; Medina, V.; Palkovic, A.; Ariani, A.; Tsai, S.M.; Gilbert, M.E.; Gepts, P. Root and shoot variation in relation to potential intermittent drought adaptation of Mesoamerican wild common bean (Phaseolus vulgaris L.). Ann. Bot. 2019, 124, 917–932. [Google Scholar] [CrossRef] [PubMed] [Green Version]
  100. Xie, M.; Chen, H.; Huang, L.; O’Neil, R.C.; Shokhirev, M.N.; Ecker, J.R. A B-ARR-mediated cytokinin transcriptional network directs hormone cross-regulation and shoot development. Nat. Commun. 2018, 9, 1–13. [Google Scholar] [CrossRef] [Green Version]
  101. Moschen, S.; Di Rienzo, J.A.; Higgins, J.; Tohge, T.; Watanabe, M.; González, S.; Rivarola, M.; García-García, F.; Dopazo, J.; Hopp, H.E.; et al. Integration of transcriptomic and metabolic data reveals hub transcription factors involved in drought stress response in sunflower (Helianthus annuus L.). Plant Mol. Biol. 2017, 94, 549–564. [Google Scholar] [CrossRef]
  102. Keunen, E.; Peshev, D.; Vangronsveld, J.; Van Den Ende, W.; Cuypers, A. Plant sugars are crucial players in the oxidative challenge during abiotic stress: Extending the traditional concept. Plant Cell Environ. 2013, 36, 1242–1255. [Google Scholar] [CrossRef]
  103. Morales, C.; Pino, M.; Del Pozo, A. Phenological and physiological responses to drought stress and subsequent rehydration cycles in two raspberry cultivars. Sci. Hortic. 2013, 162, 234–241. [Google Scholar] [CrossRef] [Green Version]
  104. Khan, M.S.; Ahmad, D.; Khan, M.A. Utilization of genes encoding osmoprotectants in transgenic plants for enhanced abiotic stress tolerance. Electron. J. Biotechnol. 2015, 18, 257–266. [Google Scholar] [CrossRef] [Green Version]
  105. Shen, B.; Jensen, R.G.; Bohnert, H.J. Mannitol Protects against Oxidation by Hydroxyl Radicals. Plant Physiol. 1997, 115, 527–532. [Google Scholar] [CrossRef] [Green Version]
  106. Tan, J.; Wang, C.; Xiang, B.; Han, R.; Guo, Z. Hydrogen peroxide and nitric oxide mediated cold- and dehydration-induced myo-inositol phosphate synthase that confers multiple resistances to abiotic stresses. Plant Cell Environ. 2013, 36, 288–299. [Google Scholar] [CrossRef]
  107. Nosarzewski, M.; Downie, A.B.; Wu, B.; Archbold, D.D. The Role of Sorbitol Dehydrogenase in Arabidopsis Thaliana. Funct. Plant Biol. 2012, 39, 462–470. [Google Scholar] [CrossRef]
  108. Sheveleva, E.V.; Marquez, S.; Chmara, W.; Zegeer, A.; Jensen, R.G.; Bohnert, H.J. Sorbitol-6-phosphate dehydrogenase expression in transgenic tobacco. High amounts of sorbitol lead to necrotic lesions. Plant Physiol. 1998, 117, 831–839. [Google Scholar] [CrossRef] [PubMed] [Green Version]
  109. Kissoudis, C.; Kalloniati, C.; Flemetakis, E.; Madesis, P.; Labrou, N.E.; Tsaftaris, A.; Nianiou-Obeidat, I. Maintenance of met-abolic homeostasis and induction of cytoprotectants and secondary metabolites in alachlor-treated GmGSTU4-overexpressing tobacco plants, as resolved by metabolomics. Plant Biotechnol. Rep. 2015, 9, 287–296. [Google Scholar] [CrossRef] [Green Version]
  110. Szabados, L.; Savouré, A. Proline: A multifunctional amino acid. Trends Plant Sci. 2010, 15, 89–97. [Google Scholar] [CrossRef] [PubMed]
  111. Cvikrová, M.; Gemperlová, L.; Martincová, O.; Vanková, R. Effect of drought and combined drought and heat stress on pol-yamine metabolism in proline-over-producing tobacco plants. Plant Physiol. Biochem. 2013, 73, 7–15. [Google Scholar] [CrossRef] [PubMed]
  112. Liang, X.; Zhang, L.; Natarajan, S.K.; Becker, D.F. Proline Mechanisms of Stress Survival. Antioxid. Redox Signal. 2013, 19, 998–1011. [Google Scholar] [CrossRef] [PubMed] [Green Version]
  113. Matros, A.; Peshev, D.; Peukert, M.; Mock, H.-P.; Van Den Ende, W. Sugars as hydroxyl radical scavengers: Proof-of-concept by studying the fate of sucralose in Arabidopsis. Plant J. 2015, 82, 822–839. [Google Scholar] [CrossRef]
  114. Casaretto, J.A.; El-Kereamy, A.; Zeng, B.; Stiegelmeyer, S.M.; Chen, X.; Bi, Y.-M.; Rothstein, S.J. Expression of OsMYB55 in maize activates stress-responsive genes and enhances heat and drought tolerance. BMC Genom. 2016, 17, 312. [Google Scholar] [CrossRef] [Green Version]
  115. Axarli, I.A.; Rigden, D.J.; Labrou, N.E. Characterization of the ligandin site of maize glutathione S-transferase I. Biochem. J. 2004, 382, 885–893. [Google Scholar] [CrossRef] [PubMed]
  116. Gullner, G.; Komives, T.; Király, L.; Schröder, P. Glutathione S-transferase enzymes in plant-pathogen interactions. Front. Plant Sci. 2018, 9, 1836. [Google Scholar] [CrossRef] [Green Version]
  117. Fichman, Y.; Mittler, R. Rapid systemic signaling during abiotic and biotic stresses: Is the ROS wave master of all trades? Plant J. 2020, 102, 887–896. [Google Scholar] [CrossRef] [PubMed] [Green Version]
  118. Walley, J.W.; Coughlan, S.; Hudson, M.E.; Covington, M.F.; Kaspi, R.; Banu, G.; Harmer, S.L.; Dehesh, K. Mechanical Stress Induces Biotic and Abiotic Stress Responses via a Novel cis -Element. PLOS Genet. 2007, 3, e172. [Google Scholar] [CrossRef] [PubMed]
  119. Kissoudis, C.; van de Wiel, C.; Visser, R.G.F.; van der Linden, G. Enhancing crop resilience to combined abiotic and biotic stress through the dissection of physiological and molecular crosstalk. Front. Plant Sci. 2014, 5, 1–20. [Google Scholar] [CrossRef] [PubMed] [Green Version]
  120. Møller, I.M.; Jensen, P.E.; Hansson, A. Oxidative Modifications to Cellular Components in Plants. Annu. Rev. Plant Biol. 2007, 58, 459–481. [Google Scholar] [CrossRef] [Green Version]
  121. Wong, H.L.; Shimamoto, K. Sending ROS on a Bullet Train. Sci. Signal. 2009, 2, pe60. [Google Scholar] [CrossRef] [PubMed]
  122. Reddy, A.S.; Ali, G.S.; Celesnik, H.; Day, I.S. Coping with Stresses: Roles of Calcium- and Calcium/Calmodulin-Regulated Gene Expression. Plant Cell 2011, 23, 2010–2032. [Google Scholar] [CrossRef] [Green Version]
  123. Walley, J.W.; Dehesh, K. Molecular Mechanisms Regulating Rapid Stress Signaling Networks in Arabidopsis. J. Integr. Plant Biol. 2010, 52, 354–359. [Google Scholar] [CrossRef]
  124. Benekos, K.; Kissoudis, C.; Nianiou-Obeidat, I.; Labrou, N.E.; Madesis, P.; Kalamaki, M.S.; Makris, A.; Tsaftaris, A.S. Overexpression of a specific soybean GmGSTU4 isoenzyme improves diphenyl ether and chloroacetanilide herbicide tolerance of transgenic tobacco plants. J. Biotechnol. 2010, 150, 195–201. [Google Scholar] [CrossRef] [PubMed]
  125. Livak, K.J.; Schmittgen, T.D. Analysis of relative gene expression data using real-time quantitative PCR and the 2(-Delta Delta C(T)) Method. Methods 2001, 25, 402–408. [Google Scholar] [CrossRef] [PubMed]
  126. Skopelitou, K.; Muleta, A.W.; Pavli, O.; Skaracis, G.N.; Flemetakis, E.; Papageorgiou, A.C.; Labrou, N.E. Overlapping protective roles for glutathione transferase gene family members in chemical and oxidative stress response in Agrobacterium tumefaciens. Funct. Integr. Genom. 2012, 12, 157–172. [Google Scholar] [CrossRef] [PubMed]
  127. Ricci, G.; Caccuri, A.; Lo Bello, M.; Pastore, A.; Piemonte, F.; Federici, G. Colorimetric and Fluorometric Assays of Glutathione Transferase Based on 7-Chloro-4-nitrobenzo-2-oxa-1,3-diazole. Anal. Biochem. 1994, 218, 463–465. [Google Scholar] [CrossRef]
  128. Kim, D.; Langmead, B.; Salzberg, S.L. HISAT: A fast spliced aligner with low memory requirements. Nat. Methods 2015, 12, 357–360. [Google Scholar] [CrossRef] [Green Version]
  129. Pertea, M.; Pertea, G.M.; Antonescu, C.M.; Chang, T.-C.; Mendell, J.T.; Salzberg, S.L. StringTie enables improved reconstruction of a transcriptome from RNA-seq reads. Nat. Biotechnol. 2015, 33, 290–295. [Google Scholar] [CrossRef] [Green Version]
  130. Trapnell, C.; Roberts, A.; Goff, L.; Pertea, G.; Kim, D.; Kelley, D.R.; Pimentel, H.; Salzberg, S.L.; Rinn, J.L.; Pachter, L. Differ-ential gene and transcript expression analysis of RNA-seq experiments with TopHat and Cufflinks. Nat. Protoc. 2012, 7, 562–578. [Google Scholar] [CrossRef] [Green Version]
  131. Kong, L.; Zhang, Y.; Ye, Z.-Q.; Liu, X.-Q.; Zhao, S.-Q.; Wei, L.; Gao, G. CPC: Assess the protein-coding potential of transcripts using sequence features and support vector machine. Nucleic Acids Res. 2007, 35, W345–W349. [Google Scholar] [CrossRef]
  132. Langmead, B.; Salzberg, S.L. Fast gapped-read alignment with Bowtie. Nat. Methods 2012, 9, 357–359. [Google Scholar] [CrossRef] [Green Version]
  133. Li, B.; Dewey, C.N. RSEM: Accurate transcript quantification from RNA-Seq data with or without a reference genome. BMC Bioinform. 2011, 12, 323. [Google Scholar] [CrossRef] [PubMed] [Green Version]
  134. Tarazona, S.; García-Alcalde, F.; Dopazo, J.; Ferrer, A.; Conesa, A. Differential expression in RNA-seq: A matter of depth. Genome Res. 2011, 21, 2213–2223. [Google Scholar] [CrossRef] [Green Version]
  135. Mistry, J.; Finn, R.D.; Eddy, S.R.; Bateman, A.; Punta, M. Challenges in homology search: HMMER3 and convergent evolution of coiled-coil regions. Nucleic Acids Res. 2013, 41, e121. [Google Scholar] [CrossRef] [PubMed] [Green Version]
  136. Buchfink, B.; Xie, C.; Huson, D.H. Fast and sensitive protein alignment using DIAMOND. Nat. Methods 2014, 12, 59–60. [Google Scholar] [CrossRef] [PubMed]
  137. Von Mering, C.; Jensen, L.J.; Snel, B.; Hooper, S.D.; Krupp, M.; Foglierini, M.; Jouffre, N.; Huynen, M.A.; Bork, P. STRING: Known and predicted protein-protein associations, integrated and transferred across organisms. Nucleic Acids Res. 2005, 33, D433–D437. [Google Scholar] [CrossRef] [PubMed]
  138. Lisec, J.; Schauer, N.; Kopka, J.; Willmitzer, L.; Fernie, A.R. Gas chromatography mass spectrometry–based metabolite profiling in plants. Nat. Protoc. 2006, 1, 387–396. [Google Scholar] [CrossRef] [PubMed]
  139. Michailidis, M.; Karagiannis, E.; Tanou, G.; Karamanoli, K.; Lazaridou, A.; Matsi, T.; Molassiotis, A. Metabolomic and physi-co-chemical approach unravel dynamic regulation of calcium in sweet cherry fruit physiology. Plant Physiol. Biochem. 2017, 116, 68–79. [Google Scholar] [CrossRef]
  140. R Core Team. R: A Language and Environment for Statistical Computing; R Foundation for statistical and Computing: Vienna, Austria, 2020. [Google Scholar]
  141. Lawrence, M.A. “ez”: Easy Analysis and Visualization of Factorial Experiments, R package version 4.4-0. CRANpackage repository. 2016.
  142. Singmann, H.; Bolker, B.; Westfall, J.; Højsgaard, S.; Fox, J.; Lawrence, M.A.; Mertens, U. Afex: Analysis of Factorial Experiments, R package version 0.28-1. CRAN package repository. 2021.
  143. De Mendiburu, F. Agricolae: Statistical Procedures for Agricultural Research, R package version 1.3-3. CRAN package repository. 2020.
Figure 1. Effect of heat (T), drought (D) and combination of drought and heat (DT) stress on the growth of transgenic lines (Pvgstu3–3.4 and Pvgstu2–2.19) and wild-type (WT) tobacco plants after 9 days compared to the stress-free, control (C) conditions. It is interesting that under single D or T stresses did not show any significant wilting as compared to the DT treatment.
Ijms 22 02352 g001
Figure 2. Dry matter (MD) (g) of the transgenic lines Pvgstu3–3.4 and Pvgstu2–2.19 and WT plants growing under control (C), drought (D), heat (T) and combination of drought and heat stresses (DT) at nine and 16 days. Different letters indicate significant differences among genotypes for each treatment at p < 0.05. Data are means ± SE (WT: n = 4; Pvgstu lines at 9 days: n = 5; at 16 days: n = 7).
Ijms 22 02352 g002
Figure 3. Physiological measurements: (a) maximum fluorescence (Fv/Fm) of photosystem II and (b) relative chlorophyll content (CCI) measured in the transgenic lines Pvgstu3–3.4 and Pvgstu2–2.19 and WT plants growing under control (C), drought (D), heat (T) and combination of drought and heat stresses (DT), at nine and 16 days. Different letters indicate significant differences among treatments for each genotype at p < 0.05. Data are means ± SE (WT: n = 4; Pvgstu lines at 9 days: n = 5; at 16 days: n = 7).
Ijms 22 02352 g003
Figure 4. Venn diagram of differentially expressed genes (DEGs). Comparison between (a) WT vs. Pvgstu3–3.4 in stress-free control (C) conditions (groups 1 vs. 2, respectively); (b) stress-free Pvgstu3–3.4 (C) vs. Pvgstu3–3.4 at 48 h under DT (groups 2 vs. 4, respectively); (c) stress-free WT (C) vs. Pvgstu3–3.4 at 8 h under DT (groups 1 vs. 3, respectively); and (d) stress-free WT (C) vs. Pvgstu3–3.4 under 48 h DT (groups 1 vs. 4, respectively). The intersection of the two circles represents overlapping DEGs between the representative datasets.
Ijms 22 02352 g004
Figure 5. Scatter plot depicting the correlation of the gene expression profiles between (a) WT vs. Pvgstu3–3.4 in stress-free control (C) conditions (0 h; groups 1 vs. 2, respectively); (b) stress-free Pvgstu3–3.4 (C) vs. Pvgstu3–3.4 at 48 h under DT (groups 2 vs. 4, respectively); (c) stress-free WT (C) vs. Pvgstu3–3.4 at 8 h under DT (groups 1 vs. 3, respectively).; (d) stress-free WT (C) vs. Pvgstu3–3.4 at 48 h under DT (groups 1 vs. 4, respectively). DT indicates combined drought and heat stresses. The significantly up- and downregulated genes with probability ≥ and ≤ 0.8, respectively, are presented with red and blue dots, respectively, while non-significant genes as gray dots.
Ijms 22 02352 g005
Figure 6. Heat map of primary metabolites of Pvgstu3–3.4 and WT plants under combined DT stress (9 days) compared to control conditions. For each metabolite, the ratio between DT treatment to control was transformed into log2 and depicted with a color scale indicated as purple (increase) and as yellow (decrease; see color scale). Mean values of three independent determinations for each treatment were expressed as relative abundance compared to internal standard adonitol and are reported as background-free of the control conditions at 0 days. Actual data are provided in Supplementary Table S6.
Ijms 22 02352 g006
Figure 7. Venn diagram representation of metabolites commonly or differentially increased in the leaves of WT and Pvgstu3–3.4 tobacco plants grown for 9 days under combined drought and heat stress (DT) compared to stress-free plants.
Ijms 22 02352 g007
Table 1. Growth traits of the Pvgstu transgenic lines and WT tobacco plants grown for nine days in drought (D), heat (T) and a combination of drought and heat (DT) stresses. Tukey’s HSD (THSD) post hoc test was performed for the treatment effect on shoot and root length, fresh matter (MF) and the number of leaves for each genotype. Data are means ± SE (WT: n = 4; Pvgstu lines: n = 5). Different letters indicate significant differences between treatments for each genotype at p < 0.05.
Mid-harvest (Day 9)
GenotypesTreatmentShoot LengthTHSDRoot LengthTHSDMFTHSDNumber of LeavesTHSD
Pvgstu2–2.19C12 ± 0.85a9.3 ± 1.4a6.46 ± 0.41a11 ± 0.71a
D9.04 ± 0.77ab7.7 ± 0.62ab3.48 ± 0.3b8.6 ± 0.24b
T9.66 ± 1.09ab6.9 ± 0.51ab5.74 ± 0.66a8.8 ± 0.37b
DT8.2 ± 0.3b4.24 ± 0.708b1.14 ± 0.09c7.6 ± 0.24b
Pvgstu3–3.4C11.28 ± 0.47a8.84 ± 0.88a6.3 ± 0.63a10 ± 0.55a
D9 ± 0.524a8.88 ± 0.82a3.7 ± 0.28b9 ± 0.32a
T9.98 ± 0.87a6.9 ± 1.67a6.04 ± 0.24a8.8 ± 0.66a
DT9 ± 0.464a5.5 ± 0.55a1.08 ± 0.14c6.8 ± 0.37b
WTC12.12 ± 1.01a13.62 ± 2.01a5.6 ± 0.196a12.5 ± 1.44a
D10.12 ± 0.96a8.5 ± 1.67ab3.45 ± 0.35b10 ± 0.41a
T10.87 ± 0.87a8 ± 1.17ab4.55 ± 0.3a9.75 ± 1.25a
DT9.82 ± 0.64a6.07 ± 0.47b0.65 ± 0.08c5 ± 0b
Table 2. Growth traits of Pvgstu transgenic lines and WT tobacco plants grown for 16 days in drought (D), heat (T), and combination of drought and heat (DT) stresses and their recovery measured on day 16. Tukey’s HSD (THSD) post hoc test was performed for the interaction effect of genotype × treatment on shoot and root length, fresh weight (MF) and the number of leaves. Data are the mean ± SE (WT: n = 4; Pvgstu lines: n = 7). Different letters indicate significant differences between genotypes for each treatment at p < 0.05.
Final Harvest (Day 16)
TreatmentGenotypeShoot LengthTHSDRoot LengthTHSDMFTHSDNumber of LeavesTHSD
CPvgstu2–2.1915.08 ± 0.64a9.94 ± 0.77a8.04 ± 0.5ab27.45 ± 1.97a
Pvgstu3–3.414.24 ± 0.846a10.23 ± 0.77a9.28 ± 0.53a22.33 ± 0.84b
WT12.02 ± 0.72a13.2 ± 1.51a6.8 ± 0.66b21.75 ± 2.17b
DPvgstu2–2.199.89 ± 0.52a6.88 ± 0.64a2.46 ± 0.18a23.1 ± 1.24a
Pvgstu3–3.49.37 ± 0.37a6.01 ± 0.44a2.5 ± 0.17a22.7 ± 1.38a
WT10.85 ± 0.6a7.07 ± 0.83a2.17 ± 0.25a23.75 ± 1.11a
TPvgstu2–2.1910.5 ± 0.52a5.09 ± 0.144b5.6 ± 0.36b26 ± 1.64a
Pvgstu3–3.412.02 ± 0.52a6.65 ± 0.54a8.05 ± 0.42a27.69 ± 1.1a
WT10.45 ± 0.66a5.97 ± 0.49ab5.85 ± 0.36b24 ± 1.47a
DTPvgstu2–2.197.82 ± 0.7a3.28 ± 0.38b0.46 ± 0.05ab15.62 ± 1.33a
Pvgstu3–3.49.76 ± 0.58a5.06 ± 0.82ab0.64 ± 0.048a10.43 ± 1.91ab
WT9.82 ± 0.65a6.07 ± 0.47a0.65 ± 0.086a5 ± 0b
RecoveryPvgstu2–2.1910.42 ± 0.73ab4.82 ± 0.28a3.64 ± 0.14b23.4 ± 1.5a
Pvgstu3–3.48.8 ± 0.57b5.96 ± 0.41a5.8 ± 0.49a27.3 ± 3.35a
WT11.72 ± 0.64a5.36 ± 0.92a3.12 ± 0.47b26.5 ± 2.22a
Table 3. Annotation and DEGs (total number and percentages) of pathways (results were determined using KEGG) showing a representative list of the significantly enriched biological process of a) WT vs. Pvgstu3–3.4 in stress-free control (C) conditions (0 h) (groups 1 vs. 2, respectively); b) stress-free Pvgstu3–3.4 (C) vs. Pvgstu3–3.4 at 48 h under DT (groups 2 vs. 4, respectively); c) stress-free WT (C) vs. Pvgstu3–3.4 at 8 h under DT (groups 1 vs. 3, respectively).; d) stress-free WT (C) vs. Pvgstu3–3.4 at 48 h under DT (groups 1 vs. 4, respectively). DT indicates combined drought and heat stresses.
Genotype/TreatmentPathway AnnotationDEGsGenes
Total Number (566)%Total Number (21,512)%
WT vs. Pvgstu3–3.4
under stress-free conditions (C)
Metabolic pathways13924.56%394418.33%
MAPK signaling pathway346.01%7683.57%
NF-kappa B signaling pathway315.48%5282.45%
Arachidonic acid metabolism142.47%1420.66%
Tryptophan metabolism142.47%2010.93%
Peroxisome142.47%2971.38%
Retinol metabolism122.12%1810.84%
Glycerophospholipid metabolism111.94%1720.80%
Linoleic acid metabolism101.77%890.41%
Amino sugar and nucleotide sugar metabolism101.77%1620.75%
Glycerolipid metabolism91.59%1230.57%
Metabolism of xenobiotics by cytochrome P45091.59%1380.64%
Steroid hormone biosynthesis81.41%980.46%
Phospholipase D signaling pathway81.41%1310.61%
Phenylalanine metabolism61.06%910.42%
Total Number (668)%Total Number (21,512)%
Stress-free WT (C) vs. Pvgstu3–3.4 under 8 h (DT)Metabolic pathways17426.05%394418.33%
Starch and sucrose metabolism202.99%2821.31%
amino sugar and nucleotide sugar metabolism182.69%1620.75%
Galactose metabolism142.10%1360.63%
Arachidonic acid metabolism142.10%1420.66%
Retinol metabolism142.10%1810.84%
Metabolism of xenobiotics by cytochrome P450131.95%1380.64%
Tryptophan metabolism131.95%2010.93%
Linoleic acid metabolism91.35%890.41%
Glycine, serine and threonine metabolism81.20%910.42%
Steroid hormone biosynthesis81.20%980.46%
Total Number (1588)%Total Number (21,512)%
Stress-free WT (C) vs. Pvgstu3–3.4 under 48 h (DT)Metabolic pathways39524.87%394418.33%
Carbon metabolism553.46%5622.61%
Biosynthesis of amino acids402.52%3741.74%
Starch and sucrose metabolism392.46%2821.31%
Tryptophan metabolism281.76%2010.93%
Arachidonic acid metabolism271.70%1420.66%
Amino sugar and nucleotide sugar metabolism261.64%1620.75%
Retinol metabolism261.64%1810.84%
Metabolism of xenobiotics by cytochrome P450241.51%1380.64%
Glycolysis/gluconeogenesis241.51%2080.97%
Glyoxylate and dicarboxylate metabolism241.51%2241.04%
Galactose metabolism201.26%1360.63%
Folate biosynthesis171.07%1330.62%
RNA polymerase161.01%1160.54%
Phospholipase D signaling pathway161.01%1310.61%
Total Number (3967)%Total Number (21,512)%
Stress-free Pvgstu3–3.4 (C) vs. Pvgstu3–3.4 at 48 h (DT)Metabolic pathways85321.50%394418.33%
Carbon metabolism1363.43%5622.61%
Endocytosis972.45%4432.06%
Biosynthesis of amino acids862.17%3741.74%
ABC transporters842.12%2851.32%
Apoptosis842.12%3791.76%
Peroxisome751.89%2971.38%
Pyruvate metabolism711.79%3111.45%
Starch and sucrose metabolism691.74%2821.31%
Necroptosis641.61%2261.05%
Glycolysis/gluconeogenesis551.39%2080.97%
Glyoxylate and dicarboxylate metabolism551.39%2241.04%
Citrate cycle (TCA cycle)551.39%2411.12%
RNA degradation531.34%2311.07%
Drug metabolism—other enzymes511.29%1830.85%
Base excision repair501.26%1950.91%
Tryptophan metabolism491.24%2010.93%
Arachidonic acid metabolism471.18%1420.66%
Retinol metabolism431.08%1810.84%
Metabolism of xenobiotics by cytochrome P450401.01%1380.64%
Table 4. Top 15 representative transcription factors (TFs) and the number of up- and downregulated genes in response to stress-free (C) conditions and combined drought and heat stress (DT) at 48 h in WT and Pvgstu3–3.4 transgenic plants.
TFsWT (C)/Pvgstu3–3.4 (C)WT (C)/Pvgstu3–3.4 (DT) 48 hPvgstu3–3.4 (C)/(DT) 48 h
No. of Up-
Regulated
No. of Down-
Regulated
No. of Up-
Regulated
No. of Down-
Regulated
No. of Up-
Regulated
No. of Down-
Regulated
MYB271366338756
mTERF-216-794
MYB-related131247307040
FAR13-25-514
MADS121353711
AP2-EREBP5349298632128
NAC12722243130
Trihelix--212284
ARF11762317
HSF31015131827
ARR-B--2-13-
WRKY21321254871
bZIP-49685
SBP--2787
Sigma70-like--5-8-
Table 5. Metabolites that were significantly (p < 0.05) altered in the different genotypes under combined drought and heat stress and control conditions. Positive values indicate fold-increase, whereas negative values fold-decrease.
Pvgstu3–3.4 (DT)/WT (DT)Pvgstu3–3.4 (C)/WT (C)
MetabolitesLog2-Fold ChangeMetabolitesLog2-Fold Change
Arginine20.5Glycerol2.2
Fructose5.3Quinic acid1.2
Glucose4.0Ethanolamine0.7
Glycine3.2Sucrose−0.4
Pantothenate3.1Fructose−0.6
Myoinisitol2.9Glucose−0.8
Threonic acid2.3Myoinisitol−0.8
Tyrosine2.2Glutamic acid−0.8
Sorbitol2.1Nicotine−0.9
Phenylethanolamine1.8Malic acid−0.9
Sucrose1.6beta_Alanine−0.9
Xylose1.4Isoleucine−0.9
Proline1.3GABA−1.0
Threonine0.6Glycine−1.0
Arabinose−0.3Arabinose−1.0
Meso_eryrthitol−0.3Proline−1.0
Glycerol−0.5Sorbitol−1.0
Phenylalanine−0.5Glyceric acid−1.0
Ethanolamine−0.5Valine−1.0
Serine−0.6Phenylalanine−1.0
Glutamine−0.7Threose−1.0
Alanine−0.9Oxoproline−1.0
beta_Alanine−0.9Mannitol−1.0
Lysine−0.9
GABA−0.9
Galactose−1.0
Tryptophan−1.0
Table 6. Plant material used for RNA extraction and transcriptomics analysis with of the WT and Pvgstu3–3.4 transgenic line with 2 and 6 biological replicates, respectively, under stress-free and DT combined stress conditions at different time points.
GenotypeTreatmentAnalysis group
WTControl; 0 hGroup 1
Pvgstu3–3.4Control; 0 hGroup 2
DT combined stress; 8 hGroup 3
DT combined stress; 48 hGroup 4
Publisher’s Note: MDPI stays neutral with regard to jurisdictional claims in published maps and institutional affiliations.

