Article

A Toxicity Prediction Tool for Potential Agonist/Antagonist Activities in Molecular Initiating Events Based on Chemical Structures

Department of Medical Molecular Informatics, Meiji Pharmaceutical University, 2-522-1 Noshio, Kiyose, Tokyo 204-8588, Japan
*
Author to whom correspondence should be addressed.
Int. J. Mol. Sci. 2020, 21(21), 7853; https://doi.org/10.3390/ijms21217853
Submission received: 31 July 2020 / Revised: 7 October 2020 / Accepted: 21 October 2020 / Published: 23 October 2020
(This article belongs to the Special Issue QSAR and Chemoinformatics in Molecular Modeling and Drug Design 2.0)

Abstract

:
Because the health effects of many compounds are unknown, regulatory toxicology must often rely on the development of quantitative structure–activity relationship (QSAR) models to efficiently discover molecular initiating events (MIEs) in the adverse-outcome pathway (AOP) framework. However, the QSAR models used in numerous toxicity prediction studies are publicly unavailable, and thus, they are challenging to use in practical applications. Approaches that simultaneously identify the various toxic responses induced by a compound are also scarce. The present study develops Toxicity Predictor, a web application tool that comprehensively identifies potential MIEs. Using various chemicals in the Toxicology in the 21st Century (Tox21) 10K library, we identified potential endocrine-disrupting chemicals (EDCs) using a machine-learning approach. Based on the optimized three-dimensional (3D) molecular structures and XGBoost algorithm, we established molecular descriptors for QSAR models. Their predictive performances and applicability domain were evaluated and applied to Toxicity Predictor. The prediction performance of the constructed models matched that of the top model in the Tox21 Data Challenge 2014. These advanced prediction results for MIEs are freely available on the Internet.

Graphical Abstract

1. Introduction

Quantitative structure–activity relationship (QSAR) analysis is a technique used to predict the physiological activity of low-molecular-weight compounds based on their molecular structure [1,2]. In the field of toxicology, QSAR methodology is used for quantitative structure–toxicity relationship (QSTR) modeling using complex toxicity and adverse effect onset mechanisms that are objective variables [3,4].
An in silico approach, such as QSTR, is time and cost-effective for the detection of the potential toxicity of compounds in the early phases of drug development and pharmacovigilance, satisfying global ethical requirements regarding the 3R rules [5,6,7]. QSTR has therefore been extensively applied to regulatory toxicology. Recently, the critical application issue of realizing the implementation of toxicity prediction models extensively and of putting them to practical use has emerged. However, currently, one missing but desirable functionality in the practical use of QSTR prediction is that resources, such as the toxicity prediction models, should be distributed as highly convenient public software. Therefore, these toxicity prediction models should be published so that users can access QSTR prediction models for various toxicity targets [8,9,10].
The Toxicology in the 21st Century (Tox21) program is a consortium constituted by the National Institute of Health, the US Environmental Protection Agency, the National Toxicology Program, the National Center for Advancing Translational Sciences, and the Food and Drug Administration [11]. This project develops and evaluates novel efficient methods for toxicity assessments and mechanistic insights in addition to reducing time, costs, and animal usage [11,12]. Furthermore, in the ToxCast and Tox21 programs, for potentially molecular initiating event (MIE) targets for adverse outcome pathways [13,14], the in vitro quantitative high-throughput screening (qHTS) of approximately 10,000 compounds was performed [15]. These targets include nuclear receptors (NRs) and stress response (SR) pathways. Endocrine-disrupting chemicals (EDCs) interfere with the endocrine system by interacting with NRs and SR pathways and engender myriad adverse developmental, reproductive, neurological, and immunological effects in both humans and wildlife [16,17]. Therefore, identifying potential EDCs is of specific interest for the Tox21 program and environmental chemical hazard screening in general.
However, the in vitro qHTS assay is insufficient to screen all classes of chemicals, such as those still in the molecular development and optimization phase and, thus, cannot provide an accurate evaluation of the potential toxicity of chemicals in humans and the environment [18]. Therefore, a growing interest exists in a comprehensive in silico approach to detect the potential toxicity of chemicals. The literature presents the results of successful examples of alternative in silico toxicity screening methods and their applications using the Tox21 10K library [19,20,21]. However, even though there are 59 types of well-confirmed assay results of agonist/antagonist activities for toxicity targets in the Tox21 10K library, several studies have built models for only a small number of toxicity targets. There is still no comprehensive approach. Furthermore, because these models had not been opened, other researchers could not access the available constructed models. Therefore, users have found it challenging to perform and reuse the prediction of MIEs.
In this study, we overcame this problem by extensively collecting and processing databases of 59 types of assay targets based on the Tox21 10K library and constructed in silico toxicity prediction models for each assay target using XGBoost [22], which is a gradient-boosting algorithm with multiple uses for toxicity predictions [23]. The predictive performance of all models was validated and published on the web application. Using the prediction models constructed in this study, the screening of the potential toxicity of chemicals to various toxicity targets is possible.

2. Results and Discussion

2.1. Distributions of Active and Inactive Compounds

The PubChem activity scores were normalized between 0 and 100 using the following equation: activity = ((VcompoundVDMSO)/(VposVDMSO)) × 100, where Vcompound, VDMSO, and Vpos denote the compound-well value, the median value of the DMSO-only wells, and the median value of the positive-control well, respectively [24]. The most active and inactive results have scores close to 100 and 0, respectively. In the PubChem documentation, all inactive compounds have a score of 0, active compounds have scores between 40 and 100, and inconclusive compounds have scores between 5 and 30. To implement the binary classification models, the binary teacher labels of active or inactive compounds were defined in two ways. In one definition, active compounds were scored 40 or higher; in another definition, active compounds were assigned scores of 1 or higher.
We converted PubChem activity scores to binary labels using the two definitions of a criterion of 40 and a criterion of 1 to implement binary classification models for 59 toxicity targets. Figure 1a shows the number of active and negative compounds based on the definition of a criterion of 40, and Figure 1b shows that of a criterion of 1. For all toxicity targets, when we converted PubChem activity scores to binary labels with the definition of a criterion of 40, the mean ratio of active compounds to all compounds was 4.7% ± 4.0% and that of a criterion of 1 was 18.1% ± 11.0%. Lowering the criteria from 40 to 1 increased the mean ratio of active compounds by approximately 13.4%. However, when annotated with the criteria of 40, the ratio of active compounds in VDR_ago (PubChem activity score ID (AID): 743241), NFkB_ago (AID: 1159518), and TGFb_ago (AID: 1347035) were lower than 1%.

2.2. Models and Performances

For the 59 individual targets, 10% of all compounds was assigned to the test set. The other 90% of the compounds was used for the optimization, training, and validation of models in the validator, as shown in Section 3.5. The predictive performances of the constructed models were evaluated based on the area under the curve (AUC) of the receiver operating characteristic (ROC) curve in the test set. Optimal thresholds to convert the prediction probability to a binary class output were calculated using the Youden index gained from the ROC curve in the test set. Using these thresholds, predictive performances in the test set were evaluated. Table 1 shows the results of the test set. Model performances in the test set were evaluated using the metrics of AUC, sensitivity (SE), specificity (SP), accuracy (ACC), balanced accuracy (BAC), and the Matthews correlation coefficient (MCC). Figure 2 and Figure 3 show the ROC curves for all toxicity targets in the test set in the cases of criteria 40 and 1, respectively. In both cases in which the active labels were annotated with a criterion of 40 and 1, Table 2 summarizes the averages of predictive performances in the test set. Good predictive performances were observed for the models regardless of the criteria. However, for VDR_ago (AID: 743241), HIF1_ago (AID: 1224894), and Shh ago (AID: 1259390), which were annotated by a criterion of 40, the ratios of active compounds in the test set were 0%, 0.42%, and 0.62% and the AUC values were N.D., 0.556, and 0.571, respectively.
The classification performance of models tends to deteriorate because of class distribution imbalance [25]. A between-class imbalance degrades the prediction performance because of the bias in the prediction results toward the majority class, leading to more prediction errors in the minority class [26]. Figure 1 shows a sparser distribution of active compounds and an imbalance in the case of using a criterion of 40 compared to a criterion of 1. In this study, as shown in Figure 1 and Table 1, because of the between-class imbalance caused by the criteria of 40, constructing and evaluating some toxicity prediction models was impossible. We managed this problem by lowering the criteria from 40 to 1, and with this, we could evaluate the constructed models.
When using labels annotated by the criteria of 1, all compounds were treated as active, except those ensured to be inactive, which had a PubChem activity score of 0. Therefore, using the criterion of 1 in order to develop the models, we concluded that we developed criterion 1 models that accurately learned the inactive compounds compared with criterion 40 models. On the other hand, Judson et al. reported that a phenomenon called cytotoxicity-associated “burst” was observed for tests conducted on the Tox21 program [27]. Many chemicals show the activation of large numbers of assays over a narrow range of concentrations in which cell stress and cytotoxicity are also observed. Therefore, some of the assay activity in this concentration range may represent nonintentional chemical effects, such as cytotoxicity. Judson et al. [27] showed that the Tox21 10K library contains false positive responses induced by the burst phenomenon.
The quality of a machine learning model depends on that of the experimental data being fed into it. Ideally, machine learning models should be provided with reliable data for both active and inactive compounds during training; however, the current concern is that this decreases the number of active compounds being trained and increases the between-class imbalance in the data set being fed into the model. Consequently, the identification of burst compounds in our models has not yet been examined. Therefore, our models are still limited in terms of their ability to successfully feed the training data; particularly, their ability to exactly identify real active compounds remains a challenge. Importantly, the active compounds identified using our predictive models may actually be inactive. However, our models have learned nontoxic compounds more exactly than other approaches, and the ability to identify real negative compounds could be promising. A toxicity prediction model in the field of drug discovery must determine nontoxic compounds as well as must be capable of accurately determining toxic compounds; thus, our tool could practically aid in toxicity assessment application.

2.3. Comparison with the Tox21 Data Challenge 2014

For further validation of the predictive performance of the models established in this study, we compared their performance with the predictive models built in the Tox21 Data Challenge. The Tox21 Data Challenge 2014 was designed to understand the interference of the chemical compounds derived from the Tox21 10K library in the biological pathway using a crowd-sourced data analysis conducted by independent researchers. This challenge used data generated from seven NR and five SR signaling pathway assays to construct prediction models for QSARs [28].
There were 10 duplicate AIDs in the dataset used for in this challenge and in this study: AhR_ago (AID: 743122), Arlbd_ago (AID: 743053), ERlbd_ago (AID: 743077), Arom_ant (AID: 743139), PPAR-γ_ago (AID: 743140), ARE_ago (AID: 743219), ATAD5_ind (AID: 720516), HSR_act (AID: 743228), MMP_disr (AID: 720637), and p53_ago (AID: 720552). For construction of a model for each of these toxicity targets, the compounds used in this work overlapped with those used in the Tox21 Data Challenge. Moreover, the active and inactive compounds used in this work were defined using the annotation method based on the criteria of 40 and showed a 98.7% ± 0.7% match with the active and inactive compounds used in the challenge and showed strong concordance overall.
The allocations of the test sets used in the Tox21 Data Challenge were different from those used in this study. Therefore, a simple comparison using the predictive performance of the models used in the Tox21 Data Challenge and that constructed in this study is impossible. However, in this study, we established predictive models for the 10 duplicate toxicity targets using the equivalent compounds and teacher labels to those of the challenge. Therefore, the results of this challenge could be a performance benchmark to discuss the predictive performance of models built for the same targets in this study.
The AUC has been adopted as a primary metric for ranking model performance in the Tox21 Data Challenge; therefore, the predictive models in the Tox21 Data Challenge have been ranked based on the AUC [29]. The AUCs in the test set validated in this study are shown in Figure 4. Although the predictive performances of models for four toxicity targets, i.e., models for AhR_ago (AID: 743122), ERlbd_ago (AID: 743077), MMP_disr (AID: 720637), and HSR_act (AID: 743228), achieved over an AUC of 0.750 and an accuracy score of over 0.846, their predictive performances were lower than that of the Tox21 Data Challenge models. On the other hand, six predictive models showed high AUCs: 0.878 (Arlbd_ago, AID: 743053), 0.801 (Arom_ant, AID: 743139), 0.813 (PPARg_ago, AID: 743140), 0.785 (ARE_ago, AID: 743219), 0.840 (ATAD5_ind, AID: 720516), and 0.899 (p53_ago, AID: 720552). The predictive performances for these six targets were comparable to or better than those of the top models of the Tox21 Data Challenge. Therefore, the results indicate that several predictive models developed in this study were valid toxicity models for in silico screening with high accuracy.

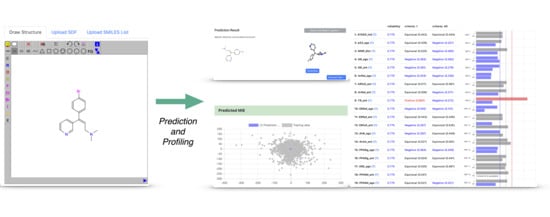
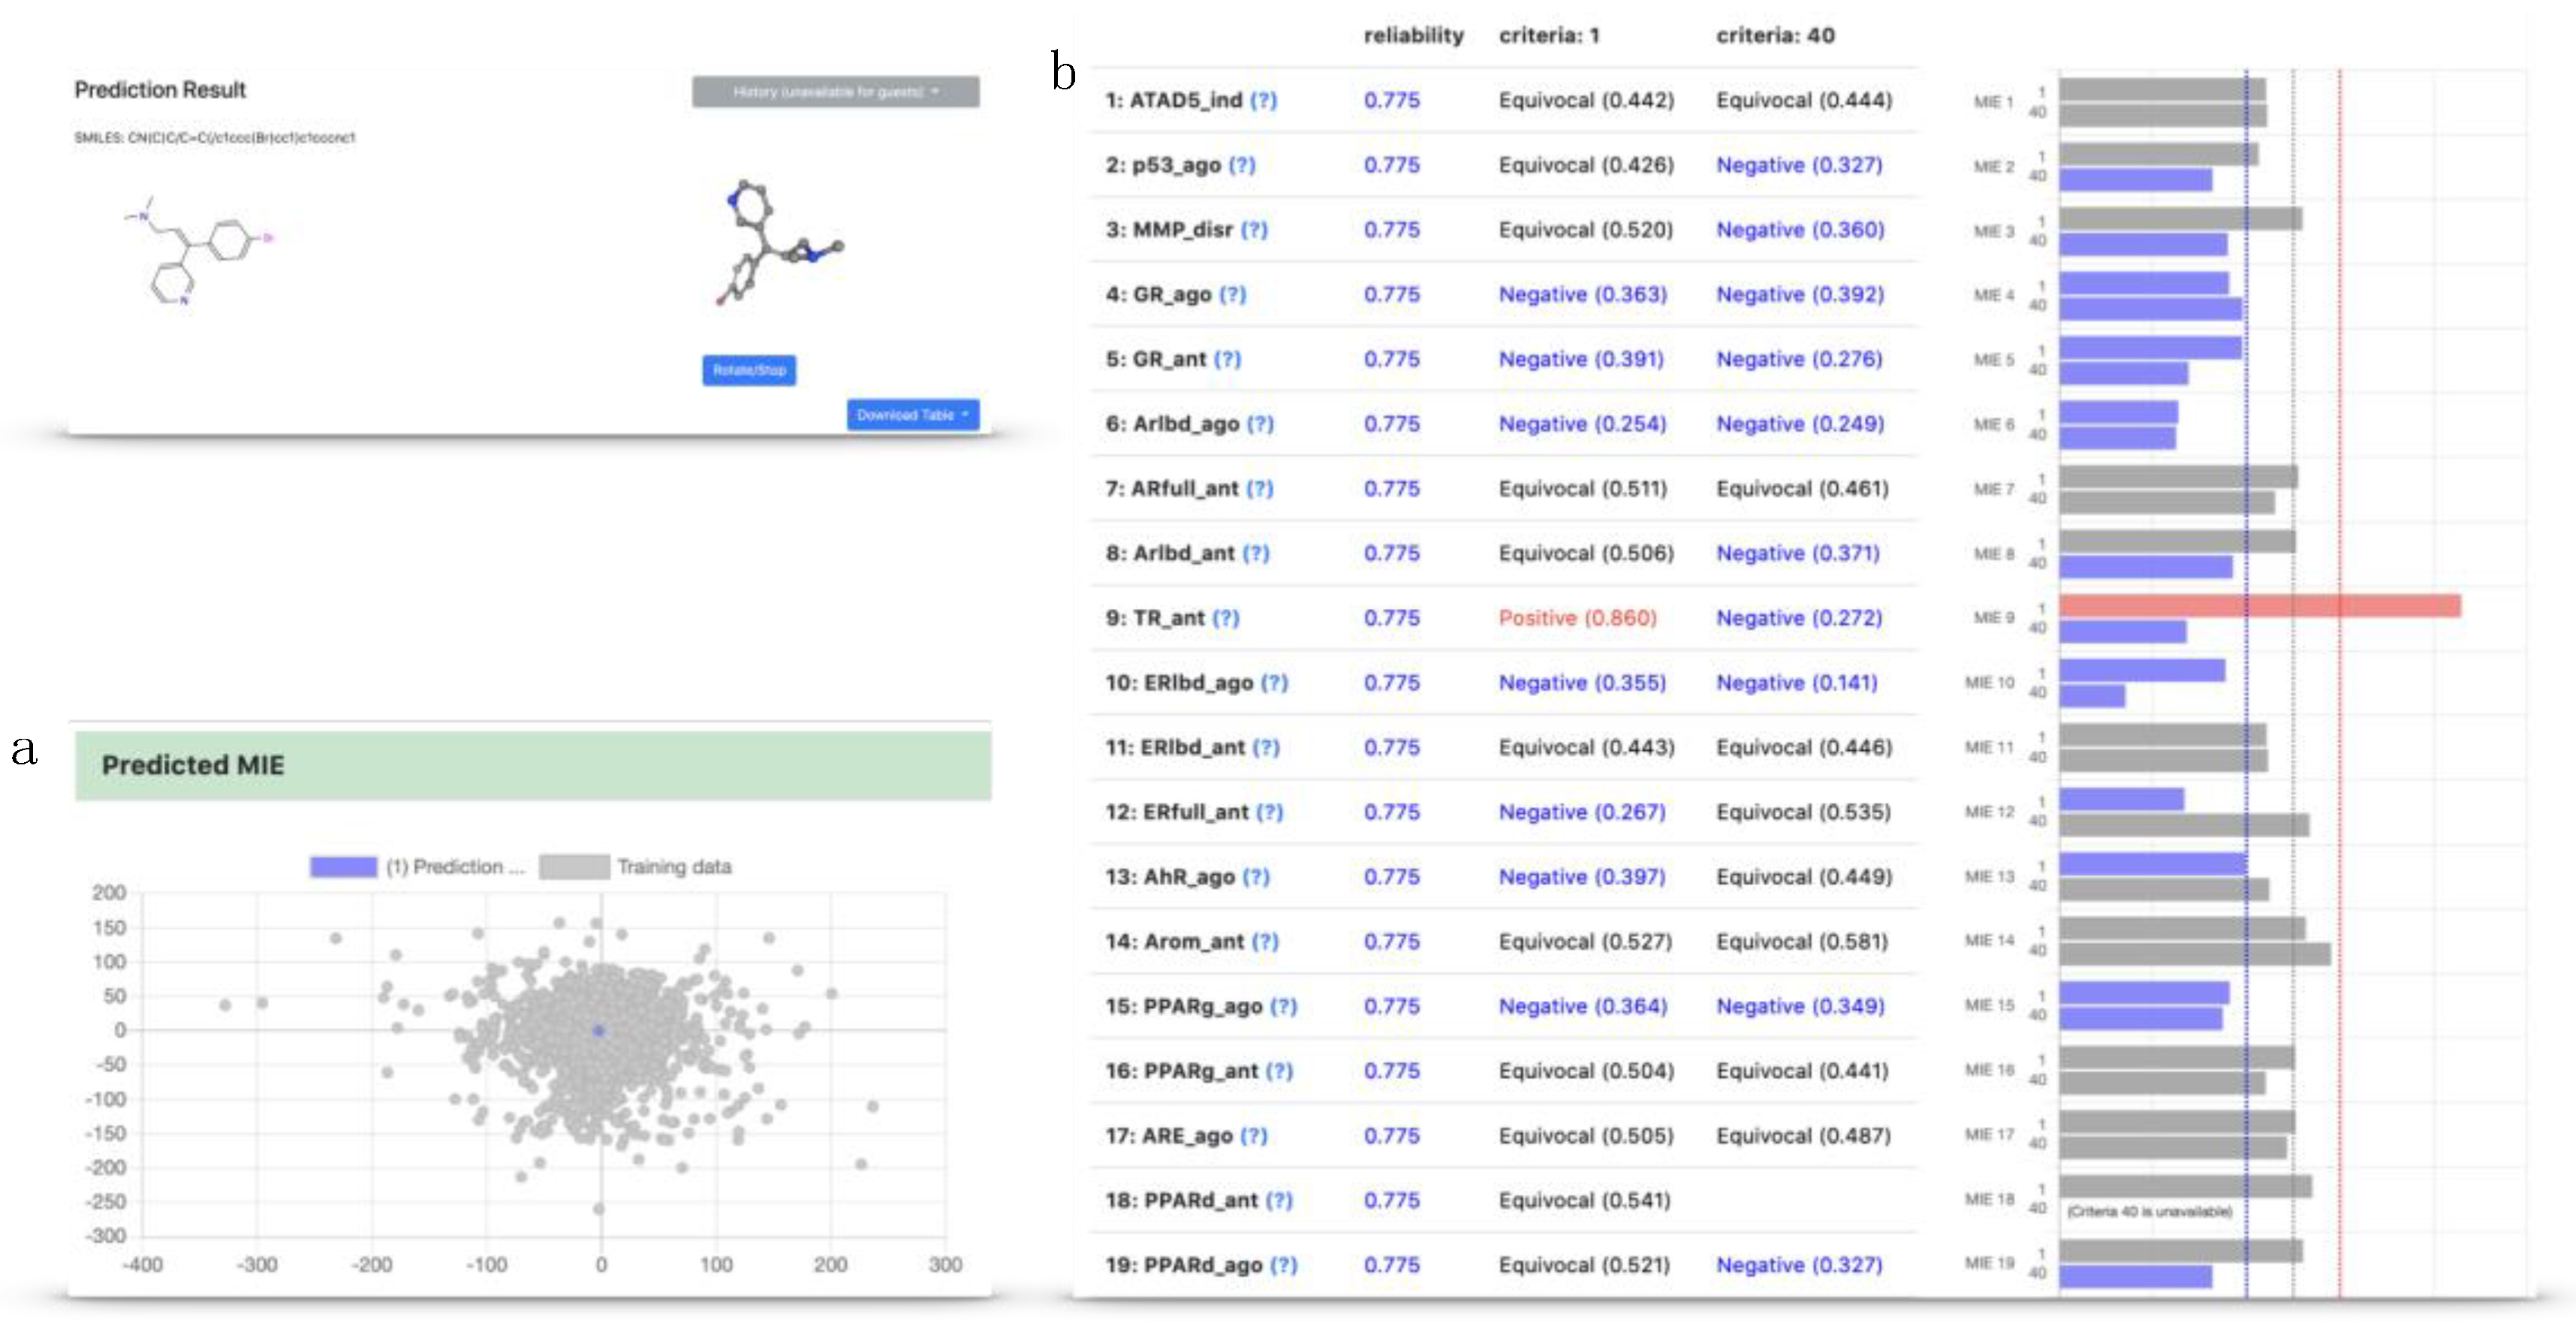
2.4. Implementation of the Models in the Toxicity Predictor

All 118 (two criteria for each of the 59 toxicity targets) models were implemented as part of Toxicity Predictor, which is a web application for the prediction of drug-induced liver injury. The Toxicity Predictor web application was constructed by the Development of a Drug Discovery Informatics System project in the Japan Agency for Medical Research and Development (AMED) and is available at http://mmi-03.my-pharm.ac.jp/tox1/. This application uses an input file containing one or multiple QSAR-ready structures in simplified molecular-input line-entry system (SMILES) strings or SDF format. Furthermore, it can depict a structural formula drawn in the browser and can use it as an input. The molecular structure from the input file is converted to a three-dimensional (3D) structure by the three-dimensionalization algorithm used in this study (Figure 5). Next, Toxicity Predictor calculated the necessary descriptors for the requested models using Mordred, an open-source software application used to calculate molecular descriptors. Finally, Toxicity Predictor predicted the chemical toxicity of 59 targets using the models constructed in this study. The prediction results of the input compound for the toxicity targets were converted to inactive or active, were returned, and can be viewed in a terminal browser (Figure 6b). Furthermore, the 3D structures and prediction results for all MIEs can be downloaded in SDF and CSV formats, respectively.
A model can be evaluated locally only within its applicability domain (AD), which is the chemical space of the training set [30,31]. Any extrapolation outside of that specific area of the structure space is most probably unreliable. Therefore, the system of the toxicity predictor incorporates domain evaluation to ensure the reliability of the QSTR inference. The AD of the evaluation compound is defined using the average of the logarithmic values of the Euclidean distance with the five nearest molecules in the descriptor space and is expressed numerically as reliability in Toxicity Predictor. Furthermore, the chemical structure is assessed to evaluate if it falls within the AD of the training set chemical space, and its position in the training set chemical space can be visualized and confirmed by principal component analysis (Figure 6a).
From the platform, entering the compounds for prediction and describing the chemical structure formula from an input format such as SMILES strings or SDF format is possible. The compound to be predicted is three-dimensionalized based on the algorithm in “Conformations and Descriptors”, and descriptors are calculated.

3. Materials and Methods

3.1. Biological Overview of Modeled MIEs

We outline the toxicological meanings of the endpoints established in our model construction research. The following cellular targets and their interactions with agonists and antagonists can be potential MIEs associated with diverse toxicological adverse outcomes (Tables S1 and S2).
AhR. The aryl hydrocarbon receptor (AhR), a member of the family of basic helix–loop–helix transcription factors, is crucial for the adaptation of responses to environmental changes. AhR is a ligand-activated transcription factor that is known to mediate most of the toxic and carcinogenic effects of various environmental contaminants such as polyaromatic hydrocarbons and dioxin [32].
GR. The glucocorticoid receptor (GR) is a member of the nuclear receptor family of ligand-dependent transcription factors. GR plays a critical role in carbohydrate, protein, and lipid metabolism and programmed cell death [33].
AR. The androgen receptor (AR), a nuclear hormone receptor, is significant in AR-dependent prostate cancer and other androgen-related diseases. EDCs and their interactions with steroid hormone receptors, such as AR, may disrupt normal endocrine function and interfere with metabolic homeostasis, reproduction, and developmental and behavioral functions [34].
ER and ERRs. The estrogen receptor (ER), a nuclear hormone receptor, plays an important role in development, metabolic homeostasis, and reproduction. Two subtypes of ER, ER-α and ER-β, are composed of various functional domains and have several structural regions in common [35]. EDCs and their interactions with steroid hormone receptors, such as ER, disrupt normal endocrine function. However, estrogen-related receptors (ERRs), the orphan nuclear receptors, are crucial in cellular energy metabolism control. ERR-α is a member of the NR superfamily, and studies have linked it with various cancers. In endocrine-related cancers, such as breast cancer, ERR-α regulates numerous target genes that direct cell proliferation and growth independent of ER-α [36].
PR. The progesterone receptor (PR), a nuclear hormone receptor, influences development, metabolic homeostasis, and reproduction. EDCs tend to bind to PR and disrupt normal endocrine function [37].
Aromatase. Aromatase catalyzes the conversion of androgen to estrogen and is vital in maintaining the androgen and estrogen balance in many EDC-sensitive organs [38].
TRHR. Thyrotropin-releasing hormone (TRH) receptor (TRHR) is a G-protein-coupled receptor (GPCR) that binds the tripeptide thyrotropin-releasing hormone. TRHR is found in the brain and, when bound by TRH, acts to increase the intracellular inositol trisphosphate through phospholipase C. It plays a crucial role in the anterior pituitary as it controls the synthesis and secretion of thyroid-stimulating hormone and prolactin [39].
TSHR. TSHR is a GPCR for thyrotropin (thyroid-stimulating hormone or TSH), which is a member of the glycoprotein hormone family. TSH is released by the anterior pituitary gland and is the main regulator of thyroid gland growth and development [40].
TR. Thyroid receptor (TR), a nuclear hormone receptor, plays an important role in normal brain development, metabolism control, and many aspects of normal adult physiology. A large number of industrial chemicals reduce circulating levels of thyroid hormone [41,42].
PPARs. Peroxisome proliferator-activated receptors (PPARs) are lipid-activated transcription factors of the NR superfamily with three distinct subtypes, namely PPAR-α, PPAR-δ (also called PPAR-β), and PPAR-γ. All these subtypes heterodimerize with Retinoid X receptor (RXR), and these heterodimers regulate the transcription of various genes. PPAR-γ receptor is involved in the regulation of glucose and lipid metabolism. The function of PPAR-δ includes the regulation of cholesterol and lipid metabolism [43].
FXR. Farnesoid X receptor (FXR), a member of the NR superfamily, is identified as a receptor of bile acids. It is found in large amounts in the liver, intestine, kidney, and adrenal cortex. FXR binds to FXR-response elements of DNA as a monomer or heterodimer with a common partner for NRs, RXR, to regulate the expression of the diverse genes involved in the metabolism of bile acids, lipids, and carbohydrates. Numerous studies have reported that FXR agonist is favorable for liver regeneration and hepatocarcinogenesis [44,45].
CAR. The constitutive androstane receptor (CAR) is a nuclear receptor that regulates gene expression for multiple drug-metabolizing enzymes and transporters, which are important factors in the metabolism of drugs or xenobiotics. CAR activation leads to the upregulation of organic anion transporting polypeptide (OATP) transporters—that is, hepatic uptake transporters—together with the upregulation of cytochrome P450 (CYP) and UDP-glucuronosyltransferases (UGT) enzymes [46].
PXR. Pregnane X receptor (PXR) regulates the expression of several drug-metabolizing enzymes, such as CYP3A4. The induction of these proteins is a major mechanism for developing drug resistance in cancer [47].
RAR. Retinoic acid receptor (RAR) is a nuclear receptor that regulates the development of chordate animals, including the body axis, spinal cord, forelimbs, heart, eye, and reproductive tract. Retinoic acid (RA) is derived from retinol (vitamin A) as a metabolic product and functions as a ligand for nuclear RARs. These RARs bind target genes as heterodimer complexes with RXRs at a DNA sequence known as the RA response element. Interference with RA signaling can have potential adverse effects on embryonic development [48].
ROR-γ. Nuclear receptor retinoic acid receptor-related orphan receptor gamma (ROR-γ) is a key transcription factor for the pathogenesis of autoimmune diseases mediated by Th17 cells. Because of the essential role of ROR-γ in controlling the differentiation and functioning of Th17 cells, interference with ROR-γ signaling pathways may promote susceptibility to immunotoxicants and autoimmune diseases.
RXRs. Retinoid X receptors (RXRs), with three distinct subtypes, namely RXR-α, RXR-β, and RXR-γ, occupy a central position in the NR superfamily, as they are common heterodimerization partners for several members of the human NRs, including PPARs, PXR, CAR, RARs, FXR, and TRs [49]. RXR-α has a potential role in metabolic signaling pathways, skin alopecia, dermal cysts, cardiac development, and insulin sensitization [50].
VDR. Vitamin D receptor (VDR), a member of the nuclear hormone receptor superfamily, plays a critical role in calcium homeostasis and bone metabolism [51].
ARE. The Nrf2–ARE pathway is an intrinsic mechanism of defense against oxidative stress. Nuclear factor E2-related factor 2 (Nrf2) is a transcription factor that induces the expression of target genes involved in the amelioration of oxidative stress by binding to the antioxidant response element (ARE) [52]. Oxidative stress can activate various transcription factors including NF-κB (nuclear factor-kappa B), AP-1 (activator protein-1), Nrf2, hypoxia-inducible factor-1 (HIF-1α), p53, and PPAR-γ. It can lead to chronic inflammation, mediating most chronic diseases, including cancer, diabetes, cardiovascular diseases, neurological diseases, and pulmonary diseases [53].
NF-κB and AP-1. The Nuclear factor-kappa B (NF-κB) transcription factor family and activator protein-1 (AP-1) transcription family are known as key regulators of inducible gene expression in the immune system [54].
HIF-1. Hypoxia-inducible factor-1 (HIF-1) is a major transcription factor that regulates the cellular response in low-oxygen conditions. HIF-1 comprises two subunits, hypoxia-responsive HIF-1-α and HIF-1-β, and is known as the aryl hydrocarbon receptor nuclear translocator. Under hypoxic conditions, HIF-1-α and HIF-1-β form a heterodimer. The HIF-1 complex translocates into the nucleus, binds to the hypoxia-responsive element (HRE), and activates the expression of target genes, such as vascular endothelial growth factor (VEGF). The HIF-1 pathway is essential for normal growth and development, and it is involved in the pathophysiology of cancer and inflammation [55].
p53. p53, a tumor suppressor protein, is activated following cellular insult, including DNA damage and other cellular stresses. The activation of p53 regulates cell fate by inducing DNA repair, cell cycle arrest, apoptosis, or cellular senescence. Therefore, the activation of p53 is a good indicator of DNA damage and other cellular stresses [56].
Casp. Caspases (Casps) involved in apoptosis are classified by their mechanism of action as initiator (caspase-2, -8, -9, and -10) and executioner caspases, classically described as the “executors of apoptosis” (caspase-3, -6, and -7). The inhibition of apoptosis results in numerous cancers, autoimmune diseases, inflammatory diseases, and viral infection [57].
HDAC. Histone deacetylases (HDACs) are a group of epigenetic enzymes that regulate gene expression by histone deacetylation. Histone acetylation plays a major and fundamental role in chromatin structure/function regulating eukaryotic gene expression, and it facilitates gene transcription and expression by relaxing the chromatin structure. HDAC inhibitors activate antitumor pathways through multiple action mechanisms, such as the activation of the apoptotic pathway and cell cycle arrest [58].
H2AX. One of the earliest cellular responses to DNA double-strand breaks is the phosphorylation at Ser139 of the core histone protein H2AX. This phospho-Ser139 serves as a sensitive biomarker for detecting such breaks, localizing the site of DNA repair [59].
HSR. Heat shock response (HSR) is a transcriptional response to elevated temperature shock, regulated by heat shock transcription factors (HSFs). The function of HSF-1, a well-studied target gene in HSR, is the protection of cells against proteotoxicity associated with misfolding, aggregation, and proteome mismanagement. While the induction of the HSR is specific to elevated temperature stress, a closely related cell stress response with HSF-1 is also induced when cells are exposed to other forms of environmental stress, such as oxidants, heavy metals, and xenobiotics, that cause protein damage and misfolding [60].
Shh. The hedgehog (Hh) pathway is crucial in many vital cellular processes, such as cell proliferation and differentiation during embryonic development. Three Hh genes discovered in vertebrates are Sonic Hedgehog (Shh), Indian Hedgehog (Ihh), and Desert Hedgehog (Dhh). Sonic Hedgehog protein (Shh) is the most widely found in adult tissues and is the most potent target. Therefore, chemicals that interfere with the Shh pathway are potential developmental toxicants [61].
TGF-β. Transforming growth factor-β (TGF-β) is a cytokine involved in various biological activities, including the regulation of proliferation, differentiation, and function of numerous cell types and the effects on glucose metabolism and fibrosis, in addition to its immunomodulatory function [62].
MMP. Mitochondrial membrane potential (MMP), a parameter for mitochondrial function, is generated by the mitochondrial electron transport chain that creates an electrochemical gradient. This gradient drives the synthesis of ATP, a crucial molecule for various cellular processes. Measuring MMP in living cells is commonly performed to assess the effect of chemicals on mitochondrial function [63].
ERsr. The endoplasmic reticulum (ER) plays a major role in the synthesis, folding, and structural maturation of proteins in the cell. If cells encounter conditions during which the workload imposed on the ER protein-folding machinery exceeds its capability, ER stress (ERsr) can occur. Under ERsr, secretory proteins start to accumulate in improperly modified and unfolded forms within the organelle [64].
ATAD5. Enhanced Level of Genome Instability Gene 1 (ELG1; human ATAD5) protein levels increase in response to various types of DNA damage. Thus, quantifying this activity can be used to identify the compounds that cause genetic stress [65].

3.2. Data Source

For this modeling study, data collection and processing work were conducted on the constructed toxic database based on Tox21. First, all datasets (training and test sets) of chemicals were downloaded in the SMILES format from the PubChem database, derived from the Tox21 program. We used a keyword for the database search, namely “Tox21 summary”, and selected bioassays of 59 toxicity targets, such as the NRs and SR pathways, to identify agonists/antagonists (Table 3). The toxicity scores (PubChem activity scores) of each toxic target were tied to the PubChem Substance IDs (SIDs). Finally, 14,250 compounds were used, but compounds with no activity score were excluded.

3.3. qHTS Data Analysis

The Tox21 10k library can rank the results of qHTS and prioritize hits according to PubChem activity scores. PubChem activity scores are assigned normalized scores between 0 and 100 for each PubChem activity score ID (AID). The most active results have scores closer to 100, and inactive scores are closer to 0. According to PubChem documentation, all inactive compounds have a score of 0, active compounds have scores between 40 and 100, and inconclusive compounds have scores between 5 and 30. In this study, to implement binary classification models, the binary labels of active or inactive compounds were adopted following two definitions: (1) Under the definition of a criterion of 40, compounds with scores from 40 to 100 were defined as active and those activity scores from 0 to 39 were defined as inactive. (2) Under the definition of a criterion of 1, compounds with scores from 1 to 100 were defined as active and those with activity scores of 0 were defined as inactive. In definition (1), only the compounds concluded to be active based on the Pubchem criterion were defined as active compounds, and the other compounds were defined as inactive even if they were inconclusive compounds. On the other hand, in definition (2), only the compounds concluded to be inactive based on the Pubchem criterion were defined as inactive compounds and the other compounds were treated as active compounds even if they were inconclusive compounds. In Figure 7, the scores highlighted in red show the active examples and other scores show inactive examples. Two types of binary label tables which denote active or inactive examples were created for the respective criteria.
The SIDs of the compounds used in this study are given in rows, and the AIDs are given in columns. The original table contains the original PubChem activity score of the compounds. In the table for the criteria of 40, the PubChem activity scores highlighted in red show the active examples for which the scores were larger than 40. In the table for the criteria of 1, the PubChem activity scores highlighted in red show active examples for which the scores were larger than 1.

3.4. Conformations and Descriptors

SMILES strings were cleaned and standardized (removing salts, counterions, and fragments and adjusting the protonation state (neutralize)) by RDkit, which is a Python library [66]. Optimal 3D structures were generated by following a calculation process to handle the calculation of excessive candidate compounds using an efficient and heuristic—though not strictly ideal—method. First, chemical structures were generated from the SMILES strings, and explicit hydrogen atoms were added to the chemical structures. Next, up to 200 types of 3D conformers were randomly generated. The energy minimization calculation was performed on them by the MMFF force field, and a conformer with minimal energy was adopted from 200 types of conformers. However, when this process lasted more than 60 s, instead of the above calculations, the conformer was generated using the ETKDG method [67] and the energy minimization calculation was performed on it by the MMFF force field [68]. Finally, the optimal conformer was converted into an SDF format.
Molecular descriptors were calculated for each compound using Mordred [69,70], a Python library; 2D and 3D descriptors were obtained; and finally, 1824 descriptors were adopted for model construction.

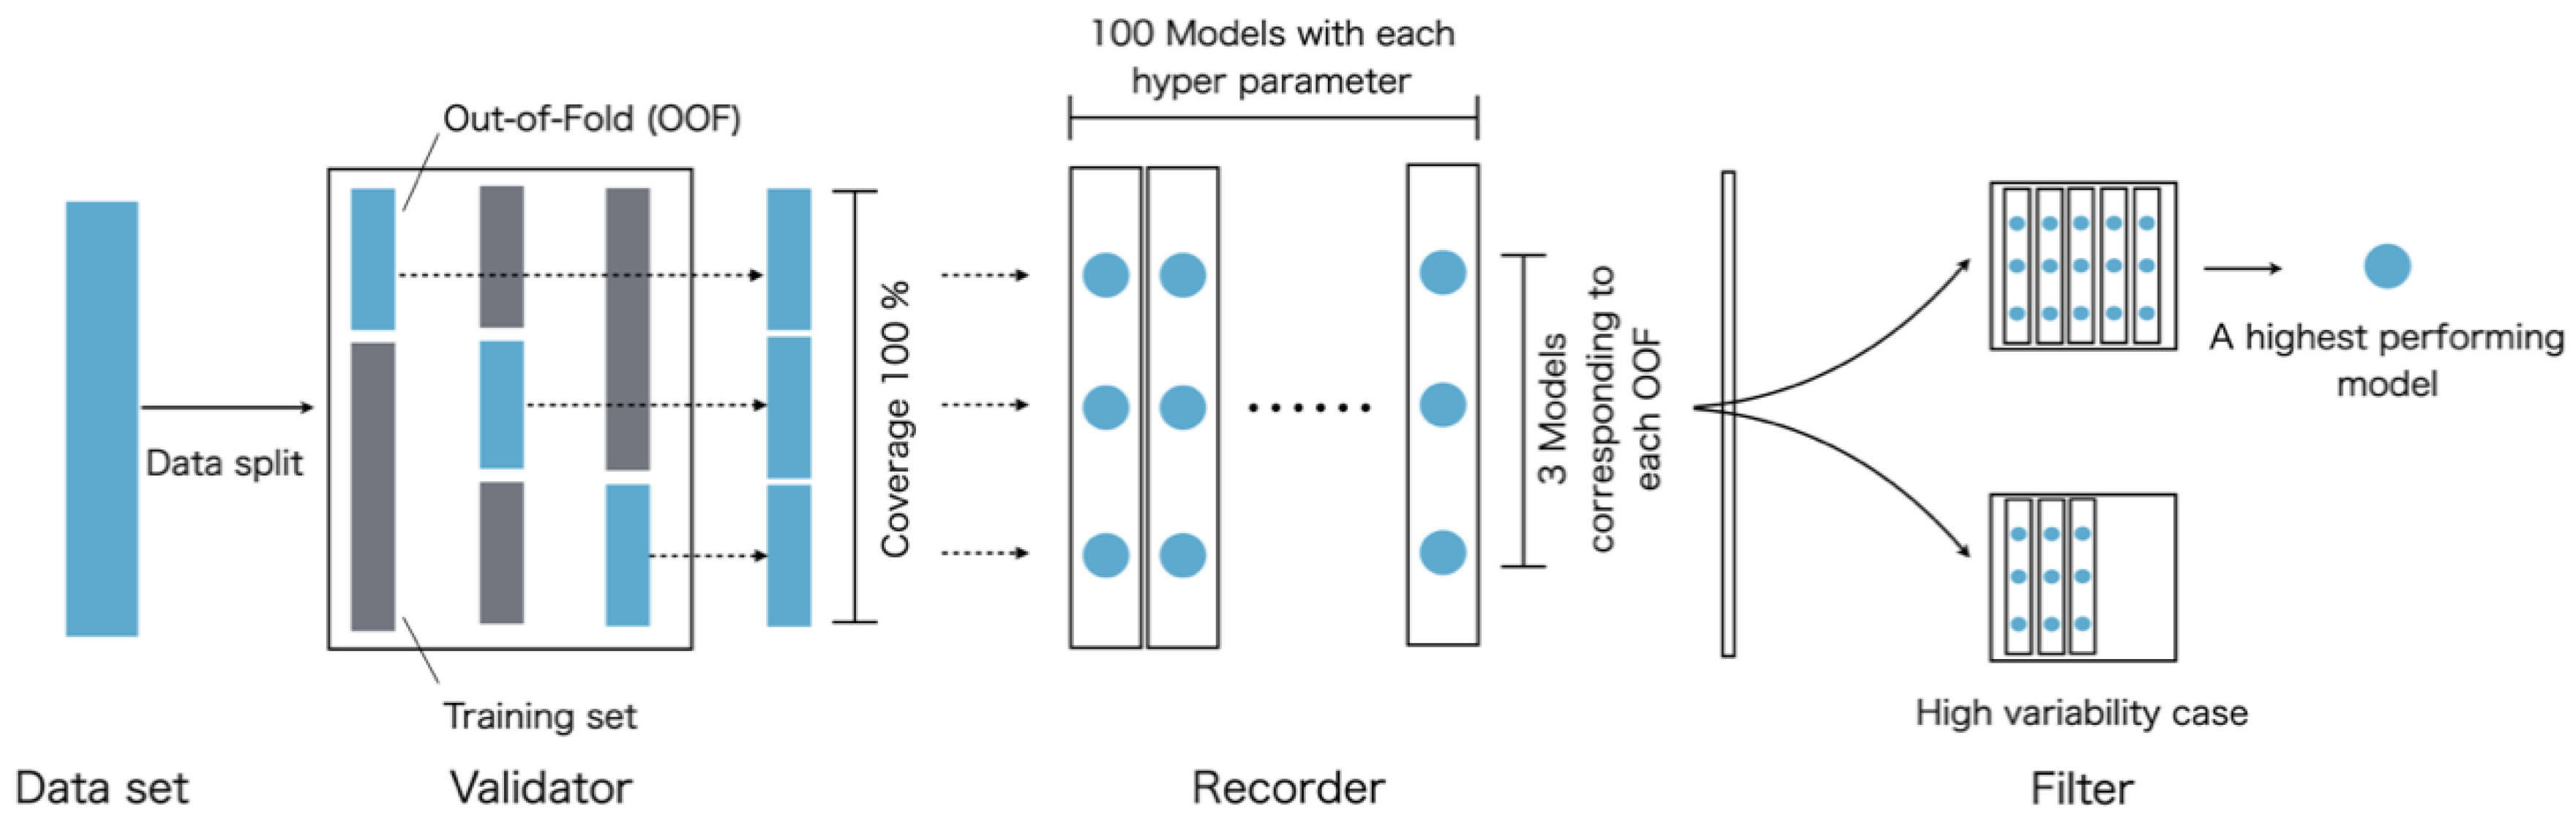
3.5. ML Algorithm and Modeling Scheme

Classification models based on Tox21 were developed using XGBoost. This algorithm was designed to be highly scalable by adopting a sparsity-aware algorithm for sparse data and a weighted quantile sketch for approximate tree learning [22]. In this study, the modeling scheme was designed to integrate the validator, recorder, and filter to gain a single model satisfying high-predictive performance and robustness (Figure 8). Further, 10% of all compounds was assigned to the test set without the data being fed into this pipeline. The compounds fed into the pipeline included 90% of all compounds obtained by excluding the test set, and these were used for the optimization, training, and validation of the models.
Validator. In the validator, hyperparameter exploration using a grid search was performed. ML models were trained and validated according to the respective grid-generated parameter values. One-third of the data fed into this validator was assigned to the validation set as out-of-fold (OOF) and two-thirds to the training set, where the predictive performance was validated using the hold-out method. Here, when assigning validation and training sets, extreme unlike distributions between the validation and training sets could occur by chance. Therefore, three patterns of allocations of OOF were generated, ensuring that it represented 100% coverage of the input data set and without duplication. For all pairs of validation training set allocations, the models were constructed using each grid-generated hyperparameter. They evaluated the predictive performance in the validation sets according to the ROC-AUC. The hyperparameter governing the performance of the XGBoost was explored within the following predefined ranges: learning rate (“learning_rate”: 100 types of values from 0.01 × 0 to 0.01 × 99).
Recorder. The recorder works as a record-keeper for the validator. The number of conditions to evaluate in the validator reached 300 patterns consisting of three OOFs and 100 hyperparameters. This recorder stored all prediction models constructed for the respective conditions, their modeling conditions, and the predictive performances in the OOFs.
Filter. The filter eliminates some overfitting cases while selects the models with the highest predictive performance from the information stored in the recorder. In the filter, based on 300 prediction performances stored in the recorder, a set of the highest predictive performing models and their modeling conditions was selected. Here, we imposed the following request to detect some overfitting cases. We excluded some hyperparameters used for model construction when the models with this hyperparameter had a high variability of the predictive performances between other OOFs in the 100% coverage validation. Therefore, even if the selected set of hyperparameters and allocation of OOFs resulted in high predictive performance, it was not adopted when the variability of performance with other OOFs at a coverage of 100% was high.
In the validator, using three types of unduplicated out-of-folds (OOFs) as the validation set, models were trained and validated with each hyperparameter. In the recorder, all prediction models, their modeling conditions, and predictive performances were stored. In the filter, high-variability cases were excluded according to 100% coverage validation, and the highest performing model was selected simultaneously.

3.6. Evaluation Metrics

The predictive performance of the classification models was evaluated based on information calculated from confusion matrices, including the number of true positives (TP; compounds correctly identified as positive), true negatives (TN; compounds correctly identified as negative), false negatives (FN; misclassified positive compounds), and false positives (FP; misclassified negative compounds). The following six evaluation indexes were used to evaluate the classification models.
(1)
SE: accuracy of predicting “positive” (active) when the true outcome is positive.
S E = T P T P + F N
(2)
SP: accuracy of predicting “negative” (inactive) when the true outcome is negative.
S P = T N T N + F N
(3)
ACC: the number of correctly predicted samples divided by the total number of samples.
A C C = T P + T N T P + T N + F N + F P
(4)
BAC: average between SE and SP.
B A C = 1 2 ( S E + S P )
(5)
MCC: used as a measure to assess the classification accuracy of the models for an unbalanced dataset [71].
M C C = ( T P · T N ) ( F P · F N ) ( T P + F P ) ( T P + F N ) ( T N + F P ) ( T N + F N )
(6)
AUC: a graph showing the performance of a classification model at all classification thresholds. This curve plots two parameters: (i) SE and (ii) 1–SP [72].
To determine the optimal cutoff points in the definitions of TP, FN, TN, and FP, we maximized SE (1–SP) using the Youden index [73]. In the toxicity predictor, the cutoff value specific to each prediction model was standardized and displayed using the following formula so that the maximum, minimum, and average values were 1, 0, and 0.5, respectively.
x n =   x u log c 2
The value xn is obtained by normalizing the directly predicted value xu using the equation. Here, c is the cutoff value of each prediction model.

3.7. Applicability Domain

The AD of the compound entered for the prediction was defined using the Euclidean distance to the five nearest molecules in the descriptor space of Tox21 compounds. The mean of the logarithmic Euclidean distances was normalized between 0 and 1 and expressed as reliability in the toxicity predictor.

4. Conclusions

In this study, we built prediction models of 59 MIE agonists and antagonists with information on the chemical structure and activity from the Tox21 10K library. We aimed to support regulatory toxicity decisions comprehensively and to enable users to reuse the QSTR predictions. Therefore, a web application integrating the three-dimensionalization algorithm, toxicity prediction models, and domain evaluation used in this study was developed to access to the assessment of activity against 59 MIEs. These models were valid toxicity models for alternative in silico screening and therefore could practically aid in achieving toxicity assessment.

Supplementary Materials

Supplementary Materials can be found at https://www.mdpi.com/1422-0067/21/21/7853/s1.

Author Contributions

Conceptualization, Y.U.; methodology, R.W. and Y.U.; software, R.W.; validation, K.K., R.W., and Y.U.; formal analysis, R.W.; investigation, R.W.; resources, Y.U.; data curation, R.W. and Y.U.; writing—original draft preparation, K.K.; writing—review and editing, Y.U.; visualization, K.K.; supervision, Y.U.; project administration, Y.U.; funding acquisition, Y.U. All authors have read and agreed to the published version of the manuscript.

Funding

This research was funded by the Japan Agency for Medical Research and Development (AMED), grant number 19nk0101103h0305.

Acknowledgments

We would like to thank the members of the hepatotoxicity drug prediction team (team leader: Hiroshi Yamada, National Institute of Biomedical Innovation) in the Drug Discovery Support Promotion Project from Japan Agency for Medical Research and Development for their suggestive opinions. We extend our regards to our collaborative institutes, as shown in the portal https://www.id3inst.org/, for the sharing of resources.

Conflicts of Interest

The authors declare no conflict of interest.

References

  1. Hansch, C.; Maloney, P.; Fujita, T.; Muir, R.M. Correlation of Biological Activity of Phenoxyacetic Acids with Hammett Substituent Constants and Partition Coefficients. Nature 1962, 194, 178–180. [Google Scholar] [CrossRef]
  2. Hansch, C.; Fujita, T. p-σ-π Analysis. A Method for the Correlation of Biological Activity and Chemical Structure. J. Am. Chem. Soc. 1964, 86, 1616–1626. [Google Scholar] [CrossRef]
  3. Gombar, V.K.; Enslein, K.; Blake, B.W. Assessment of developmental toxicity potential of chemicals by quantitative structure-toxicity relationship models. Chemosphere 1995, 31, 2499–2510. [Google Scholar] [CrossRef]
  4. van de Waterbeemd, H.; Gifford, E. ADMET in-silico modelling: Towards prediction paradise? Nat. Rev. Drug Discov. 2003, 2, 192–204. [Google Scholar] [CrossRef] [PubMed]
  5. Zhang, S. Computer-aided drug discovery and development. Methods Mol. Biol. 2011, 716, 23–38. [Google Scholar] [CrossRef]
  6. Macalino, S.J.; Gosu, V.; Hong, S.; Choi, S. Role of computer-aided drug design in modern drug discovery. Arch. Pharmacal Res. 2015, 38, 1686–1701. [Google Scholar] [CrossRef]
  7. Flecknell, P. Replacement, reduction and refinement. ALTEX 2002, 19, 73–78. [Google Scholar]
  8. Contrera, J.F.; Matthews, E.J.; Kruhlak, N.L.; Benz, R.D. In silico screening of chemicals for bacterial mutagenicity using electrotopological E-state indices and MDL QSAR software. Regul. Toxicol. Pharmacol. 2005, 43, 313–323. [Google Scholar] [CrossRef]
  9. Ambure, P.; Halder, A.K.; Díaz, H.G.; Cordeiro, N. QSAR-Co: An Open Source Software for Developing Robust Multitasking or Multitarget Classification-Based QSAR Models. J. Chem. Inf. Model. 2019, 59, 2538–2544. [Google Scholar] [CrossRef]
  10. Mansouri, K.; Grulke, C.M.; Judson, R.S.; Williams, A.J. OPERA models for predicting physicochemical properties and environmental fate endpoints. J. Cheminformatics 2018, 10, 10. [Google Scholar] [CrossRef] [Green Version]
  11. Thomas, R.S.; Paules, R.S.; Simeonov, A.; Fitzpatrick, S.C.; Crofton, K.M.; Casey, W.M.; Mendrick, D.L. The US Federal Tox21 Program: A strategic and operational plan for continued leadership. ALTEX 2018, 35, 163–168. [Google Scholar] [CrossRef] [PubMed]
  12. Xia, M.; Huang, R.; Shi, Q.; Boyd, W.A.; Zhao, J.; Sun, N.; Rice, J.R.; Dunlap, P.E.; Hackstadt, A.J.; Bridge, M.F.; et al. Comprehensive Analyses and Prioritization of Tox21 10K Chemicals Affecting Mitochondrial Function by in-Depth Mechanistic Studies. Environ. Health Perspect. 2018, 126, 077010. [Google Scholar] [CrossRef]
  13. Ankley, G.T.; Bennett, R.S.; Erickson, R.J.; Hoff, D.J.; Hornung, M.W.; Johnson, R.D.; Mount, D.R.; Nichols, J.W.; Russom, C.L.; Schmieder, P.K.; et al. Adverse outcome pathways: A conceptual framework to support ecotoxicology research and risk assessment. Environ. Toxicol. Chem. 2010, 29, 730–741. [Google Scholar] [CrossRef]
  14. Allen, T.E.; Goodman, J.M.; Gutsell, S.; Russell, P.J. Defining molecular initiating events in the adverse outcome pathway framework for risk assessment. Chem. Res. Toxicol. 2014, 27, 2100–2112. [Google Scholar] [CrossRef] [PubMed] [Green Version]
  15. Dix, D.J.; Houck, K.A.; Martin, M.T.; Richard, A.M.; Setzer, R.W.; Kavlock, R.J. The ToxCast Program for Prioritizing Toxicity Testing of Environmental Chemicals. Toxicol. Sci. 2007, 95, 5–12. [Google Scholar] [CrossRef] [PubMed]
  16. Diamanti-Kandarakis, E.; Bourguignon, J.P.; Giudice, L.C.; Hauser, R.; Prins, G.S.; Soto, A.M.; Zoeller, R.T.; Gore, A.C. Endocrine-disrupting chemicals: An Endocrine Society scientific statement. Endocr. Rev. 2009, 30, 293–342. [Google Scholar] [CrossRef]
  17. Min, J.; Lee, S.K.; Gu, M.B. Effects of endocrine disrupting chemicals on distinct expression patterns of estrogen receptor, cytochrome P450 aromatase and p53 genes in oryzias latipes liver. J. Biochem. Mol. Toxicol. 2003, 17, 272–277. [Google Scholar] [CrossRef]
  18. Mansouri, K.; Kleinstreuer, N.; Abdelaziz, A.M.; Alberga, D.; Alves, V.M.; Andersson, P.L.; Andrade, C.H.; Bai, F.; Balabin, I.; Ballabio, D.; et al. CoMPARA: Collaborative Modeling Project for Androgen Receptor Activity. Environ. Health Perspect. 2020, 128, 27002. [Google Scholar] [CrossRef]
  19. Zhang, J.; Mucs, D.; Norinder, U.; Svensson, F. LightGBM: An Effective and Scalable Algorithm for Prediction of Chemical Toxicity-Application to the Tox21 and Mutagenicity Data Sets. J. Chem. Inf. Model. 2019, 59, 4150–4158. [Google Scholar] [CrossRef]
  20. Norinder, U.; Boyer, S. Conformal Prediction Classification of a Large Data Set of Environmental Chemicals from ToxCast and Tox21 Estrogen Receptor Assays. Chem. Res. Toxicol. 2016, 29, 1003–1010. [Google Scholar] [CrossRef]
  21. Banerjee, P.; Siramshetty, V.B.; Drwal, M.N.; Preissner, R. Computational methods for prediction of in vitro effects of new chemical structures. J. Cheminformatics 2016, 8, 51. [Google Scholar] [CrossRef] [PubMed] [Green Version]
  22. Chen, T.; Guestrin, C. XGBoost: A scalable tree boosting system. arXiv 2016, arXiv:1603.02754. [Google Scholar]
  23. Sheridan, R.P.; Wang, W.M.; Liaw, A.; Ma, J.; Gifford, E.M. Extreme Gradient Boosting as a Method for Quantitative Structure–Activity Relationships. J. Chem. Inf. Model. 2016, 56, 2353–2360. [Google Scholar] [CrossRef] [PubMed]
  24. Attene-Ramos, M.S.; Miller, N.; Huang, R.; Michael, S.; Itkin, M.; Kavlock, R.J.; Austin, C.P.; Shinn, P.; Simeonov, A.; Tice, R.R.; et al. The Tox21 robotic platform for assessment of environmental chemicals–from vision to reality. Drug Discov. Today 2013, 18, 716–723. [Google Scholar] [CrossRef] [PubMed] [Green Version]
  25. Joonho, G.; Hyunjoong, K. RHSBoost: Improving classification performance in imbalance data. Comput. Stat. Data Anal. 2017, 111. [Google Scholar] [CrossRef]
  26. Ezzat, A.; Wu, M.; Li, X.; Kwoh, C. Drug-target interaction prediction via class imbalance-aware ensemble learning. BMC Bioinform. 2016, 17, 509. [Google Scholar] [CrossRef] [PubMed] [Green Version]
  27. Judson, R.; Houck, K.; Martin, M.; Richard, A.M.; Knudsen, T.B.; Shah, I.; Little, S.; Wambaugh, J.; Setzer, R.W.; Kothya, P.; et al. Editor’s Highlight: Analysis of the Effects of Cell Stress and Cytotoxicity on In Vitro Assay Activity Across a Diverse Chemical and Assay Space. Toxicol. Sci. 2016, 152, 323–339. [Google Scholar] [CrossRef] [PubMed] [Green Version]
  28. Available online: https://tripod.nih.gov/tox21/challenge/index.jsp (accessed on 31 July 2020).
  29. Available online: https://tripod.nih.gov/tox21/challenge/leaderboard.jsp (accessed on 31 July 2020).
  30. Sahigara, F.; Mansouri, K.; Ballabio, D.; Mauri, A.; Consonni, V.; Todeschini, R. Comparison of Different Approaches to Define the Applicability Domain of QSAR Models. Molecules 2012, 17, 4791–4810. [Google Scholar] [CrossRef] [Green Version]
  31. Dragos, H.; Gilles, M.; Alexandre, V. Predicting the predictability: A unified approach to the applicability domain problem of qsar models. J. Chem. Inf. Model. 2009, 49, 1762–1776. [Google Scholar] [CrossRef]
  32. Barouki, R.; Aggerbeck, M.; Aggerbeck, L.; Coumoul, X. The aryl hydrocarbon receptor system. Drug Metab. Drug Interact. 2012, 27, 3–8. [Google Scholar] [CrossRef]
  33. Available online: https://pubchem.ncbi.nlm.nih.gov/bioassay/720719 (accessed on 31 July 2020).
  34. Available online: https://pubchem.ncbi.nlm.nih.gov/bioassay/743053 (accessed on 31 July 2020).
  35. Fuentes, N.; Silveyra, P. Estrogen receptor signaling mechanisms. Adv. Protein Chem. Struct. Biol. 2019, 116, 135–170. [Google Scholar] [CrossRef] [PubMed]
  36. Ranhotra, H.S. Estrogen-related receptor alpha and cancer: Axis of evil. J. Recept Signal. Transduct Res. 2015, 35, 505–508. [Google Scholar] [CrossRef] [PubMed]
  37. Lee, H.R.; Jeung, E.B.; Cho, M.H.; Kim, T.H.; Leung, P.C.; Choi, K.C. Molecular mechanism(s) of endocrine-disrupting chemicals and their potent oestrogenicity in diverse cells and tissues that express oestrogen receptors. J. Cell Mol. Med. 2013, 17, 1–11. [Google Scholar] [CrossRef] [PubMed]
  38. Available online: https://pubchem.ncbi.nlm.nih.gov/bioassay/743139 (accessed on 31 July 2020).
  39. Available online: https://pubchem.ncbi.nlm.nih.gov/bioassay/1347030 (accessed on 31 July 2020).
  40. Available online: https://pubchem.ncbi.nlm.nih.gov/bioassay/1224895 (accessed on 31 July 2020).
  41. Brucker-Davis, F. Effects of environmental synthetic chemicals on thyroid function. Thyroid 1998, 8, 827–856. [Google Scholar] [CrossRef] [PubMed]
  42. Howdeshell, K.L. A model of the development of the brain as a construct of the thyroid system. Environ. Health Perspect. 2002, 110 (Suppl. 3), 337–348. [Google Scholar] [CrossRef] [Green Version]
  43. Available online: https://pubchem.ncbi.nlm.nih.gov/bioassay/743140 (accessed on 31 July 2020).
  44. Li, G.; Guo, G.L. Farnesoid X receptor, the bile acid sensing nuclear receptor, in liver regeneration. Acta Pharm. Sin. B 2015, 5, 93–98. [Google Scholar] [CrossRef] [Green Version]
  45. Huang, X.F.; Zhao, W.Y.; Huang, W.D. FXR and liver carcinogenesis. Acta Pharm. Sin. 2015, 36, 37–43. [Google Scholar] [CrossRef] [Green Version]
  46. Hakkola, J.; Bernasconi, C.; Coecke, S.; Richert, L.; Andersson, T.B.; Pelkonen, O. Cytochrome P450 Induction and Xeno-Sensing Receptors Pregnane X Receptor, Constitutive Androstane Receptor, Aryl Hydrocarbon Receptor and Peroxisome Proliferator-Activated Receptor α at the Crossroads of Toxicokinetics and Toxicodynamics. Basic Clin. Pharmacol. Toxicol. 2018, 123, 42–50. [Google Scholar] [CrossRef] [Green Version]
  47. Available online: https://pubchem.ncbi.nlm.nih.gov/bioassay/1347033 (accessed on 31 July 2020).
  48. Ghyselinck, N.B.; Duester, G. Retinoic acid signaling pathways. Dev. Camb. Engl. 2019, 146, dev167502. [Google Scholar] [CrossRef] [Green Version]
  49. Toporova, L.; Balaguer, P. Nuclear receptors are the major targets of endocrine disrupting chemicals. Mol. Cell. Endocrinol. 2020, 502, 15. [Google Scholar] [CrossRef]
  50. Available online: https://pubchem.ncbi.nlm.nih.gov/bioassay/1159531 (accessed on 31 July 2020).
  51. Available online: https://pubchem.ncbi.nlm.nih.gov/bioassay/743241 (accessed on 31 July 2020).
  52. Buendia, I.; Michalska, P.; Navarro, E.; Gameiro, I.; Egea, J.; León, R. Nrf2-ARE pathway: An emerging target against oxidative stress and neuroinflammation in neurodegenerative diseases. Pharmacology 2016, 157, 84–104. [Google Scholar] [CrossRef]
  53. Reuter, S.; Gupta, S.C.; Chaturvedi, M.M.; Aggarwal, B.B. Oxidative stress, inflammation, and cancer: How are they linked? Free Radic. Biol. Med. 2010, 49, 1603–1616. [Google Scholar] [CrossRef] [PubMed] [Green Version]
  54. Hayden, M.S.; Ghosh, S. NF-κB in immunobiology. Cell Res. 2011, 21, 223–244. [Google Scholar] [CrossRef] [PubMed] [Green Version]
  55. Available online: https://pubchem.ncbi.nlm.nih.gov/bioassay/1224894 (accessed on 31 July 2020).
  56. Available online: https://pubchem.ncbi.nlm.nih.gov/bioassay/720552 (accessed on 31 July 2020).
  57. Available online: https://pubchem.ncbi.nlm.nih.gov/bioassay/1347034 (accessed on 31 July 2020).
  58. Sanaei, M.; Kavoosi, F. Histone Deacetylases and Histone Deacetylase Inhibitors: Molecular Mechanisms of Action in Various Cancers. Adv. Biomed. Res. 2019, 8, 63. [Google Scholar] [CrossRef]
  59. Siddiquiab, M.S.; François, M.; Fenech, M.F.; Leiferta, W.R. Persistent γH2AX: A promising molecular marker of DNA damage and aging. Mutat. Res. Rev. Mutat. Res. 2015, 766, 1–19. [Google Scholar] [CrossRef]
  60. Akerfelt, M.; Morimoto, R.I.; Sistonen, L. Heat shock factors: Integrators of cell stress, development and lifespan. Nat. Rev. Mol. Cell Biol. 2010, 11, 545–555. [Google Scholar] [CrossRef]
  61. Jin, G.; Sivaraman, A.; Lee, K. Development of taladegib as a sonic hedgehog signaling pathway inhibitor. Arch. Pharm. Res. 2017, 40, 1390–1393. [Google Scholar] [CrossRef] [PubMed]
  62. Available online: https://pubchem.ncbi.nlm.nih.gov/bioassay/1347032 (accessed on 31 July 2020).
  63. Available online: https://pubchem.ncbi.nlm.nih.gov/bioassay/720637 (accessed on 31 July 2020).
  64. Oakes, S.A.; Papa, F.R. The role of endoplasmic reticulum stress in human pathology. Annu. Rev. Pathol. 2015, 10, 173–194. [Google Scholar] [CrossRef] [PubMed] [Green Version]
  65. Available online: https://pubchem.ncbi.nlm.nih.gov/bioassay/720516 (accessed on 31 July 2020).
  66. Available online: https://www.rdkit.org/docs/index.html (accessed on 31 July 2020).
  67. Riniker, S.; Landrum, G.A. Better Informed Distance Geometry: Using What We Know To Improve Conformation Generation. J. Chem. Inf. Model. 2015, 55, 2562–2574. [Google Scholar] [CrossRef]
  68. Tosco, P.; Stiefl, N.; Landrum, G. Bringing the MMFF force field to the RDKit: Implementation and validation. J. Cheminformatics 2014, 6, 37. [Google Scholar] [CrossRef]
  69. Moriwaki, H.; Tian, Y.S.; Kawashita, N.; Takagi, T. Mordred: A molecular descriptor calculator. J. Cheminformatics 2018, 10, 4. [Google Scholar] [CrossRef] [PubMed] [Green Version]
  70. Available online: https://mordred-descriptor.github.io/documentation/master/index.html (accessed on 31 July 2020).
  71. Matthews, B.W. Comparison of the predicted and observed secondary structure of T4 phage lysozyme. Biochim. Et Biophys. Acta 1975, 405, 442–451. [Google Scholar] [CrossRef]
  72. Fawcett, T. An Introduction to ROC Analysis. Pattern Recognit. Lett. 2006, 27, 861–874. [Google Scholar] [CrossRef]
  73. Fluss, R.; Faraggi, D.; Reiser, B. Estimation of the Youden Index and its Associated Cutoff Point. Biom. J. 2005, 47, 458–472. [Google Scholar] [CrossRef] [PubMed] [Green Version]
Figure 1. Activity distribution of 59 molecular initiating events (MIEs) in the Tox21 10K library: (a) the number of chemical compounds in the case of criteria 40 and (b) the number of chemical compounds in the case of criteria 1. Orange and blue show active and inactive chemicals, respectively.
Ijms 21 07853 g001
Figure 2. Receiver operating characteristic (ROC) curves with the test set in the case of criteria 40.
Ijms 21 07853 g002
Figure 3. Receiver operating characteristic curves with the test set in the case of criteria 1.
Ijms 21 07853 g003
Figure 4. Comparison of the Toxicity Predictor models with the Tox21 Data Challenge 2014 models: This figure shows the predictive performance of the top 10 Tox21 Data Challenge and Toxicity Predictor models, which were built for 10 toxicity targets (AhR_ago, Arlbd_ago, ERlbd_ago, Arom_ant, PPARg_ago, ARE_ago, ATAD_ind, HSR_act, MMP_disr, and p53_ago). The horizontal axis denotes the names of the modeling teams of the Tox21 Data Challenge, and the vertical axis indicates the areas under the curve (AUCs).
Ijms 21 07853 g004
Figure 5. The platform screens of Toxicity Predictor.
Ijms 21 07853 g005
Figure 6. Prediction results in Toxicity Predictor: (a) the position of the compound to be predicted in the training set chemical space visualized with principal component analysis. The gray points are compounds in the training set, and the blue point is the compound to be predicted. (b) The predictive results for 59 MIEs predicted by Toxicity Predictor for each of the criteria 1 and 40. Normalized prediction scores for each target were displayed as bar charts. Red, blue, and gray bars show scores above 0.6, below 0.4, and between 0.4 and 0.6, respectively.
Ijms 21 07853 g006
Figure 7. Relationship between the thresholds and active/inactive judgment. Red and white squares mean active and inactive judgments, respectively. Blue square means AIDs and SIDs.
Ijms 21 07853 g007
Figure 8. The modeling pipeline integrated validator, recorder, and filter used in this study.
Ijms 21 07853 g008
Table 1. Predictive performances in the test set for each target.
No.AIDAbbreviationCriteria 40Criteria 1
AUCSESPACCBACMCCAUCSESPACCBACMCC
1720516ATAD5_ind0.840 0.750 0.843 0.840 0.796 0.272 0.845 0.744 0.847 0.839 0.795 0.395
2720552p53_ago0.899 0.824 0.830 0.830 0.827 0.356 0.845 0.804 0.793 0.794 0.799 0.458
3720637MMP_disr0.919 0.845 0.846 0.846 0.845 0.501 0.795 0.698 0.788 0.758 0.743 0.475
4720719GR_ago0.783 0.600 0.931 0.923 0.766 0.300 0.841 0.754 0.807 0.800 0.780 0.416
5720725GR_ant0.808 0.577 0.905 0.888 0.741 0.328 0.827 0.801 0.721 0.743 0.761 0.471
6743053Arlbd_ago0.878 0.765 0.947 0.941 0.856 0.481 0.766 0.582 0.843 0.806 0.712 0.357
7743054ARfull_ant0.774 0.750 0.681 0.683 0.716 0.169 0.833 0.841 0.700 0.734 0.770 0.468
8743063Arlbd_ant0.844 0.786 0.791 0.790 0.788 0.338 0.833 0.805 0.724 0.745 0.765 0.469
9743067TR_ant0.783 0.511 0.924 0.906 0.718 0.306 0.829 0.740 0.825 0.796 0.782 0.555
10743077ERlbd_ago0.782 0.536 0.961 0.938 0.748 0.457 0.735 0.600 0.843 0.812 0.722 0.362
11743078ERlbd_ant0.810 0.815 0.684 0.691 0.750 0.237 0.805 0.696 0.789 0.767 0.743 0.444
12743091ERfull_ant0.826 0.872 0.699 0.705 0.785 0.235 0.862 0.730 0.870 0.842 0.800 0.555
13743122AhR_ago0.888 0.713 0.907 0.887 0.810 0.513 0.749 0.728 0.695 0.702 0.711 0.359
14743139Arom_ant0.801 0.892 0.598 0.608 0.745 0.186 0.807 0.825 0.661 0.704 0.743 0.429
15743140PPARg_ago0.813 0.750 0.823 0.821 0.786 0.238 0.832 0.735 0.819 0.805 0.777 0.457
16743199PPARg_ant0.829 0.786 0.798 0.798 0.792 0.290 0.810 0.824 0.645 0.682 0.734 0.383
17743219ARE_ago0.785 0.794 0.652 0.672 0.723 0.317 0.795 0.770 0.715 0.733 0.742 0.461
18743226PPARd_ant0.681 0.600 0.885 0.884 0.743 0.111 0.811 0.764 0.749 0.751 0.756 0.374
19743227PPARd_ago0.812 0.615 0.954 0.949 0.785 0.296 0.796 0.705 0.790 0.780 0.747 0.356
20743228HSR_act0.788 0.576 0.922 0.910 0.749 0.315 0.790 0.667 0.808 0.789 0.737 0.370
21743239FXR_ago0.775 0.727 0.836 0.835 0.782 0.163 0.817 0.689 0.834 0.825 0.762 0.325
22743240FXR_ant0.757 0.933 0.565 0.577 0.749 0.178 0.843 0.788 0.799 0.798 0.794 0.481
23743241VDR_agoN.DN.DN.DN.DN.DN.D0.826 0.769 0.727 0.730 0.748 0.297
24743242VDR_ant0.716 1.000 0.399 0.403 0.699 0.066 0.701 0.630 0.689 0.678 0.660 0.258
251159518NFkB_ago0.780 0.667 0.846 0.846 0.756 0.081 0.871 0.692 0.912 0.900 0.802 0.427
261159519ERsr_ago0.638 0.857 0.441 0.445 0.649 0.052 0.801 0.655 0.833 0.816 0.744 0.349
271159523ROR_ant0.828 0.789 0.764 0.766 0.777 0.323 0.695 0.523 0.819 0.703 0.671 0.359
281159528AP1_ago0.777 0.553 0.877 0.851 0.715 0.319 0.799 0.765 0.722 0.729 0.743 0.372
291159531RXR_ago0.532 0.235 0.964 0.951 0.600 0.135 0.725 0.527 0.841 0.756 0.684 0.374
301159555RAR_ant0.831 0.800 0.742 0.746 0.771 0.308 0.683 0.740 0.511 0.601 0.626 0.249
311224892CAR_ago0.889 0.826 0.808 0.810 0.817 0.455 0.847 0.684 0.889 0.845 0.787 0.556
321224893CAR_ant0.809 0.652 0.880 0.874 0.766 0.239 0.793 0.700 0.768 0.746 0.734 0.448
331224894HIF1_ago0.556 0.250 1.000 0.997 0.625 0.499 0.854 0.769 0.829 0.824 0.799 0.395
341224895TSHR_ago0.872 0.750 0.880 0.874 0.815 0.355 0.838 0.692 0.831 0.816 0.762 0.389
351224896H2AX_ago0.834 0.696 0.892 0.880 0.794 0.394 0.779 0.605 0.842 0.814 0.724 0.354
361259247Arfulls_ant0.856 0.857 0.733 0.747 0.795 0.401 0.824 0.788 0.767 0.774 0.778 0.534
371259248Erfulls_ant0.835 0.850 0.702 0.711 0.776 0.283 0.793 0.668 0.798 0.770 0.733 0.416
381259387ARant_ago0.852 0.727 0.946 0.939 0.837 0.460 0.712 0.494 0.872 0.841 0.683 0.275
391259388HDAC_ant0.897 0.783 0.888 0.883 0.835 0.407 0.868 0.768 0.879 0.871 0.824 0.447
401259390Shh_ago0.571 1.000 0.219 0.223 0.609 0.042 0.724 0.609 0.913 0.905 0.761 0.266
411259391ERaant_ago0.934 0.850 0.959 0.956 0.904 0.493 0.782 0.551 0.898 0.880 0.725 0.299
421259392Shh_ant0.829 0.809 0.718 0.731 0.764 0.379 0.758 0.642 0.745 0.705 0.693 0.383
431259393TSHR_agoant0.834 0.750 0.875 0.874 0.812 0.120 0.669 0.727 0.681 0.682 0.704 0.093
441259394ERb_ago0.980 0.923 0.973 0.972 0.948 0.531 0.729 0.444 0.937 0.900 0.691 0.348
451259395TSHR_ant0.865 0.933 0.715 0.721 0.824 0.244 0.850 0.800 0.807 0.807 0.804 0.381
461259396Erb_ant0.825 0.677 0.863 0.851 0.770 0.352 0.798 0.743 0.763 0.758 0.753 0.462
471259401ERRPGC_ant0.843 0.698 0.843 0.837 0.770 0.290 0.751 0.595 0.793 0.723 0.694 0.390
481259402ERRPGC_ago0.840 0.650 0.937 0.925 0.794 0.415 0.805 0.734 0.777 0.768 0.756 0.444
491259403ERR_ant0.812 0.653 0.856 0.835 0.755 0.392 0.819 0.696 0.826 0.786 0.761 0.510
501259404ERR_ago0.884 0.880 0.814 0.816 0.847 0.274 0.803 0.680 0.820 0.777 0.750 0.491
511347030TRHR_ago0.748 0.833 0.637 0.638 0.735 0.077 0.751 0.593 0.853 0.846 0.723 0.201
521347031PR_ant0.892 0.880 0.794 0.804 0.837 0.473 0.831 0.757 0.821 0.802 0.789 0.550
531347032TGFb_ant0.809 0.750 0.765 0.764 0.757 0.273 0.860 0.780 0.824 0.817 0.802 0.493
541347033PXR_ago0.851 0.759 0.817 0.805 0.788 0.517 0.838 0.745 0.817 0.790 0.781 0.556
551347034CaspH_ind0.870 0.791 0.852 0.849 0.821 0.348 0.858 0.773 0.856 0.848 0.814 0.452
561347035TGFb_ago0.968 1.000 0.938 0.938 0.969 0.174 0.900 0.818 0.937 0.936 0.878 0.311
571347036PR_ago0.943 0.833 0.989 0.986 0.911 0.701 0.799 0.537 0.986 0.967 0.761 0.564
581347037CaspC_ind0.884 0.850 0.785 0.786 0.817 0.216 0.863 0.771 0.882 0.878 0.827 0.351
591347038TRHR_ant0.822 0.700 0.841 0.840 0.771 0.148 0.828 0.870 0.701 0.709 0.785 0.260
AID means PubChem assay IDs. Predictive performances were evaluated using the following metrics: area under the curve of receiver operating characteristic curve (AUC), sensitivity (SE), specificity (SP), accuracy (ACC), balanced accuracy (BAC), and Matthews correlation coefficient (MCC). N.D. shows no data.
Table 2. Mean predictive performances for all assay targets.
MetricsCriteria 40Criteria 1
AUC0.817 ± 0.0880.802 ± 0.051
SE0.750 ± 0.1510.705 ± 0.094
SP0.809 ± 0.1490.801 ± 0.082
ACC0.807 ± 0.1440.788 ± 0.069
BAC0.780 ± 0.0690.753 ± 0.045
MCC0.307 ± 0.1410.402 ± 0.096
Each value of performances evaluated by six metrics were shown as mean ± standard error. n = 58 (criteria 40), n = 59 (criteria 1).
Table 3. Molecular Initiating Events (MIEs) used in this study.
No.AIDMolecular Initiating EventsActivity TypeAbbreviation
1720516ATAD5genotoxic inducerATAD5_ind
2720552p53agonistp53_ago
3720637mitochondrial membrane potentialdisruptorMMP_disr
4720719glucocorticoid receptoragonistGR_ago
5720725glucocorticoid receptorantagonistGR_ant
6743053androgen receptor lbdagonistArlbd_ago
7743054androgen receptor fullantagonistARfull_ant
8743063androgen receptor lbdantagonistArlbd_ant
9743067thyroid receptorantagonistTR_ant
10743077estrogen receptor alpha lbdagonistERlbd_ago
11743078estrogen receptor alpha lbdantagonistERlbd_ant
12743091estrogen receptor alpha fullantagonistERfull_ant
13743122aryl hydrocarbon receptoragonistAhR_ago
14743139aromataseantagonistArom_ant
15743140peroxisome proliferator-activated receptor gammaagonistPPARg_ago
16743199peroxisome proliferator-activated receptor gammaantagonistPPARg_ant
17743219antioxidant response elementagonistARE_ago
18743226peroxisome proliferator-activated receptor deltaantagonistPPARd_ant
19743227peroxisome proliferator-activated receptor deltaagonistPPARd_ago
20743228heat shock responseactivatorHSR_act
21743239farnesoid-X-receptoragonistFXR_ago
22743240farnesoid-X-receptorantagonistFXR_ant
23743241vitamin D receptoragonistVDR_ago
24743242vitamin D receptorantagonistVDR_ant
251159518NFkBagonistNFkB_ago
261159519endoplasmic reticulum stress responseagonistERsr_ago
271159523retinoid-related orphan receptor gammaantagonistROR_ant
281159528activator protein-1agonistAP1_ago
291159531retinoid X receptor-alphaagonistRXR_ago
301159555retinoic acid receptorantagonistRAR_ant
311224892constitutive androstane receptoragonistCAR_ago
321224893constitutive androstane receptorantagonistCAR_ant
331224894hypoxiaagonistHIF1_ago
341224895thyroid stimulating hormone receptoragonistTSHR_ago
351224896histone variant H2AXagonistH2AX_ago
361259247androgen receptor with stimulatorantagonistArfulls_ant
371259248estrogen receptor alpha with stimulatorantagonistErfulls_ant
381259387androgen receptor with antagonistagonistARant_ago
391259388histone deacetylaseantagonistHDAC_ant
401259390sonic hedgehog signalingagonistShh_ago
411259391estrogen receptor alpha with antagonistagonistERaant_ago
421259392sonic hedgehog signalingantagonistShh_ant
431259393thyroid stimulating hormone receptoragonist antagonistTSHR_agoant
441259394estrogen receptor betaagonistERb_ago
451259395thyroid stimulating hormone receptorantagonistTSHR_ant
461259396estrogen receptor betaantagonistErb_ant
471259401estrogen related receptor with PGCantagonistERRPGC_ant
481259402estrogen related receptor with PGCagonistERRPGC_ago
491259403estrogen related receptorantagonistERR_ant
501259404estrogen related receptoragonistERR_ago
511347030thyrotropin releasing hormone receptoragonistTRHR_ago
521347031progesterone receptorantagonistPR_ant
531347032transforming growth factor betaantagonistTGFb_ant
541347033human pregnane X receptoragonistPXR_ago
551347034caspase-3/7 in HepG2inducerCaspH_ind
561347035transforming growth factor betaagonistTGFb_ago
571347036progesterone receptoragonistPR_ago
581347037caspase-3/7 in CHO-K1inducerCaspC_ind
591347038thyrotropin releasing hormone receptorantagonistTRHR_ant
AID means PubChem assay IDs.
Publisher’s Note: MDPI stays neutral with regard to jurisdictional claims in published maps and institutional affiliations.

