Role of Cyclosporine in Gingival Hyperplasia: An In Vitro Study on Gingival Fibroblasts

 ,
,  ,
,
Abstract
:1. Introduction
1.1. Cyclosporine A and Its Effects on Gingival Fibroblasts Matrix
1.2. Objective
2. Results
3. Discussion
4. Materials and Methods
4.1. Primary Human Fibroblast Cells Culture
4.2. Cell Viability Test
4.3. Cell Treatment
4.4. RNA Isolation, Reverse Transcription, and Quantitative Real-Time RT-PCR
4.5. Statistical Analysis
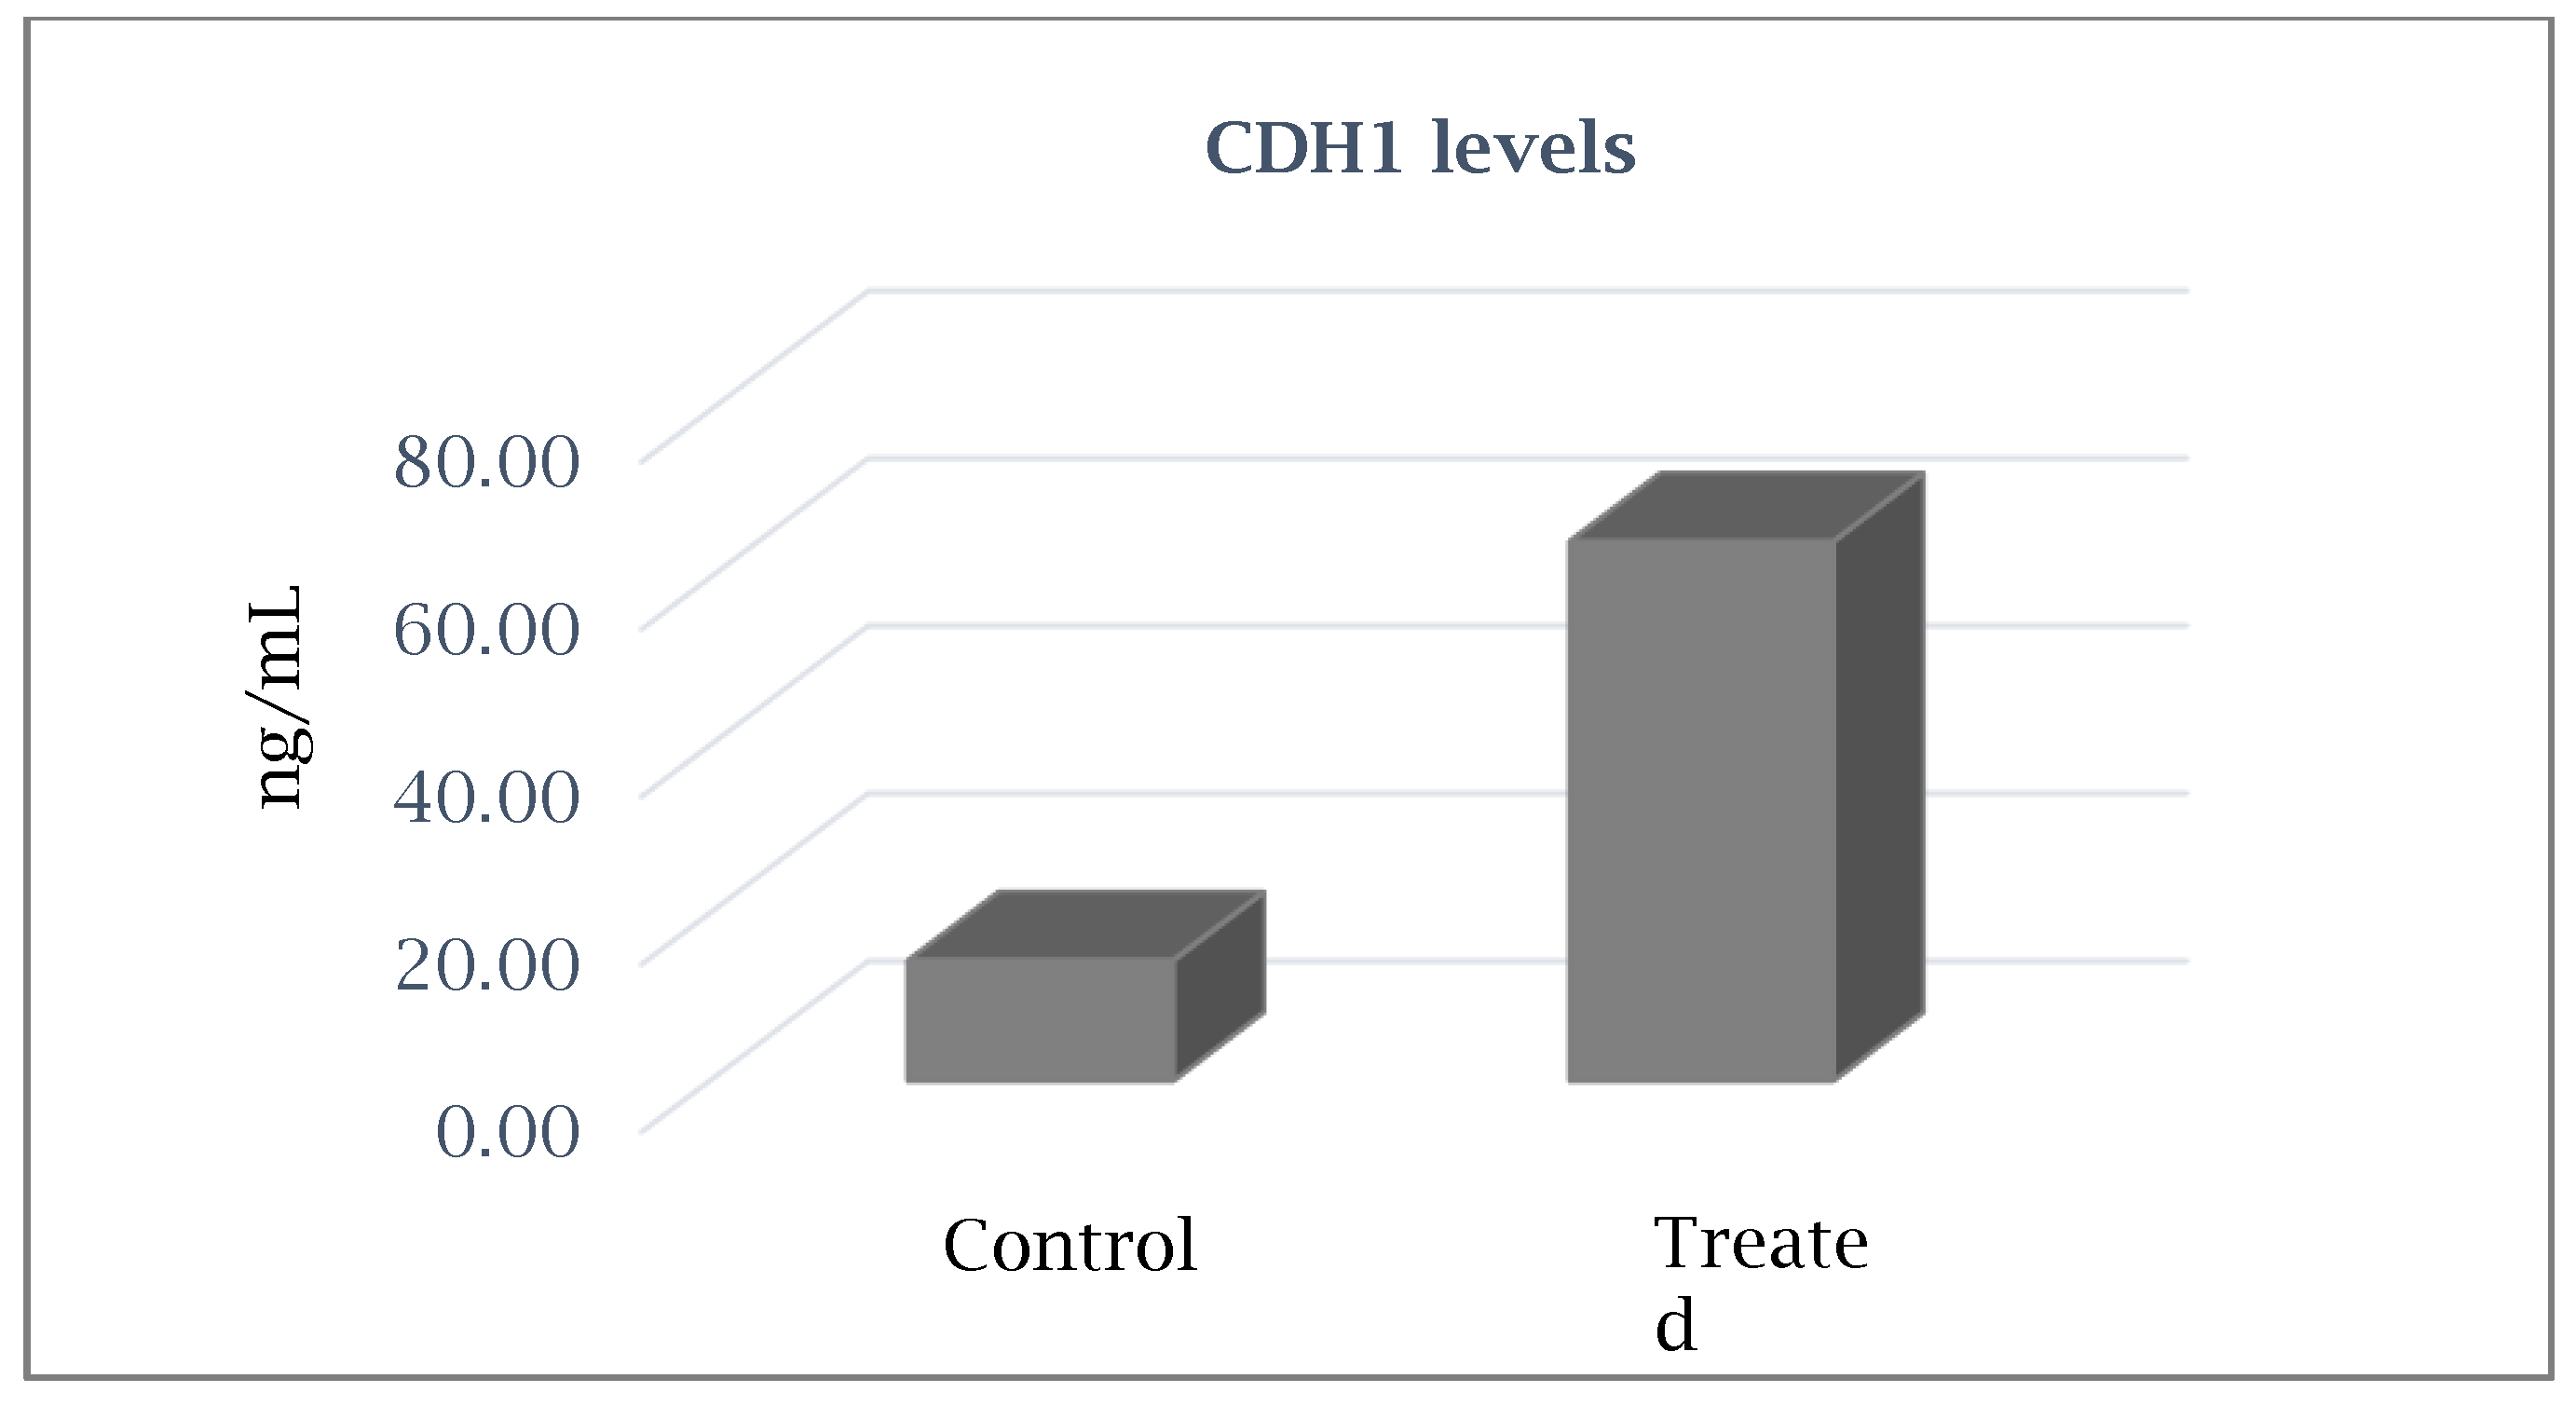
4.6. Detection of E-Cadherin Levels by Enzyme-Linked Immunosorbent Assay
Author Contributions
Conflicts of Interest
References
- Seymour, R.A.; Thomason, J.M.; Ellis, J. The pathogenesis of drug-induced gingival overgrowth. J. Clin. Periodontol. 1996, 23, 165–175. [Google Scholar] [CrossRef]
- Chabria, D.; Weintraub, R.G.; Kilpatrick, N.M. Mechanisms and management of gingival overgrowth in paediatric transplant recipients: A review. Int. J. Paediatr. Dent. 2003, 13, 220–229. [Google Scholar] [CrossRef]
- Seymour, R.A.; Jacobs, D.J. Cyclosporin and the gingival tissues. J. Clin. Periodontol. 1992, 19, 1–11. [Google Scholar] [CrossRef]
- Kilpatrick, N.M.; Weintraub, R.G.; Lucas, J.O.; Shipp, A.; Byrt, T.; Wilkinson, J.L. Gingival overgrowth in pediatric heart and heart-lung transplant recipients. J. Hear. Lung Transplant. 1997, 16, 1231–1237. [Google Scholar]
- Tyldesley, W.R.; Rotter, E. Gingival hyperplasia induced by cyclosporin-A. Br. Dent. J. 1984, 157, 305–309. [Google Scholar] [CrossRef] [PubMed]
- Daley, T.; Wysocki, G.; Day, C. Clinical and pharmacologic correlations in cyclosporine-induced gingival hyperplasia. Oral Surg. Oral Med. Oral Pathol. 1986, 62, 417–421. [Google Scholar] [CrossRef]
- Hefti, A.F.; Eshenaur, A.E.; Hassell, T.M.; Stone, C. Gingival Overgrowth in Cyclosporine A Treated Multiple Sclerosis Patients. J. Periodontol. 1994, 65, 744–749. [Google Scholar] [CrossRef] [PubMed]
- Wondimu, B.; Berg, U.; Modeer, T. Renal function in cyclosporine-treated pediatric renal transplant recipients in relation to gingival overgrowth. Transplantation 1997, 64, 92–96. [Google Scholar] [CrossRef] [PubMed]
- Uzel, M.I.; Kantarci, A.; Hong, H.-H.; Uygur, C.; Sheff, M.C.; Firatli, E.; Trackman, P.C. Connective Tissue Growth Factor in Drug-Induced Gingival Overgrowth. J. Periodontol. 2001, 72, 921–931. [Google Scholar] [CrossRef] [PubMed]
- Kuo, P.-J.; Tu, H.-P.; Chin, Y.-T.; Lu, S.-H.; Chiang, C.-Y.; Chen, R.-Y.; Fu, E. Cyclosporine-A inhibits MMP-2 and -9 activities in the presence of Porphyromonas gingivalis lipopolysaccharide: An experiment in human gingival fibroblast and U937 macrophage co-culture. J. Periodontal Res. 2012, 47, 431–438. [Google Scholar] [CrossRef]
- Lopez-Hernandez, F.J.; Lopez-Novoa, J.M. Role of TGF-beta in chronic kidney disease: An integration of tubular, glomerular and vascular effects. Cell Tissue Res. 2012, 347, 141–154. [Google Scholar] [CrossRef] [PubMed]
- Crawford, R.M.; Leiby, D.A.; Green, S.J.; Nacy, C.A.; Fortier, A.H.; Meltzer, M.S. Macrophage activation: A riddle of immunological resistance. Immunol. Ser. 1994, 60, 29–46. [Google Scholar] [PubMed]
- Wynn, T.A. Common and unique mechanisms regulate fibrosis in various fibroproliferative diseases. J. Clin. Investig. 2007, 117, 524–529. [Google Scholar] [CrossRef] [Green Version]
- Trackman, P.; Kantarci, A. Molecular and clinical aspects of drug-induced gingival overgrowth. J. Dent. Res. 2015, 94, 540–546. [Google Scholar] [CrossRef] [PubMed] [Green Version]
- Nares, S.; Ng, M.C.; Dill, R.E.; Park, B.; Cutler, C.W.; Iacopino, A.M. Cyclosporine A Upregulates Platelet-Derived Growth Factor B Chain in Hyperplastic Human Gingiva. J. Periodontol. 1996, 67, 271–278. [Google Scholar] [CrossRef] [PubMed]
- Nurmenniemi, P.K.; Pernu, H.E.; Laukkanen, P.; Knuuttila, M.L. Macrophage Subpopulations in Gingival Overgrowth Induced by Nifedipine and Immunosuppressive Medication. J. Periodontol. 2002, 73, 1323–1330. [Google Scholar] [CrossRef]
- Salman, B.N.; Vahabi, S.; Movaghar, S.E.; Mahjour, F. Proliferative and inductive effects of Cyclosporine a on gingival fibroblast of child and adult. Dent. Res. J. 2013, 10, 52–58. [Google Scholar] [CrossRef]
- Kataoka, M.; Kido, J.-I.; Shinohara, Y.; Nagata, T. Drug-induced gingival overgrowth—A review. Boil. Pharm. Bull. 2005, 28, 1817–1821. [Google Scholar] [CrossRef] [Green Version]
- Hallmon, W.W.; Rossmann, J.A. The role of drugs in the pathogenesis of gingival overgrowth. A collective review of current concepts. Periodontol. 2000 1999, 21, 176–196. [Google Scholar] [CrossRef]
- Ponnaiyan, D.; Jegadeesan, V. Cyclosporine A: Novel concepts in its role in drug-induced gingival overgrowth. Dent. Res. J. 2015, 12, 499–506. [Google Scholar] [CrossRef]
- Hyland, P.L.; Traynor, P.S.; Myrillas, T.T.; Marley, J.J.; Linden, G.J.; Winter, P.; Leadbetter, N.; Cawston, T.E.; Irwin, C.R. The Effects of Cyclosporin on the Collagenolytic Activity of Gingival Fibroblasts. J. Periodontol. 2003, 74, 437–445. [Google Scholar] [CrossRef] [PubMed]
- Cotrim, P.; de Andrade, C.R.; Martelli-Junior, H.; Graner, E.; Sauk, J.J.; Coletta, R.D. Expression of matrix metalloproteinases in cyclosporin-treated gingival fibroblasts is regulated by transforming growth factor (TGF)-beta1 autocrine stimulation. J. Periodontol. 2002, 73, 1313–1322. [Google Scholar] [CrossRef] [PubMed]
- Kataoka, M.; Shimizu, Y.; Kunikiyo, K.; Asahara, Y.; Yamashita, K.; Ninomiya, M.; Morisaki, I.; Ohsaki, Y.; Kido, J.I.; Nagata, T. Cyclosporin A decreases the degradation of type I collagen in rat gingival overgrowth. J. Cell. Physiol. 2000, 182, 351–358. [Google Scholar] [CrossRef]
- Filaci, G.; Cutolo, M.; Basso, M.; Murdaca, G.; Derchi, L.; Gianrossi, R.; Ropolo, F.; Zentilin, P.; Sulli, A.; Puppo, F.; et al. Long-term treatment of patients affected by systemic sclerosis with cyclosporin A. Rheumatology 2001, 40, 1431–1432. [Google Scholar] [CrossRef] [PubMed] [Green Version]
- Livak, K.J.; Schmittgen, T.D. Analysis of relative gene expression data using real-time quantitative PCR and the 2−∆∆Ct method. Methods 2001, 25, 402–408. [Google Scholar] [CrossRef]


| Gene | Fold Change | Gene Function |
|---|---|---|
| CD44 | 0.74 | Cell–Cell Adhesion |
| CDH1 | 5.01 | Cell–Cell Adhesion |
| COL1A2 | 0.92 | Collagens and Extracellular Matrix Structural constituent |
| COL2A1 | 0.62 | Collagens and Extracellular Matrix Structural constituent |
| COL3A1 | 0.85 | Collagens and Extracellular Matrix Structural constituent |
| COL4A1 | 1.73 | Collagens and Extracellular Matrix Structural constituent |
| COL5A1 | 0.62 | Collagens and Extracellular Matrix Structural constituent |
| COL6A1 | 0.82 | Collagens and Extracellular Matrix Structural constituent |
| COL7A1 | 0.26 | Collagens and Extracellular Matrix Structural constituent |
| COL8A1 | 0.85 | Collagens and Extracellular Matrix Structural constituent |
| COL9A1 | 0.91 | Collagens and Extracellular Matrix Structural constituent |
| COL10A1 | 0.97 | Collagens and Extracellular Matrix Structural constituent |
| COL11A1 | 0.85 | Collagens and Extracellular Matrix Structural constituent |
| CCTNNA1 | 1.25 | Cell Adhesion Molecule |
| CTNNB1 | 1.27 | Cell Adhesion Molecule |
| CTNND2 | 0.96 | Cell Adhesion Molecule |
| FN1 | 0.56 | Cell Adhesion Molecule |
| HAS1 | 0.97 | Transmembrane Receptor |
| ILF3 | 0.93 | Transmembrane Receptor |
| ITGA1 | 1.31 | Transmembrane Receptor |
| ITGA2 | 2.05 | Transmembrane Receptor |
| ITGA3 | 1.47 | Transmembrane Receptor |
| ITGA4 | 0.99 | Transmembrane Receptor |
| ITGA5 | 1.51 | Transmembrane Receptor |
| ITGA6 | 1.08 | Transmembrane Receptor |
| ITGA7 | 2.75 | Transmembrane Receptor |
| ITGA8 | 0.77 | Transmembrane Receptor |
| ITGB1 | 1.03 | Transmembrane Receptor |
| ITGB2 | 0.34 | Transmembrane Receptor |
| ITGB4 | 0.19 | Transmembrane Receptor |
| ITGB5 | 0.63 | Transmembrane Receptor |
| LAMA1 | 0.71 | Basement Membrane Constituent |
| LAMA2 | 0.15 | Basement Membrane Constituent |
| LAMA3 | 0.89 | Basement Membrane Constituent |
| LAMB1 | 0.06 | Basement Membrane Constituent |
| LAMB2 | 1.08 | Basement Membrane Constituent |
| LAMB3 | 2.37 | Basement Membrane Constituent |
| MMP2 | 0.77 | Extracellular Matrix Protease |
| MMP3 | 1.05 | Extracellular Matrix Protease |
| MMP7 | 0.78 | Extracellular Matrix Protease |
| MMP8 | 0.05 | Extracellular Matrix Protease |
| MMP9 | 0.92 | Extracellular Matrix Protease |
| MMP10 | 1.70 | Extracellular Matrix Protease |
| MMP11 | 0.03 | Extracellular Matrix Protease |
| MMP12 | 2.07 | Extracellular Matrix Protease |
| MMP13 | 2.03 | Extracellular Matrix Protease |
| MMP14 | 0.98 | Extracellular Matrix Protease |
| MMP15 | 0.05 | Extracellular Matrix Protease |
| MMP16 | 0.31 | Extracellular Matrix Protease |
| MMP24 | 0.04 | Extracellular Matrix Protease |
| MMP26 | 0.49 | Extracellular Matrix Protease |
| TGFB1 | 1.24 | TGFβ Signaling |
| TGFB2 | 0.74 | TGFβ Signaling |
| TGFB3 | 0.77 | TGFβ Signaling |
| TIMP1 | 0.88 | Extracellular Matrix Protease Inhibitor |
| VCAN | 0.88 | Cell Adhesion Molecule |
| RPL13 | 1.00 | Housekeeping gene |
| Gene | Fold Change | SD (+/−) | Gene Function |
|---|---|---|---|
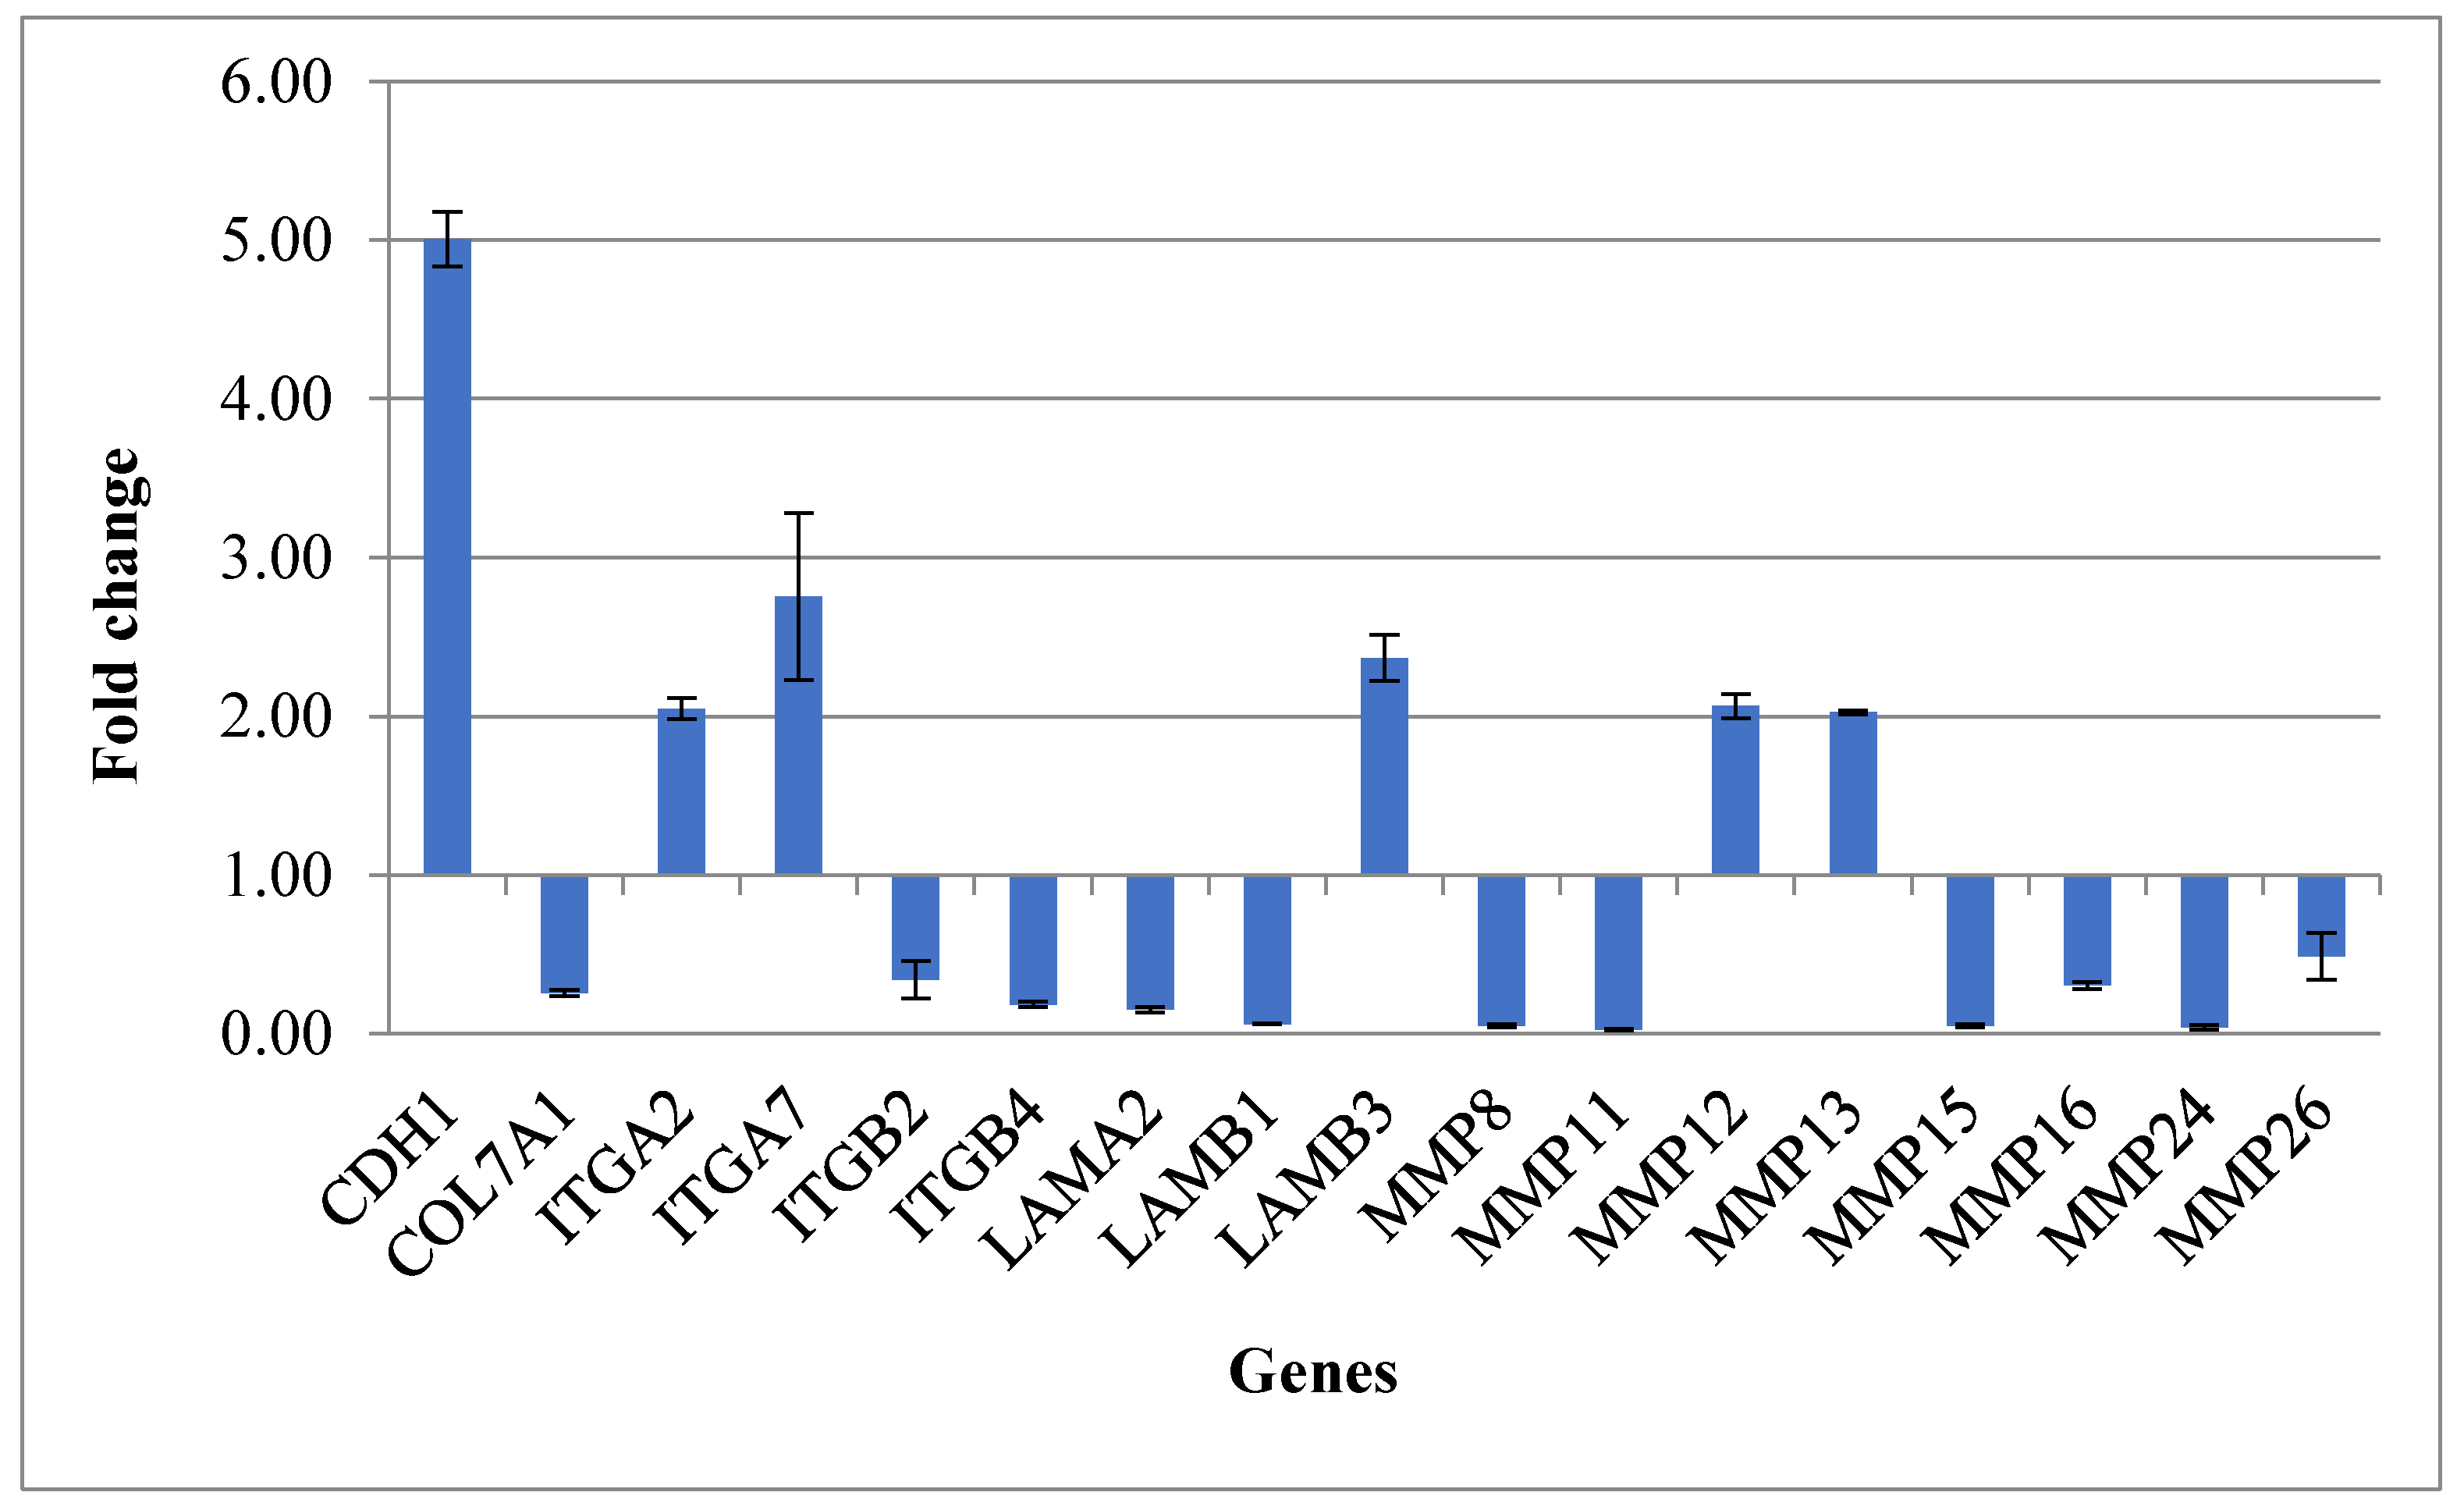
| CDH1 | 5.01 | 0.17 | Cell–Cell Adhesion |
| COL7A1 | 0.26 | 0.02 | Collagens and Extracellular Matrix Structural constituent |
| ITGA2 | 2.05 | 0.07 | Transmembrane Receptor |
| ITGA7 | 2.75 | 0.52 | Transmembrane Receptor |
| ITGB2 | 0.34 | 0.12 | Transmembrane Receptor |
| ITGB4 | 0.19 | 0.02 | Transmembrane Receptor |
| LAMA2 | 0.15 | 0.02 | Basement Membrane Constituent |
| LAMB1 | 0.06 | 0.00 | Basement Membrane Constituent |
| LAMB3 | 2.37 | 0.14 | Basement Membrane Constituent |
| MMP8 | 0.05 | 0.01 | Extracellular Matrix Protease |
| MMP11 | 0.03 | 0.00 | Extracellular Matrix Protease |
| MMP12 | 2.07 | 0.08 | Extracellular Matrix Protease |
| MMP13 | 2.03 | 0.01 | Extracellular Matrix Protease |
| MMP15 | 0.05 | 0.01 | Extracellular Matrix Protease |
| MMP16 | 0.31 | 0.02 | Extracellular Matrix Protease |
| MMP24 | 0.04 | 0.01 | Extracellular Matrix Protease |
| MMP26 | 0.49 | 0.15 | Extracellular Matrix Protease |
| Gene Name | Primer Sequence 5′–3′ |
|---|---|
| CD44 | f-TTATCAGGAGACCAAGACC r-ATCCATTCTGGAATTTG |
| CDH1 | f-CTGGGCAGAGTGAATTTTG r-GACTGTAATCACACCATCTG |
| COL1A2 | f-GTGGTTACTACTGGATTGAC r-CTGCCAGCATTGATAGTTTC |
| COL2A1 | f-GAAGAGTGGAGACTACTGG r-CAGATGTGTTTCTTCTCCTTG |
| COL3A1 | f-ATTCACCTACACAGTTCTGG r-TGCGTGTTCGATATTCAAAG |
| COL4A1 | f-AAAGGGAGATCAAGGGATAG r-TCACCTTTTTCTCCAGGTAG |
| COL5A1 | f-TTGACGAGAACTACTACGAC r-ATCCCTTCATAGATGGTATCC |
| COL6A1 | f-AGCTCAATGTCATTTCTTGC r-AGGTGTAATCTGGACACTTC |
| COL7A1 | f-ATGACCTTGGCATTATCTTG r-TGAATATGTCACCTCTCAAGG |
| COL8A1 | f-CTCAAGAAGCTGTTGTGAAG r-CAGGACTGCTGAATCAAATC |
| COL9A1 | f-ACCTAAAGGTGACTTGGG r-CATTTCTGCCATAGCTGG |
| COL10A1 | f-GCTAGTATCCTTGAACTTGG r-CCTTTACTCTTTATGGTGTAGG |
| COL11A1 | f-AGATGAGGCAAACATCGTTGA r-ATCAGAATCCCTGCCGTCTA |
| CCTNNA1 | f-CAAACAAATCATTGTGGACC r-CACTAATGATGCTTTCCAGAC |
| CTNNB1 | f-CAACTAAACAGGAAGGGATG r-CACAGGTGACCACATTTATATC |
| CTNND2 | f-AGAGAATTTGGATGGAGAGAC r-TTGTTGTCTCCAAAACAGAG |
| FN1 | f-CCATAGCTGAGAAGTGTTTTG r-CAAGTACAATCTACCATCATCC |
| HAS1 | f-TACTTCCACTGTGTATCCTG r-GTGTACTTGGTAGCATAACC |
| ILF3 | f-CCTGTGTGAGAAATCCATTG r-TTCACAAGGGTCATAAATGC |
| ITGA1 | f-CAGGTTGGAATTGTACAGTATG r-TGTCTATTCCAAGAGCTTGTC |
| ITGA2 | f-GGTGGGGTTAATTCAGTATG r-ATATTGGGATGTCTGGGATG |
| ITGA3 | f-AGGTAATCCATGGAGAGAAG r-GTAGAAGTTCTCATCCACATC |
| ITGA4 | f-AAAGCTTGGATCGTACTTTG r-CTCTTCCTTCCTCTCTGATG |
| ITGA5 | f-AAGCTTGGATTCTTCAAACG r-TCCTTTTCAGTAGAATGAGGG |
| ITGA6 | f-AAATACCAAACCAACACAGG r-TACTGAATCTGAGAGGGAAC |
| ITGA7 | f-CATGAACAATTTGGGTTCTG r-GCCCTTCCAATTATAGGTTC |
| ITGA8 | f-CAATATTGGACCAAGTACCATC r-GGCTTTATATCCTGTGGATTG |
| ITGB1 | f-ATTCCCTTTCCTCAGAAGTC r-TTTTCTTCCATTTTCCCCTG |
| ITGB2 | f-AGATTTGCAGGTATTGATGG r-ATTTCTAAAGCAATAGCCCG |
| ITGB4 | f-ATCTGGACAACCTCAAGAAG r-GCCAAATCCAATAGTGTAGTC |
| ITGB5 | f-TAGTATCCGGTCTAAAGTGG r-CTCTGACCAGGATAGGATAC |
| LAMA1 | f-CATACATCACTCATCAATGGC r-TAGCGTCTGGTAACAATAGG |
| LAMA2 | f-AATAAATCTCGCTGTGAGTG r-GTTAGAAAAGTTCCAGCTCTC |
| LAMA3 | f-GAATCAGTTGCTCAACTACC r-TCAGTCAGTTCTCTTTCCAG |
| LAMB1 | f-GTGTGTATAGATACTTCGCC r-AAAGCACGAAATATCACCTC |
| LAMB2 | f-AGTTTCATTTCACACACCTC r-ACTCACAGACTACATCATCC |
| LAMB3 | f-CTTATGGATTTAGTGTCTGGG r-CTGGTGAAATTGACTCTCAAG |
| MMP2 | f-GTGATCTTGACCAGAATACC r-GCCAATGATCCTGTATGTG |
| MMP3 | f-TTTCCCAAGCAAATAGCTGAA r-AGTTCCCTTGAGTGTGACTCG |
| MMP7 | f-GGGATTAACTTCCTGTATGC r-GATCTCCATTTCCATAGGTTG |
| MMP8 | f-AAGTTGATGCAGTTTTCCAG r-CTGAACTTCCTTCAACATTC |
| MMP9 | f-AAGGATGGGAAGTACTGG r-GCCCAGAGAAGAAGAAAAG |
| MMP10 | f-AGCGGACAAATACTGGAG r-GTGATGATCCACTGAAGAAG |
| MMP11 | f-GATAGACACCAATGAGATTGC r-TTTGAAGAAAAAGAGCTCGC |
| MMP12 | f-AGGTATGATGAAAGGAGACAG r-ATCAATTTTAGGCCCGATTC |
| MMP13 | f-AGTTCGGCCACTCCTTAGGT r-TGGTAATGGCATCAAGGGAT |
| MMP14 | f-ATGGCAAATTCGTCTTCTTC r-CGTTGAAACGGTAGTACTTG |
| MMP15 | f-ATCTGACCTTTAGCATCCAG r-CAAAGAGTACCATGATGTCG |
| MMP16 | f-ACCCTCATGACTTGATAACC r-TCTGTCTCCCTTGAAGAAATAG |
| MMP24 | f-CAAAGGTGACAAGTATTGGG r-TTGAAAAAGTAGGTCTTGCC |
| MMP26 | f-AAGGATCCAGCATTTGTATG r-CTTTGATCCTCCAATAAACTCC |
| TGFB1 | f-AACCCACAACGAAATCTATG r-CTTTTAACTTGAGCCTCAGC |
| TGFB2 | f-AGATTTGCAGGTATTGATGG r-ATTTCTAAAGCAATAGGCCG |
| TGFB3 | f-TGTTGAGAAGAGAGTCCAAC r-ATCACCTCGTGAATGTTTTC |
| TIMP1 | f-CACCTTATACCAGCGTTATG r-TTTCCAGCAATGAGAAACTC |
| VCAN | f-CCAGTGTGAACTTGATTTTG r-CAACATAACTTGGAAGGCAG |
| RPL13 | f-ATTCACAAGAAGGGAGACAG r-GAAATTCTTCTCTTCCTCAGTG |
© 2020 by the authors. Licensee MDPI, Basel, Switzerland. This article is an open access article distributed under the terms and conditions of the Creative Commons Attribution (CC BY) license (http://creativecommons.org/licenses/by/4.0/).
Share and Cite
Lauritano, D.; Palmieri, A.; Lucchese, A.; Di Stasio, D.; Moreo, G.; Carinci, F. Role of Cyclosporine in Gingival Hyperplasia: An In Vitro Study on Gingival Fibroblasts. Int. J. Mol. Sci. 2020, 21, 595. https://doi.org/10.3390/ijms21020595
Lauritano D, Palmieri A, Lucchese A, Di Stasio D, Moreo G, Carinci F. Role of Cyclosporine in Gingival Hyperplasia: An In Vitro Study on Gingival Fibroblasts. International Journal of Molecular Sciences. 2020; 21(2):595. https://doi.org/10.3390/ijms21020595
Chicago/Turabian StyleLauritano, Dorina, Annalisa Palmieri, Alberta Lucchese, Dario Di Stasio, Giulia Moreo, and Francesco Carinci. 2020. "Role of Cyclosporine in Gingival Hyperplasia: An In Vitro Study on Gingival Fibroblasts" International Journal of Molecular Sciences 21, no. 2: 595. https://doi.org/10.3390/ijms21020595