Characterizing Vascular Dysfunction in Genetically Modified Mice through the Hyperoxia Model

 ,
,
Abstract
:
1. Introduction
2. Results
3. Discussion
4. Materials and Methods
4.1. Animals
4.2. Experimental
4.2.1. Anesthesia and Setting
4.2.2. Hyperoxia
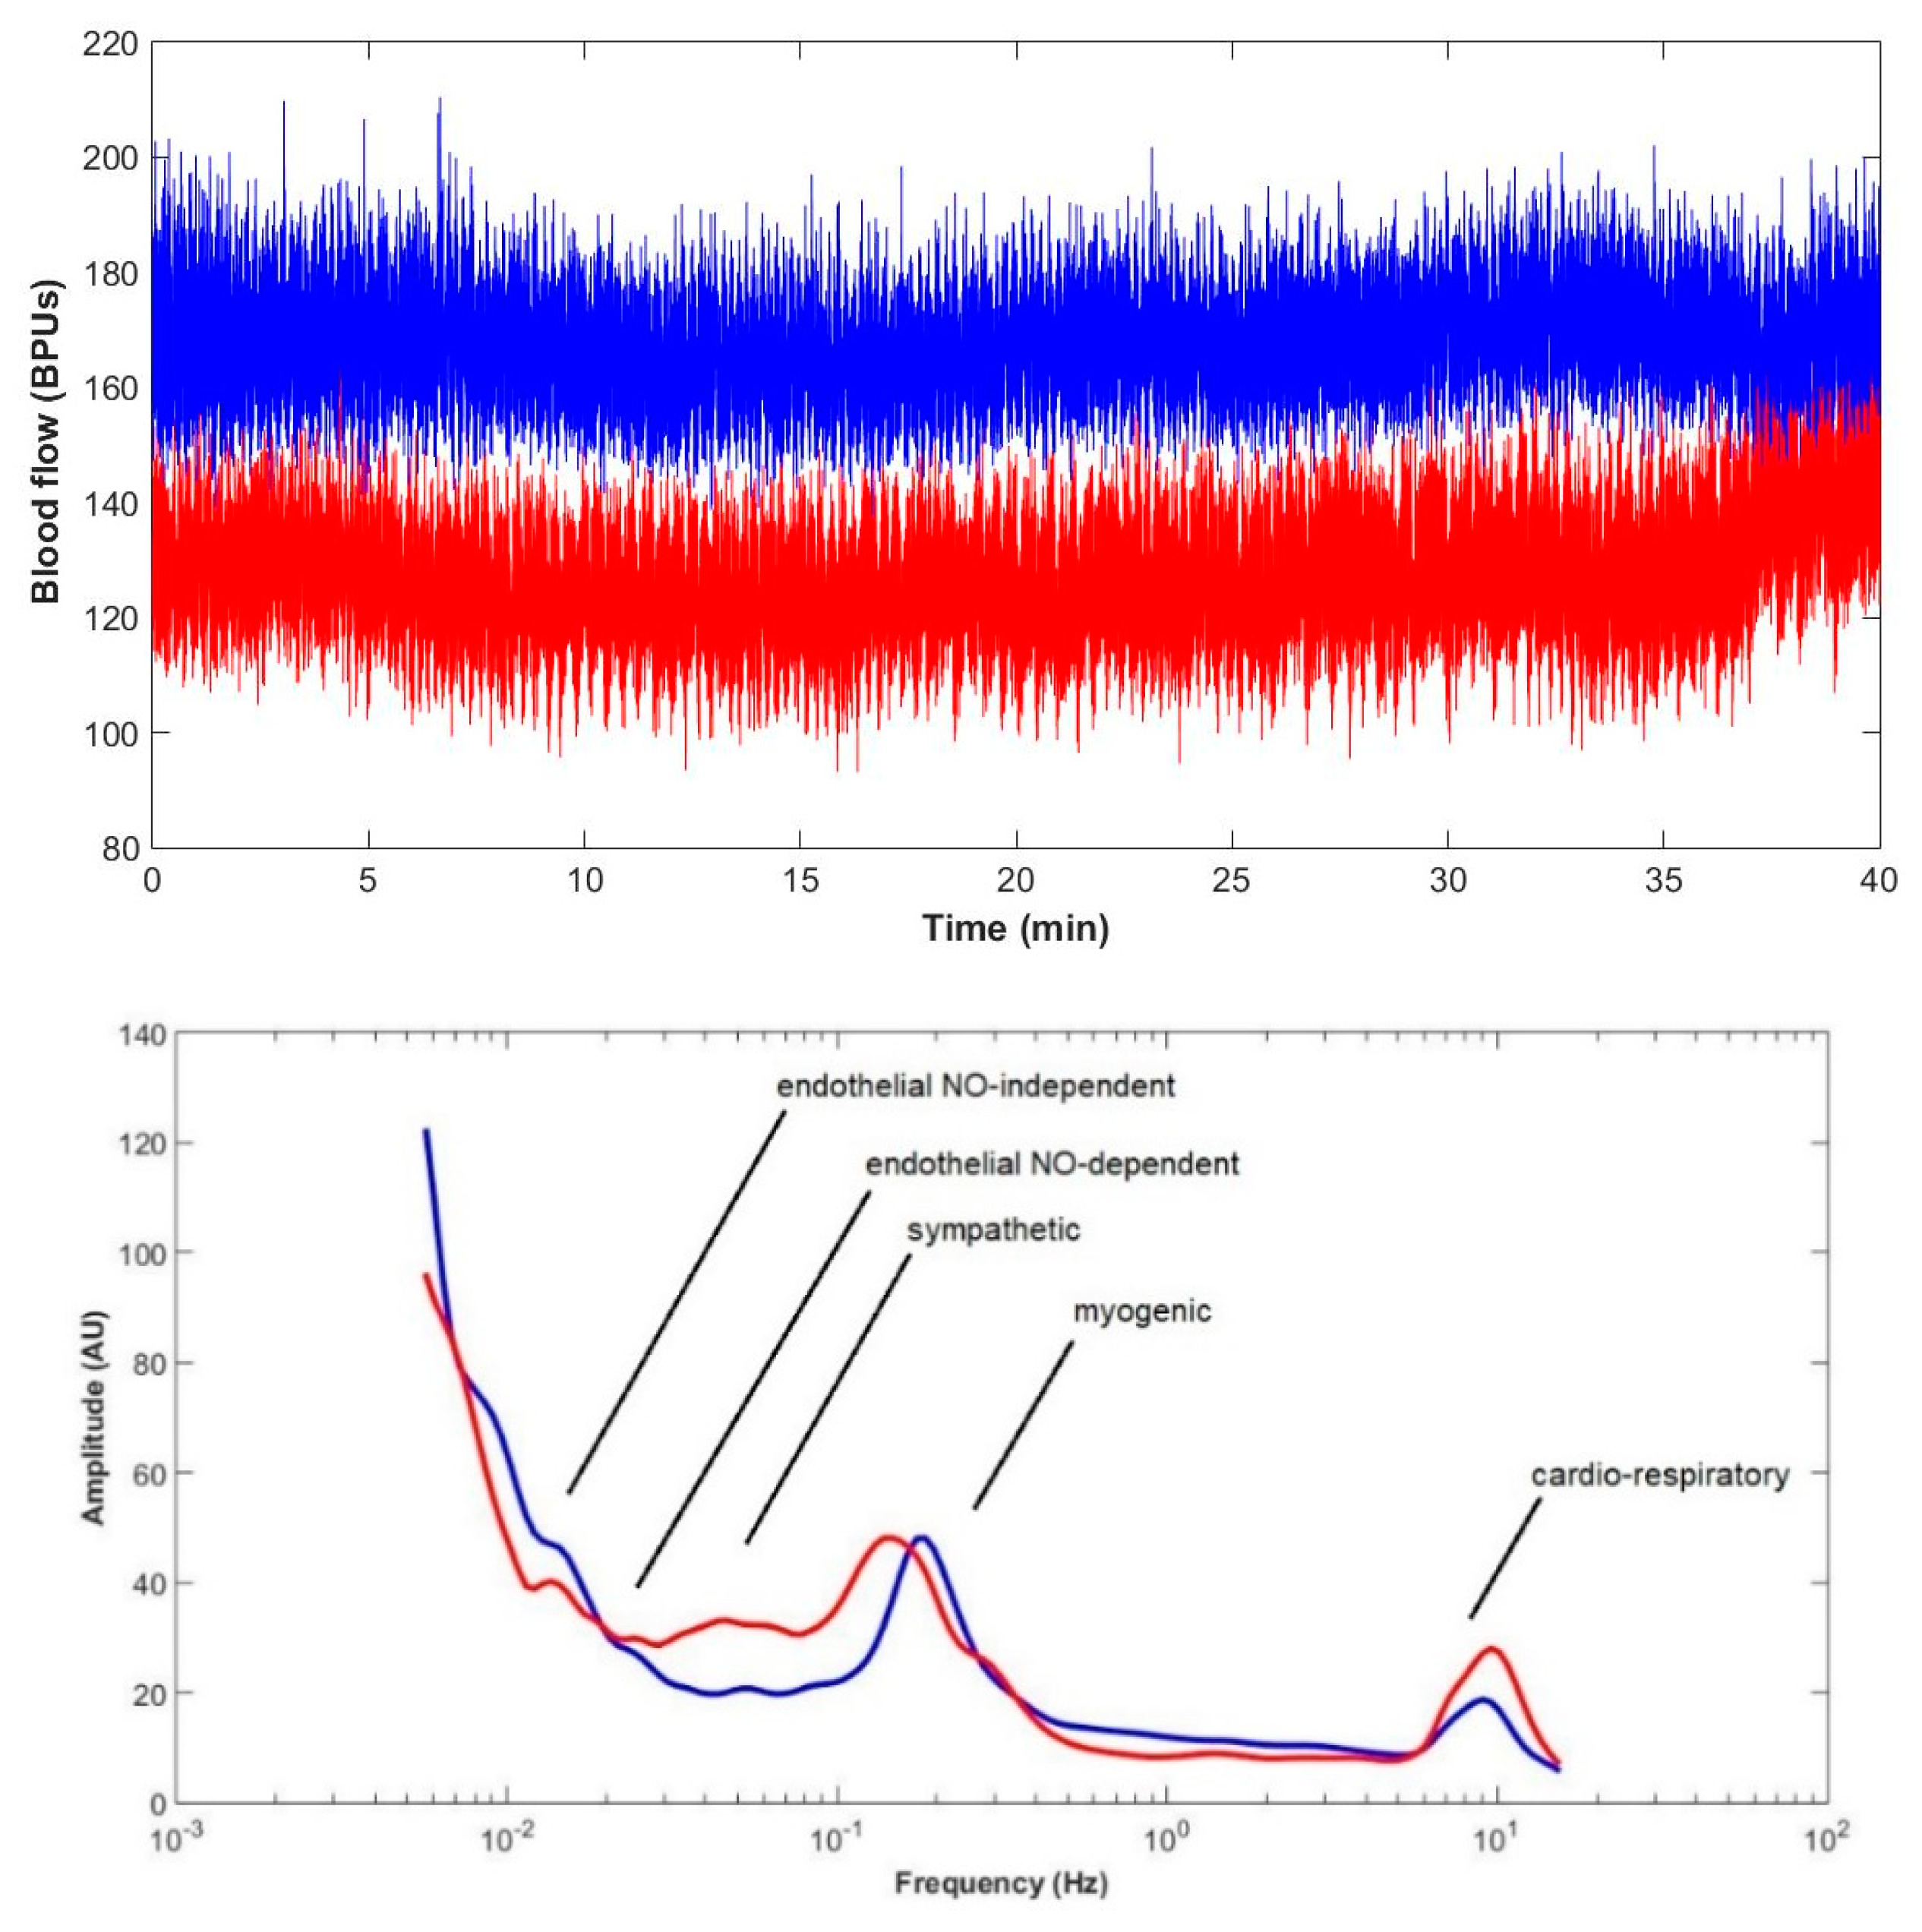
4.2.3. Data Collection and Signal Analysis
4.2.4. Statistics
5. Conclusions
Author Contributions
Funding
Conflicts of Interest
References
- Rousseau, A.; Bak, Z.; Janerot-Sjoberg, B.; Sjoberg, F. Acute hyperoxaemia-induced effects on regional blood flow, oxygen consumption and central circulation in man. Acta Physiol. Scand. 2005, 183, 231–240. [Google Scholar] [CrossRef] [PubMed]
- Bak, Z.; Sjoberg, F.; Rousseau, A.; Steinvall, I.; Janerot-Sjoberg, B. Human cardiovascular dose-response to supplemental oxygen. Acta Physiol. (Oxford) 2007, 191, 15–24. [Google Scholar] [CrossRef] [PubMed]
- Silva, H.; Ferreira, H.; Bujan, M.J.; Rodrigues, L.M. Regarding the quantification of peripheral microcirculation--Comparing responses evoked in the in vivo human lower limb by postural changes, suprasystolic occlusion and oxygen breathing. Microvasc. Res. 2015, 99, 110–117. [Google Scholar] [CrossRef]
- Branson, R.D.; Robinson, B.R. Oxygen: When is more the enemy of good? Intensive. Care Med. 2011, 37, 1–3. [Google Scholar] [CrossRef]
- Silva, H.; Ferreira, H.; Rodrigues, L.M. Studying the Oscillatory Components of Human Skin Microcirculation. In Agache’s Measuring the Skin; Humbert, P., Fanian, F., Maibach, H., Agache, P., Eds.; Springer: Cham, Switzerland, 2017; Chapter 55; p. 569. [Google Scholar] [CrossRef]
- Rodrigues, L.M.; Silva, H.; Ferreira, H.; Renault, M.A.; Gadeau, A.P. Observations on the perfusion recovery of regenerative angiogenesis in an ischemic limb model under hyperoxia. Physiol. Rep. 2018, 6, e13736. [Google Scholar] [CrossRef] [PubMed]
- Stefanovska, A.; Krošelj, P. Correlation integral and frequency analysis of cardiovascular functions. Open Syst. Inf. Dyn. 1997, 4, 457–478. [Google Scholar] [CrossRef]
- Esen, F.; Aydın, G.S.; Esen, H. Detrended fluctuation analysis of laser Doppler flowmetry time series. Microvasc. Res. 2009, 78, 314–318. [Google Scholar] [CrossRef]
- Humeau, A.; Buard, B.; Mahé, G.; Rousseau, D.; Chapeau-Blondeau, F.; Abraham, P. Multiscale entropy of laser Doppler flowmetry signals in healthy human subjects. Med. Phys. 2010, 37, 6142–6146. [Google Scholar] [CrossRef]
- Stauss, H.M.; Anderson, E.A.; Haynes, W.G.; Kregel, K.C. Frequency response characteristics of sympathetically mediated vasomotor waves in humans. Am. J. Physiol. Heart Circ. Physiol. 1998, 274, H1277–H1283. [Google Scholar] [CrossRef] [PubMed]
- Kvandal, P.; Landsverk, S.A.; Bernjak, A.; Stefanovska, A.; Kvernmo, H.D.; Kirkebøen, K.A. Low frequency oscillations of the laser Doppler perfusion signal in human skin. Microvasc. Res. 2006, 72, 120–127. [Google Scholar] [CrossRef]
- Kvernmo, H.D.; Stefanovska, A.; Kirkebøen, K.A.; Kvernebo, K. Oscillations in the human cutaneous blood perfusion signal modified by endothelium-dependent and endothelium-independent vasodilators. Microvasc. Res. 1999, 57, 298–309. [Google Scholar] [CrossRef] [PubMed]
- Sifuzzaman, M.; Islam, M.R.; Ali, M.Z. Application of wavelet transform and its advantages compared to Fourier transform. J. Phys. Sci. 2012, 13, 121–134. [Google Scholar]
- Bernjak, A.; Stefanovska, A. Importance of wavelet analysis in laser Doppler flowmetry time series. Conf. Proc. IEEE Eng. Med. Biol. Soc. 2007, 4064–4067. [Google Scholar] [CrossRef]
- Astashev, M.E.; Serov, D.A.; Tankanag, A.V. Anesthesia effects on the low frequency blood flow oscillations in mouse skin. Skin Res. Technol. 2018, 1, 1–7. [Google Scholar] [CrossRef] [PubMed]
- Sinski, M.; Lewandowski, J.; Przybylski, J.; Zalewsky, P.; Bartosz, S.; Abramczyk, P.; Gaciong, Z. Deactivation of carotid body chemoreceptors by hyperoxia decreases blood pressure in hypertensive patients. Hypertens. Res. 2014, 37, 858–862. [Google Scholar] [CrossRef]
- Despas, F.; Lambert, E.; Vaccaro, A.; Labrunee, M.; Franchitto, N.; Lebrin, M.; Galinier, M.; Senard, J.M.; Lambert, G.; Esler, M.; Pathak, A. Peripheral chemoreflex activation contributes to sympathetic baroreflex impairment in chronic heart failure. J. Hypertens. 2012, 30, 753–760. [Google Scholar] [CrossRef]
- Svorc, P., Jr.; Bacova, I.; Svorc, P.; Bužga, M. Autonomic nervous system under ketamine/xylazine and pentobarbital anaesthesia in a Wistar rat model: A chronobiological view. Prague Med. Rep. 2013, 114, 72–80. [Google Scholar] [CrossRef]
- Grundy, D. Principles and standards for reporting animal experiments in The Journal of Physiology and Experimental Physiology. J. Physiol. 2015, 593, 2547–2549. [Google Scholar] [CrossRef] [Green Version]
- Krisch, J.A. How Much Do Sex Differences Matter in Mouse Studies? The scientist feb 24. 2017. Available online: https://www.the-scientist.com/news-analysis/how-much-do-sex-differences-matter-in-mouse-studies-31974 (accessed on 30 April 2019).
- Hsu, W.H. Effects of atropine on xylazine-pentobarbital anesthesia in dogs: Preliminary study. Am. J. Vet. Res. 1985, 46, 856–858. [Google Scholar]
- Stansberry, K.B.; Shapiro, S.A.; Hill, M.A.; McNitt, P.M.; Meyer, M.D.; Vinik, A.I. Impaired peripheral vasomotion in diabetes. Diabetes Care 1996, 19, 715–721. [Google Scholar] [CrossRef]
- Kobayashi, D.; Murai, H.; Usui, S.; Kaneko, S.; Takamura, M. Sympathetic nerve activity in type 2 diabetes mellitus; a promising potential therapeutic target. Austin J. Endocrinol. Diabetes 2014, 1, 1007. [Google Scholar]
- Schlaich, M.P.; Kaye, D.M.; Lambert, E.; Sommerville, M.; Socratous, F.; Esler, M.D. Relation between cardiac sympathetic activity and hypertensive left ventricular hypertrophy. Circulation 2003, 108, 560–565. [Google Scholar] [CrossRef] [PubMed]
- Hile, C.; Veves, A. Diabetic neuropathy and microcirculation. Curr. Diab. Rep. 2003, 3, 446. [Google Scholar] [CrossRef] [PubMed]
- Newman, J.M.; Dwyer, R.M.; St-Pierre, P.; Richards, S.M.; Clark, M.G.; Rattigan, S. Decreased microvascular vasomotion and myogenic response in rat skeletal muscle in association with acute insulin resistance. J. Physiol. 2009, 587, 2579–2588. [Google Scholar] [CrossRef] [PubMed] [Green Version]
- Andersson, S.E.; Edvinsson, M.L.; Edvinsson, L. Cutaneous vascular reactivity is reduced in aging and in heart failure: Association with inflammation. Clin. Sci. 2003, 105, 699. [Google Scholar] [CrossRef]
- Edvinsson, M.L.; Uddman, E.; Andersson, S.E. Deteriorated function of cutaneous microcirculation in chronic congestive heart failure. J. Geriatr. Cardiol. 2011, 8, 82. [Google Scholar] [CrossRef]
- Nakamura, T.Y.; Iwata, Y.; Arai, Y.; Komamura, K.; Wakabayashi, S. Activation of Na+/H+ exchanger 1 is sufficient to generate Ca2+ signals that induce cardiac hypertrophy and heart failure. Circ. Res. 2008, 103, 891–899. [Google Scholar] [CrossRef]
- Belke, D.D.; Severson, D.L. Diabetes in mice with monogenic obesity: The db/db mouse and its use in the study of cardiac consequences. Methods Mol. Biol. 2012, 933, 47–57. [Google Scholar] [CrossRef]
- Wang, B.; Chandrasekera, P.C.; Pippin, J.J. Leptin- and leptin receptor-deficient rodent models: Relevance for human type 2 diabetes. Curr. Diabetes Rev. 2014, 10, 131–145. [Google Scholar] [CrossRef]
- Bracic, M.; Stefanovska, A. Wavelet-based analysis of human blood flow dynamics. Bull Math. Biol. 1998, 60, 919–935. [Google Scholar] [CrossRef]
- Silva, H.; Renault, M.; Ferreira, H.; Bujan, M.J.; Gadeau, A.; Rodrigues, L.M. Hyperoxia evokes opposite hind limbs vascular responses in the murine model of ischemia. ISBS 40th World Congress Abstract Book. Biomed. Biopharm. Res. 2016, 15. [Google Scholar] [CrossRef]

| BPUs (m ± sd)/Groups | Phase 1 | Phase 2 | Phase 3 | |||
|---|---|---|---|---|---|---|
| Right Limb | Left Limb | Right Limb | Left Limb | Right Limb | Left Limb | |
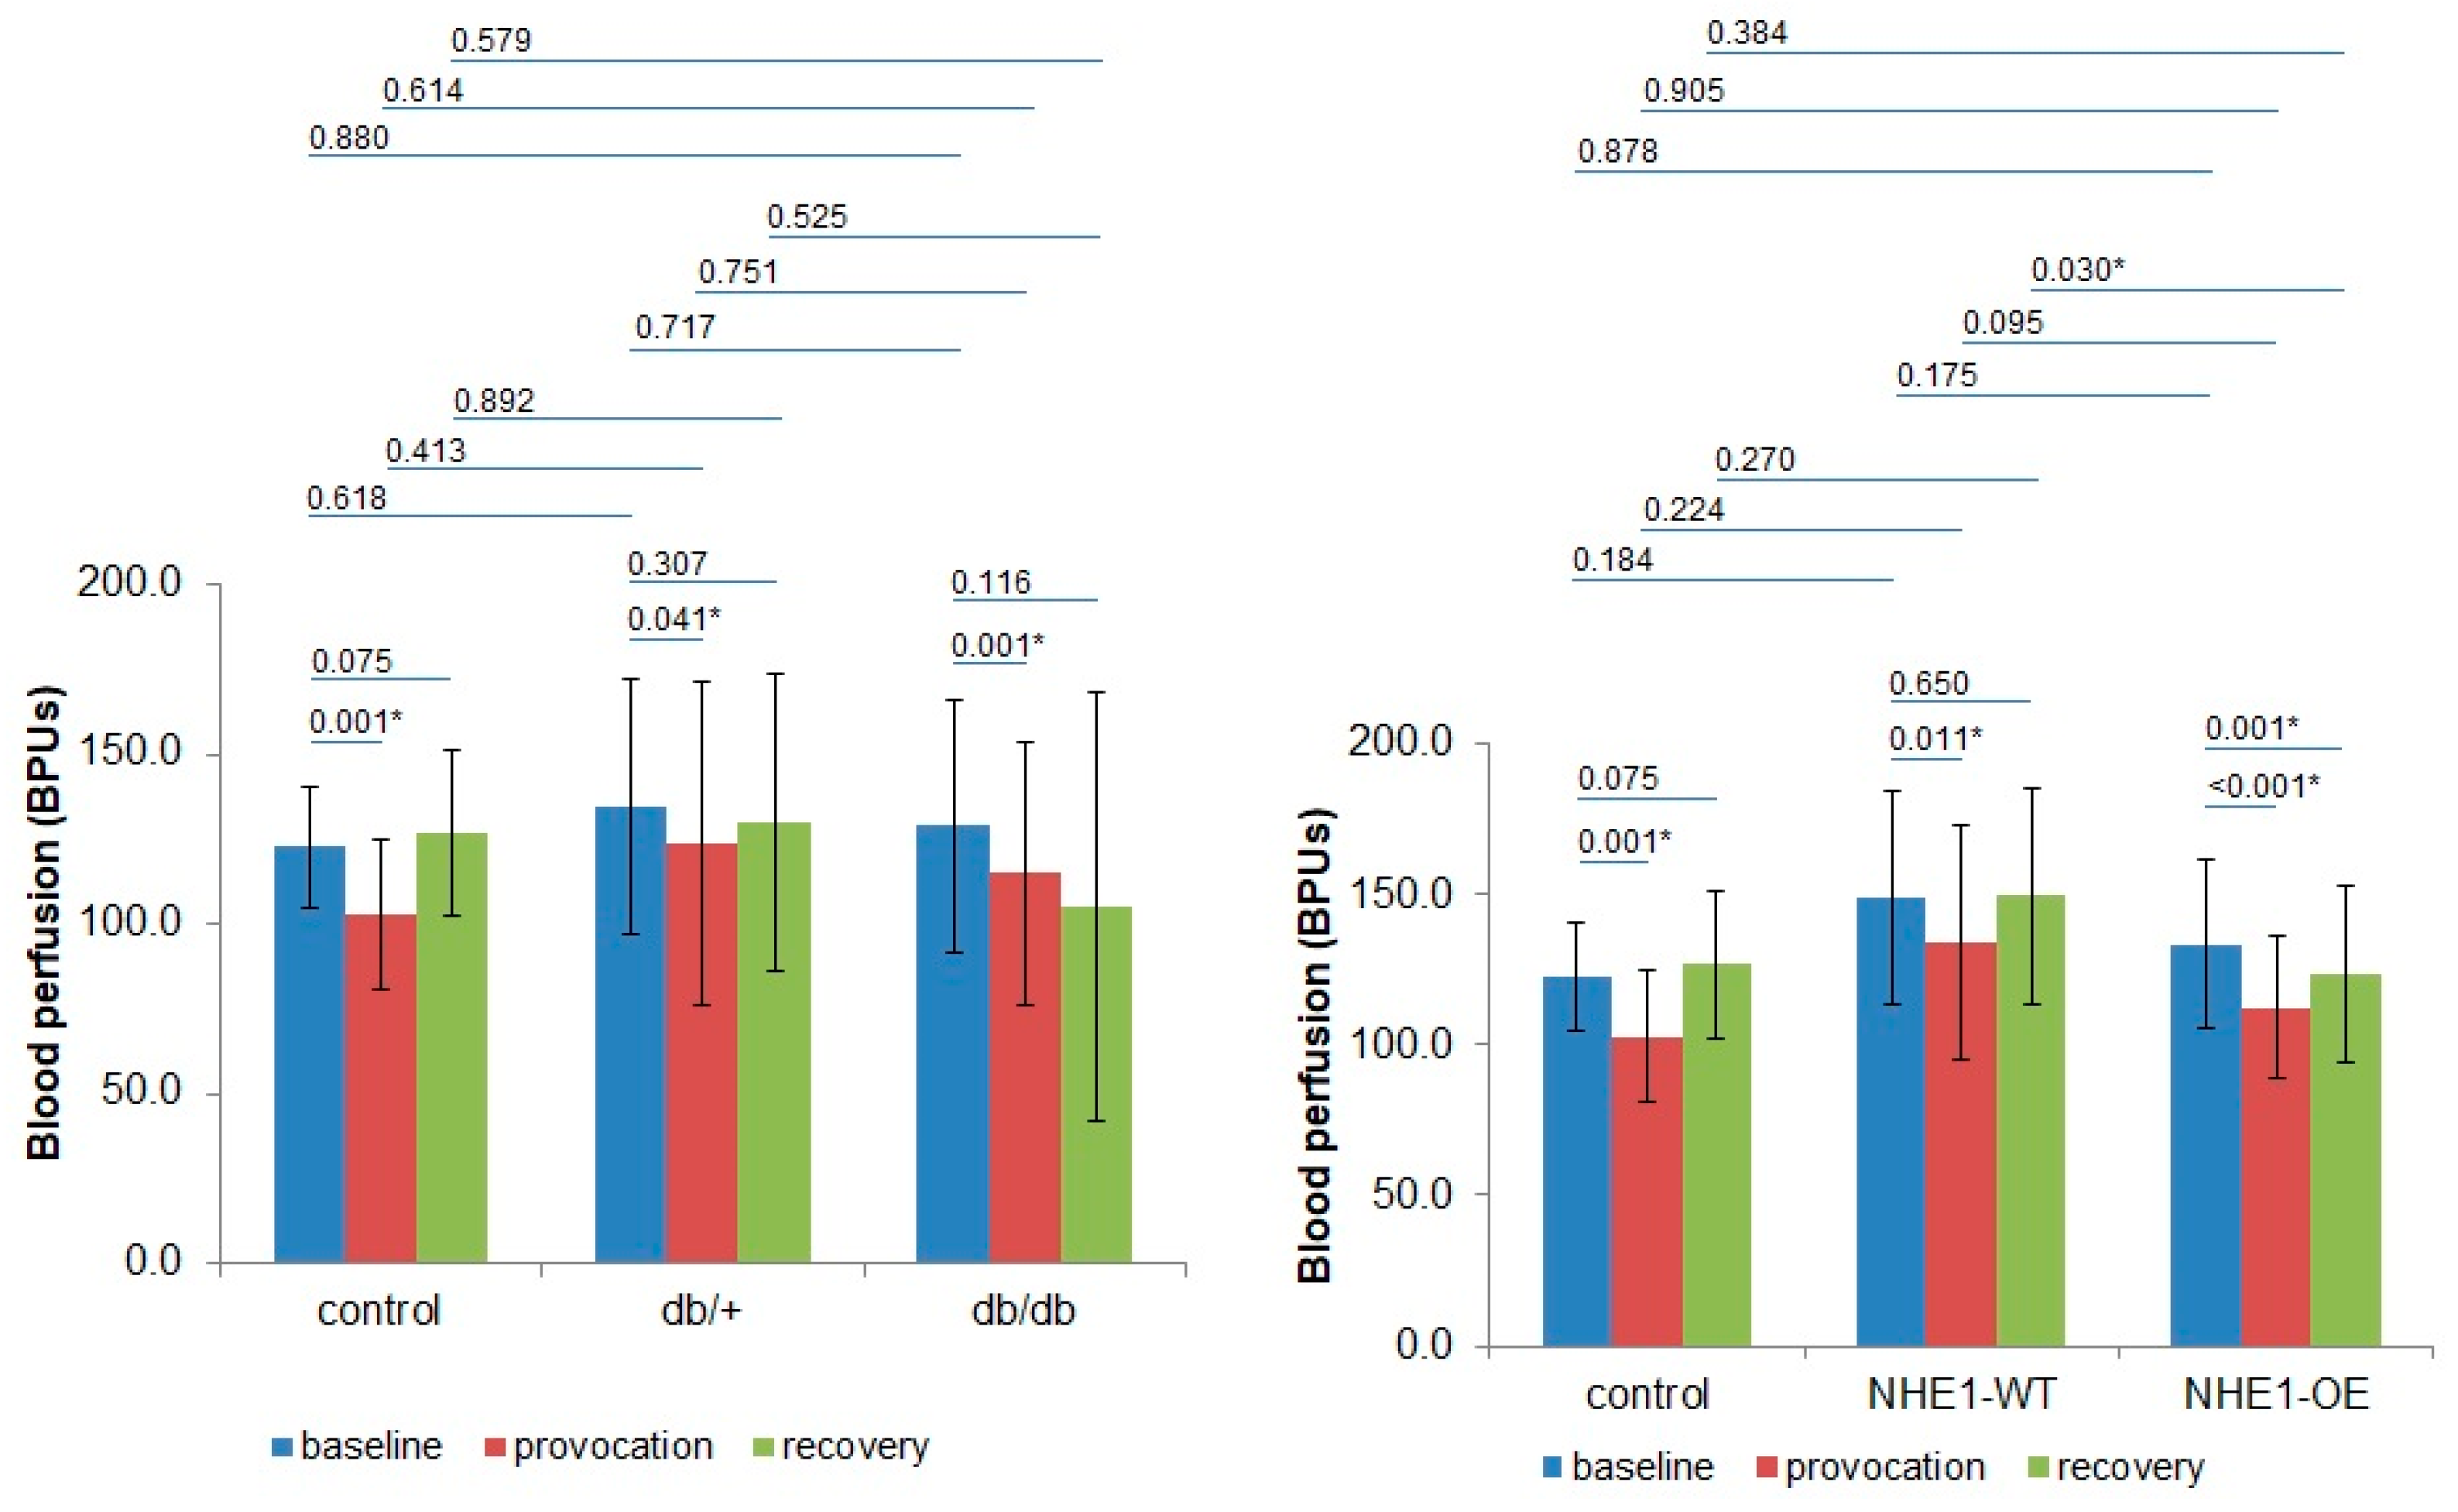
| Control (n = 8) | 120.5 ± 13.8 | 126.0 ± 25.1 | 101.2 ± 17.7 | 105.4 ± 29.8 | 127.7 ± 13.8 | 125.1 ± 38.61 |
| p | 0.943 | 0.943 | 0.724 | |||
| db/+ (n = 8) | 139.6 ± 49.7 | 141.9 ± 41.1 | 129.4 ± 64.2 | 134.8 ± 52.6 | 132.8 ± 63.2 | 144.84 ± 9.1 |
| p | 0.645 | 0.574 | 0.505 | |||
| db/db (n = 8) | 135.8 ± 47.4 | 127.0 ± 15.4 | 123.8 ± 50.8 | 130.2 ± 48.3 | 119.2 ± 71.4 | 114.1 ± 56.5 |
| p | 0.721 | 0.574 | 0.878 | |||
| NHE1-WT (n = 8) | 158.1 ± 36.4 | 140.6 ± 34.3 | 138.2 ± 42.4 | 127.2 ± 33.0 | 145.7 ± 35.0 | 153.0 ± 36.9 |
| p | 0.234 | 0.645 | 0.505 | |||
| NHE1-OE (n = 9) | 138.9 ± 29.8 | 128.2 ± 25.8 | 118.0 ± 25.0 | 106.8 ± 21.6 | 133.0 ± 29.5 | 113.7 ± 27.0 |
| p | 0.387 | 0.297 | 0.161 | |||
| LDF Components/Groups | Cardiorespiratory | Myogenic | Sympathetic | Endothelial (NOd) | Endothelial (NOi) | ||||||||||
|---|---|---|---|---|---|---|---|---|---|---|---|---|---|---|---|
| Ph1 | Ph2 | Ph3 | Ph1 | Ph2 | Ph3 | Ph1 | Ph2 | Ph3 | Ph1 | Ph2 | Ph3 | Ph1 | Ph2 | Ph3 | |
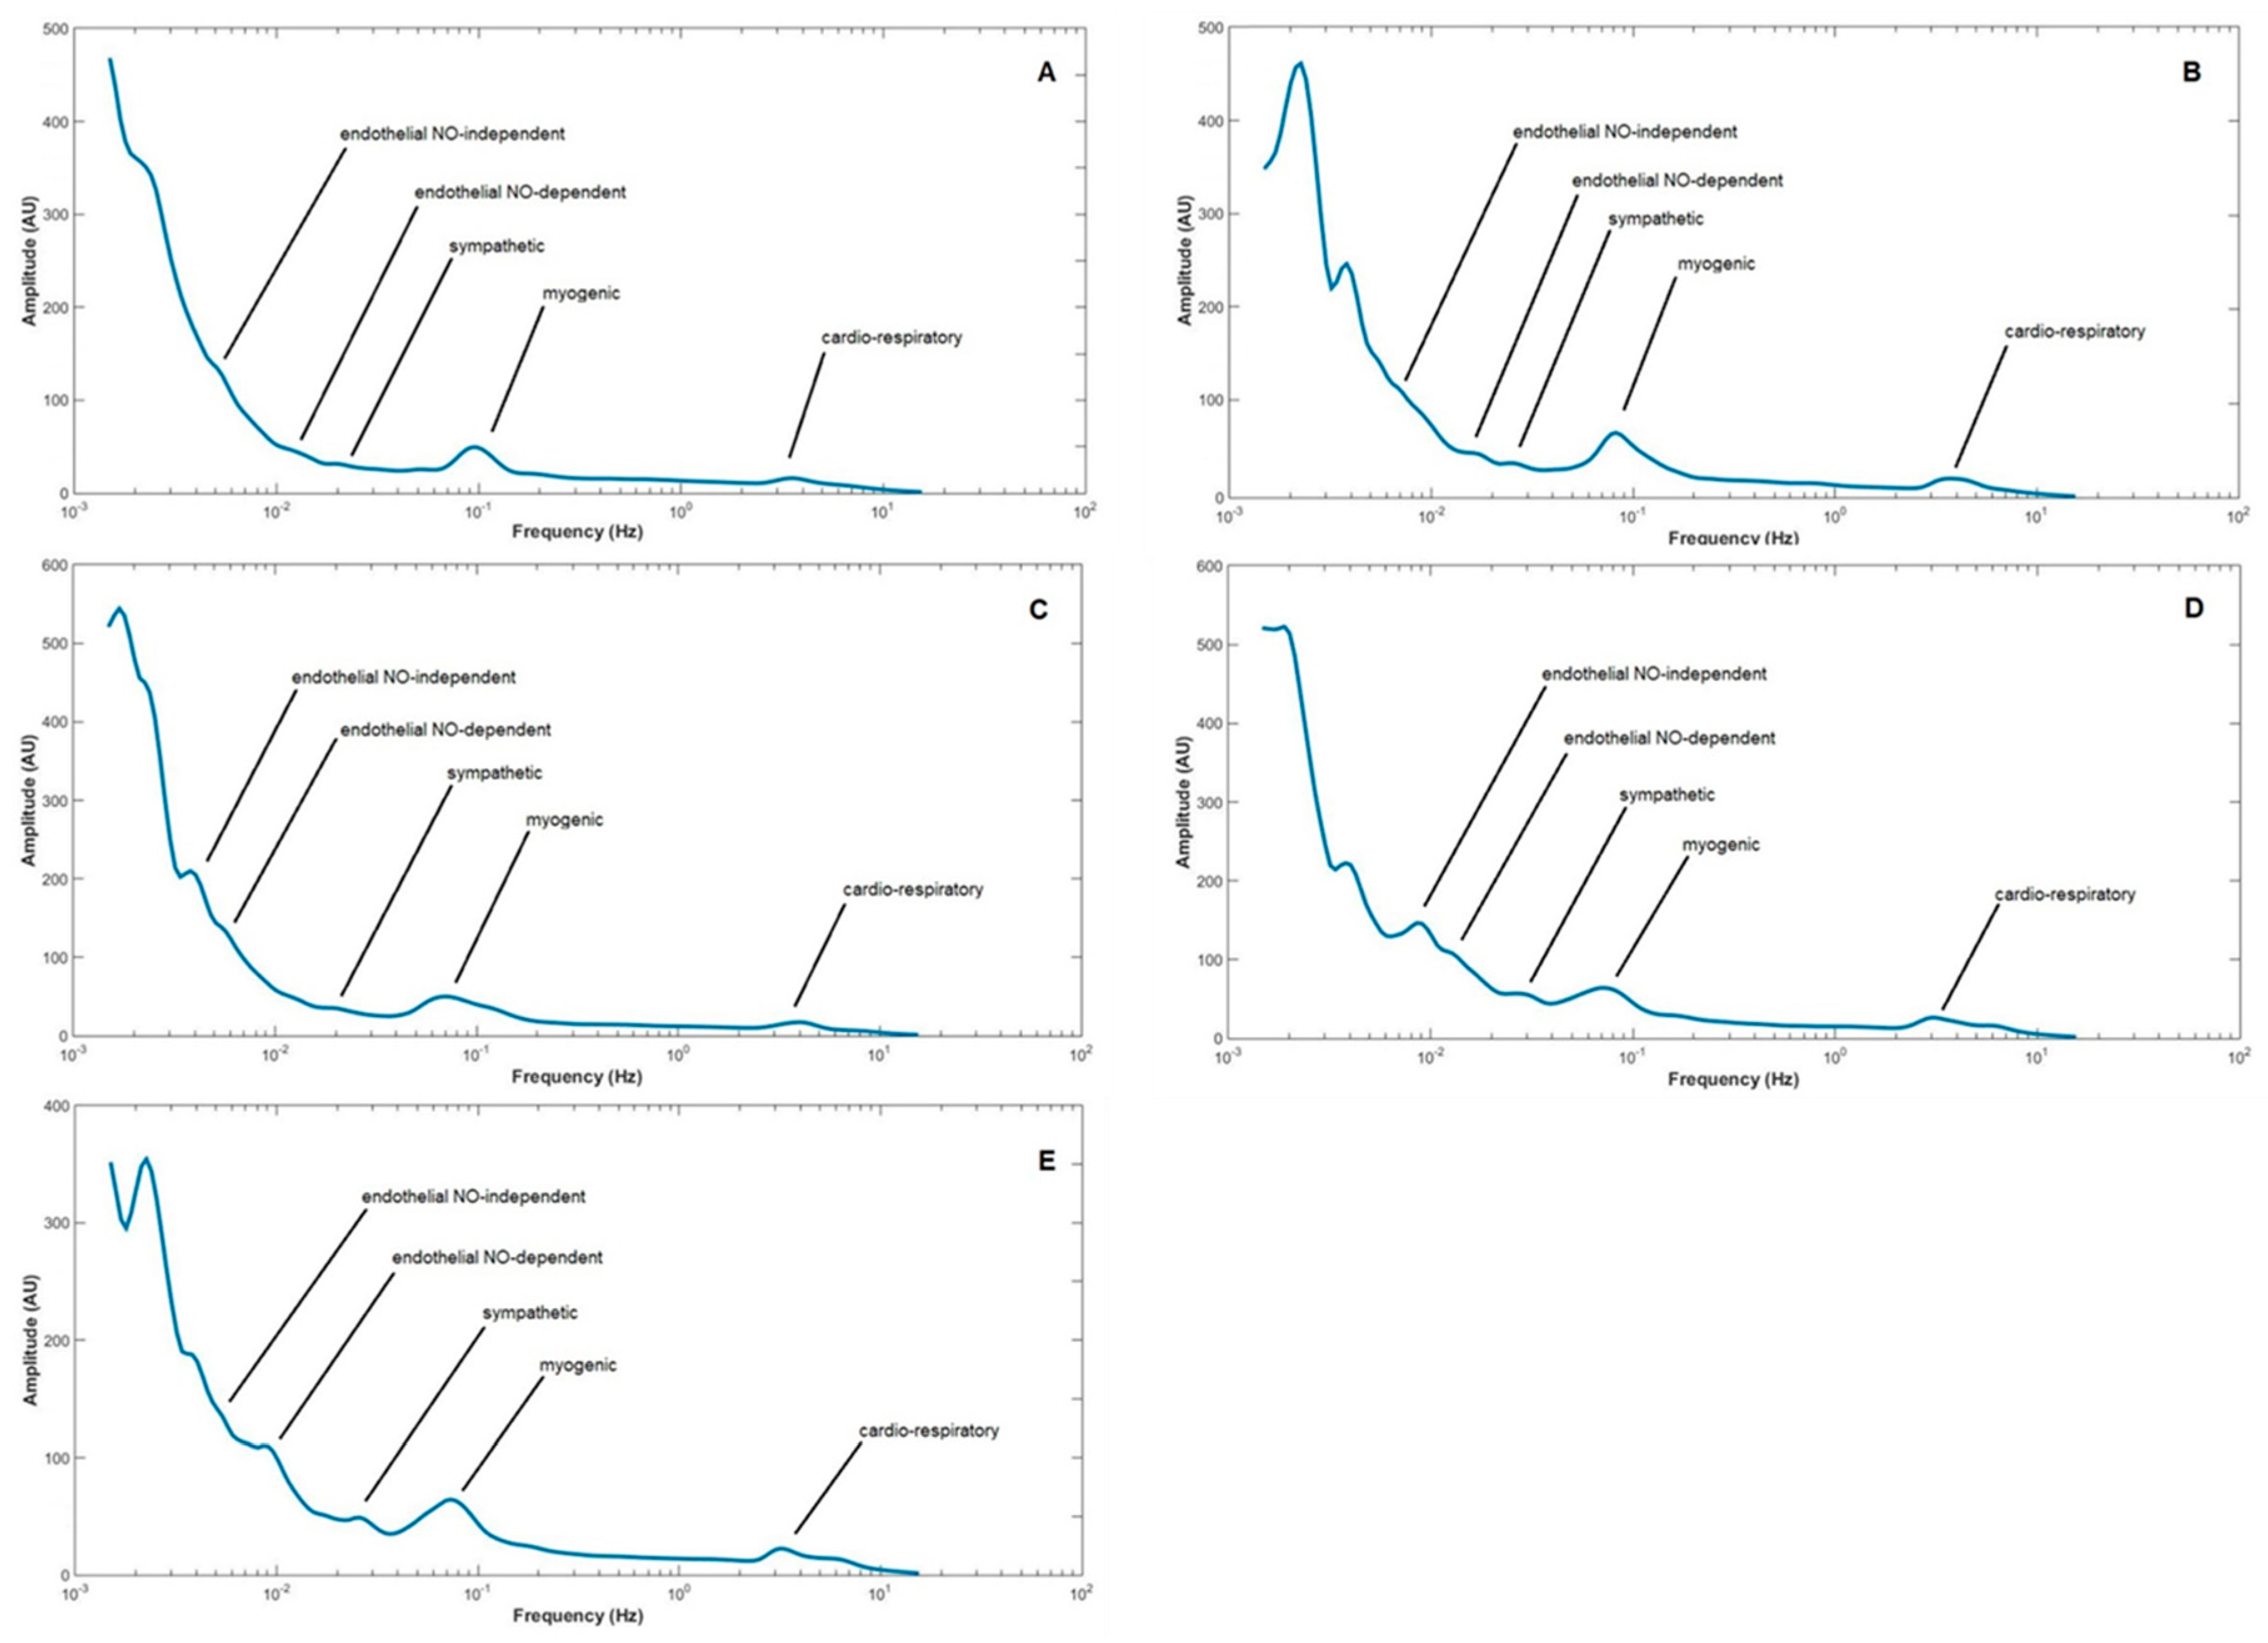
| Control | 5.400–3.200 (4.0) | 4.700–2.300 (3.2) | 6.000–3.4000 (4.4) | 0.170–0.060 (0.1) | 0.160–0.050 (0.085) | 0.170–0.060 (0.17) | 0.054–0.020 (0.031) | 0.050–0.022 (0.031) | 0.056–0.021 (0.037) | 0.018–0.010 (0.014) | 0.021–0.010 (0.014) | 0.019–0.009 (0.016) | 0.009–0.005 (0.007) | 0.009–0.004 (0.006) | 0.009–0.005 (0.008) |
| * 0.005 | * 0.002 | 0.972 | 0.363 | 0.624 | |||||||||||
| * 0.049 | 0.221 | 0.075 | * 0.005 | * 0.025 | |||||||||||
| db/+ | 4.900–3.700 (4.1) | 4.000–3.000 (3.3) | 4.600–3.100 (3.9) | 0.140–0.020 (0.079) | 0.140–0.040 (0.071) | 0.160–0.040 (0.086) | 0.034–0.018 (0.029) | 0.040–0.018 (0.027) | 0.040–0.020 (0.029) | 0.018–0.009 (0.015) | 0.018–0.009 (0.013) | 0.014–0.008 (0.013) | 0.008–0.004 (0.0063) | 0.009–0.004 (0.011) | 0.008–0.004 (0.0069) |
| * 0.001 | * 0.023 | 0.346 | 0.666 | 0.132 | |||||||||||
| * 0.019 | 0.975 | 0.683 | 0.806 | 0.074 | |||||||||||
| p-value Control versus db/+ | 0.202 | 0.202 | 0.867 | * 0.022 | 0.061 | * 0.019 | 0.830 | 0.202 | 0.061 | 0.185 | 0.756 | 0.325 | * 0.038 | 0.141 | 0.350 |
| db/db | 4.700–3.000 (3.8) | 4.200–3.000 (3.5) | 5.300–3.200 (4.7) | 0.120–0.050 (0.076) | 0.140–0.050 (0.084) | 0.150–0.050 (0.094) | 0.040–0.017 (0.027) | 0.050–0.021 (0.032) | 0.040–0.014 (0.036) | 0.016–0.009 (0.012) | 0.021–0.010 (0.013) | 0.020–0.010 (0.015) | 0.009–0.005 (0.0078) | 0.009–0.004 (0.0071) | 0.009–0.005 (0.0072) |
| * 0.023 | 0.701 | 0.152 | 0.346 | 0.213 | |||||||||||
| * 0.003 | 0.576 | 0.433 | 1.000 | 0.061 | |||||||||||
| p-value Control versus db/db | 0.840 | 0.125 | 0.264 | * 0.001 | 0.169 | * 0.003 | 0.264 | 0.840 | 0.064 | 0.579 | 0.614 | * 0.010 | 0.687 | 0.336 | * 0.039 |
| p-value db/+ versus db/db | 0.068 | 0.583 | * 0.017 | 0.116 | 0.583 | 0.650 | 0.169 | 0.141 | 0.981 | 0.128 | 0.685 | 0.068 | * 0.012 | 0.458 | 0.488 |
| NHE1-WT | 4.600–2.600 (3.2) | 3.800–1.700 (3.0) | 3.500–2.300 (3.2) | 0.120–0.040 (0.077) | 0.120–0.045 (0.08) | 0.185–0.056 (0.105) | 0.039–0.022 (0.032) | 0.045–0.024 (0.033) | 0.052–0.020 (0.035) | 0.022–0.011 (0.015) | 0.024–0.013 (0.014) | 0.014–0.008 (0.013) | 0.008–0.004 (0.0063) | 0.009–0.004 (0.011) | 0.008–0.004 (0.0069) |
| * 0.031 | 0.475 | 0.894 | 0.126 | * 0.037 | |||||||||||
| 0.118 | * 0.041 | 0.455 | 0.824 | * 0.049 | |||||||||||
| p-value Control versus NHE1-WT | * 0.001 | 0.168 | * 0.001 | * <0.001 | 0.110 | 0.406 | 0.936 | 0.689 | 0.810 | * 0.046 | 0.936 | 0.470 | * 0.003 | 0.137 | 0.225 |
| NHE1-OE | 4.500–2.700 (3.3) | 3.700–2.000 (2.9) | 3.500–2.400 (3.0) | 0.120–0.040 (0.089) | 0.109–0.045 (0.08) | 0.110–0.042 (0.085) | 0.038–0.019 (0.027) | 0.026–0.013 (0.031) | 0.033–0.025 (0.031) | 0.016–0.008 (0.012) | 0.011–0.007 (0.013) | 0.020–0.012 (0.015) | 0.011–0.007 (0.0085) | 0.013–0.007 (0.0071) | 0.012–0.007 (0.0073) |
| * 0.044 | 0.133 | 0.507 | 0.887 | 0.485 | |||||||||||
| * 0.002 | 0.492 | 0.078 | * 0.039 | 0.102 | |||||||||||
| p-value Control versus NHE1-OE | * 0.001 | 0.170 | * <0.001 | * 0.016 | 0.082 | * <0.001 | 0.183 | 0.489 | 0.062 | 0.798 | 0.417 | 0.293 | 0.650 | 0.859 | 0.441 |
| p-value NHE1-WT versus NHE1-OE | 1.000 | 0.744 | 0.072 | 0.465 | 0.950 | 0.200 | * 0.035 | 0.305 | 0.368 | * 0.039 | 0.104 | 0.755 | * 0.003 | 0.072 | 0.632 |
| p-value db/+ versus NHE1-WT | * <0.001 | * 0.02 | * <0.001 | 0.131 | 0.820 | 0.432 | 0.560 | 0.106 | 0.322 | 0.462 | 0.274 | 0.860 | 0.274 | 0.899 | 0.940 |
| Name | Background | Mutation | Male | Female | Total | |
|---|---|---|---|---|---|---|
| Control group | - | C57Bl/6 | - | 8 | - | 8 |
| Control CH | NHE1-WT | FVB/NJ | - | 6 | 2 | 8 |
| CH group | NHE1-OE | FV/NJ | NHE1 overexpression | 7 | 2 | 9 |
| Control DB | Db/+ | C57BL/KsJ | Lepr +/db | 4 | 4 | 8 |
| DB group | Db/db | C57BL/KsJ | Lepr db/db | 4 | 4 | 8 |
© 2019 by the authors. Licensee MDPI, Basel, Switzerland. This article is an open access article distributed under the terms and conditions of the Creative Commons Attribution (CC BY) license (http://creativecommons.org/licenses/by/4.0/).
Share and Cite
Monteiro Rodrigues, L.; Nazaré Silva, H.; Ferreira, H.; Gadeau, A.-P. Characterizing Vascular Dysfunction in Genetically Modified Mice through the Hyperoxia Model. Int. J. Mol. Sci. 2019, 20, 2178. https://doi.org/10.3390/ijms20092178
Monteiro Rodrigues L, Nazaré Silva H, Ferreira H, Gadeau A-P. Characterizing Vascular Dysfunction in Genetically Modified Mice through the Hyperoxia Model. International Journal of Molecular Sciences. 2019; 20(9):2178. https://doi.org/10.3390/ijms20092178
Chicago/Turabian StyleMonteiro Rodrigues, Luis, Henrique Nazaré Silva, Hugo Ferreira, and Alain-Pierre Gadeau. 2019. "Characterizing Vascular Dysfunction in Genetically Modified Mice through the Hyperoxia Model" International Journal of Molecular Sciences 20, no. 9: 2178. https://doi.org/10.3390/ijms20092178