Article

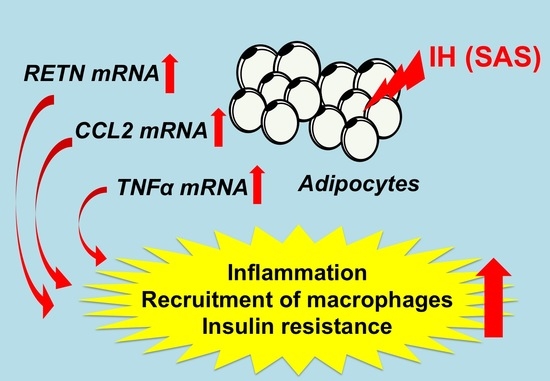
Intermittent Hypoxia Up-Regulates CCL2, RETN, and TNFα mRNAs in Adipocytes via Down-regulation of miR-452

1
Department of Biochemistry, Nara Medical University, 840 Shijo-cho, Kashihara, Nara 634-8521, Japan
2
Department of Diagnostic Pathology, Nara Medical University, 840 Shijo-cho, Kashihara, Nara 634-8522, Japan
3
Second Department of Internal Medicine, Nara Medical University, 840 Shijo-cho, Kashihara, Nara 634-8522, Japan
4
Department of Laboratory Medicine and Pathology, National Hospital Organization Kinki-chuo Chest Medical Center, 1180 Nagasone-cho, Kita-ku, Sakai, Osaka 591-8025, Japan
*
Author to whom correspondence should be addressed.
Int. J. Mol. Sci. 2019, 20(8), 1960; https://doi.org/10.3390/ijms20081960
Submission received: 23 March 2019 / Revised: 18 April 2019 / Accepted: 19 April 2019 / Published: 22 April 2019
(This article belongs to the Special Issue Sleep Apnea and Intermittent Hypoxia)

Abstract

:
Sleep apnea syndrome (SAS), characterized by recurrent episodes of oxygen desaturation and reoxygenation (intermittent hypoxia [IH]), is a risk factor for insulin resistance. Recently, IH is considered to independently cause adipose tissue inflammation/dysfunction, leading to worsening insulin resistance; however, the detailed mechanism remains unknown. We exposed mouse 3T3-L1 and human SW872 adipocytes to experimental IH or normoxia for 24 h, and analyzed mRNA expression of several adipokines. We found that the mRNA levels of RETN, TNFα, and CCL2 in SW872 and 3T3-L1 adipocytes were significantly increased by IH, whereas the promoter activities of these genes were not increased. A target mRNA search of microRNA (miR)s revealed that all human mRNAs have a potential target sequence for miR-452. The miR-452 level of IH-treated cells was significantly decreased compared to normoxia-treated cells. MiR-452 mimic and non-specific control RNA (miR-452 mimic NC) were introduced into SW872 cells, and the IH-induced up-regulation of the genes was abolished by introduction of the miR-452 mimic but not by the miR-452 mimic NC. These results indicate that IH stress down-regulates the miR-452 in adipocytes, resulting in increased levels of RETN, TNFα, and CCL2 mRNAs, leading to insulin resistance in SAS patients.

Graphical Abstract

1. Introduction

Sleep apnea syndrome (SAS) is a highly prevalent disease characterized by repetitive episodes of pharyngeal airway narrowing or obstruction during sleep, leading to apnea and hypopnea, often accompanied by a decrease in oxygen saturation [1]. It is a disorder affecting about 14–24% in men and 5–9% in women [2,3]. Accumulating evidence suggests that recurrent short cycles of oxygen desaturation followed by rapid reoxygenation (intermittent hypoxia [IH]), which are typical features of SAS, contribute to the development of impaired glucose tolerance/insulin resistance [4,5,6]. This relationship is considered to be irrelevant to the degree of obesity [7,8,9]. In addition to IH, several pathogenic mechanisms, such as sympathetic nervous system hyperactivity, oxidative stress, vascular endothelial dysfunction, and activation of the inflammatory cytokines, are all potential contributors to insulin resistance [10]. However, the detailed mechanisms by which IH induces insulin resistance in SAS patients are not well established. We have investigated how IH induces impaired insulin secretion/insulin resistance using pancreatic β cells, hepatocytes, and neuronal cells. We have reported that IH stress influences pancreatic β cell proliferation/dysfunction, hepatocytes proliferation/dysfunction, and synthesis of anorexigenic peptides in neuronal cells, which may lead to aggravate insulin resistance/type 2 diabetes [1,11,12].
Adipose tissue, complex tissue composed of preadipocytes, adipocytes, and stromal vascular cells, is one of the representative organs that contribute to worsening insulin resistance by inflammation and subsequent dysfunction [13]. Adipokines are hormones expressed and secreted from adipocytes in response to the systemic nutritional status, and some of which induce macrophage infiltration and inflammatory cytokine secretion [14,15]. Recently, it has been reported that SAS patient adipose tissues become inflamed by macrophage infiltration, inflammatory cytokines, and increased blood flow, resulting in insulin resistance [9,16]. Additionally, several animal studies suggested that IH induces adipocyte lipolysis, elevating plasma free fatty acid levels [17] and pro-inflammatory changes in adipose tissue independent of obesity [13], which may contribute to the pathogenesis of IH-induced insulin resistance. However, the experimental IH-induced change of adipokines secreted from preadipocytes/adipocytes is less clear. The phase of adipocyte differentiation (preadipocytes or adipocytes) in which such significant IH-induced changes of adipokines occur remains unknown. During differentiation, preadipocytes proliferate and become mature fat cells (adipocytes), which is a process of adipogenesis [18,19].
In the present study, using mouse and human adipocytes, we investigated changes of gene expression of several adipokines, synthesized/secreted from preadipocytes/adipocytes, in response to IH, as well as their regulatory mechanisms and found the expression of resistin (Retn), tumor necrosis factor-α (Tnfα), and C-C motif chemokine ligand 2 (Ccl2) was increased by IH via down-regulation of microRNA (miR)-452.

2. Results

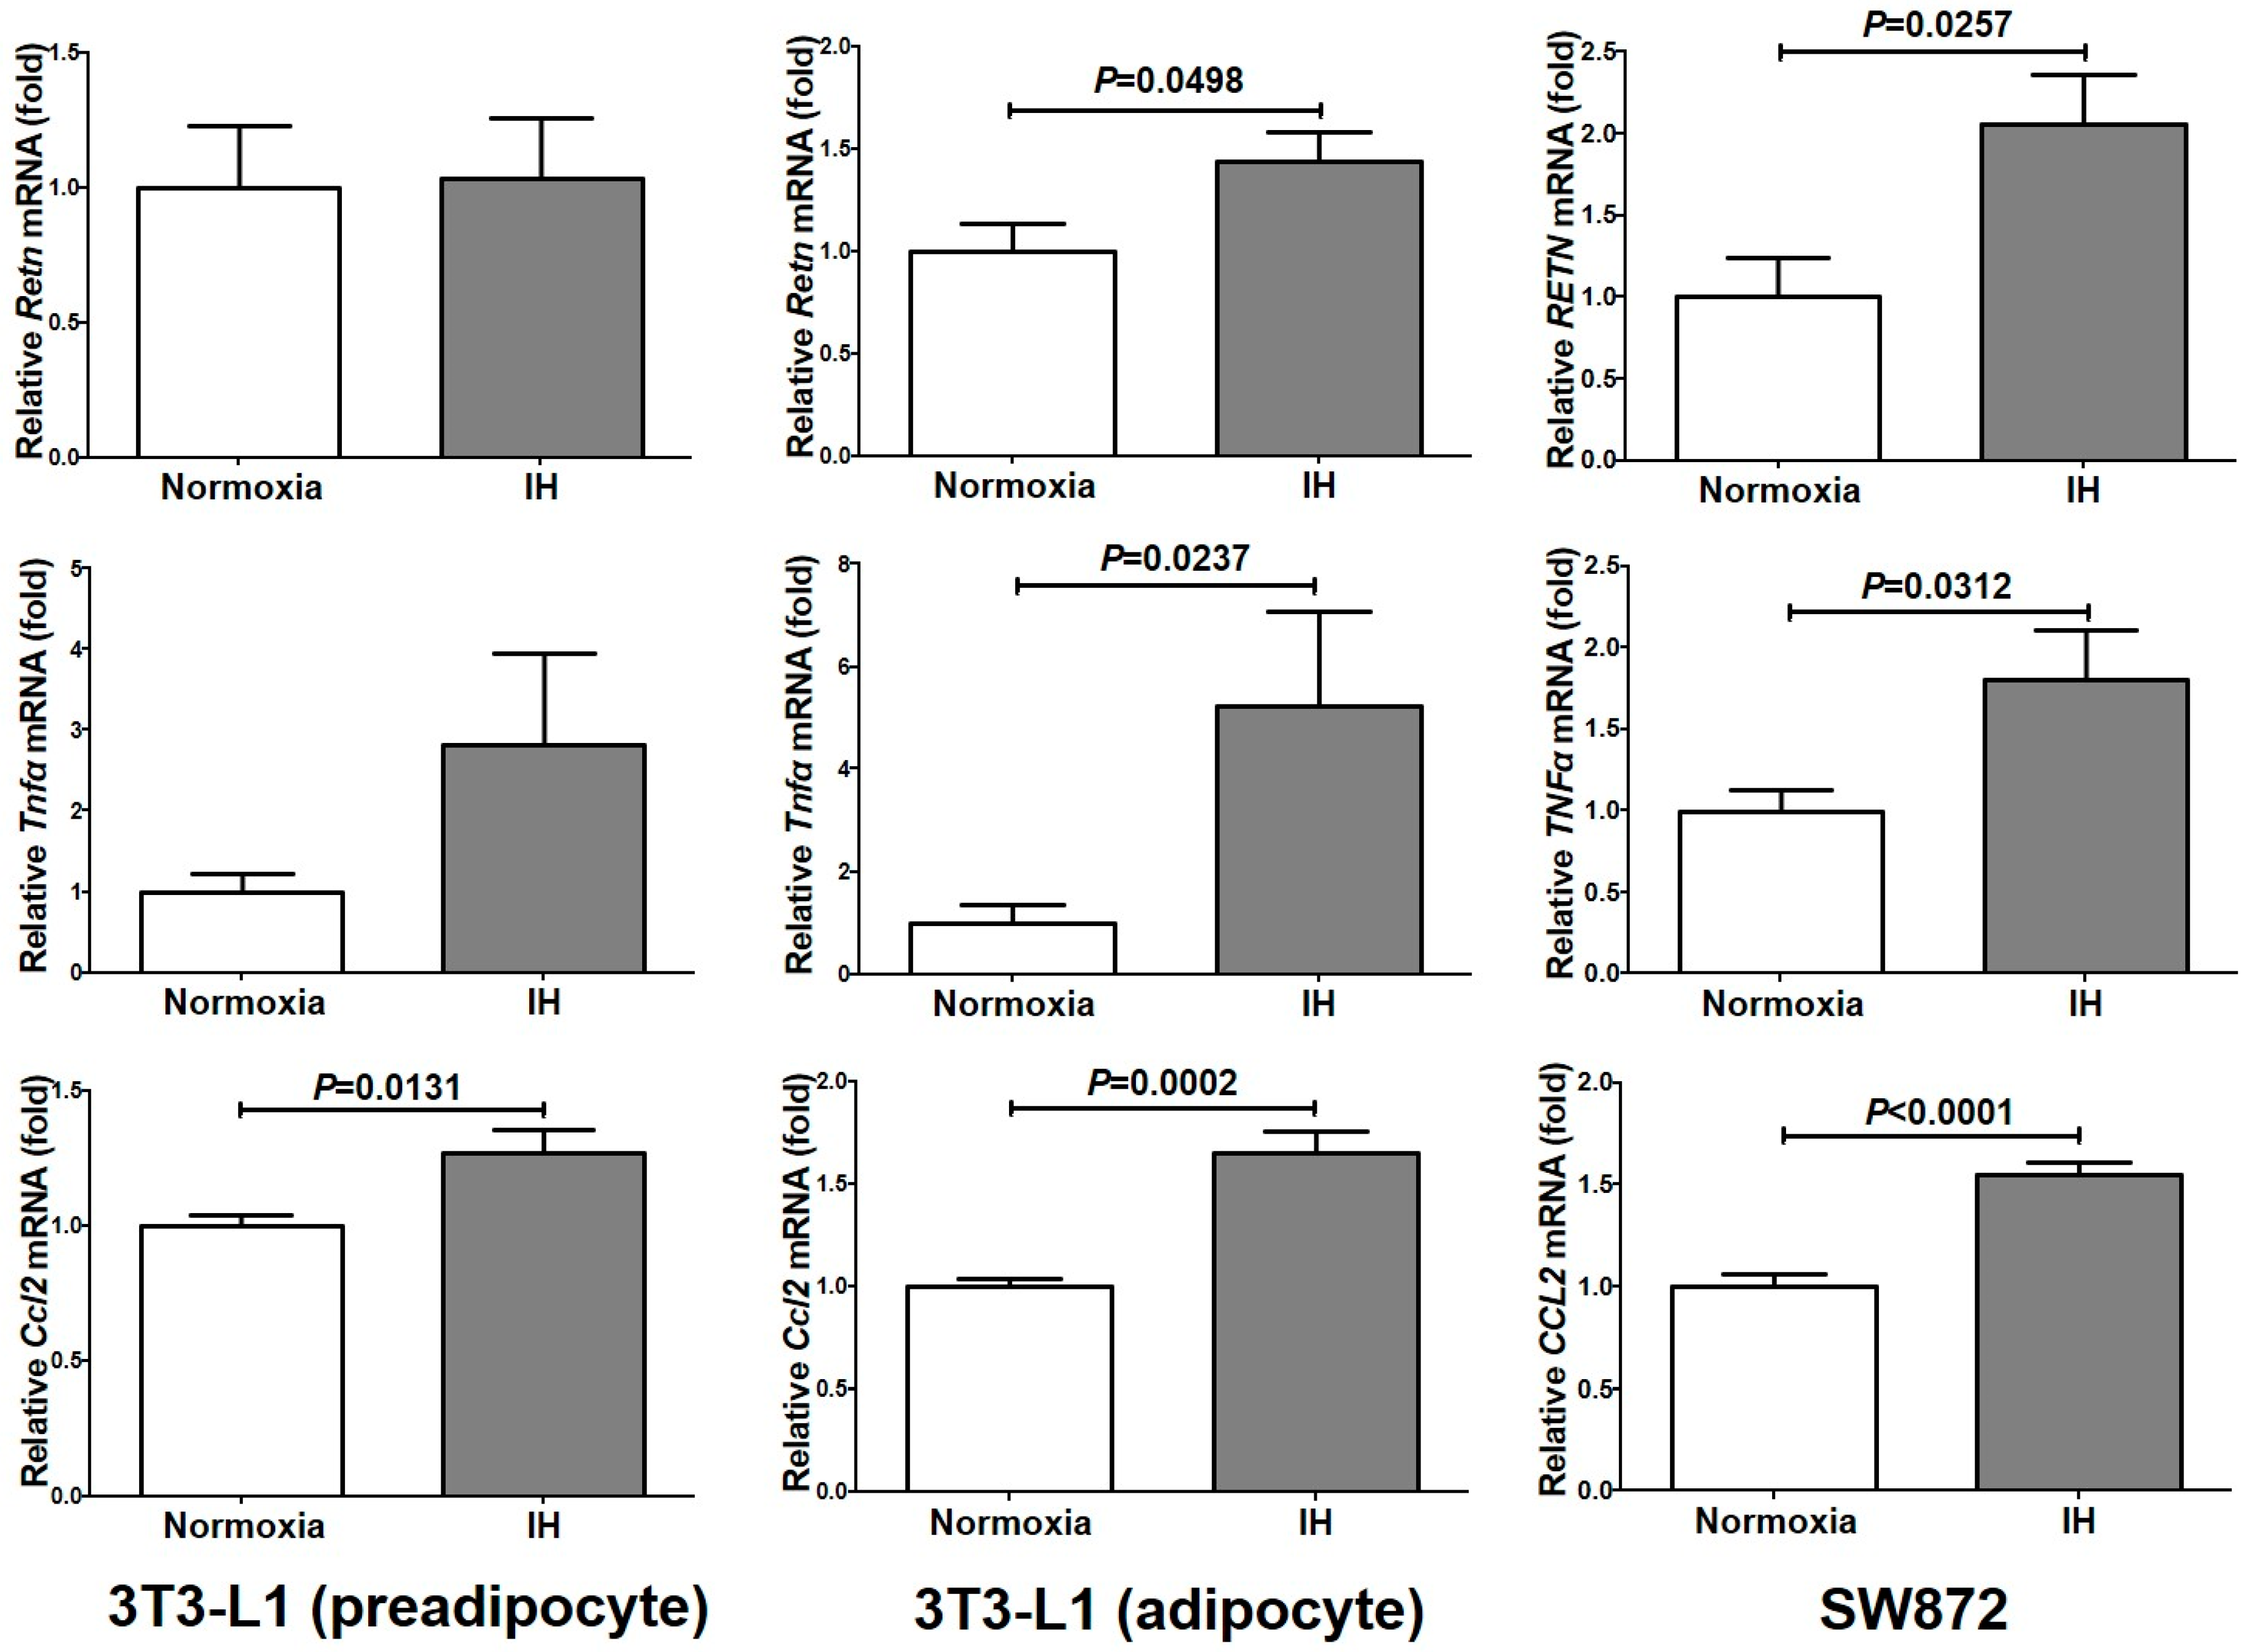
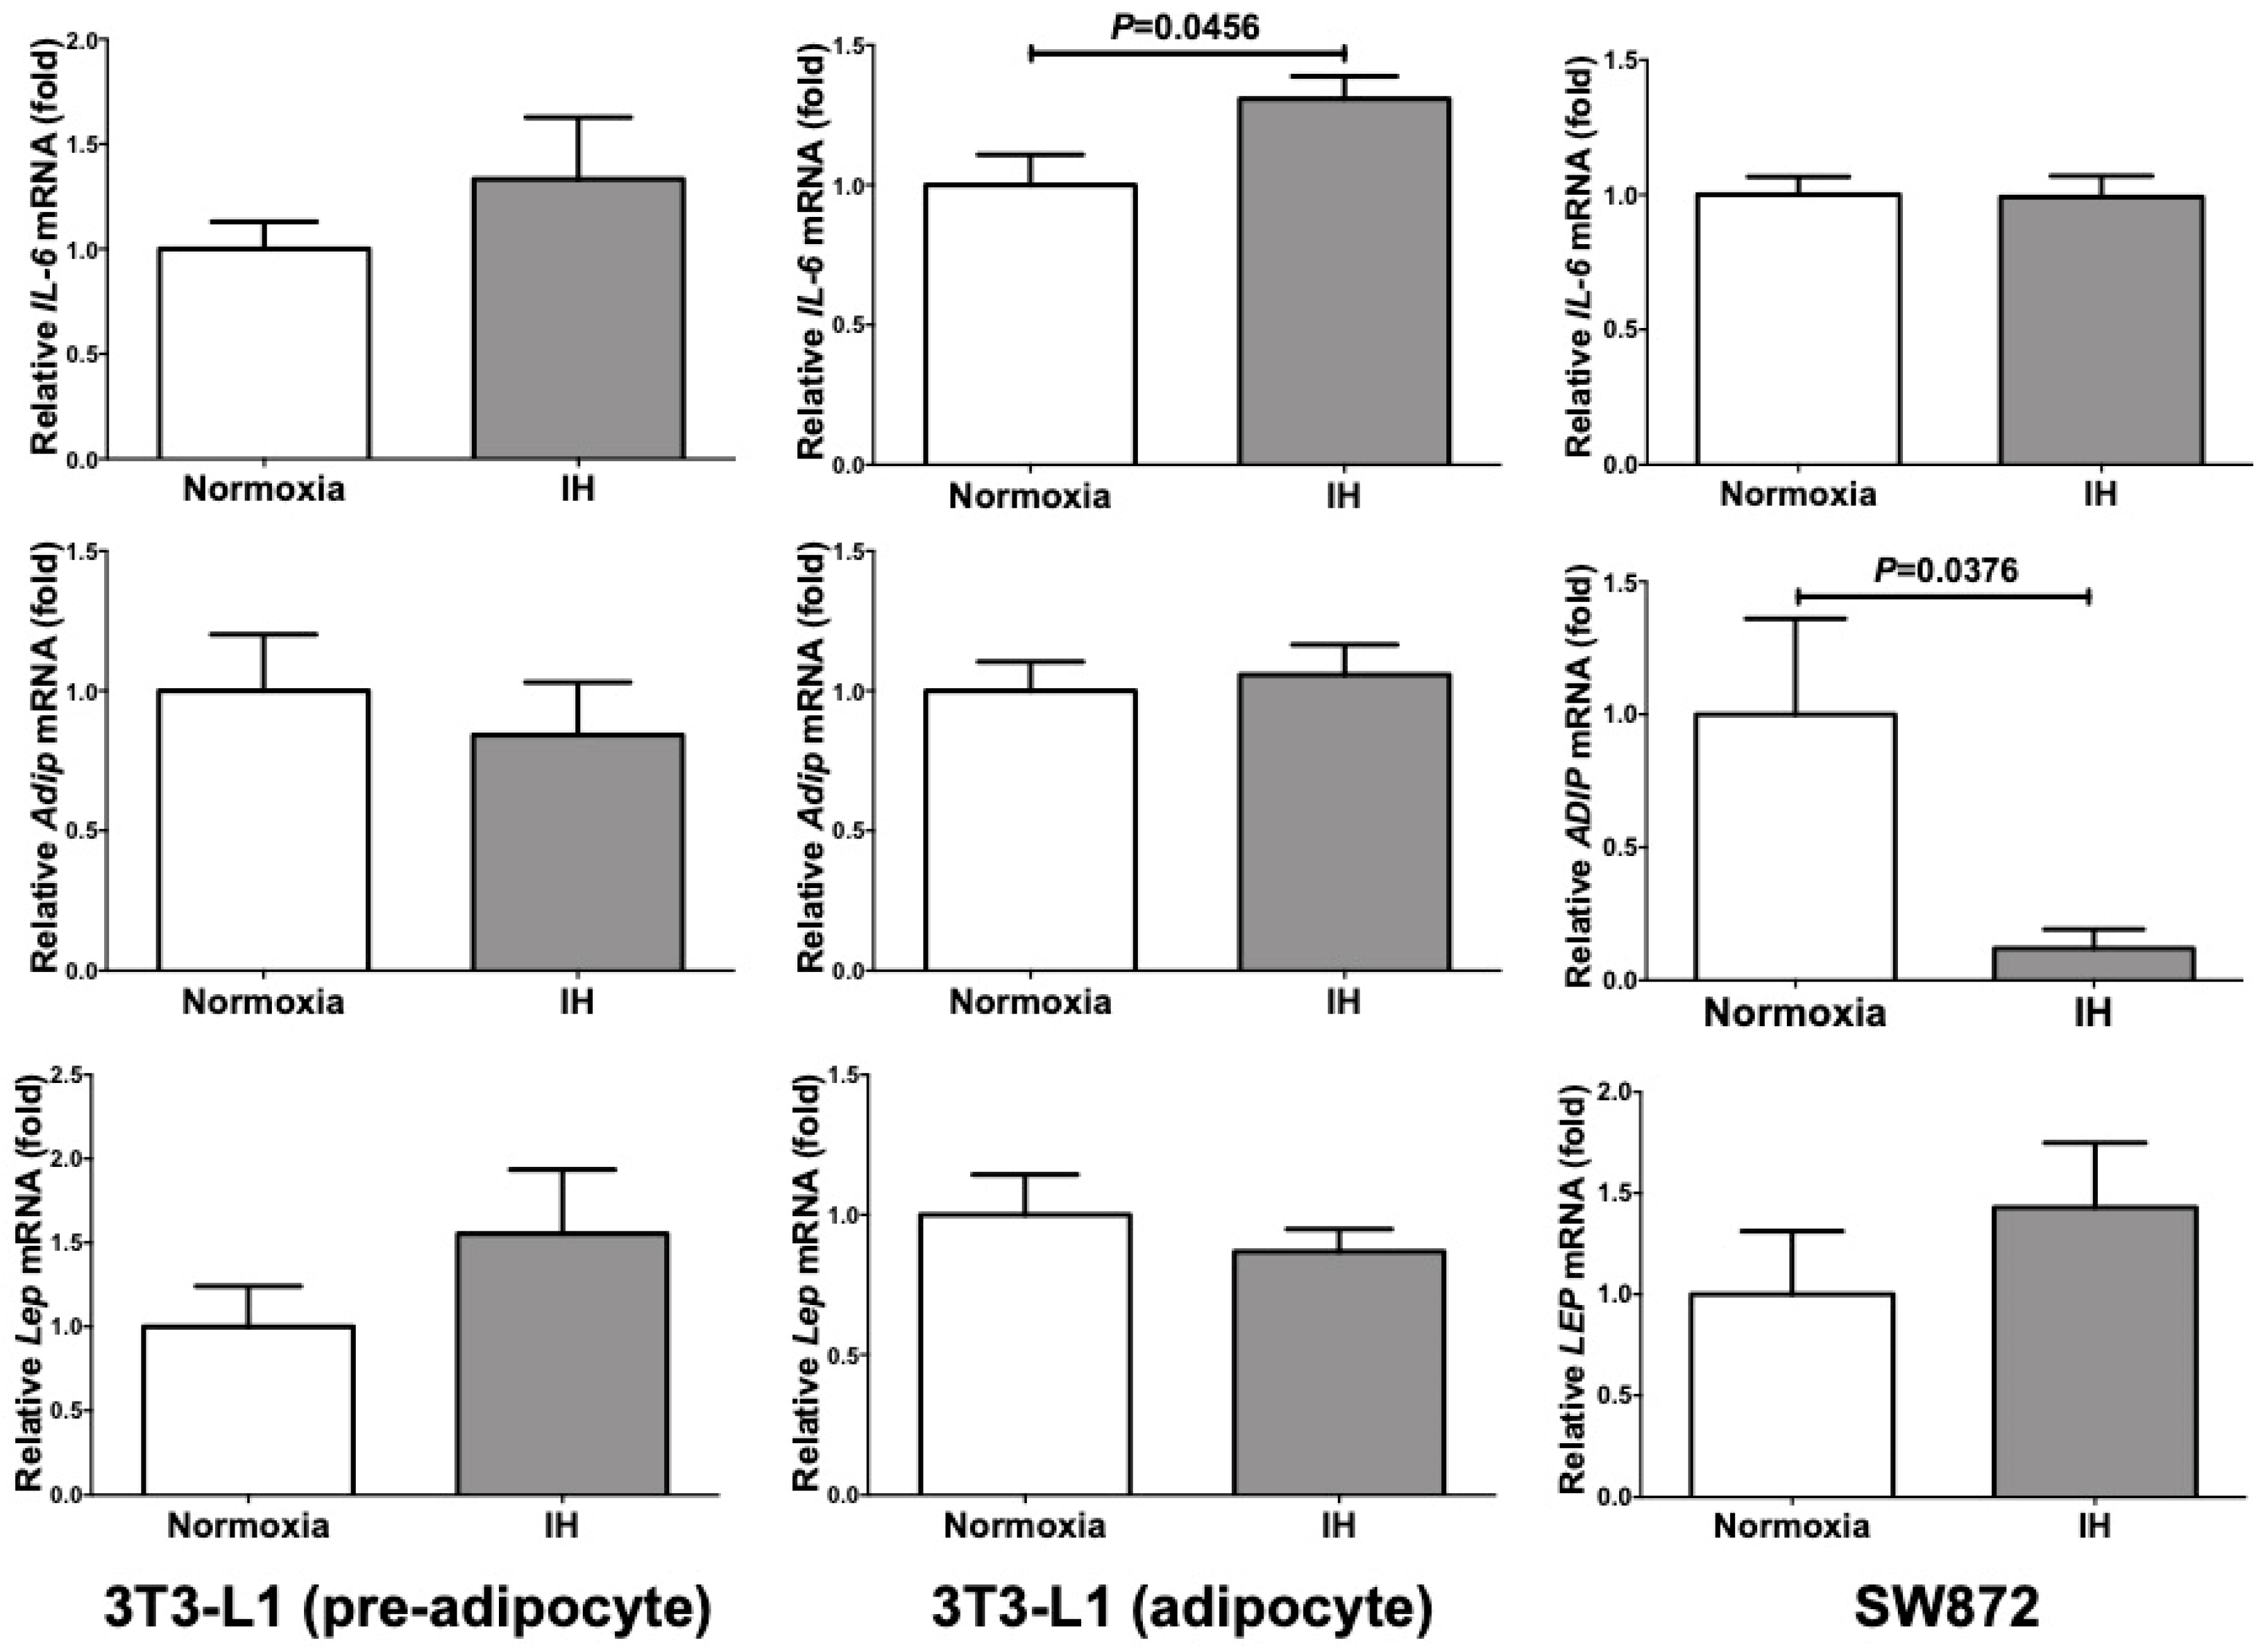
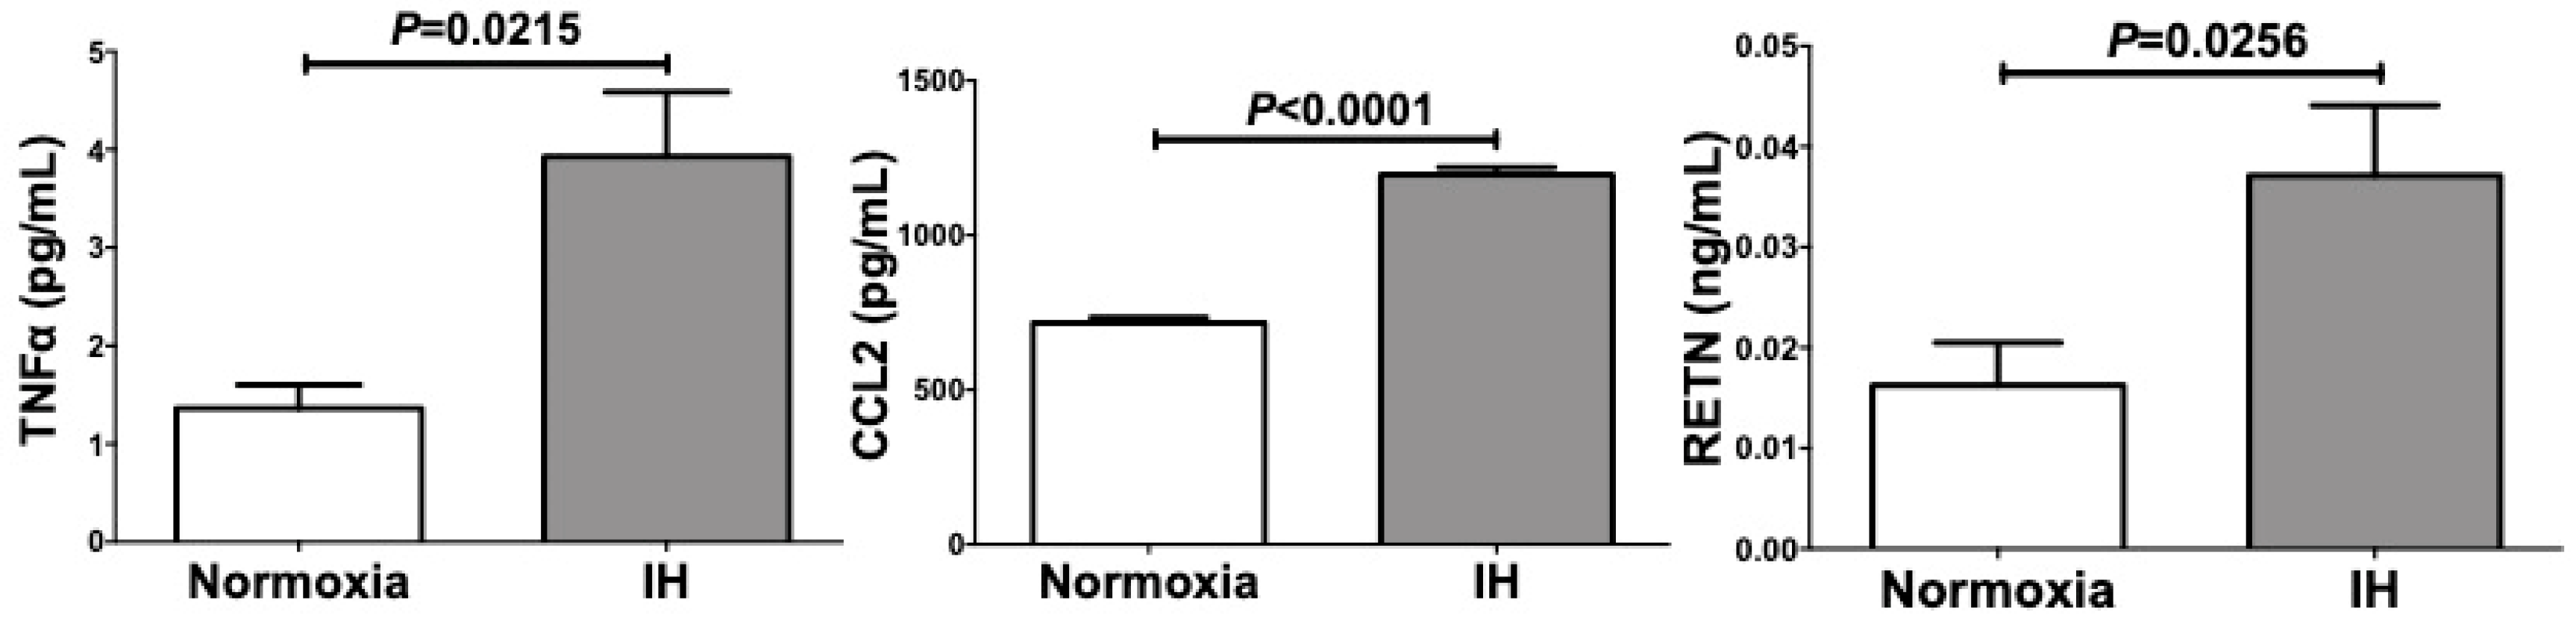
2.1. Gene Expression of RETN, TNFα, and CCL2 Was Increased by IH in Mouse 3T3-L1 Adipocytes and Human SW872 Cells

We exposed mouse and human adipocytes (3T3-L1 preadipocytes, 3T3-L1 adipocytes, and SW872 cells) to normoxia or IH for 24 h. After the treatment, we measured the mRNA levels of several adipokines (leptin [Lep], adiponectin [Adip], Retn, interleukin-6 (IL-6), TNFα, and CCL2) by real-time reverse transcription polymerase chain reaction (RT-PCR). As shown in Figure 1, the mRNA levels of Ccl2 were significantly increased in 3T3-L1 preadipocytes (P = 0.0131), 3T3-L1 adipocytes (P = 0.0002), and SW872 cells (P < 0.0001). The mRNA levels of Retn and Tnfα were significantly increased in 3T3-L1 adipocytes (P = 0.0498 and P = 0.0237, respectively) and SW872 cells (P = 0.0257 and P = 0.0312, respectively).
On the other hand, the mRNA levels of IL-6 were significantly increased only in 3T3-L1 adipocytes (P = 0.0456), and unchanged in 3T3-L1 preadipocytes and SW872 cells (P = 0.3246 and P = 0.9366, respectively). Adip mRNA was significantly decreased in SW872 cells (P = 0.0376), and unchanged in either 3T3-L1 preadipocytes or adipocytes (P = 0.5787 and P = 0.7094, respectively). In all the analyzed cells, the mRNA levels of Lep were not significantly changed by IH (P = 0.2359 in 3T3-L1 preadipocytes, P = 0.4411 in 3T3-L1 adipocytes, and P = 0.3728 in SW872 cells) (Figure 2). Considering these results, IH stress might specifically up-regulate expression of Retn, Tnfα and Ccl2 in 3T3-L1 adipocytes and SW872 cells.
The mRNA levels of Lep, Adip and Retn in 3T3-L1 adipocytes (normoxia) were significantly increased compared to 3T3-L1 preadipocytes (884.0 ± 120.9 fold [P < 0.0001], 719.2 ± 74.96 fold [P < 0.0001], and 7,032 ± 947.5 fold [P < 0.0001], respectively), suggesting that these genes are expressed specifically after differentiation to adipocytes. In contrast, Ccl2, Tnfα and IL-6, expressed in many different types of cell, were not significantly increased but rather decreased after differentiation from preadipocytes to adipocytes (0.781 ± 0.0329 fold [P = 0.0021], 0.639 ± 0.296 fold [P = 0.4242], and 0.610 ± 0.0664 fold [P = 0.0233], respectively; Figure 3).
We are unable to explain the exact reason why there is a decrease in Ccl2, Tnfα, and IL-6 expression compared to Lep, Adip, and Retn. However, there are some clues that may help explain. (1) Tnfα treatment decreased Adip mRNA expression in 3T3-L1 cells [20]. (2) Tnfα also works as a potent negative regulator for Retn mRNA expression in 3T3-L1 cells [21,22]. (3) In addition, Tnfα potently induced IL-6 mRNA expression in 3T3-L1 cells [23]. (4) IL-6 works as a negative regulator for Adip mRNA expression in 3T3-L1 cells [24]. In our experiments, Tnfα mRNA expression was unchanged during 3T3-L1 cell differentiation. Thus, the down-regulation of Adip and Retn mRNAs by Tnfα and up-regulation of IL-6 mRNA by Tnfα did not work. As a result, up-regulation of Adip and Retn mRNAs were clearly detected. In addition, as the IL-6 expression was unchanged, down-regulation of Adip mRNA did not occur.
We further measured RETN, TNFα, and CCL2 protein in the culture medium by ELISA and found that the levels of RETN (P = 0.0256), TNFα (P = 0.0215), and CCL2 (P < 0.0001) were significantly increased by IH in SW872 cells (Figure 4).

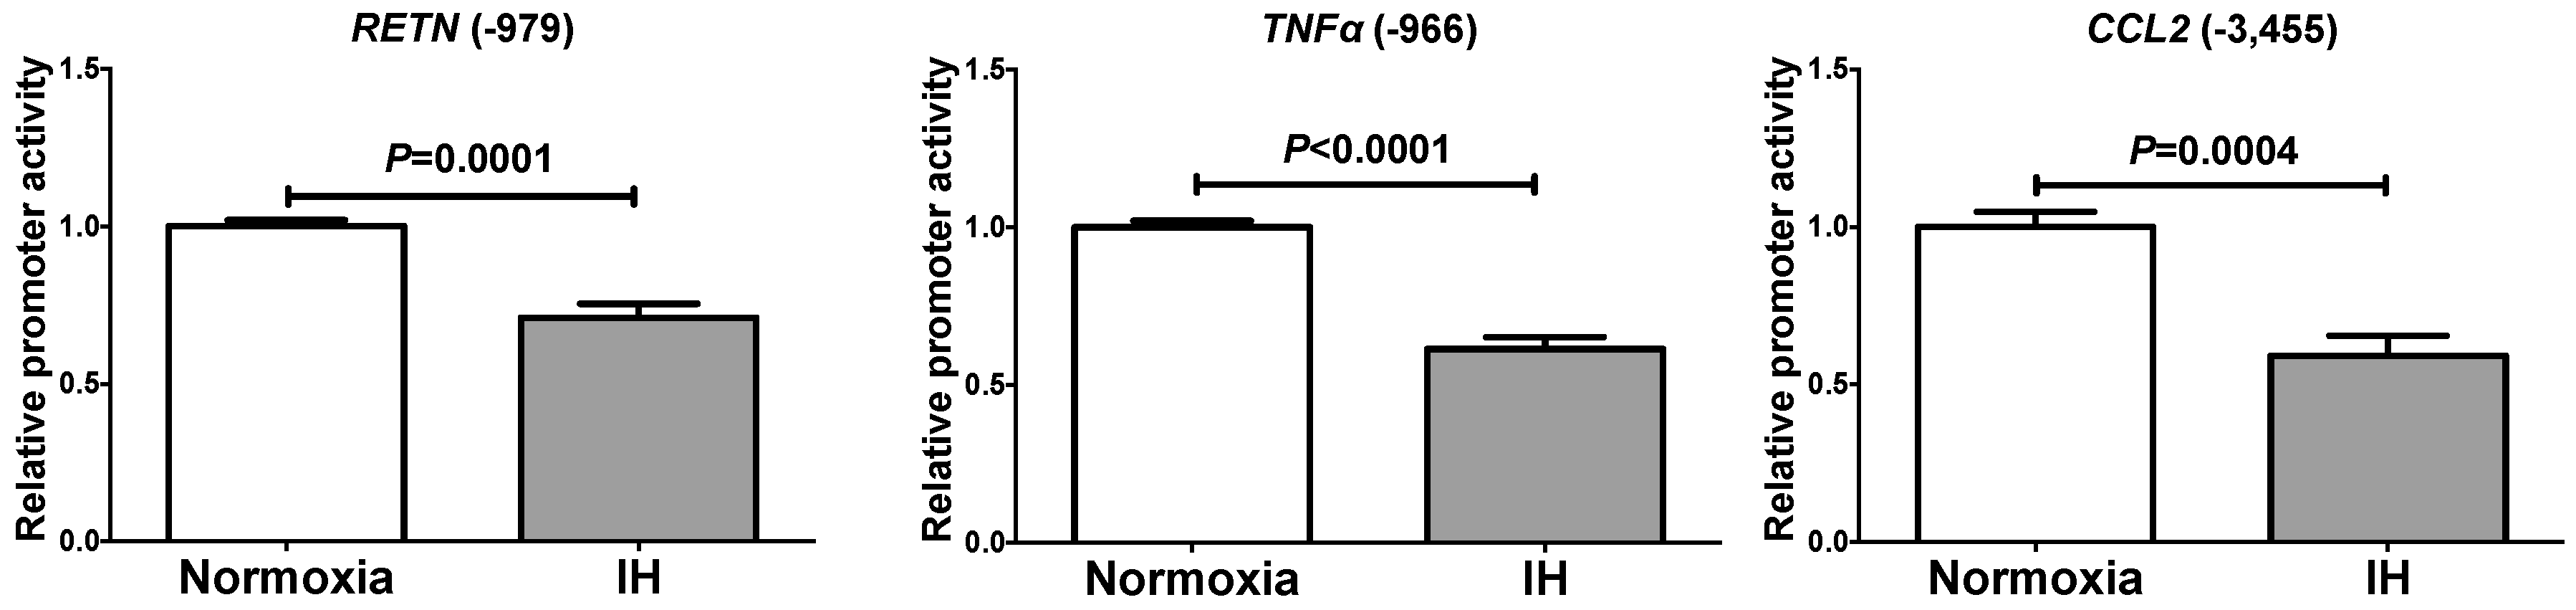
2.2. The Promoter Activities of RETN, TNFα, and CCL2 Were not Increased by IH

To determine whether the IH-induced increases in RETN, TNFα and CCL2 mRNAs were caused by activation of transcription, a 999 bp fragment containing 979 bp of the RETN promoter, a 985 bp fragment containing 966 bp of the TNFα promoter, and a 3480 bp fragment containing 3455 bp of the CCL2 promoter were fused to the luciferase gene of pGL4.17 and transfected into SW872 cells. After IH stimulation, we measured promoter activities and found that RETN, TNFα, and CCL2 promoter activities were significantly decreased by IH in SW872 cells (Figure 5). These results suggested that the gene expression of RETN, TNFα, and CCL2 in response to IH was not regulated by transcription.

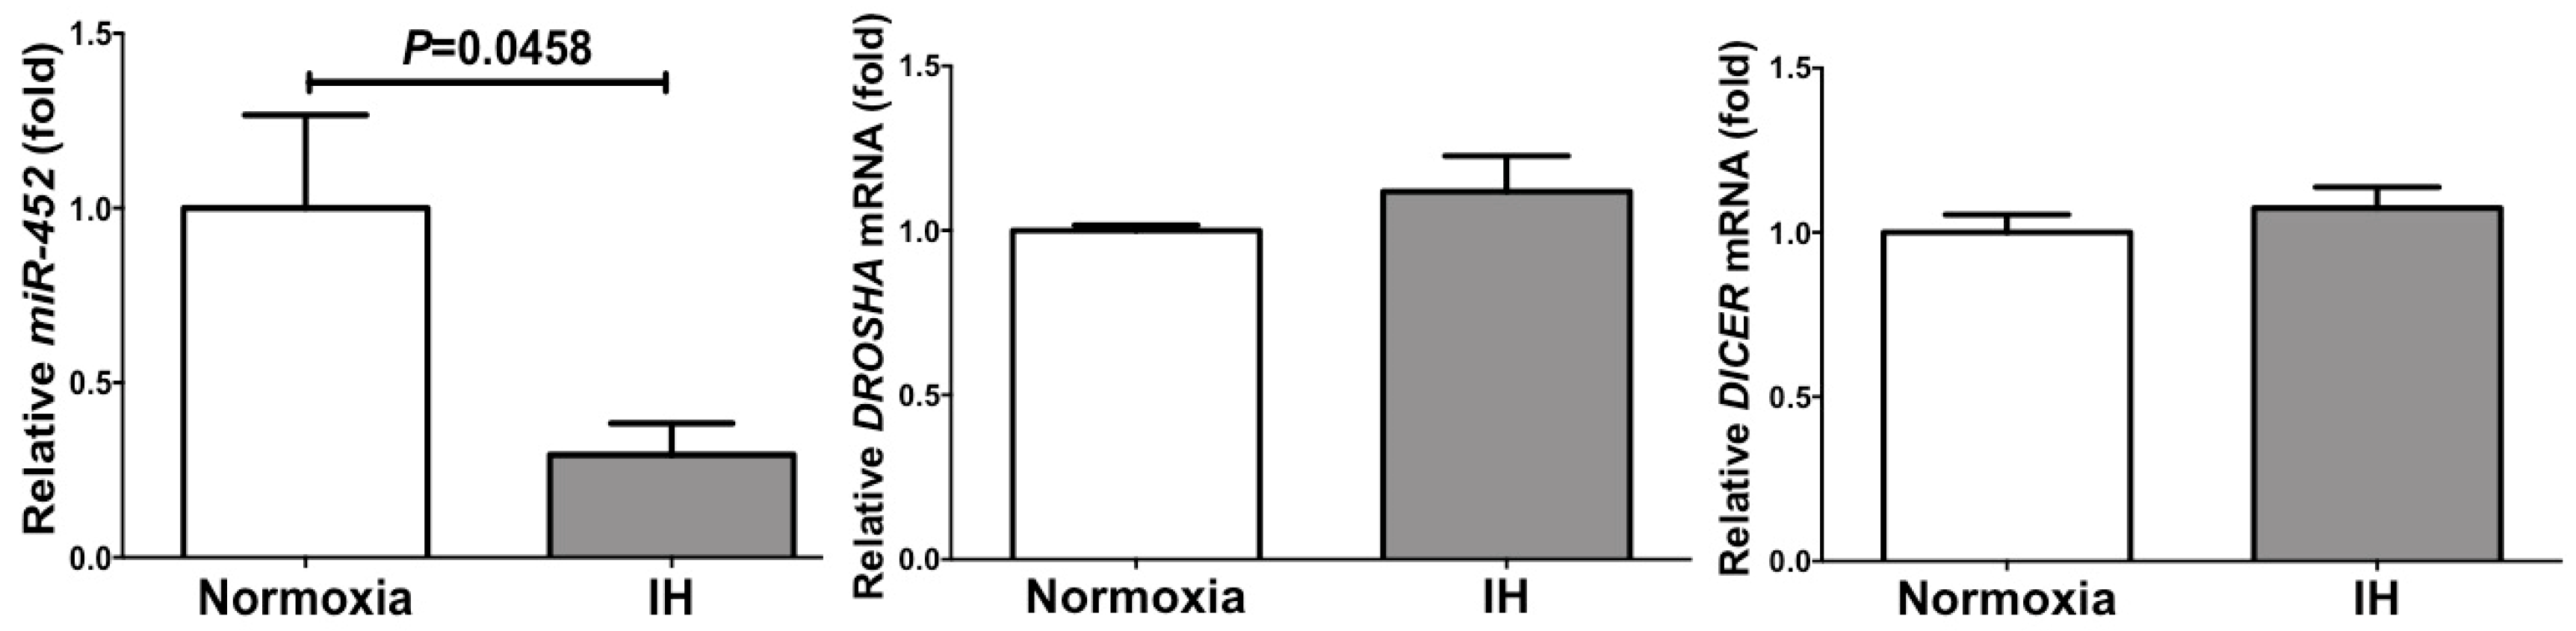
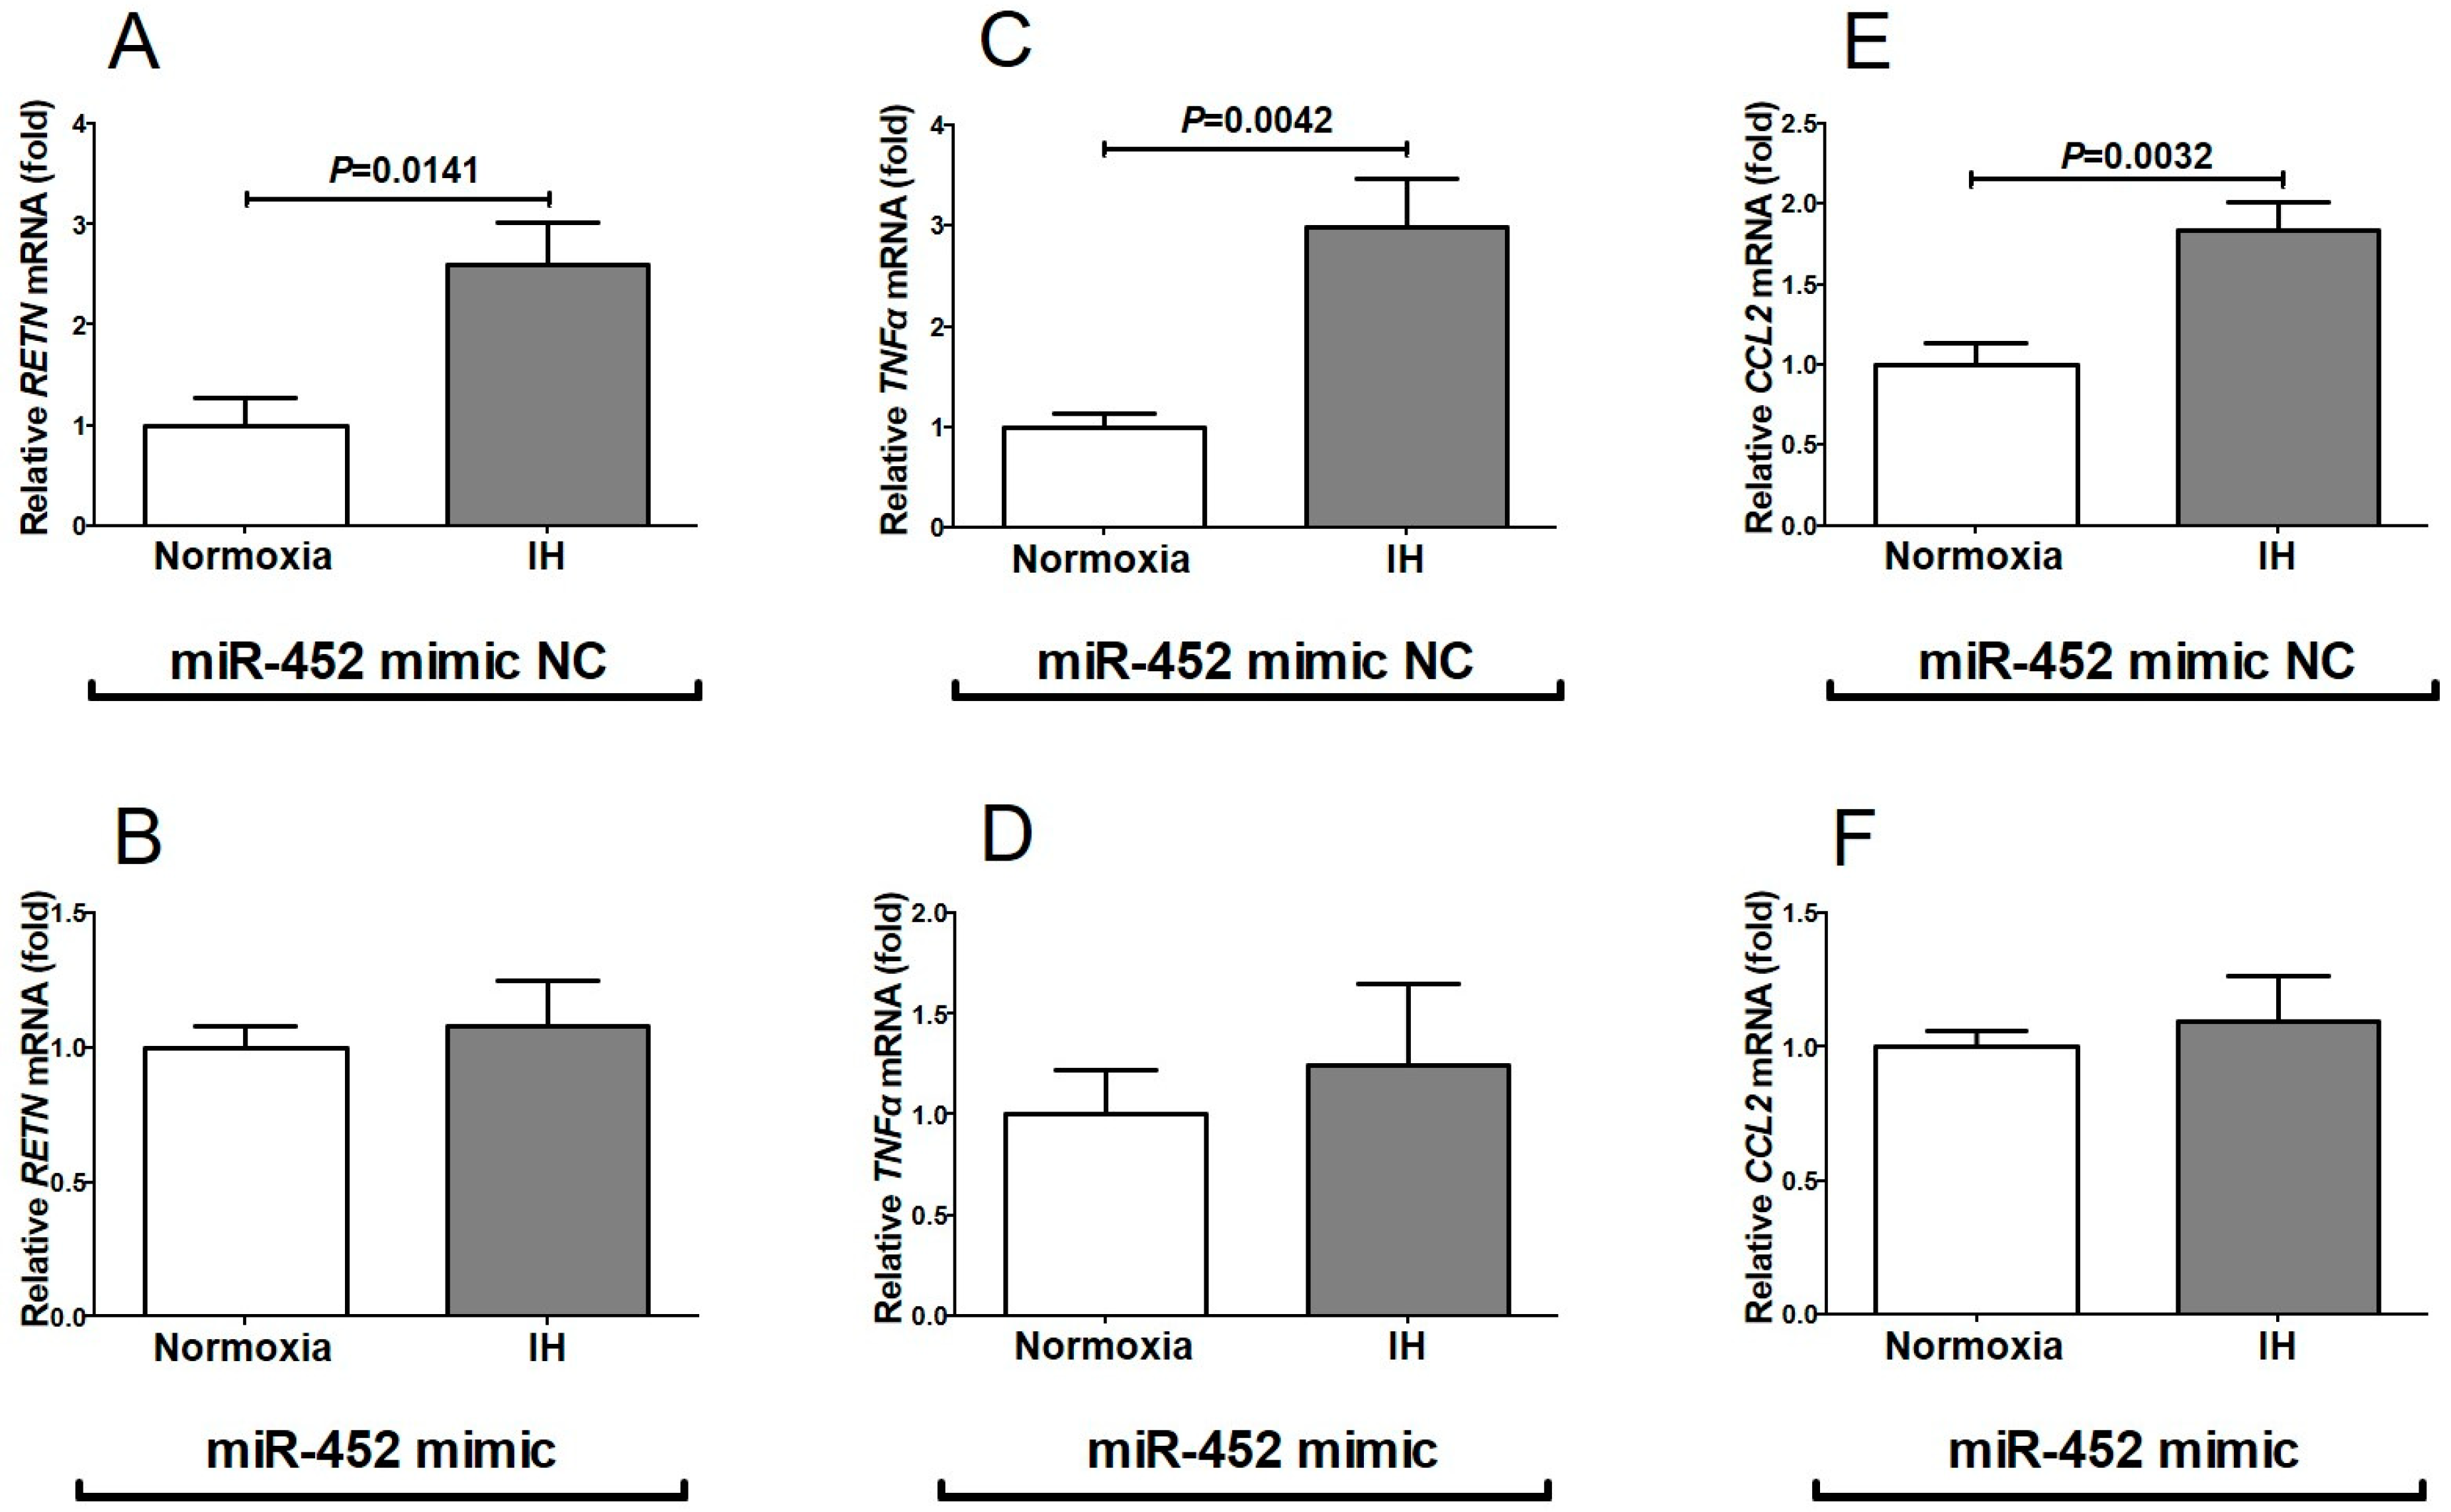
2.3. The MiR-452 Level Was Significantly Decreased by IH

We considered a possible explanation that the IH-induced up-regulation of RETN, TNFα, and CCL2 was controlled post-transcriptionally. Therefore, we searched targeted miRNA using the MicroRNA.org program (http://www.microrna.org/microrna/home.do), which revealed that RETN, TNFα, and CCL2 mRNAs have a potential target sequence for miR-452. There were no other miRNA candidates targeting all three genes. We measured the miR-452 levels of IH-treated cells by RT-PCR and found that the level was significantly lower than that of normoxia-treated cells (0.02937 ± 0.09028 fold vs normoxia, P = 0.0458). The possible reasons as to why the level of miR-452 was decreased by IH include; mRNA levels of some enzymes involved in miRNA biosynthesis/degradation are influenced by IH; and the level of miR-452 was specifically decreased by IH either via decreased biosynthesis or enhanced degradation. We measured the mRNA levels of ribonuclease type III (DROSHA) and endoribonuclease Dicer (DICER), which are involved in the biosynthesis of miRNAs [25,26] and found that their expression was unchanged by IH (Figure 6). These results suggest that miR-452 plays a key role in post-transcriptional regulation of mRNA levels of RETN, TNFα, and CCL2. To investigate whether RETN, TNFα, and CCL2 expression in IH is regulated by miR-452, miR-452 mimic and non-specific control RNA (miR-452 mimic NC) were introduced into SW872 cells with IH/normoxia exposure, and the mRNA levels of RETN, TNFα, and CCL2 were measured by real-time RT-PCR.
As shown in Figure 7, we found that the IH-induced increases in RETN, TNFα and CCL2 mRNAs were abolished by the introduction of miR-452 mimic but not by miR-452 mimic NC. These findings indicate that IH stress down-regulates the miR-452 level in human adipocytes (Figure 6) and that the levels of RETN, TNFα, and CCL2 mRNAs are increased via the miR-452 mediated mechanism.

3. Discussion

In this study, we demonstrated that IH exposure induced increases of RETN, TNFα, and CCL2 mRNA levels. We further studied that the mechanisms by which IH up-regulates the mRNA levels of adipokines such as RETN, TNFα, and CCL2, and found the possibility of post-transcriptional miRNA-regulated mechanisms.
Causal mechanisms mediating the association between IH and insulin resistance/glucose intolerance are not well established; however, augmented dysfunction/inflammation in adipose tissue might be involved [9,13,16,17,27,28]. It is well known that macrophages, which infiltrate into adipose tissue, increase in obese patients, resulting in up-regulation of pro-inflammatory cytokines, such as TNFα and IL-6 [29,30]. However, Thorn et al. reported that adipose tissue is influenced by hypoxia in SAS patients independent of obesity [16]. Some mechanisms linking IH stress and adipose tissue inflammation have been established in 3T3-L1 cells and mouse models [13,17,27]. Recently, IH was shown to induce impairment of adipose tissue, leading to various changes in secretion of inflammatory cytokines, called adipokines [16,17,28]. Adipokines, which are bioactive mediators produced and released from adipocytes, play important roles in many physiological and pathophysiological processes that contribute to modulate homeostasis, lipid and/or glucose metabolism, blood pressure, inflammation, and atherosclerosis [14,29].
Ccl2, also referred to as monocyte chemoattractant protein-1, is a key regulator of monocyte infiltration of adipose tissue that plays a central role in the development and maintenance of chronic adipose tissue inflammation and insulin resistance [14,31,32]. In this study, the mRNA levels of Ccl2 were significantly increased in the IH condition in mouse 3T3-L1 cells (preadipocytes and adipocytes), and human SW872 cells. TNFα is a pro-inflammatory cytokine mainly produced by monocytes and macrophages. TNFα plays a key role in obesity-related insulin resistance, and increased TNFα levels contribute to impaired glucose homeostasis; however, the role of TNFα as an adipokine in the IH condition has not been fully elucidated [14,31]. In this study, TNFα was produced/secreted from 3T3-L1 adipocytes and SW872 cells in the IH condition. In SAS patients, the elevation of circulating levels of TNFα and CCL2 was reported [33,34]. Some researchers reported that TNFα and CCL2 production in monocytes was up-regulated in SAS patients [35,36], and Tnfα induced the mRNA expression of Ccl2 and IL-6, and attenuated Adip mRNA in 3T3-L1 cells [37]. However, as the expression of Adip mRNA in 3T3-L1 cells was unchanged despite significant increases of Tnfα and the up-regulation of IL-6 in differentiated 3T3-L1 being small, the up-regulation of adipokine mRNAs (Tnfα, Ccl2, and Retn) could be independently and directly caused by IH. There are few reports about expression of TNFα and CCL2 genes in adipocytes of SAS patients or under the experimental IH condition. From our results, the expression of TNFα and CCL2 was increased in adipocytes and TNFα and CCL2 could act as adipokines contributing to worsening insulin resistance in the IH condition.
Resistin is a pro-inflammatory adipokine and initially named because of its relationship to insulin resistance in rodents [31,38]. Although resistin expression is restricted to adipocytes in mice, it was reported to be produced mainly by macrophages and monocytes in humans. However, Yin et al. reported that resistin was overexpressed in the late stage of adipogenesis of SW872 cells [39]. Recently, resistin has been proposed as a marker of cardiovascular diseases [40,41] and suggested to have a possible link to SAS [42]; however, the relation between insulin resistance and resistin in humans remains unclear. Our results suggested that Retn was produced/secreted from 3T3-L1 adipocytes and SW872 cells in the IH condition. In addition, recent studies indicated that transcription of the Retn gene is induced by pro-inflammatory cytokines such as IL-1, IL-6, and TNFα, and that Retn promotes the expression of TNFα and IL-6 by macrophages and monocytes [31]. Considering our results and these findings, RETN may be up-regulated in SAS patients and can lead them to insulin resistance/type 2 diabetes. Adding to Ccl2 and Tnfα, Retn may be one of the adipokines increasing insulin resistance in IH.
Adip is specifically expressed and secreted from adipocytes. Unlike most other adipokines, the level of plasma ADIP in humans is negatively correlated with adiposity, insulin resistance, and type 2 diabetes. A causal role of ADIP in the development of type 2 diabetes, dyslipidemia, and cardiovascular diseases has been established; however, the influence of the IH condition remains unknown [29,43,44]. In our study, the mRNA level of ADIP was significantly decreased by IH in SW872 cells, while it was not changed in differentiated or undifferentiated 3T3-L1 cells. One of the reasons that ADIP mRNA levels decrease in SW872 cells is the interaction of ADIP and TNFα; that is, in the IH condition, TNFα may suppress ADIP synthesis or activity [14]. IH-induced ADIP decrease may relate to worsening insulin resistance/type 2 diabetes in SAS patients; therefore, further in vivo studies will be needed.
We investigated the mechanisms by which IH up-regulates the mRNA levels of RETN, TNFα, and CCL2, and found that the promoter activities of the genes were not increased by IH. This suggests that IH-induced up-regulation of RETN, TNFα, and CCL2 mRNAs is regulated in the post-transcriptional step. MiRNAs are small non-coding RNAs, ~22 nucleotides in length, which modulate gene expression either by translational suppression or degradation of mRNA through binding to the 3′-untranslated regions of target genes in a base-paring manner [45]. They affect the stability of their target mRNAs, resulting in changes in the amount of target mRNA, which is one of the mechanisms of post-transcriptional regulation. Until now, some studies about the role of miR-452 have been performed in malignant neoplasms such as pancreatic cancer [46], glioma [47], lung cancer [48,49], and breast cancer [50]. A number of studies have indicated that miRNAs play roles in the regulation of many biological processes (migration, metastasis, cell proliferation, apoptosis, chemosensitivity, etc.) for these various types of tumors. MiRNA studies in type 2 diabetes reported a correlation between circulating miRNAs and type 2 diabetes [51,52]. However, the papers did not indicate an involvement of miR-452 in type 2 diabetes/insulin resistance. In the area of gestational diabetes, miR-452 was reported to be upregulated in human umbilical endothelial cells (HUVEC) from infants of mothers with gestational diabetes [53]. TNFα induced oxidative stress [54] and inflammatory gene expression [55] in HUVEC, and oxidative stress induced up-regulation of CCL2 [56]. In addition, RETN was reported to induce HUVEC dysfunction [57]. The up-regulation of miR-452 in HUVEC from infants of mothers with gestational diabetes might be a defense mechanism to down-regulate TNFα, CCL2, and RETN in HUVEC.
Little is known about the mechanisms regulating adipose tissue inflammation; however, accumulating evidence indicates the importance of the roles of miRNAs in cholesterol and lipid metabolism, and controlling insulin signaling [58]. In the last decade, miRNAs have emerged as key epigenetic regulators in the adipocyte development process and functions [15]. In this study, miR-452 with common target sequence in RETN, TNFα, and CCL2 mRNAs could contribute to worsening glucose intolerance [59,60,61] in the IH-condition by up-regulation of RETN, TNFα, and CCL2 mRNAs.
In conclusion, this study revealed that the gene expression of RETN, TNFα, and CCL2 were increased via down-regulation of the miR-452 level in IH-treated adipocytes. It is suggested that, in SAS patients, up-regulation of RETN, TNFα, and CCL2 may induce a pro-inflammatory phenotype of the adipose tissue, leading to the development of insulin resistance and decreased insulin sensitivity, and miR-452 could play crucial roles in regulation of these gene expressions.

4. Materials and Methods

4.1. Cell Culture

Mouse 3T3-L1 cells were purchased from the National Institutes of Biomedical Innovation, Health and Nutrition, JCRB Cell Bank (Ibaraki, Japan) and human liposarcoma SW872 cells were purchased from American Type Culture Collection (Manassas, VA, USA). 3T3-L1 and SW872 cells were grown in DMEM (Wako Pure Chemical Industries, Ltd., Osaka, Japan) containing 10% (v/v) fetal calf serum (FCS), 100 units/mL penicillin G (Wako) and 100 μg/mL streptomycin (Wako) as described [62]. Cells were exposed to either normoxia (21% O2, 5% CO2, and balanced N2) or intermittent hypoxia (IH: 64 cycles of 5 min sustained hypoxia [1% O2, 5% CO2, and balanced N2] and 10 min normoxia) using a custom-designed, computer-controlled incubation chamber attached to an external O2–CO2–N2 computer-driven controller (O2 programmable control, 9200EX, Wakenyaku Co., Ltd., Kyoto, Japan), as described [1,11,12,63]. We used this in vitro model of IH, resulting in fluctuations of pressure of oxygen similar to the IH condition in patients with a severe degree of SAS, repeatedly exposed to severe hypoxemia followed by mild hypoxemia or normoxia (i.e., IH) [9]. Kimura and co-workers previously reported that the magnitude of IH expressed by peripheral oxygen saturation (SpO2) fluctuated between 75–98% and 50–80% in SAS [1,64], which was almost equivalent to the medium condition in the present study.

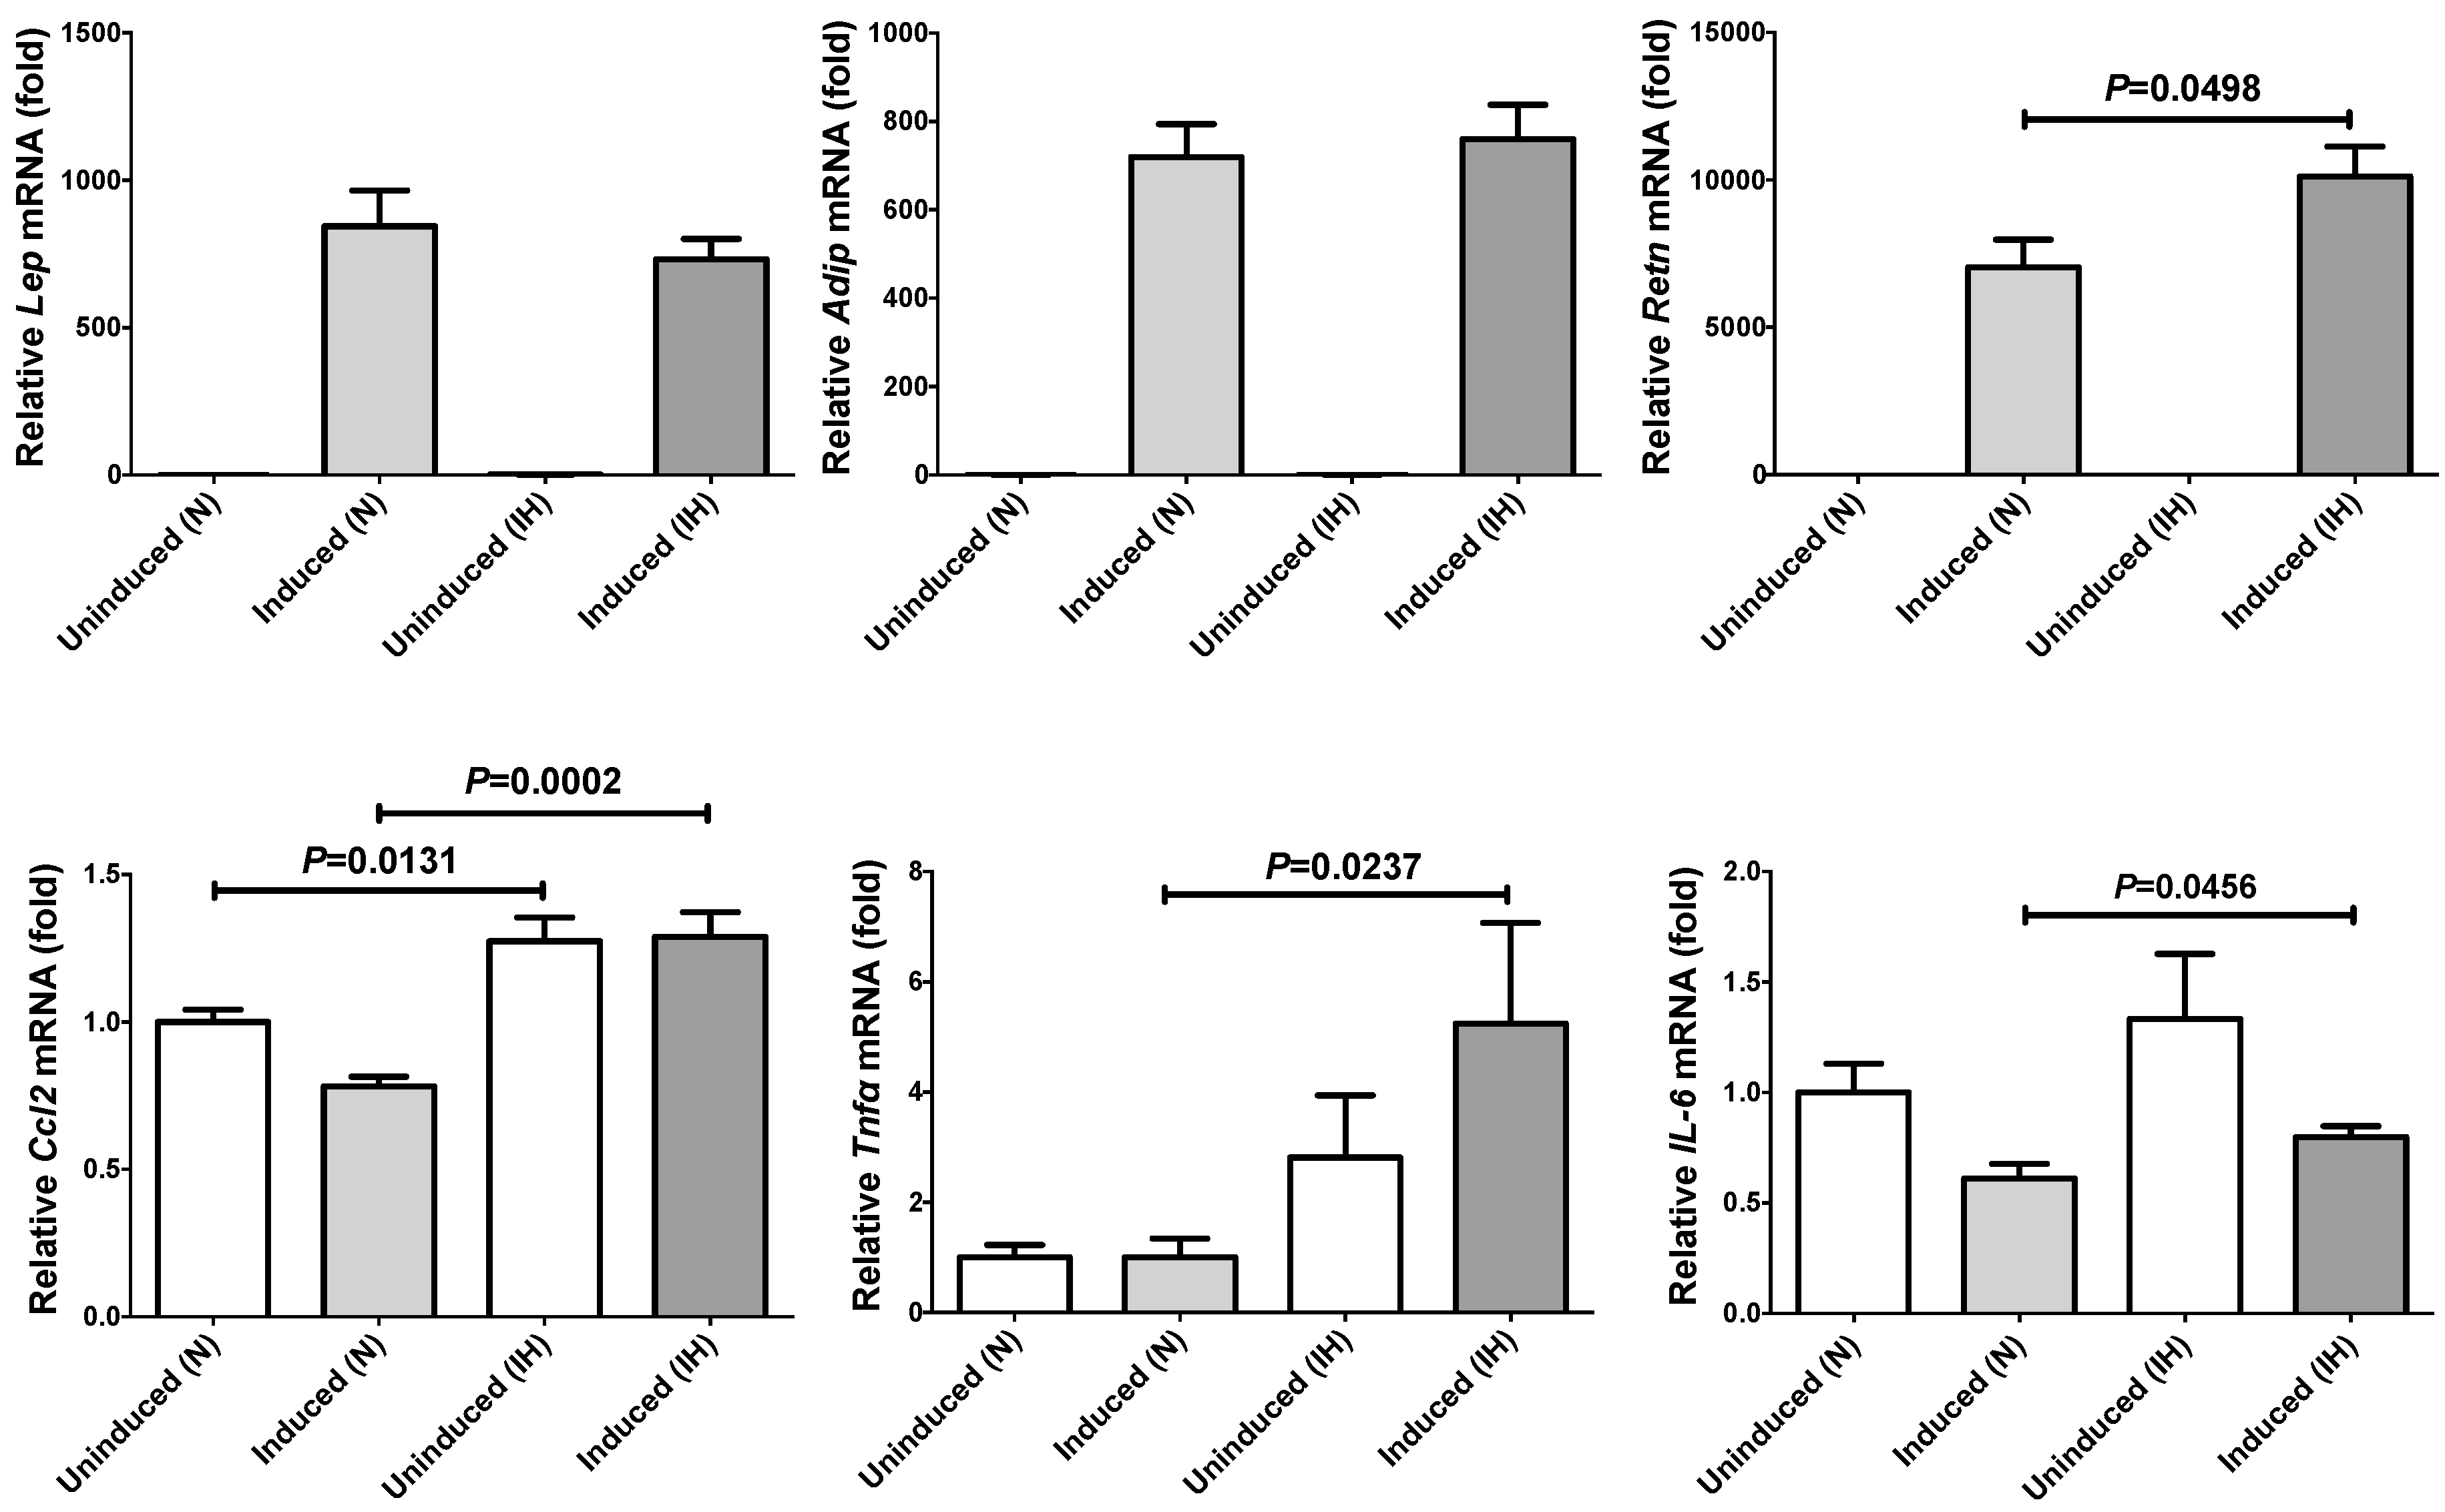
4.2. Differentiation of 3T3-L1 Cells into Adipocyte-Like Cells

Insulin, methylisobutylxanthine (IBMX) and dexamethasone were purchased from Sigma-Aldrich (St. Louis, MO, USA). To induce adipocyte differentiation, (1) cells were cultured in DMEM medium for 2 days, (2) treated with DMEM medium containing 0.5 mM IBMX, 1 μM dexamethasone and 10 μg/mL insulin for 3 days, and finally (3) cultured with DMEM medium containing 10 µg/mL insulin for 3 days, as described [65]. The cells were then incubated in fresh DMEM medium for an additional 2 days and fully differentiated adipocyte-like cells were obtained.

4.3. RT-PCR

Total RNA was isolated using a RNA protect cell mini kit (Qiagen, Hilden, Germany) from 3T3-L1 cells (preadipocytes and adipocytes) and SW872 cells, and cDNA was synthesized from total RNA as template using a High Capacity cDNA Reverse Transcription kit (Applied Biosystems, Foster City, CA) as described [11,12,63,66,67,68,69,70,71]. Real-time polymerase chain reaction (PCR) was performed using SYBR® Fast qPCR kit (KAPA Biosystems, Boston, MA) and a Thermal Cycler Dice Real Time System (Takara, Kusatsu, Japan). All the PCR primers were synthesized by Nihon Gene Research Laboratories, Inc. (NGRL; Sendai, Japan), and the primer sequences for each primer set are described in Table 1. PCR was performed with an initial step of 3 min at 95 °C followed by 40 cycles of 3 s at 95 °C and 20 s at 60 °C for β-actin; 45 cycles of 10 s at 95 °C, 5 s at 60 °C and 20 s at 72 °C for rat insulinoma gene (Rig)/ribosomal protein S15 (RpS15); 45 cycles of 3 s at 95 °C and 20 s at 62 °C for TNFα (human) and IL-6 (human); 45 cycles of 3 s at 95 °C and 20 s at 60 °C for resistin (RETN, human and mouse), C-C motif chemokine ligand 2 (CCL2, human and mouse), adiponectin (ADIP, human and mouse), IL-6 (mouse), leptin (LEP, human and mouse), TNFα (mouse), ribonuclease type III (DROSHA), endoribonuclease Dicer (DICER), and microRNA-452 (miR-452). The mRNA expression levels were normalized to the mRNA level of Rig/RpS15 in mouse samples or β-actin in human samples, and the miR-452 level was normalized to the U6 RNA level.

4.4. Measurement of RETN, TNFα and CCL2 in Culture Medium by Enzyme-Linked Immunosorbent Assay (ELISA)

Cells were exposed to either normoxia or IH for 24 h, culture medium was collected, and the concentration of RETN, TNFα, and CCL2 was measured by using a Human Resistin (RETN) ELISA kit (R&D Systems, Minneapolis, MN), Human TNFα ELISA kit (Diaclone SAS, Besançon, France) and Human C-C motif chemokine ligand 2 (CCL2) ELISA kit (R&D Systems) according to the instructions of the suppliers.

4.5. Construction of Reporter Plasmid and Luciferase Assay

Reporter plasmids were prepared by inserting the promoter fragments of human RETN (−979~+20), TNFα (−966~+19), and CCL2 (−3455~+25) upstream of a firefly luciferase reporter gene in the pGL4.17 vector (Promega, Madison, WI). The reporter plasmids were transfected into human SW872 adipocytes using Lipofectamine® 3000 (Invitrogen, Waltham, MA), as described [68,69,70], and the cells were exposed to either 64 cycles/24 h of IH, mimicking adipocytes of SAS patients, or normoxia for 24 h. After cells were exposed to IH, the cells were harvested and cell extracts were prepared in extraction buffer (0.1 M potassium phosphate, pH 7.8/0.2% Triton X-100; Life Technologies, Carlsbad, CA, USA). To monitor transfection efficiency, pCMV-SPORT-βgal plasmid (Life Technologies) was co-transfected in all experiments at a 1:10 dilution. Luciferase activity was measured using a PicaGene luciferase assay system (Toyo-ink, Tokyo, Japan) and was normalized by the β-galactosidase activity as described previously [11,12,62,63,67,68,69,70,71,72,73,74].

4.6. MiRNA Extraction, Reverse Transcription, and Real-Time Quantitative PCR

Total RNA including miRNA was isolated from SW872 cells using the miRNeasy mini kit (Qiagen) according to the manufacturer’s instructions. An equal amount of DNase-treated RNA was Poly-A tailed using a Mir-XTM miRNA first strand synthesis kit (Clontech Laboratories, Inc., Mountain View, CA, USA) according to the manufacturer’s protocol. The condition for PCR was 95 °C for 10 s, followed by 45 cycles of amplification (95 °C, 5 s, 60 °C, 20 s). U6 small nuclear RNA was used as an endogenous control for miRNA as described [11,71,73]. The primers are listed in Table 1.

4.7. MiR-452 Mimic Transfection

MiR-452 mimic (5′-AACUGUUUGCAGAGGAAACUG-3′, 5′-GUUUCCUCUCUGCAAACAGUUUU-3′) and non-specific control RNA (miR-452 mimic NC) (5′-UUCUCCGAACGUGUCACGUtt-3′, 5′-ACGUGACACGUUCGGAGAAtt-3′) were synthesized by NGRL and introduced into SW872 cells using Lipofectamine® RNAiMAX (Invitrogen) [11,67,68,69,70,71,73] just before IH/normoxia exposure, and the mRNA levels of RETN, TNF-α, and CCL2 were measured by real-time RT-PCR, as described [11,12,63,66,67,68,69,70,71,73,74].

4.8. Data Analysis

Results are expressed as mean ±SE. Statistical significance was determined by Student’s t-test using GraphPad Prism software (GraphPad Software, La Jolla, CA, USA).

Author Contributions

T.U., H.O., and S.T. contributed to the study design. T.U., A.I.-H., A.Y., M.M., S.S.-T., R.S., H.O., and S.T. contributed to data collection. T.U., A.I.-H., A.Y., M.M., S.S.-T., R.S., H.O., and S.T. contributed to data analysis. T.U., A.I.-H., A.Y., M.M., S.S.-T., R.S., H.O., M.T., C.O., and S.T. contributed data interpretation. All the authors contributed to revising and approval of manuscript content.

Funding

This work was supported in part by JSPS KAKENHI Grant Number JP18K15067, Grants-in-Aid for Young Scientists from the Ministry of Education, Culture, Sports, Science, and Technology (JSPS), Japan.

Conflicts of Interest

The authors declare no conflict of interest.

Abbreviations

ADIP Adiponectin
CCL2C-C motif chemokine ligand 2
DICEREndoribonuclease Dicer
DROSHARibonuclease type III
ELISAEnzyme-linked Immunosorbent assay
FCSFetal calf serum
HUVECHuman umbilical endothelial cells
IBMXmethylisobutylxanthine
IHIntermittent hypoxia
IL-6Interleukin-6
LEPLeptin
miRNAMicroRNA
RETNResistin
RpS15Ribosomal protein S15
RT-PCRReverse transcriptase-polymerase chain reaction
SASSleep apnea syndrome
TNFαTumor necrosis factor-α

References

  1. Ota, H.; Takasawa, S.; Yamauchi, M.; Yoshikawa, M.; Tomoda, K.; Kimura, H. Intermittent hypoxia in pancreatic beta cells. Pancreat. Disord. Ther. 2015, 5, S5-004. [Google Scholar]
  2. Young, T.; Palta, M.; Dempsey, J.; Skatrud, J.; Weber, S.; Badr, S. The occurrence of sleep-disordered breathing among middle-aged adults. N. Engl. J. Med. 1993, 328, 1230–1235. [Google Scholar] [CrossRef]
  3. Peppard, P.E.; Young, T.; Barnet, J.H.; Palta, M.; Hagen, E.W.; Hla, K.M. Increased prevalence of sleep-disordered breathing in adults. Am. J. Epidemiol. 2013, 177, 1006–1014. [Google Scholar] [CrossRef] [PubMed]
  4. Tasali, E.; Ip, M.S.M. Obstructive sleep apnea and metabolic syndrome: Alterations in glucose metabolism and inflammation. Proc. Am. Thorac. Soc. 2008, 5, 207–217. [Google Scholar] [CrossRef]
  5. Muraki, I.; Tanigawa, T.; Yamagishi, K.; Sakurai, S.; Ohira, T.; Imano, H.; Kitamura, A.; Kiyama, M.; Sato, S.; Shimamoto, T.; et al. CIRCS investigators, Nocturnal intermittent hypoxia and the development of type 2 diabetes: The circulatory risk in communities study (CIRCS). Diabetologia 2010, 53, 481–488. [Google Scholar] [CrossRef] [PubMed]
  6. Kendzerska, T.; Gershon, A.S.; Hawker, G.; Tomlinson, G.; Leung, R.S. Obstructive sleep apnea and incident diabetes. A historical cohort study. Am. J. Respir. Crit. Care Med. 2014, 190, 218–225. [Google Scholar] [CrossRef]
  7. Kent, B.D.; Grote, L.; Ryan, S.; Pépin, J.L.; Bonsignore, M.R.; Tkacova, R.; Saaresranta, T.; Verbraecken, J.; Lévy, P.; Hedner, J.; et al. Diabetes mellitus prevalence and control in sleep-disordered breathing: The European Sleep Apnea Cohort (ESADA) study. Chest 2014, 146, 982–990. [Google Scholar] [CrossRef]
  8. Priou, P.; Le Vaillant, M.; Meslier, N.; Chollet, S.; Pigeanne, T.; Masson, P.; Bizieux-Thaminy, A.; Humeau, M.P.; Goupil, F.; Ducluzeau, P.H.; et al. Association between obstructive sleep apnea severity and glucose control in patients with untreated versus treated diabetes. J. Sleep Res. 2015, 24, 425–431. [Google Scholar] [CrossRef] [PubMed] [Green Version]
  9. Murphy, A.M.; Thomas, A.; Crinion, S.J.; Kent, B.D.; Tambuwala, M.M.; Fabre, A.; Pepin, J.L.; Roche, H.M.; Arnaud, C.; Ryan, S. Intermittent hypoxia in obstructive sleep apnoea mediates insulin resistance through adipose tissue inflammation. Eur. Respir. J. 2017, 49, 1601731. [Google Scholar] [CrossRef] [PubMed]
  10. Lima, F.F.F.; Mazzotti, D.R.; Tufik, S.; Bittencourt, L. The role inflammatory response genes in obstructive sleep apnea syndrome: A review. Sleep Breath. 2016, 20, 331–338. [Google Scholar] [CrossRef]
  11. Uchiyama, T.; Ota, H.; Itaya-Hironaka, A.; Shobatake, R.; Yamauchi, A.; Sakuramoto-Tsuchida, S.; Makino, M.; Kimura, H.; Takeda, M.; Ohbayashi, C.; et al. Up-regulation of selenoprotein P and HIP/PAP mRNAs in hepatocytes by intermittent hypoxia via down-regulation of miR-203. Biochem. Biophys. Rep. 2017, 11, 130–137. [Google Scholar] [CrossRef]
  12. Shobatake, R.; Takasawa, K.; Ota, H.; Itaya-Hironaka, A.; Yamauchi, A.; Sakuramoto-Tsuchida, S.; Uchiyama, T.; Makino, M.; Sugie, K.; Takasawa, S.; et al. Up-regulation of POMC and CART mRNAs by intermittent hypoxia via GATA transcription factors in human neuronal cells. Int. J. Biochem. Cell Biol. 2018, 95, 100–107. [Google Scholar] [CrossRef] [PubMed]
  13. Gileles-Hillel, A.; Almendros, I.; Khalyfa, A.; Nigdelioglu, R.; Qiao, Z.; Hamanaka, R.B.; Mutlu, G.M.; Akbarpour, M.; Gozal, D. Prolonged exposures to intermittent hypoxia promote visceral white adipose tissue inflammation in a murine model of severe sleep apnea: Effect of normoxic recovery. Sleep 2017, 40, zsw074. [Google Scholar] [CrossRef] [PubMed]
  14. Rabe, K.; Lehrke, M.; Parhofer, K.G.; Broedl, U.C. Adipokines and insulin resistance. Mol. Med. 2008, 14, 741–751. [Google Scholar] [CrossRef] [PubMed]
  15. Maurizi, G.; Babini, L.; Guardia, L.D. Potential role of microRNAs in the regulation of adipocytes liposecretion and adipose tissue physiology. J. Cell. Physiol. 2018, 233, 9077–9086. [Google Scholar] [CrossRef] [PubMed]
  16. Thorn, C.E.; Knight, B.; Pastel, E.; McCulloch, L.J.; Patel, B.; Shore, A.C.; Kos, K. Adipose tissue is influenced by hypoxia of obstructive sleep apnea syndrome independent of obesity. Diabetes Metab. 2017, 43, 240–247. [Google Scholar] [CrossRef]
  17. Weiszenstein, M.; Shimoda, L.A.; Koc, M.; Seda, O.; Polak, J. Inhibition of lipolysis ameliorates diabetic phenotype in a mouse model of obstructive sleep apnea. Am. J. Respir. Cell Mol. Biol. 2016, 55, 299–307. [Google Scholar] [CrossRef]
  18. Rosen, E.D.; Spieglman, B.M. Molecular regulation of adipogenesis. Annu. Rev. Cell Dev. Biol. 2000, 16, 145–171. [Google Scholar] [CrossRef]
  19. Laudes, M. Role of WNT signaling in the determination of human mesenchymal stem cells into preadipocytes. J. Mol. Endocrinol. 2011, 46, R65–R72. [Google Scholar]
  20. Fasshauser, M.; Kkein, J.; Neumann, S.; Eszlinger, M.; Paschke, R. Hormonal regulation of adiponectin gene expression in 3T3-L1 adipocytes. Biochem. Biophys. Res. Commun. 2002, 290, 1084–1089. [Google Scholar] [CrossRef]
  21. Shojima, N.; Sakoda, H.; Ogihara, T.; Fujishiro, M.; Katagiri, H.; Anai, M.; Onishi, Y.; Inukai, K.; Abe, M.; Fukushima, Y.; et al. Hormonal regulation of resistin expression in 3T3-L1 and mouse adipose cells. Diabetes 2002, 51, 1737–1744. [Google Scholar] [CrossRef]
  22. Fasshauer, M.; Klein, J.; Neumann, S.; Eszlinger, M.; Paschke, R. Tumor necrosis factor α is a negative regulator of resistin gene expression and secretion in 3T3-L1 adipocytes. Biochem. Biophys. Res. Commun. 2001, 288, 1027–1031. [Google Scholar] [CrossRef] [PubMed]
  23. Fasshauer, M.; Klein, J.; Lossner, U.; Paschke, R. Interleukin (IL)-6 mRNA expression is stimulated by insulin, isopretenol, tumor necrosis factor alpha, growth hormone, and IL-6 in 3T3-L1 adipocytes. Horm. Metab. Res. 2003, 35, 147–152. [Google Scholar] [CrossRef]
  24. Fasshauser, M.; Kralisch, S.; Klier, M.; Lossner, U.; Bluher, M.; Klein, J.; Paschke, R. Adiponectin gene expression and secretion is inhibited by interleukin-6 in 3T3-L1 adipocytes. Biochem. Biophys. Res. Commun. 2003, 301, 1045–1050. [Google Scholar] [CrossRef]
  25. Francia, S.; Michelini, F.; Sexena, A.; Tang, D.; de Hoon, M.; Anelli, V.; Mione, M.; Carninci, P.; d’Adda di Fagagna, F. Site-specific DICER and DROSHA RNA products control the DNA-damage response. Nature 2012, 488, 231–235. [Google Scholar] [CrossRef] [PubMed]
  26. Zhang, J.; Zhang, X.H.; Wang, C.X.; Liu, B.; Fan, X.S.; Wen, J.J.; Shi, Q.L.; Zhou, X.J. Dysregulation of MicroRNA biosynthesis enzyme Dicer plays an important role in gastric cancer progression. Int. J. Clin. Exp. Pathol. 2014, 7, 1702–1707. [Google Scholar]
  27. Gozal, D.; Gileles-Hillel, A.; Cortese, R.; Li, Y.; Almendros, I.; Qiao, Z.; Khalyfa, A.A.; Andrade, J.; Khalyfa, A. Visceral white adipose tissue after chronic intermittent and sustained hypoxia in mice. Am. J. Respir. Cell Mol. Biol. 2017, 56, 477–487. [Google Scholar] [CrossRef] [PubMed]
  28. Ryan, S. Adipose tissue inflammation by intermittent hypoxia: Mechanistic link between obstructive sleep apnoea and metabolic dysfunction. J. Physiol. 2017, 595, 2423–2430. [Google Scholar] [CrossRef]
  29. Weisberg, S.P.; McCann, D.; Desai, M.; Rosenbaum, M.; Leibel, R.L.; Ferrante, A.W., Jr. Obesity is associated with macrophage accumulation in adipose tissue. J. Clin. Investig. 2003, 112, 1796–1808. [Google Scholar] [CrossRef] [Green Version]
  30. Tanaka, M.; Itoh, M.; Ogawa, Y.; Suganami, T. Molecular mechanism of obesity-induced ‘metabolic’ tissue remodeling. J. Diabetes Investig. 2018, 9, 256–261. [Google Scholar] [CrossRef]
  31. Ouchi, N.; Parker, J.L.; Lugus, J.J.; Walsh, K. Adipokines in inflammation and metabolic disease. Nat. Rev. Immunol. 2011, 11, 85–97. [Google Scholar] [CrossRef] [Green Version]
  32. Kulyté, A.; Belarbi, Y.; Lorente-Cebrián, S.; Bambace, C.; Arner, E.; Daub, C.O.; Hedén, P.; Rydén, M.; Mejhert, N.; Arner, P. Additive effects of microRNAs and transcription factors on CCL2 production in human white adipose tissue. Diabetes 2014, 63, 1248–1258. [Google Scholar] [CrossRef]
  33. Ciftci, T.U.; Kokturk, O.; Bukan, N.; Bilgihan, A. The relationship between serum cytokine levels with obesity and obstructive sleep apnea syndrome. Cytokine 2004, 28, 87–91. [Google Scholar] [CrossRef]
  34. Ohga, E.; Tomita, T.; Wada, H.; Yamamoto, H.; Nagase, T.; Ouchi, Y. Effects of obstructive sleep apnea on circulating ICAM-1, IL-8, and MCP-1. J. Appl. Physiol. 2003, 94, 179–184. [Google Scholar] [CrossRef] [Green Version]
  35. Minoguchi, K.; Tazaki, T.; Yokoe, T.; Minoguchi, H.; Watanabe, Y.; Yamamoto, M.; Adachi, M. Elevated production of tumor necrosis factor-α by monocytes in patients with obstructive sleep apnea syndrome. Chest 2004, 126, 1473–1479. [Google Scholar] [CrossRef]
  36. Chuang, L.P.; Chen, N.-H.; Lin, Y.; Ko, W.-S.; Pang, J.-H.S. Increased MCP-1 gene expression in monocytes of severe OSA patients and under intermittent hypoxia. Sleep Breath. 2016, 20, 425–433. [Google Scholar] [CrossRef]
  37. Masunaga, T.; Shiji, A.; Gu, N.; Joo, E.; Li, S.; Adachi, T.; Yamazaki, H.; Yasufa, K.; Kondoh, T.; Tsuda, K. γ-tocotrienol attenuates TNF-α-induced changes in secretion and gene expression of MCP-1, IL-6 and adiponectin in 3T3-L1 adipocytes. Mol. Med. Rep. 2012, 5, 905–909. [Google Scholar] [CrossRef] [Green Version]
  38. Chen, B.H.; Rifai, N.; Song, Y.; Buring, J.E.; Roberts, C.K.; Liu, S.; Manson, J.E. Circulating levels of resistin and risk of type 2 diabetes in men and women: Results from two prospective cohorts. Diabetes Care 2009, 32, 329–334. [Google Scholar] [CrossRef]
  39. Yin, C.; Xiao, Y.; Zhang, W.; Xu, E.; Liu, W.; Yi, X.; Chang, M. DNA microarray analysis of genes differentially expressed in adipocyte differentiation. J. Biosci. 2014, 39, 415–423. [Google Scholar] [CrossRef] [PubMed]
  40. Frankel, D.S.; Vasan, R.S.; D’Agostino Sr, R.B.; Benjamin, E.J.; Levy, D.; Wang, T.J.; Meigs, J.B. Resistin, adiponectin, and risk of heart failure: The Framingham offspring study. J. Am. Coll. Cardiol. 2009, 53, 754–762. [Google Scholar] [CrossRef] [PubMed]
  41. Laurikka, A.; Vuolteenaho, K.; Toikkanen, V.; Rinne, T.; Leppänen, T.; Tarkka, M.; Laurikka, J.; Moilanen, E. Adipocytokine resistin correlates with oxidative stress and myocardial injury in patients undergoing cardiac surgery. Eur. J. Cardiothorac. Surg. 2014, 46, 729–736. [Google Scholar] [CrossRef] [PubMed] [Green Version]
  42. Turnbull, C.D.; Rossi, V.A.; Santer, P.; Schwarz, E.I.; Stradling, J.R.; Petousi, N.; Kohler, M. Effect of OSA on hypoxic and inflammatory markers during CPAP withdrawal: Further evidence from three randomized control trials. Respirology 2017, 22, 793–799. [Google Scholar] [CrossRef] [PubMed]
  43. Yamauchi, T.; Kamon, J.; Ito, Y.; Tsuchida, A.; Yokomizo, T.; Kita, S.; Sugiyama, T.; Miyagishi, M.; Hara, K.; Tsunoda, M.; et al. Cloning of adiponectin receptors that mediate antidiabetic metabolic effects. Nature 2003, 423, 762–769. [Google Scholar] [CrossRef] [PubMed]
  44. Lara-Castro, C.; Fu, Y.; Chung, B.H.; Garvey, W.T. Adiponectin and the metabolic syndrome: Mechanisms mediating risk for metabolic and cardiovascular disease. Curr. Opin. Lipidol. 2007, 18, 263–270. [Google Scholar] [CrossRef]
  45. Esteller, M. Non-coding RNAs in human disease. Nat. Rev. Genet. 2011, 12, 861–874. [Google Scholar] [CrossRef] [PubMed]
  46. Li, H.; Wu, Y.; Li, P. MicroRNA-452 suppresses pancreatic cancer migration and invasion by directly targeting B-cell-specific Moloney murine leukemia virus insertion site 1. Oncol. Lett. 2017, 14, 3235–3242. [Google Scholar] [CrossRef] [Green Version]
  47. Liu, L.; Chen, K.; Wu, J.; Shi, L.; Hu, B.; Cheng, S.; Li, M.; Song, L. Downregulation of miR-452 promotes stem-like traits and tumorigenicity of gliomas. Clin. Cancer Res. 2013, 19, 3429–3438. [Google Scholar] [CrossRef]
  48. He, Z.; Xia, Y.; Pan, C.; Ma, T.; Liu, B.; Wang, J.; Chen, L.; Chen, Y. Up-regulation of miR-452 inhibits metastasis of non-small cell lung cancer by regulating BMI1. Cell. Physiol. Biochem. 2015, 37, 387–398. [Google Scholar] [CrossRef]
  49. Gan, X.N.; Gan, T.Q.; He, R.Q.; Luo, J.; Tang, R.X.; Wang, H.L.; Zhou, H.; Qing, H.; Ma, J.; Hu, X.H.; et al. Clinical significance of high expression of miR-452-5p in lung squamous cell carcinoma. Oncol. Lett. 2018, 15, 6418–6430. [Google Scholar] [CrossRef] [Green Version]
  50. Li, W.; Li, G.; Fan, Z.; Liu, T. Tumor-suppressive microRNA-452 inhibits migration and invasion of breast cancer cells by directly targeting RAB11A. Oncol. Lett. 2017, 14, 2559–2565. [Google Scholar] [CrossRef] [Green Version]
  51. Ortega, F.J.; Mercader, J.M.; Moreno-Navarrete, J.M.; Rovira, O.; Guerra, E.; Esteve, E.; Xifra, G.; Martínez, C.; Ricart, W.; Rieusset, J.; et al. Profiling of circulating microRNAs reveals common microRNAs linked to Type 2 diabetes that change with insulin sensitization. Diabetes Care 2014, 37, 1375–1383. [Google Scholar] [CrossRef]
  52. He, Y.; Ding, Y.; Liang, B.; Lin, J.; Kim, T.-K.; Yu, H.; Hang, H.; Wang, K. A systemic study of dysregulated microRNA in Type 2 diabetes mellitus. Int. J. Mol. Sci. 2017, 18, 456. [Google Scholar] [CrossRef]
  53. Tryggestad, J.B.; Vishwanath, A.; Jiang, S.; Mallappa, A.; Teague, A.M.; Takahashi, Y.; Thompson, D.M.; Chernausek, S.D. Influence of gestational diabetes mellitus on human umbilical vein endothelial cell miRNA. Clin. Sci. 2016, 130, 1955–1967. [Google Scholar] [CrossRef] [Green Version]
  54. Xia, F.; Wang, C.; Jin, Y.; Liu, Q.; Meng, Q.; Liu, K.; Sun, H. Luteolin protects HUVECs from TNF-α-induced oxidative stress and inflammation via its effects on the Nox4/ROS-NF-κB and MAPK pathways. J. Atheroscler. Thromb. 2014, 21, 768–783. [Google Scholar] [CrossRef] [PubMed]
  55. Da Silva, M.S.; Julien, P.; Bilodeau, J.-F.; Barbier, O.; Rudkowska, I. Trans fatty acids suppress TNF-α-induced inflammatory gene expression in endothelial (HUVEC) and hepatocellular carcinoma (HepG2) cells. Lipids 2017, 52, 315–325. [Google Scholar] [CrossRef]
  56. Tumur, Z.; Shimizu, H.; Enomoto, A.; Miyazaki, H.; Niwa, T. Indoxyl sulfate upregulates expression of ICAM-1 and MCP-1 by oxidative stress-induced NFκB activation. Am. J. Nephrol. 2010, 31, 435–441. [Google Scholar] [CrossRef]
  57. Li, Z.; Li, F.; Yan, L.; Li, F.; Li, Y.; Cheng, H.; Fu, Z. Study on the action of resistin-induced human umbilical vein endothelial cell dysfunction. Front. Med. China 2007, 1, 196–199. [Google Scholar] [CrossRef] [PubMed]
  58. Kolfschoten, I.G.M.; Roggli, E.; Nesca, V.; Regazzi, R. Role and therapeutic potential of microRNAs in diabetes. Diabetes Obes. Metab. 2009, 11, 118–129. [Google Scholar] [CrossRef] [PubMed] [Green Version]
  59. Cawthorn, W.P.; Sethi, J.K. TNF-α and adipocyte biology. FEBS Lett. 2008, 582, 117–131. [Google Scholar] [CrossRef] [PubMed]
  60. Sell, H.; Eckel, J. Monocyte chemotactic protein-1 and its role in insulin resistance. Curr. Opin. Lipidol. 2007, 18, 258–262. [Google Scholar] [CrossRef] [PubMed]
  61. Huang, X.; Yang, Z. Resistin’s obesity and insulin resistance: The countinuing disconnect between rodents and humans. J. Endocrinol. Investig. 2016, 39, 607–615. [Google Scholar] [CrossRef] [PubMed]
  62. Murakami-Kawaguchi, S.; Takasawa, S.; Onogawa, T.; Nata, K.; Itaya-Hironaka, A.; Sakuramoto-Tsuchida, S.; Yamauchi, A.; Ota, H.; Takeda, M.; Kato, M.; et al. Expression of Ins1 and Ins2 genes in mouse fetal liver. Cell Tissue Res. 2014, 355, 303–314. [Google Scholar] [CrossRef]
  63. Ota, H.; Tamaki, S.; Itaya-Hironaka, A.; Yamauchi, A.; Sakuramoto-Tsuchida, S.; Morioka, T.; Takasawa, S.; Kimura, H. Attenuation of glucose-induced insulin secretion by intermittent hypoxia via down-regulation of CD38. Life Sci. 2012, 90, 206–211. [Google Scholar] [CrossRef]
  64. Niijima, M.; Kimura, H.; Edo, H.; Shinozaki, T.; Kang, J.; Masuyama, S.; Tatsumi, K.; Kuriyama, T. Manifestation of pulmonary hypertension during REM sleep in obstructive sleep apnea syndrome. Am. J. Respir. Crit. Care Med. 1999, 159, 1766–1772. [Google Scholar] [CrossRef] [PubMed]
  65. Reed, B.C.; Lane, M.D. Insulin receptor synthesis and turnover in differentiating 3T3-L1 preadipocytes. Proc. Natl. Acad. Sci. USA 1980, 77, 285–289. [Google Scholar] [CrossRef]
  66. Ota, H.; Itaya-Hironaka, A.; Yamauchi, A.; Sakuramoto-Tsuchida, S.; Miyaoka, T.; Fujimura, T.; Tsujinaka, H.; Yoshimoto, K.; Nakagawara, K.; Tamaki, S.; et al. Pancreatic β cell proliferation by intermittent hypoxia via up-regulation of Reg family genes and HGF gene. Life Sci. 2013, 93, 664–672. [Google Scholar] [CrossRef] [PubMed]
  67. Yamauchi, A.; Itaya-Hironaka, A.; Sakuramoto-Tsuchida, S.; Takeda, M.; Yoshimoto, K.; Miyaoka, T.; Fujimura, T.; Tsujinaka, H.; Tsuchida, C.; Ota, H.; et al. Synergistic activations of REG Iα and REG Iβ promoters by IL-6 and glucocorticoids through JAK/STAT pathway in human pancreatic β cells. J. Diabetes Res. 2015, 2015, 173058. [Google Scholar] [CrossRef] [PubMed]
  68. Fujimura, T.; Fujimoto, T.; Itaya-Hironaka, A.; Miyaoka, T.; Yoshimoto, K.; Yamauchi, A.; Sakuramoto-Tsuchida, S.; Kondo, S.; Takeda, M.; Tsujinaka, H.; et al. Interleukin-6/STAT pathway is responsible for the induction of gene expression of REG Iα, a new auto-antigen in Sjögren’s syndrome patients, in salivary duct epithelial cells. Biochem. Biophys. Rep. 2015, 2, 69–74. [Google Scholar] [CrossRef] [PubMed]
  69. Tsujinaka, H.; Itaya-Hironaka, A.; Yamauchi, A.; Sakuramoto-Tsuchida, S.; Ota, H.; Takeda, M.; Fujimura, T.; Takasawa, S.; Ogata, N. Human retinal pigment epithelial cell proliferation by the combined stimulation of hydroquinone and advanced glycation end-products via up-regulation of VEGF gene. Biochem. Biophys. Rep. 2015, 2, 123–131. [Google Scholar] [CrossRef]
  70. Tsuchida, C.; Sakuramoto-Tsuchida, S.; Takeda, M.; Itaya-Hironaka, A.; Yamauchi, A.; Misu, M.; Shobatake, R.; Uchiyama, T.; Makino, M.; Pujol-Antonell, I.; et al. Expression of REG family genes in human inflammatory bowel diseases and its regulation. Biochem. Biophys. Rep. 2017, 12, 198–205. [Google Scholar] [CrossRef] [PubMed]
  71. Tohma, Y.; Dohi, Y.; Shobatake, R.; Uchiyama, T.; Takeda, M.; Takasawa, S.; Tanaka, Y.; Ohgushi, H. Reg gene expression in periosteum after fracture and its in vitro induction triggered by IL-6. Int. J. Mol. Sci. 2017, 18, 2257. [Google Scholar] [CrossRef] [PubMed]
  72. Nakagawa, K.; Takasawa, S.; Nata, K.; Yamauchi, A.; Itaya-Hironaka, A.; Ota, H.; Yoshimoto, K.; Sakuramoto-Tsuchida, S.; Miyaoka, T.; Takeda, M.; et al. Prevention of Reg I-induced β-cell apoptosis by IL-6/dexamethasone through activation of HGF gene regulation. Biochim. Biophys. Acta 2013, 1833, 2988–2995. [Google Scholar] [CrossRef] [PubMed]
  73. Takasawa, S.; Tsuchida, C.; Sakuramoto-Tsuchida, S.; Takeda, M.; Itaya-Hironaka, A.; Yamauchi, A.; Misu, M.; Shobatake, R.; Uchiyama, T.; Makino, M.; et al. Expression of human REG family genes in inflammatory bowel diseases and their molecular mechanism. Immunol. Res. 2018, 66, 800–805. [Google Scholar] [CrossRef] [PubMed]
  74. Shobatake, R.; Itaya-Hironaka, A.; Yamauchi, A.; Makino, M.; Sakuramoto-Tsuchida, S.; Uchiyama, T.; Ota, H.; Takahashi, N.; Ueno, S.; Sugie, K.; et al. Intermittent hypoxia up-regulates gene expression of peptide YY (PYY), glucagon-like peptide-1 (GLP-1), and neurotensin (NTS) in enteroendocrine cells. Int. J. Mol. Sci. 2019, 20, 1849. [Google Scholar] [CrossRef] [PubMed]
Figure 1. The mRNA levels of Retn, Tnfα, and Ccl2 in 3T3-L1 cells (preadipocyte and adipocyte) and SW872 cells treated by normoxia or IH for 24 h. The levels of the adipokine mRNAs were measured by real-time RT-PCR using Rig/RpS15 (in mouse) and β-actin (in human) as an endogenous control. Data is expressed as mean ± SE for each group (n = 4). The statistical analyses were performed using Student’s t-test.
Ijms 20 01960 g001
Figure 2. The mRNA levels of Il-6, Adip, and Lep in 3T3-L1 cells (pre-adipocyte and adipocyte) and SW872 cells treated by normoxia or IH for 24 h. The levels of the adipokine mRNAs were measured by real-time RT-PCR using Rig/RpS15 (in mouse) and β-actin (in human) as an endogenous control. Data is expressed as mean ± SE for each group (n = 4). The statistical analyses were performed using Student’s t-test.
Ijms 20 01960 g002
Figure 3. The mRNA levels of Lep, Adip, Retn, Ccl2, Tnfα, and IL-6 in 3T3-L1 cells treated by normoxia or IH for 24 h. Figure shows relative comparison of mRNA expression in 3T3-L1 preadipocytes with 3T3-L1 adipocytes. The levels of the adipokine mRNAs were measured by real-time RT-PCR using Rig/RpS15 as an endogenous control. Data are expressed as mean ± SE for each group (n = 4). The statistical analyses were performed using Student’s t-test.
Ijms 20 01960 g003
Figure 4. Concentrations of RETN, TNFα, and CCL2 in SW872 cell culture medium were measured by ELISA. SW872 cells were treated by normoxia or IH for 24 h. Data are expressed as means ± SE for each group (n = 3).
Ijms 20 01960 g004
Figure 5. Luciferase assays of promoter activities of RETN, TNFα, and CCL2 in SW872 cells. Reporter plasmids prepared by inserting the promoter fragments of RETN (−979~+20), TNFα (−966~+19), and CCL2 (−3455~+25), upstream of a firefly luciferase reporter gene in pGL4.17 vector were transfected into SW872 cells. After cells were exposed either to IH or normoxia for 24 h, the cells were lysed and the promoter activities of RETN, TNFα, and CCL2 were measured. All data are represented as the mean ± SE of the samples (n = 5–6). The statistical analyses were performed using Student’s t-test.
Ijms 20 01960 g005
Figure 6. The levels of miR-452, DROSHA mRNA, and DICER mRNA of SW872 cells treated with normoxia or IH for 24 h. The levels of miR-452 and DROSHA and DICER mRNAs were measured by real-time RT-PCR using U6 (for miR-452) and β-actin (for DROSH and DICER) as an endogenous control. Data are expressed as mean ± SE for each group (n = 4–6). The statistical analyses were performed using Student’s t-test.
Ijms 20 01960 g006
Figure 7. Effects of miR-452 mimic transfection on RETN, TNFα, and CCL2 expression. The miR-452 mimic (5′-AACUGUUUGCAGAGGAAACUG-3′, 5′-GUUUCCUCUCUGCAAACAGUUUU-3′) and non-specific control RNA (miR-452 mimic NC) (5′-UUCUCCGAACGUGUCACGUtt-3′, 5′-ACGUGACACGUUCGGAGAAtt-3′) were synthesized by Nihon Gene Research Laboratories, Inc. (NGRL; Sendai, Japan) and introduced into SW872 cells using Lipofectamine® RNAiMAX just before IH/normoxia exposure, and the mRNA levels of RETN, TNFα, and CCL2 were measured by real-time RT-PCR, as described in Materials and Methods. The expression of RETN, TNFα, and CCL2 mRNA was measured by real-time RT-PCR using β-actin as an endogenous control. Figure represents (A) RETN mRNA expression in miR-452 mimic NC-introduced cells, (B) RETN mRNA expression in miR-452 mimic-introduced cells, (C) TNFα mRNA expression in miR-452 mimic NC-introduced cells, (D) TNFα mRNA expression in miR-452 mimic-introduced cells, (E) CCL2 mRNA expression in miR-452 mimic NC-introduced cells, and (F) CCL2 mRNA expression in miR-452 mimic-introduced cells. Data are expressed as mean ± SE for each group (n = 6). The statistical analyses were performed using Student’s t-test.
Ijms 20 01960 g007
Table 1. Primers used for real-time RT-PCR.
Target mRNA/miRPrimer Sequence
Mouse Adip (NM_009065)5′-GGCTCTGTGCTGCTCCATCT-3′
5′-AGAGTCGTTGACGTTATCTGCATAG-3′
Mouse Retn (NM_022984)5′-GTACCCACGGGATGAAGAACC-3′
5′-GCAGAGCCACAGGAGCAG-3′
Mouse IL-6 (NM_031168)5′-ACAACCACGGCCTTCCCTACTT-3′
5′-CAGGATTTCCCAGCGAACATGTG-3′
Mouse TNFα (NM_013693)5′-CCTCCCTCTCATCAGTTCTA-3′
5′-ACTTGGTGGTTTGCTACGAC-3′
Mouse Ccl2 (NM_011333)5′-CCACTCACCTGCTGCTACTCAT -3′
5′-TGGTGATCCTCTTGTAGCTCTCC -3′
Mouse Rig/RpS15 (NM_009091)5′-ACGGCAAGACCTTCAACCAG-3
5′-ATGGAGAACTCGCCCAGGTAG-3′
Human ADIP (NM_001177800)5′-CATGACCAGGAAACCACGACT -3′
5′-TGAATGCTGAGCGGTAT -3′
Human RETN (NM_020415)5′-TCCTCCTCCTCCCTGTCCTGG-3′
5′-CAGTGACATGTGGTCTGGGCG -3′
Human IL-6 (NM_000600)5′-GGTACATCCTCGACGGCATC-3′
5′-GCCTCTTTGCTGCTTTCACAC-3′
Human TNFα (NM_000594)5′-CTTCTCCTTCCTGATCGTGG-3′
5′-TCTCAGCTCCACGCCATT-3′
Human CCL2 (NM_002982)5′-GTCTCTGCCGCCCTTCTGT-3′
5′-TTGCATCTGGCTGAGCGAG -3′
Human DICER (NM_177438)5′-GAGCTGTCCTATCAGATCAGGG-3′
5′-ACTTGTTGAGCAACCTGGTTT-3′
Human DROSHA (NM_013235)5′-GGCCCGAGAGCCTTTTATAG-3′
5′-TGCACACGTCTAACTCTTCCAC-3′
Human β-actin (NM_001101)5′-GCGAGAAGATGACCCAGA-3′
5′-CAGAGGCGTACAGGGATA-3′
Human miR-452 (NR_029973)5′-GCGAACTGTTTGCAGAGG-3′
5′-CAGTGCGTGTCGTGGAGT-3′
Human U6 (NR_004394)5′-CTCGCTTCGGCAGCACA-3′
5′-AACGCTTCACGAATTTGCGT-3′

