Comparative Gene-Expression Analysis of Alzheimer’s Disease Progression with Aging in Transgenic Mouse Model

Abstract
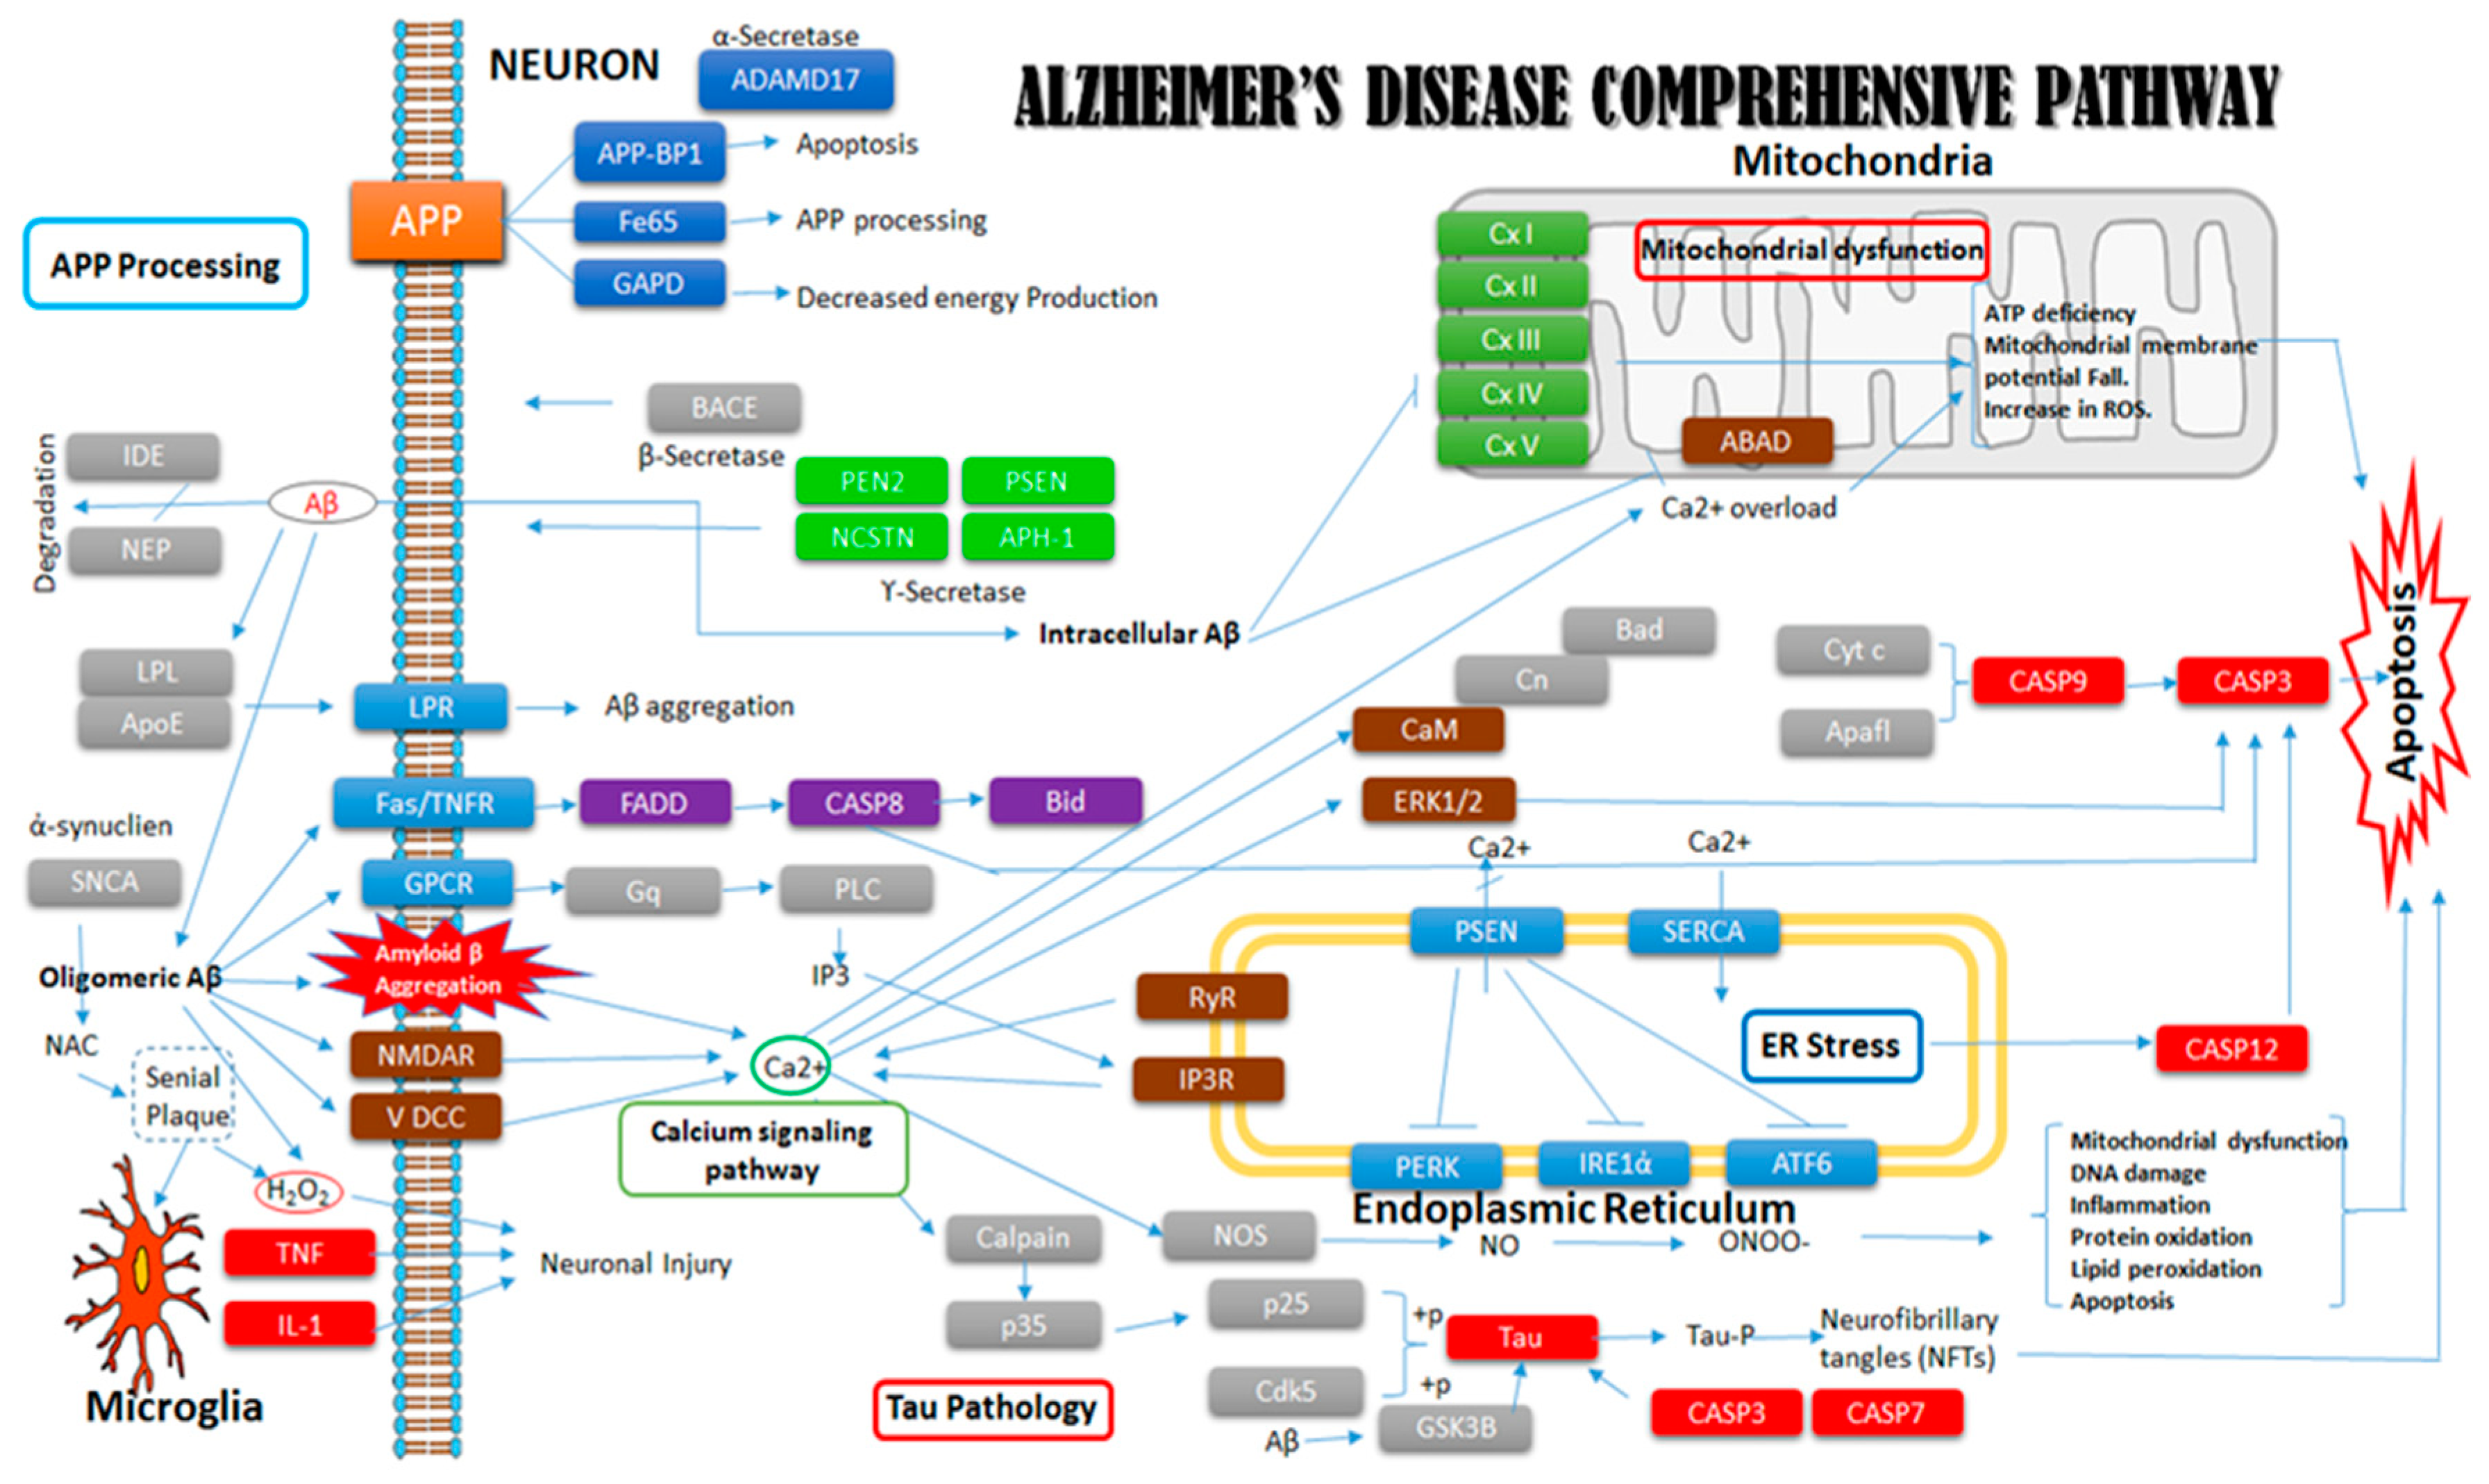
:1. Introduction
2. Results
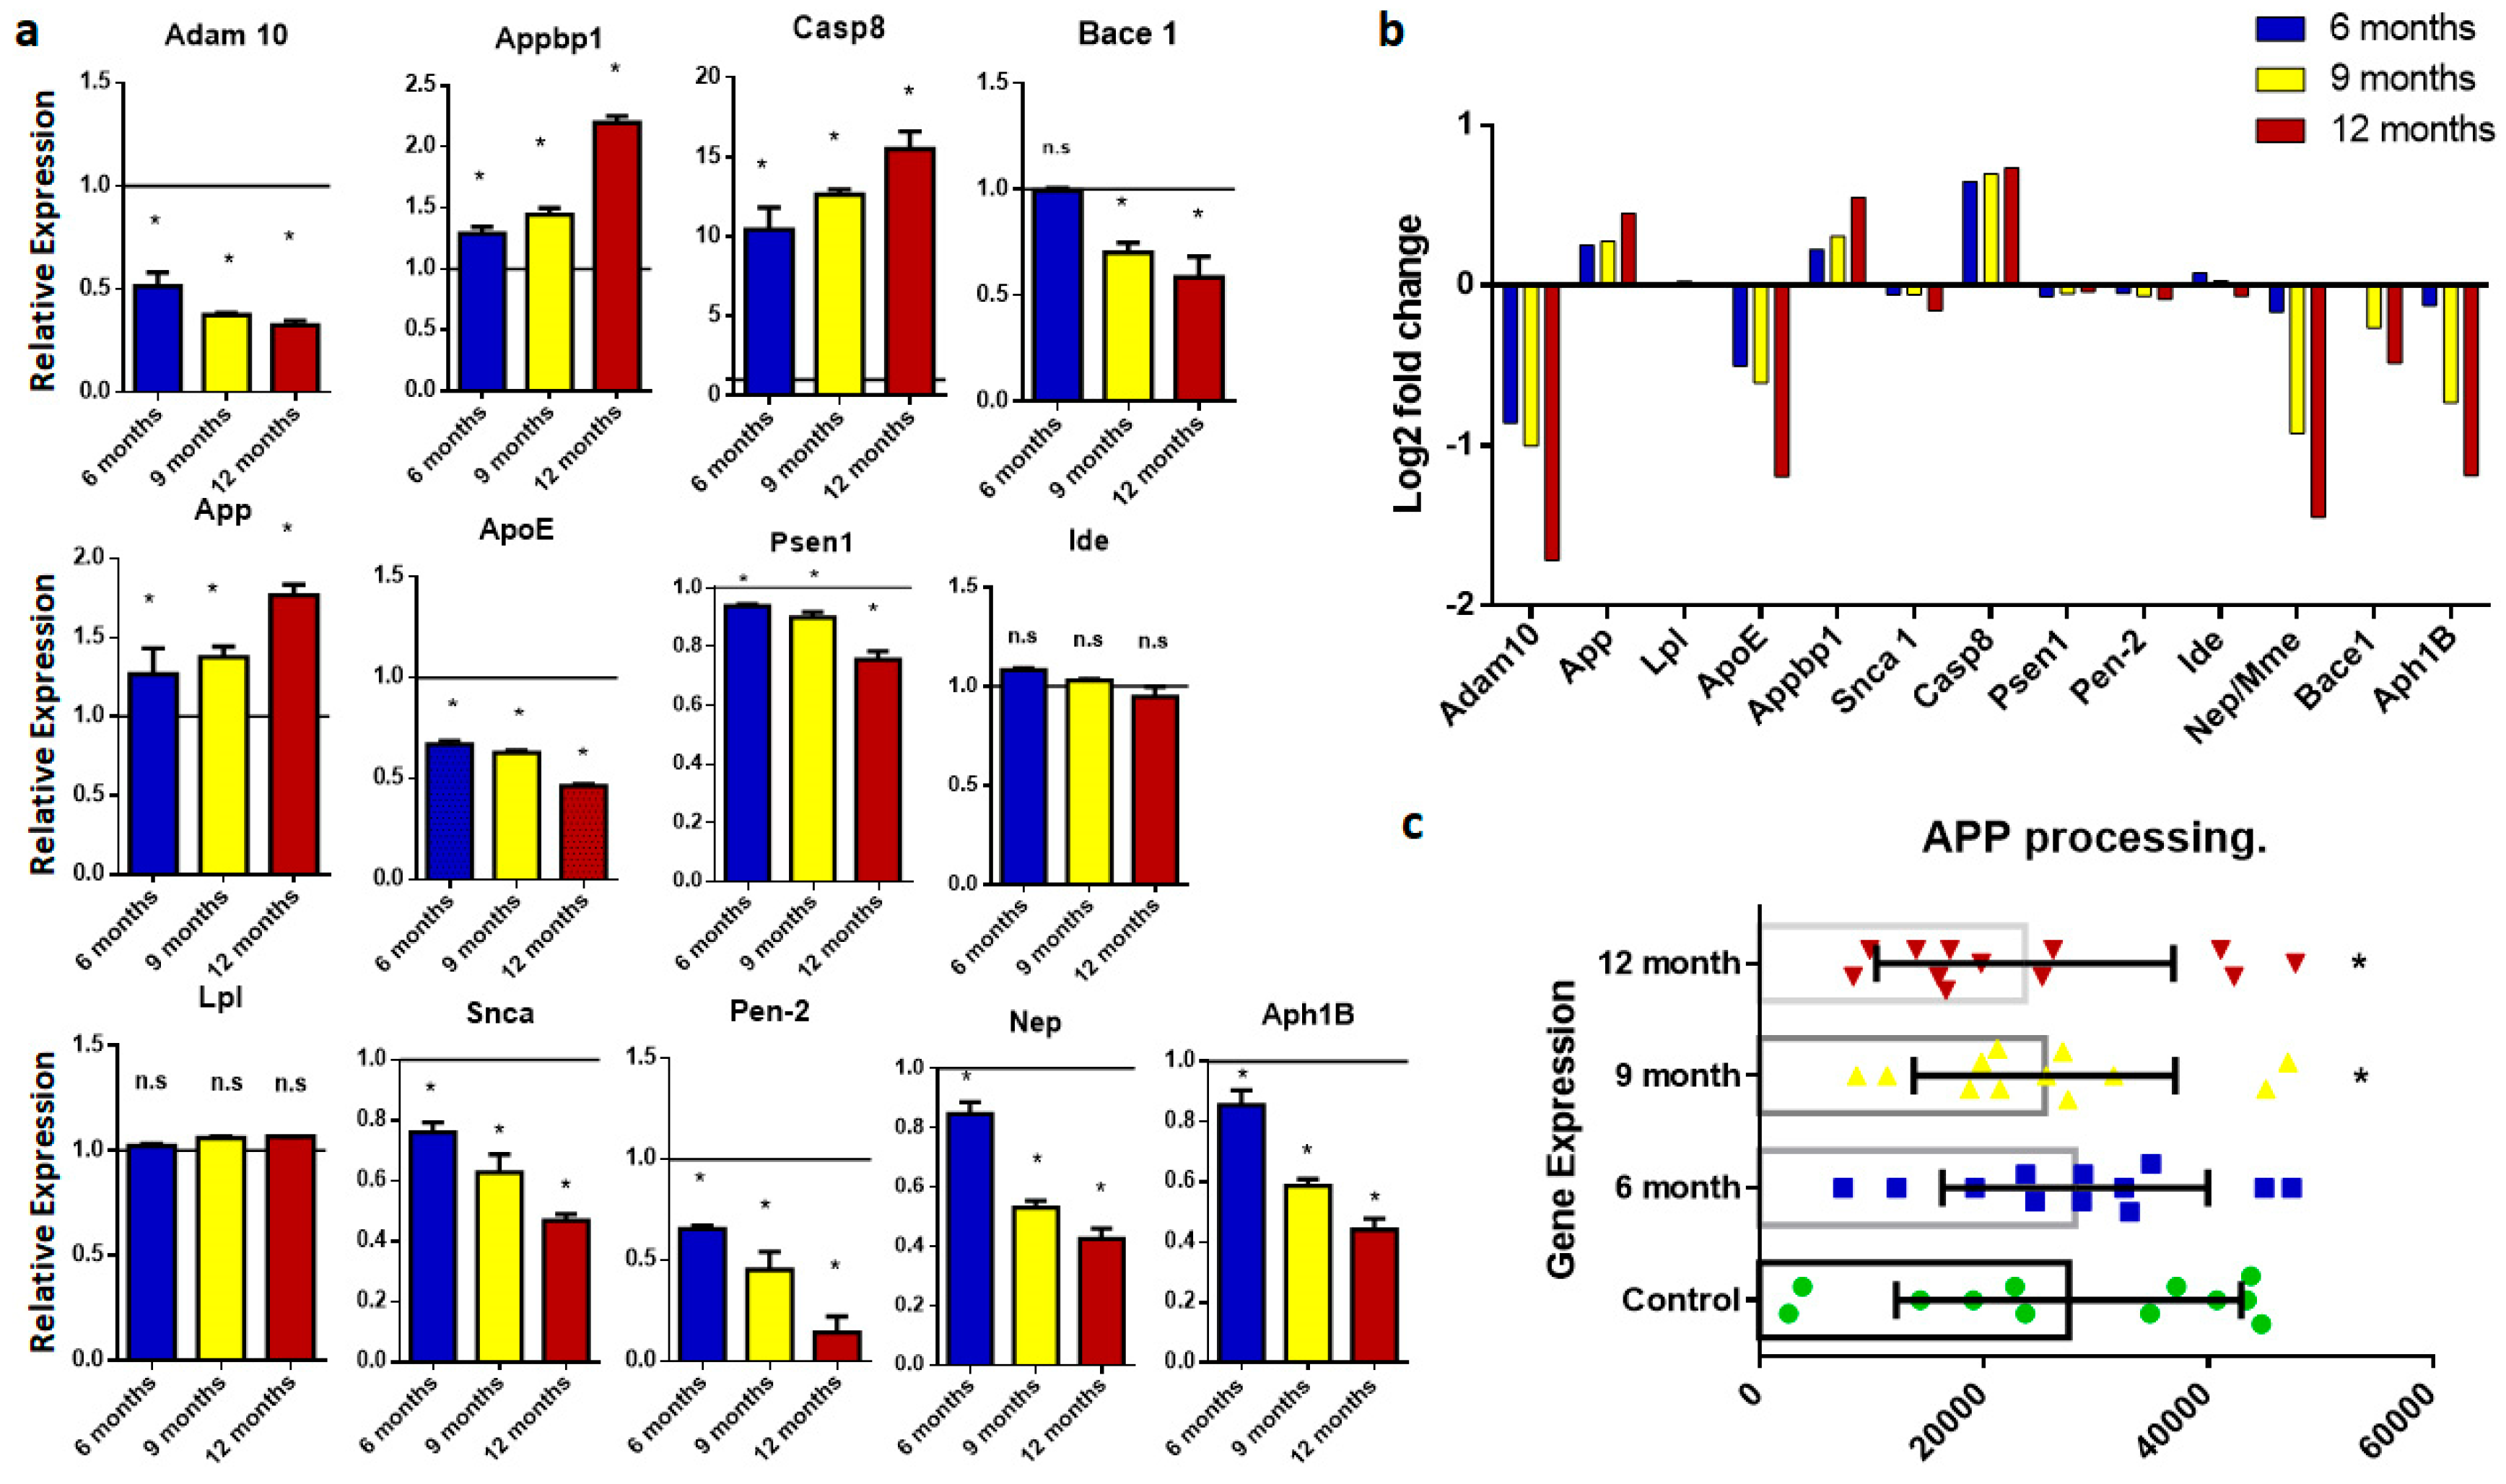
2.1. Amyloid Precursor Protein Processing
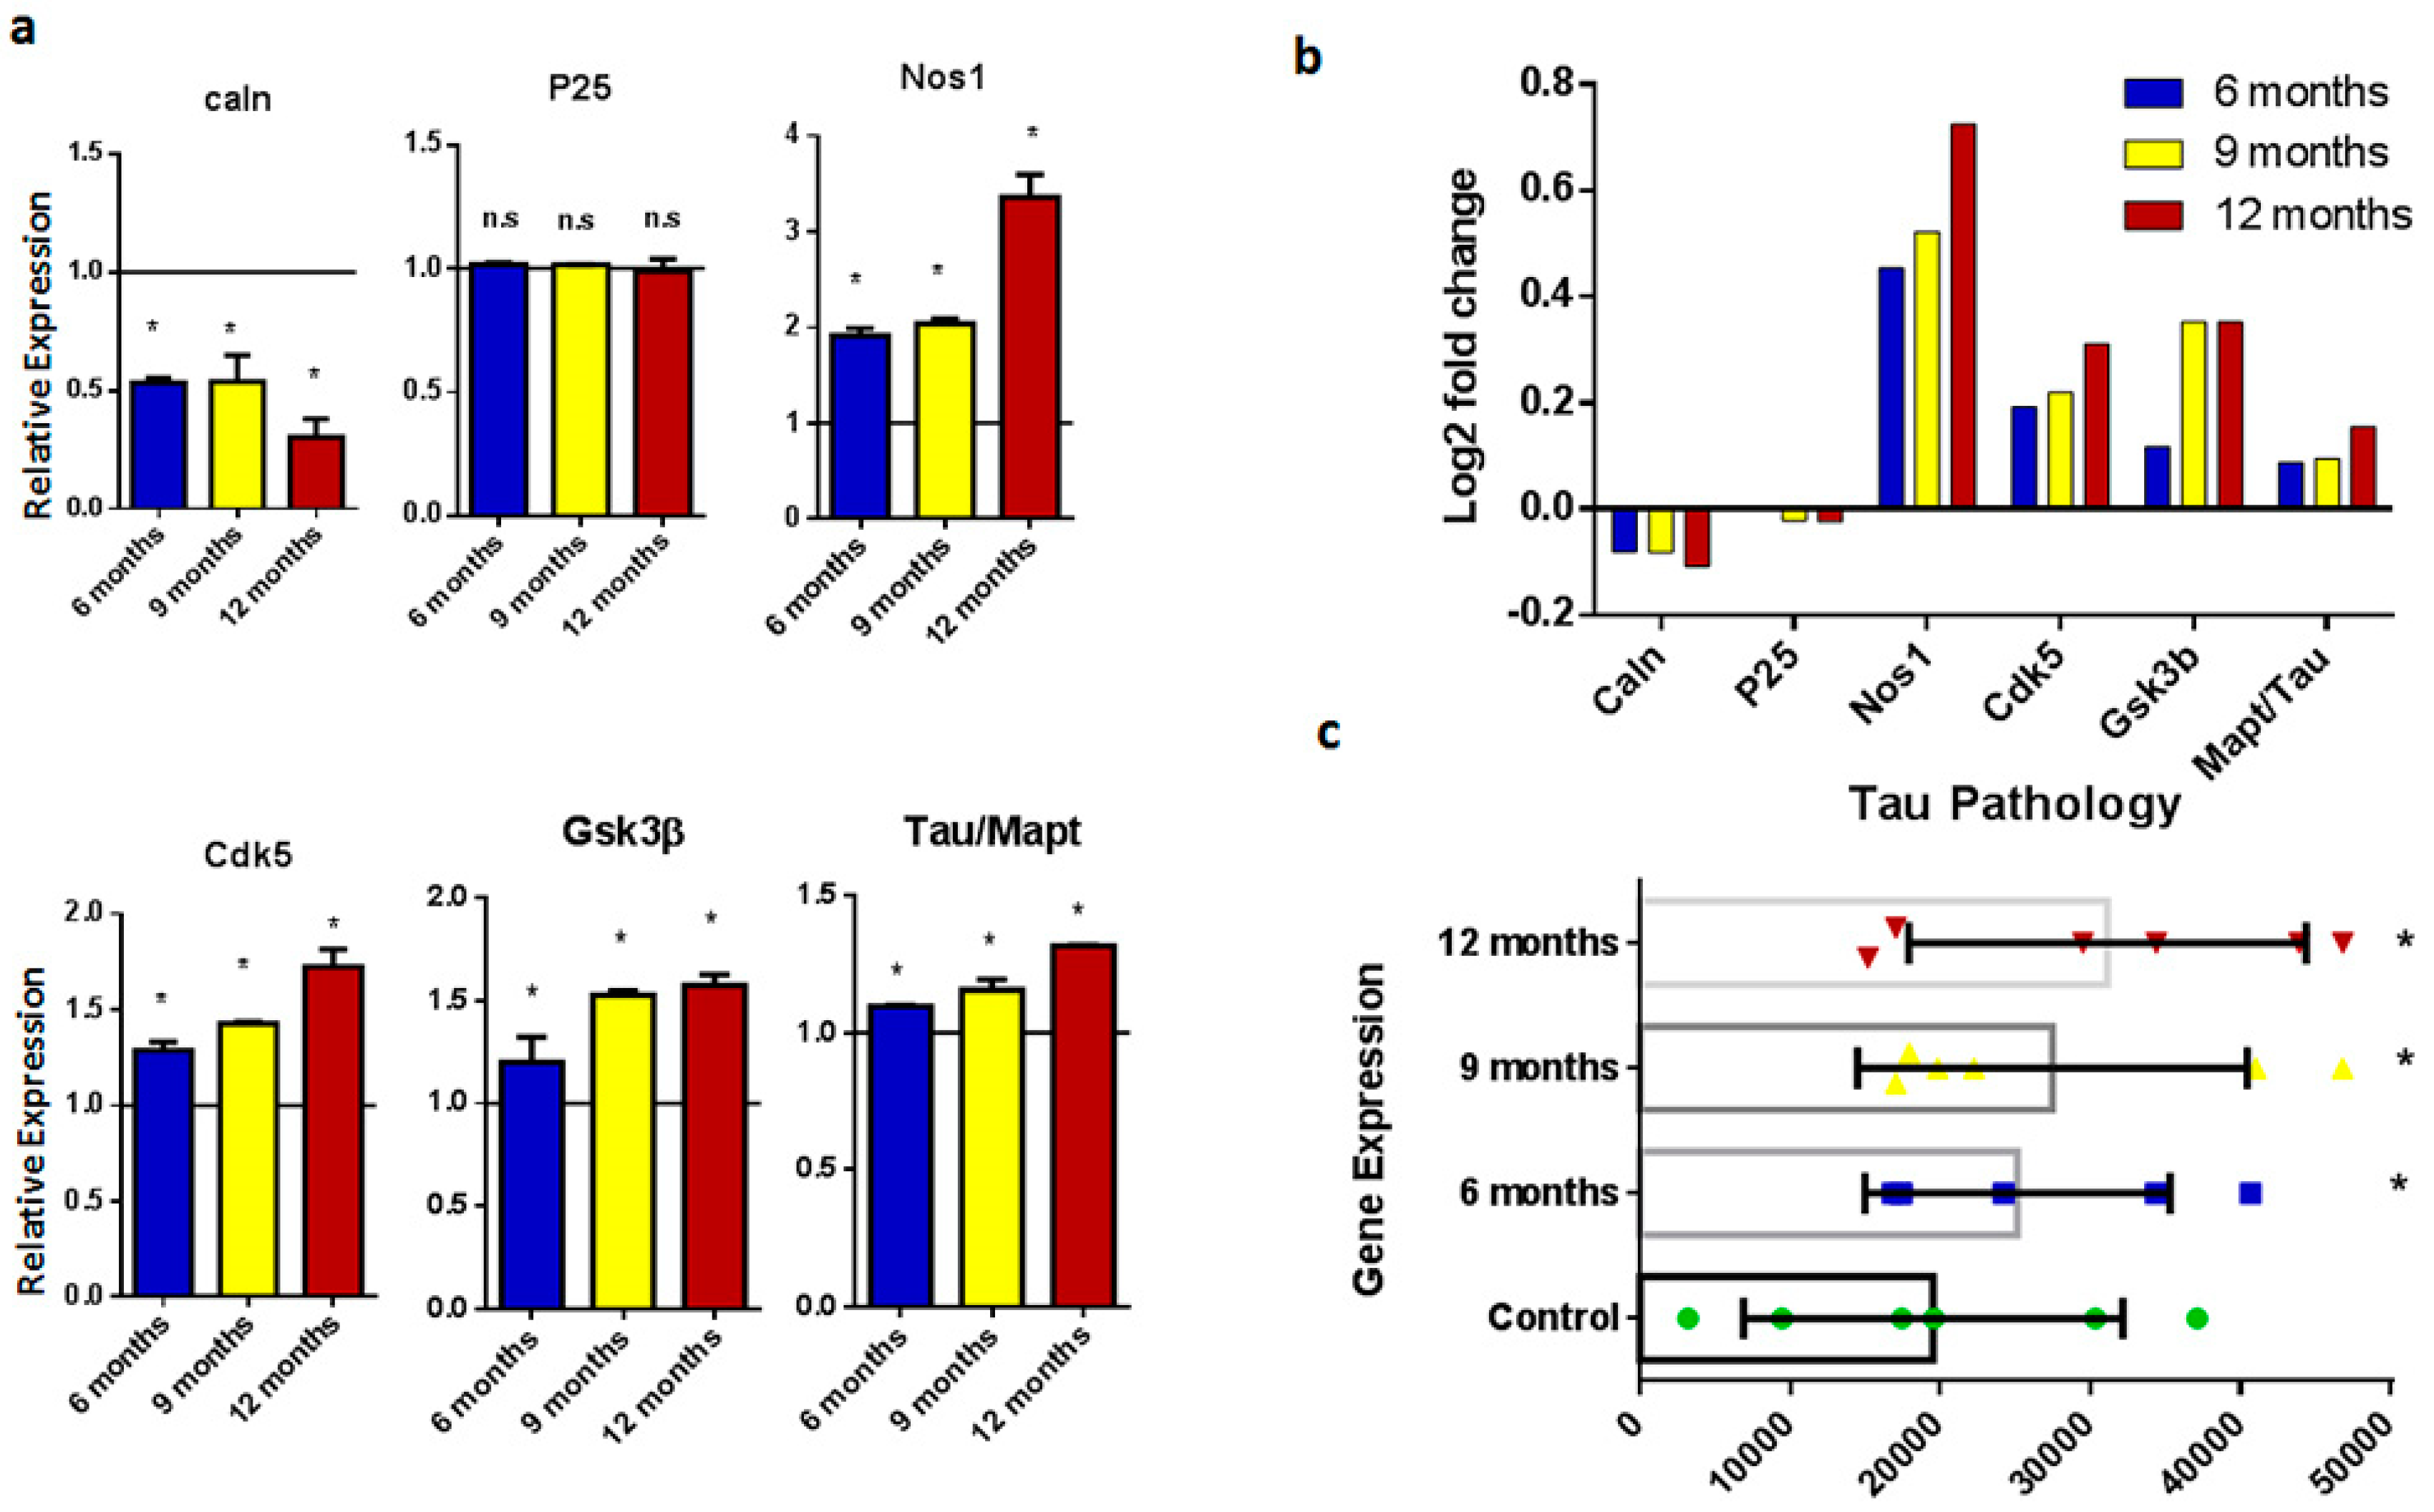
2.2. Tau Pathology
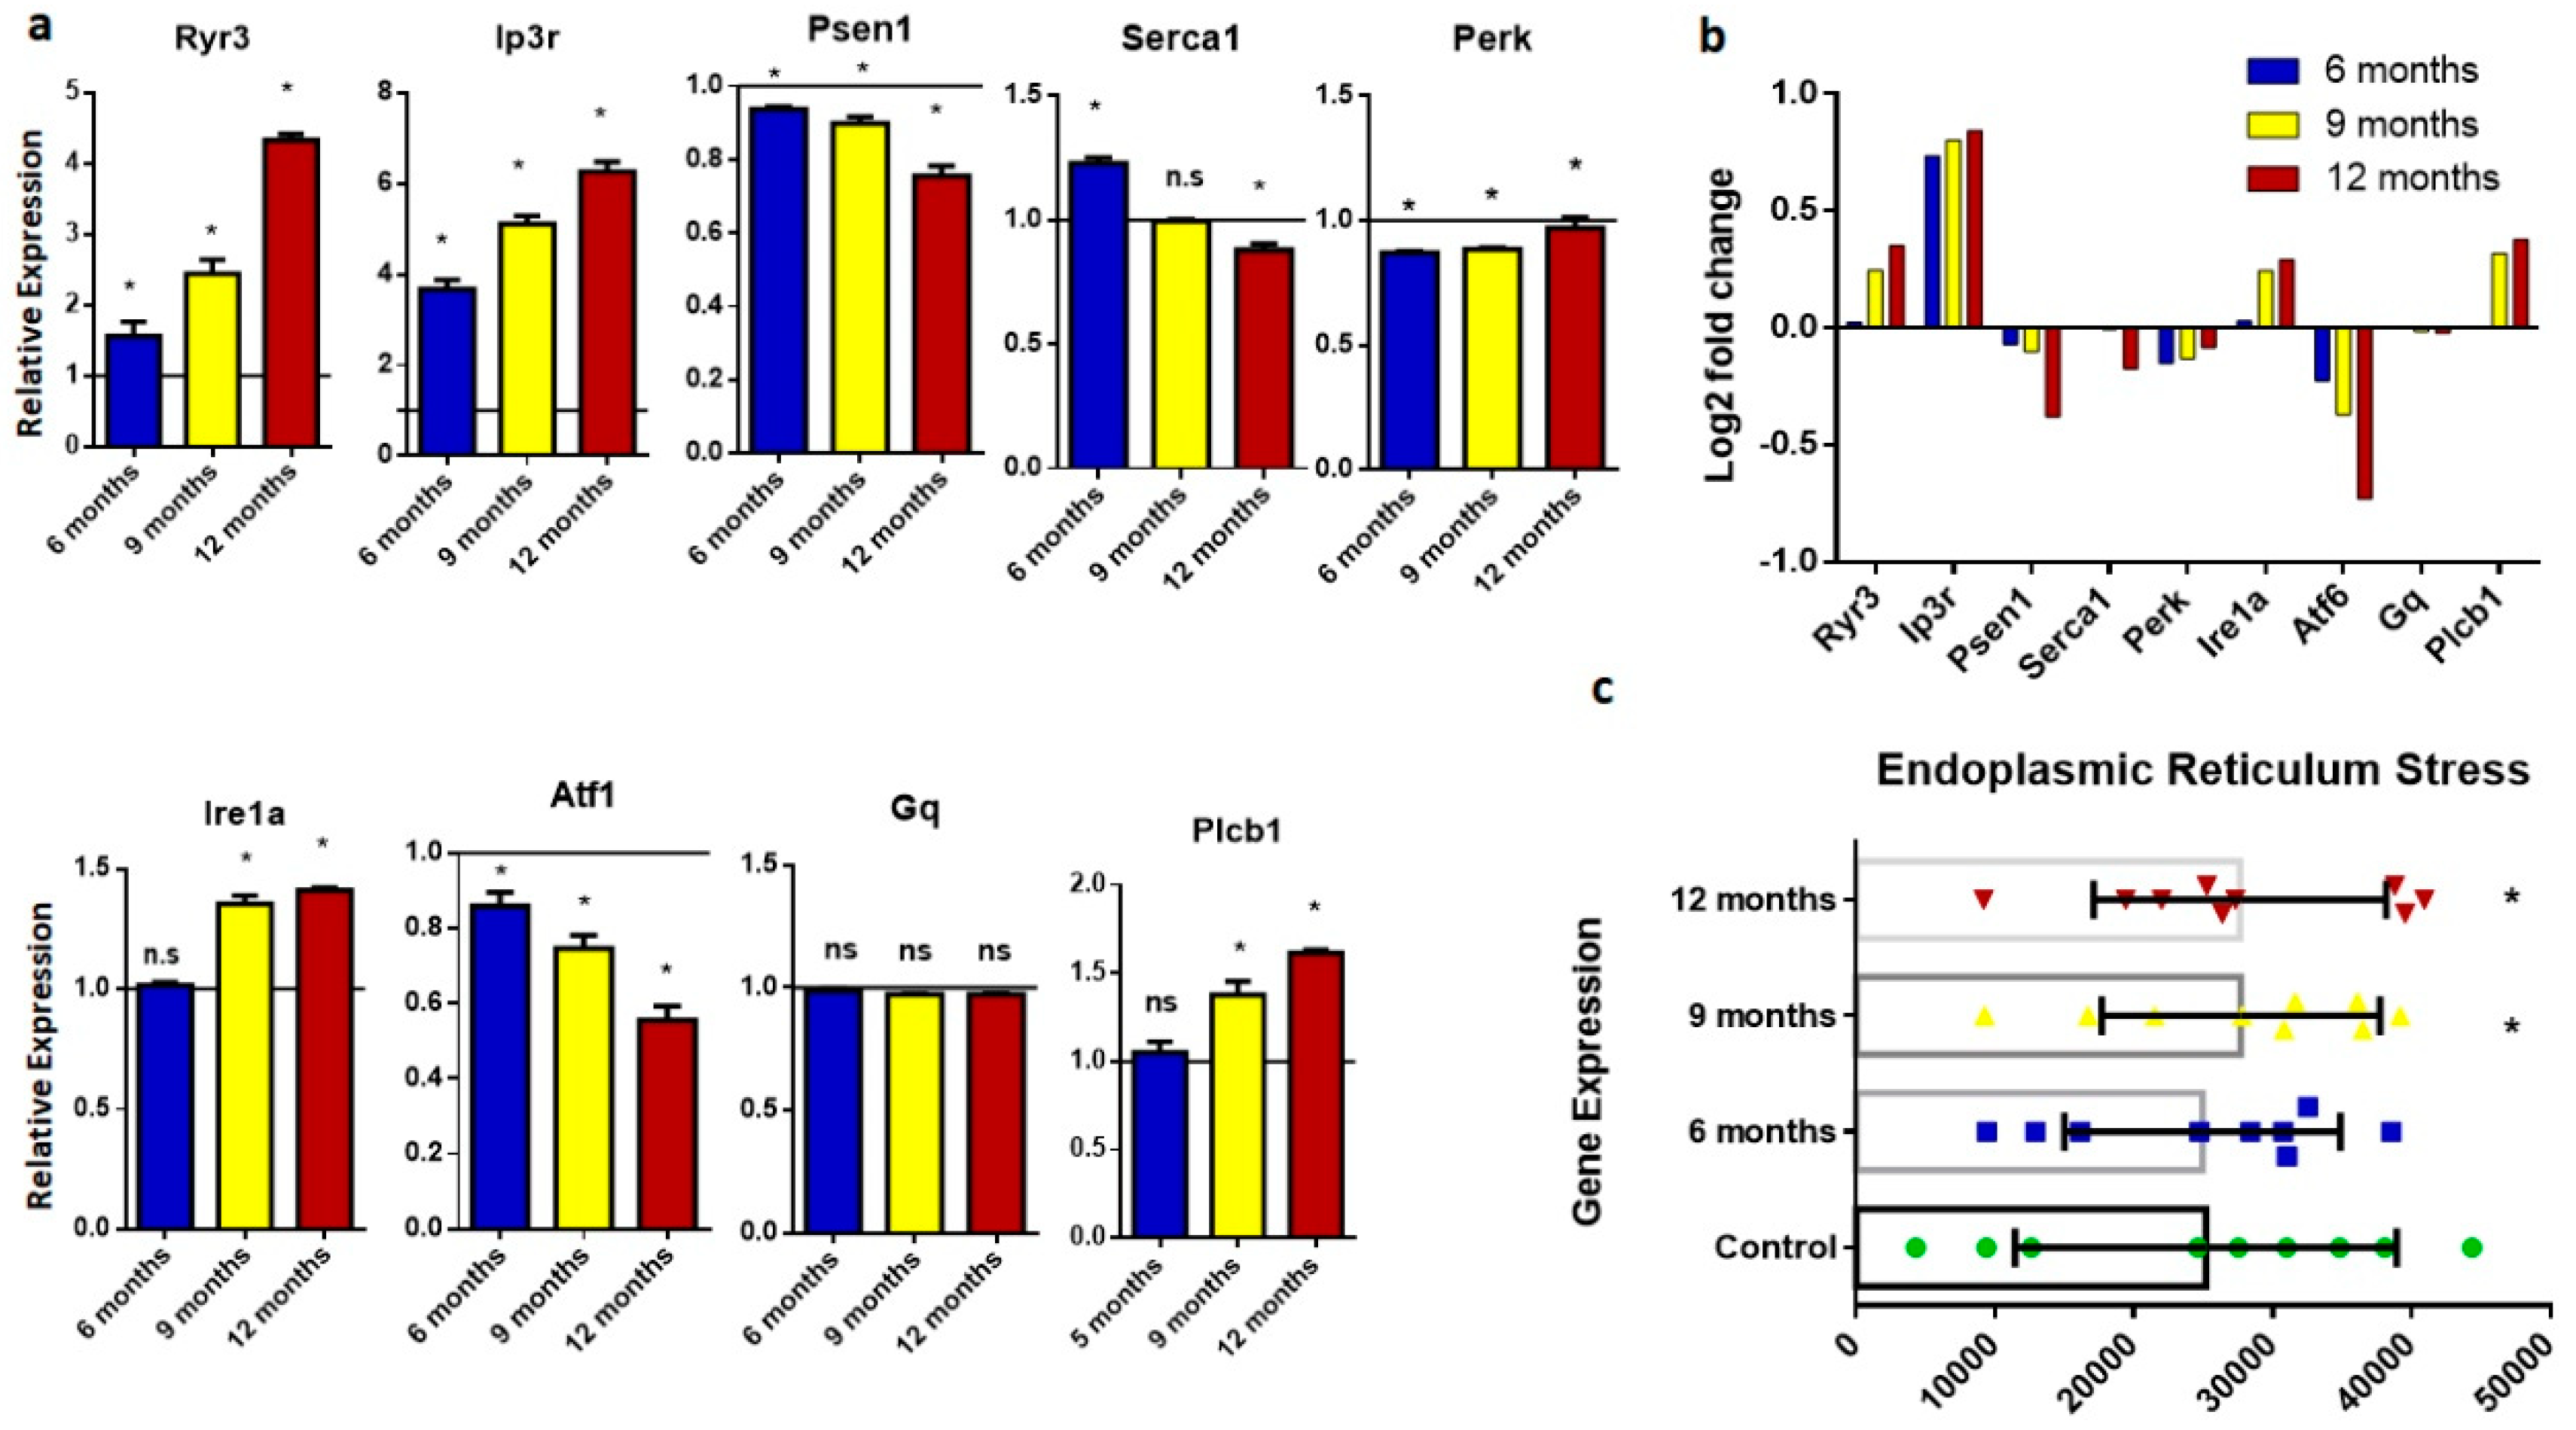
2.3. Endoplasmic Reticulum (ER) Stress
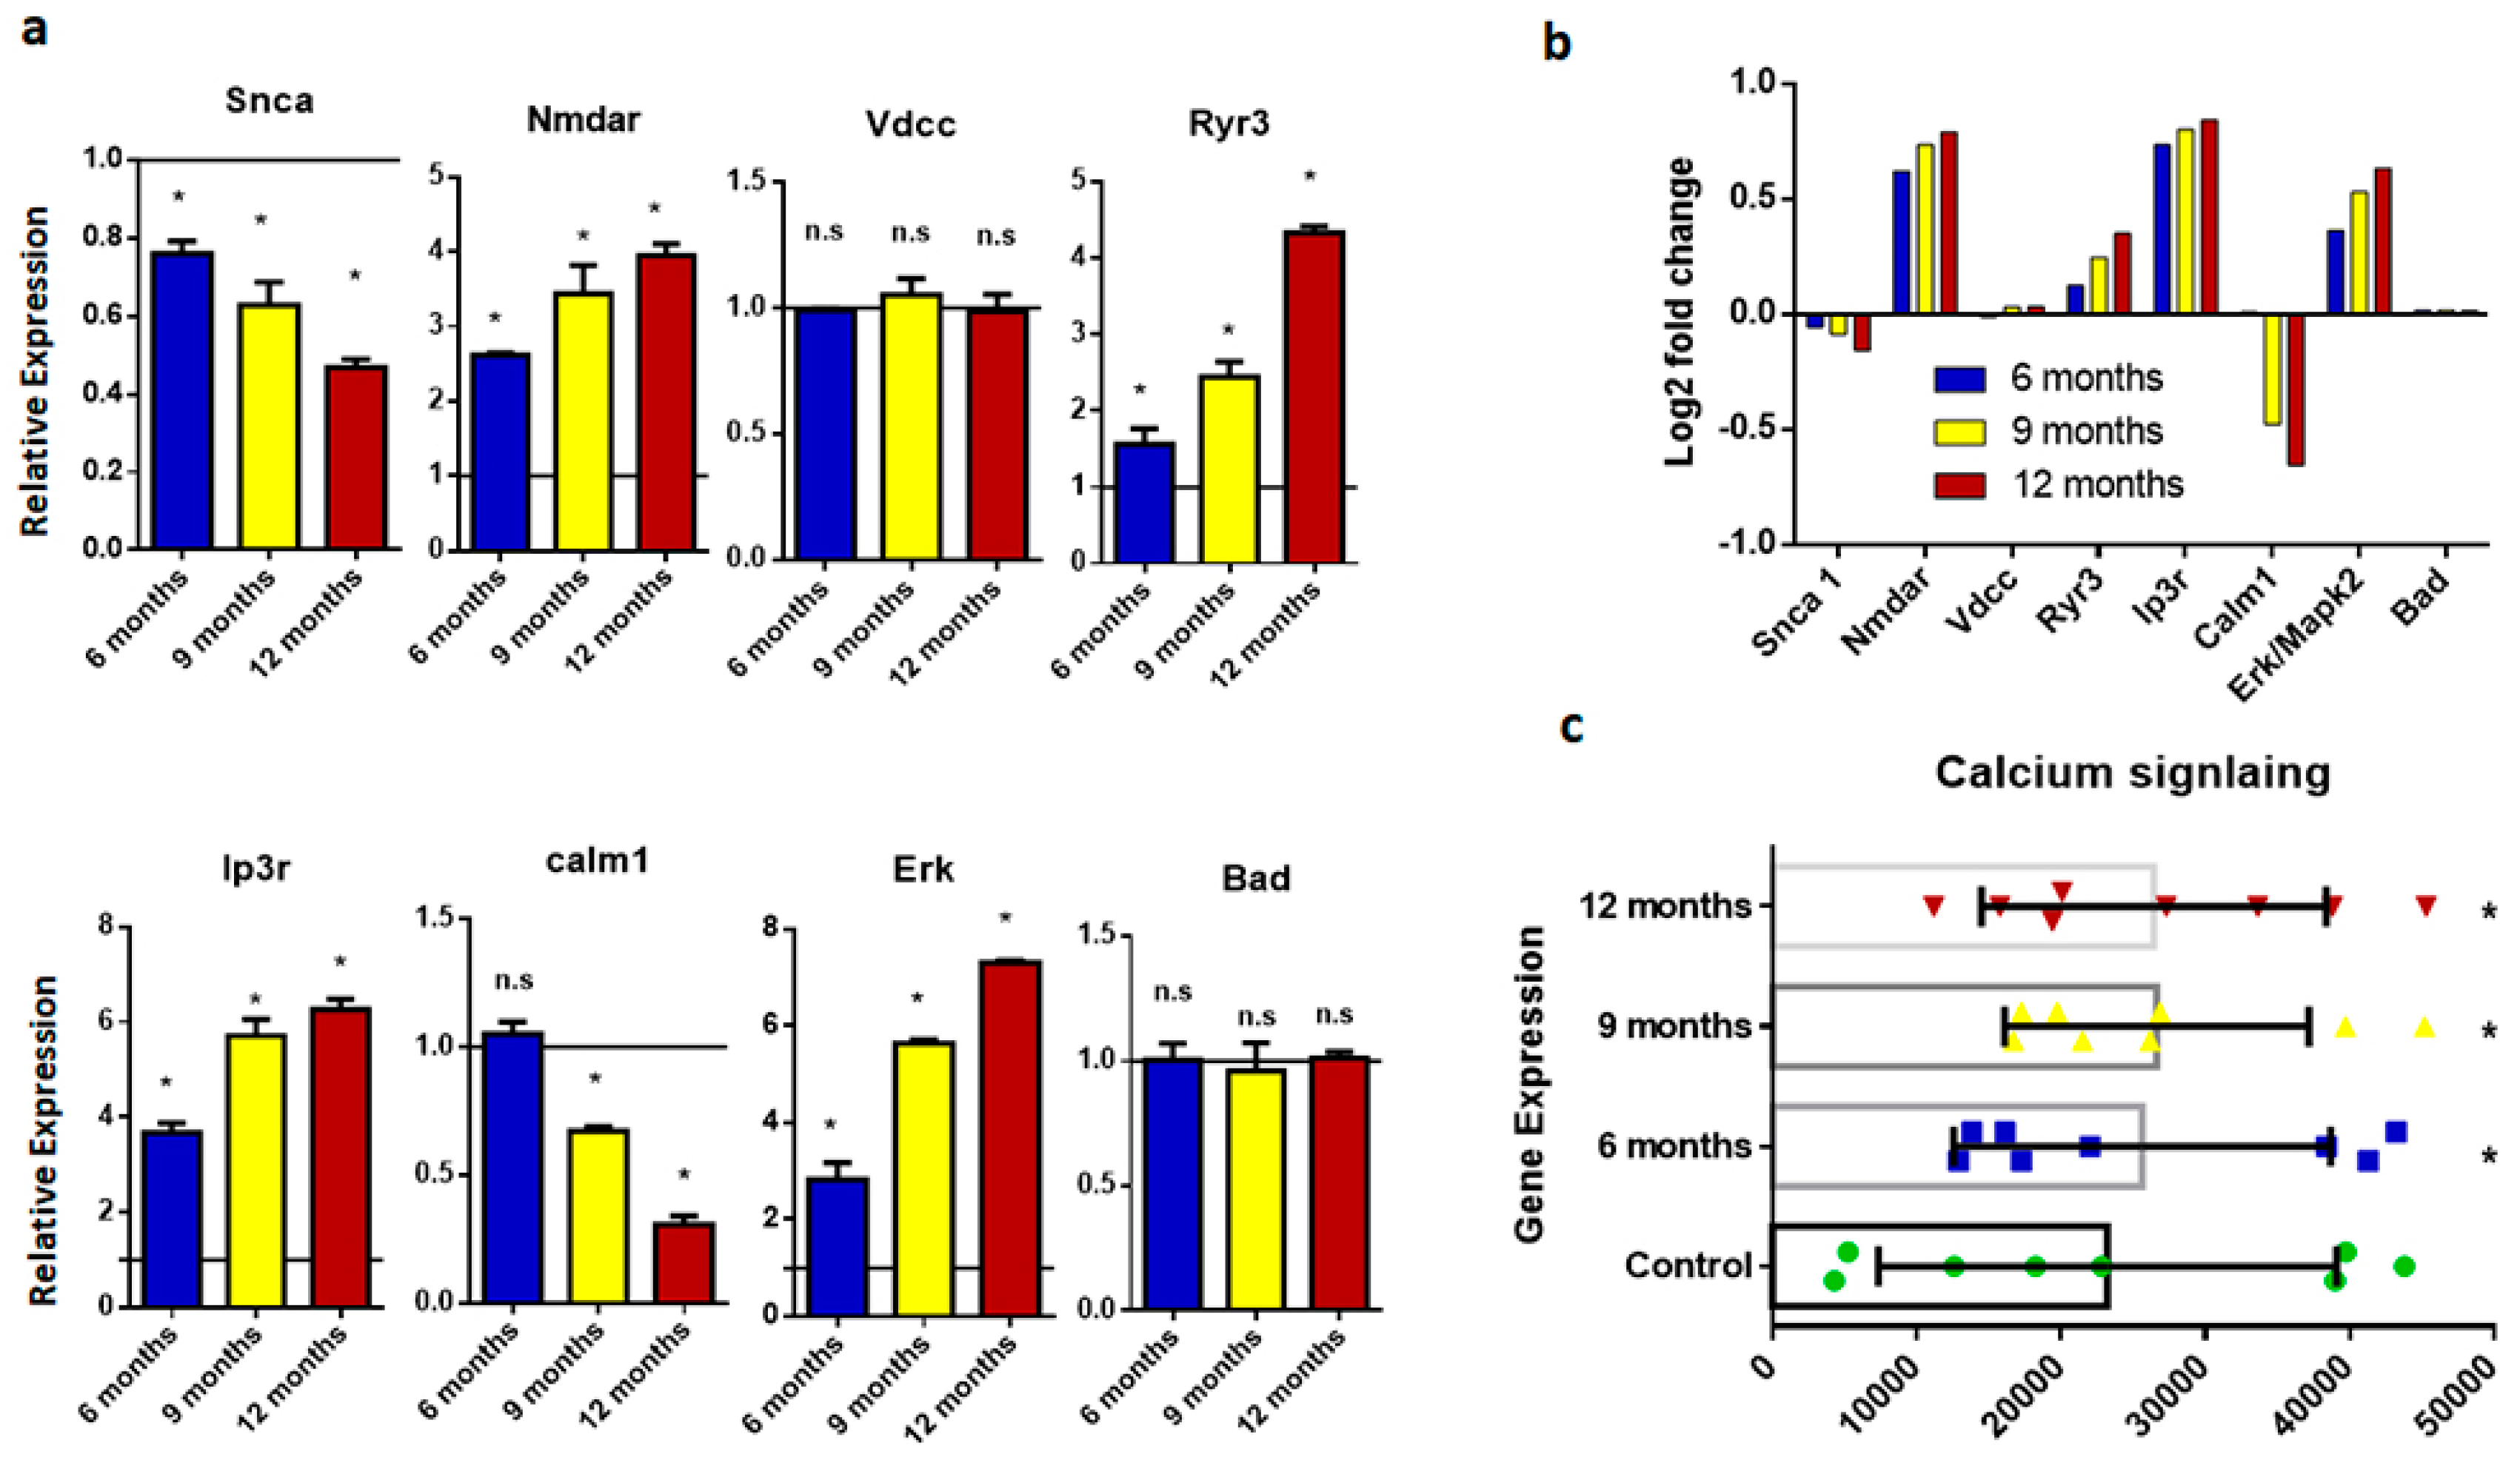
2.4. Calcium Signaling Disruption
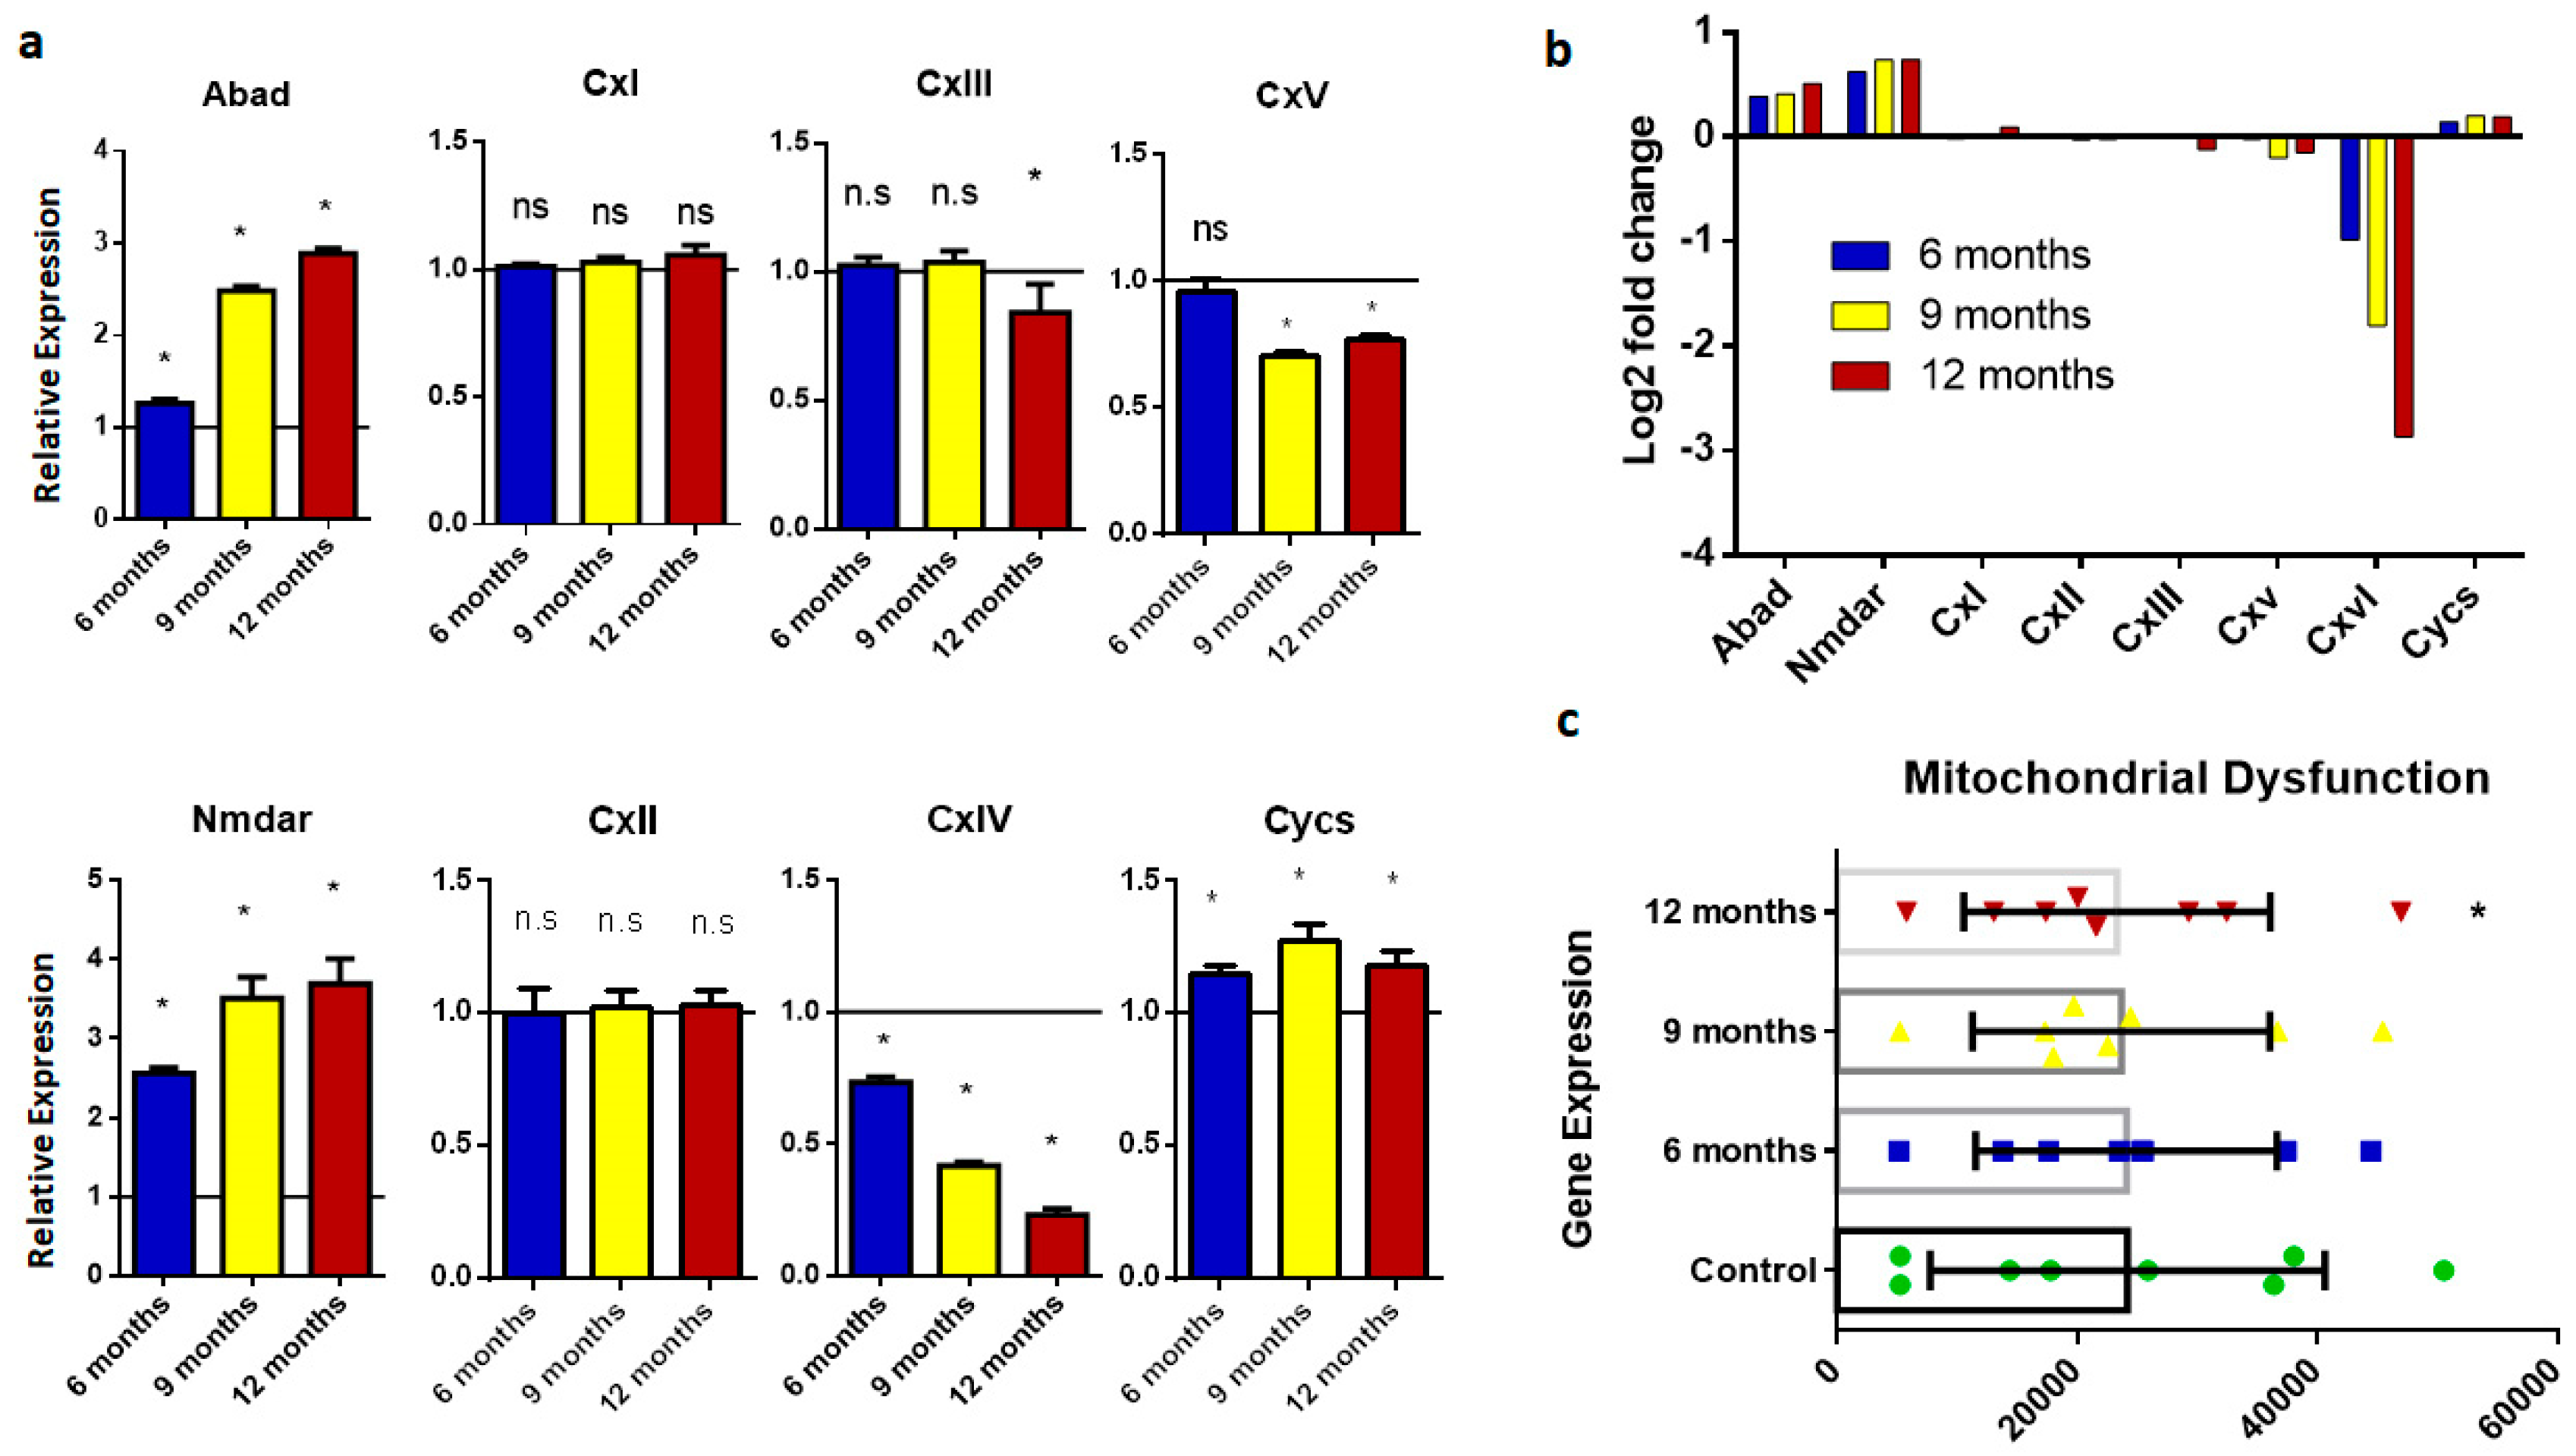
2.5. Mitochondrial Dysfunction
2.6. Inflammation and Apoptosis
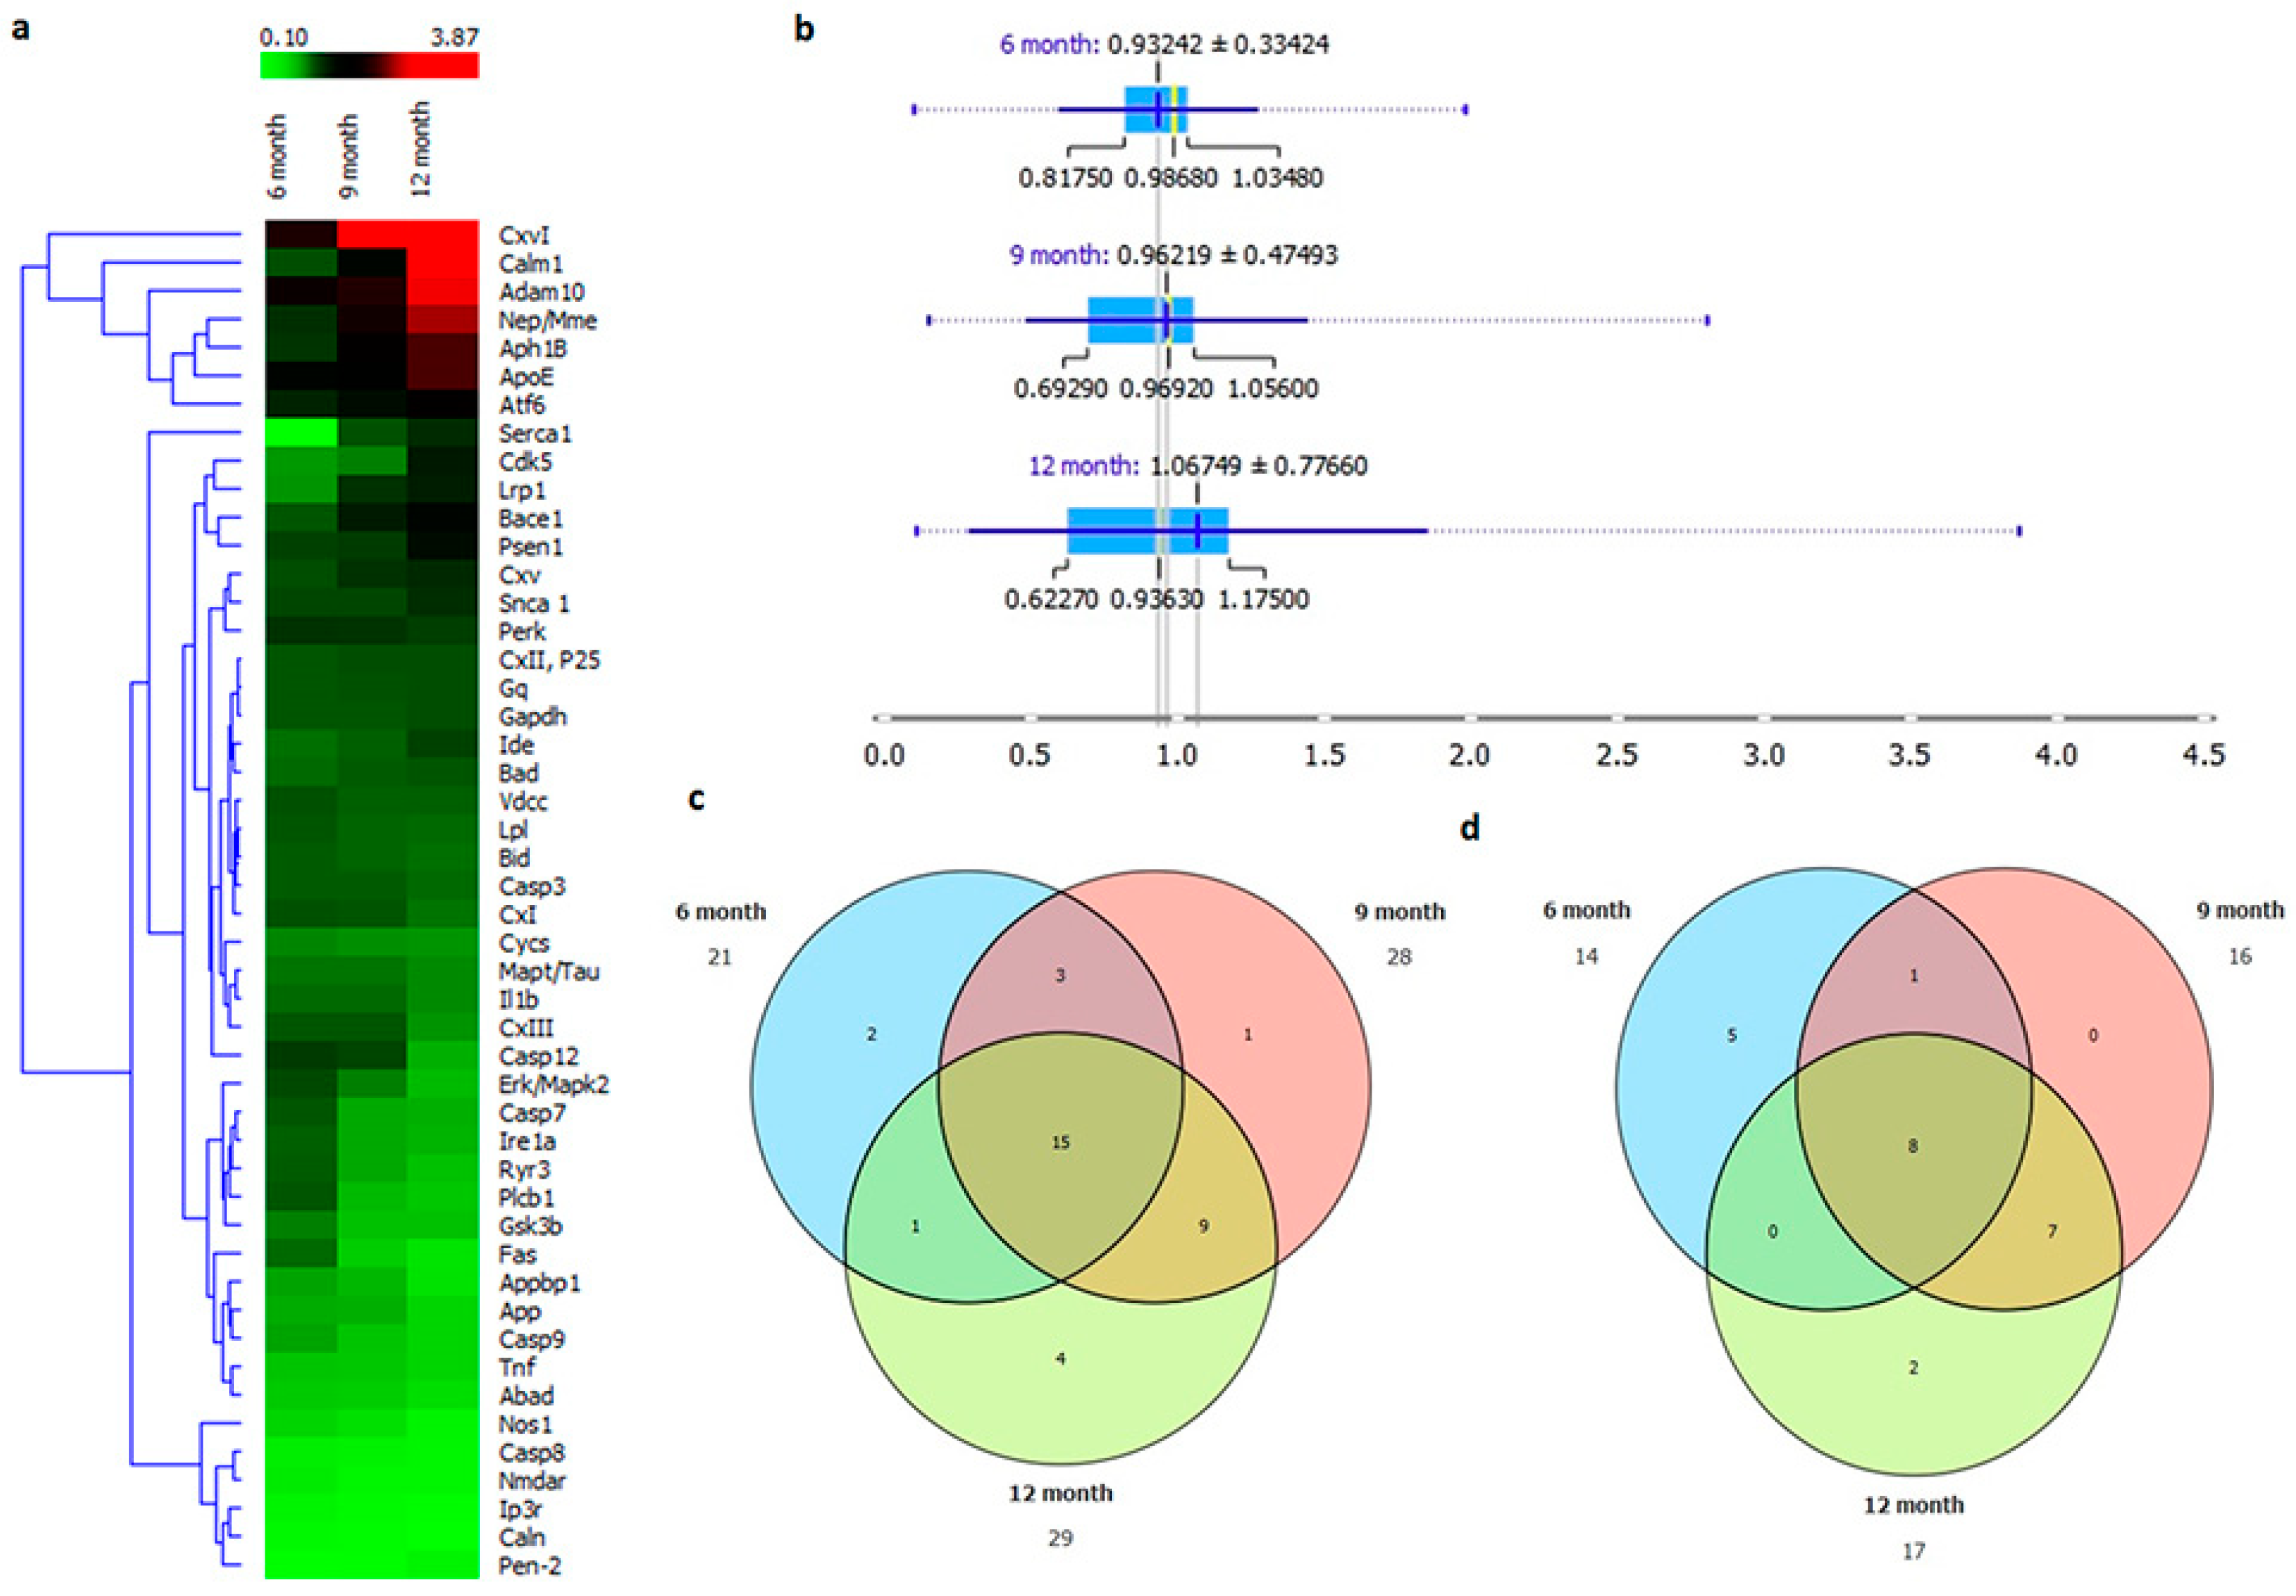
2.7. AD Onset with Age Progression
3. Discussion
4. Materials and Methods
4.1. Animals
4.2. RNA Isolation and cDNA Synthesis
4.3. Gene-Expression Analysis
4.4. Statistics and Analysis
5. Conclusions
Supplementary Materials
Author Contributions
Funding
Conflicts of Interest
References
- Masters, C.L.; Bateman, R.; Blennow, K.; Rowe, C.C.; Sperling, R.A.; Cummings, J.L. Alzheimer’s disease. Nat. Rev. Dis. Primers 2015, 1, 15056. [Google Scholar] [CrossRef] [PubMed]
- Yan, S.D.; Schmidt, A.M.; Stern, D. Alzheimer’s disease: Inside, outside, upside down. Biochem. Soc. Symp. 2001, 67, 15–22. [Google Scholar] [CrossRef]
- Lloret, A.; Fuchsberger, T.; Giraldo, E.; Vina, J. Molecular mechanisms linking amyloid beta toxicity and Tau hyperphosphorylation in Alzheimers disease. Free Radic. Biol. Med. 2015, 83, 186–191. [Google Scholar] [CrossRef] [PubMed]
- Cummings, J. Lessons Learned from Alzheimer Disease: Clinical Trials with Negative Outcomes. Clin. Transl. Sci. 2017. [Google Scholar] [CrossRef] [PubMed]
- Patel, M. Alzheimer disease: Revising the risk of Alzheimer disease in women. Nat. Rev. Neurol. 2017. [Google Scholar] [CrossRef] [PubMed]
- Australian Bureau of Statistics. Causes of Death. Available online: http://www.abs.gov.au/ausstats/abs@.nsf/Lookup/by%20Subject/3303.0~2014~Main%20Features~Dementia,%20including%20Alzheimer%20disease%20(F01,%20F03,%20G30)~10040 (accessed on 12 June 2018).
- Wang, J.; Gu, B.J.; Masters, C.L.; Wang, Y.J. A systemic view of Alzheimer disease—Insights from amyloid-beta metabolism beyond the brain. Nat. Rev. Neurol. 2017, 13, 612–623. [Google Scholar] [CrossRef] [PubMed]
- Bekris, L.M.; Galloway, N.M.; Millard, S.; Lockhart, D.; Li, G.; Galasko, D.R.; Farlow, M.R.; Clark, C.M.; Quinn, J.F.; Kaye, J.A.; et al. Amyloid precursor protein (APP) processing genes and cerebrospinal fluid APP cleavage product levels in Alzheimer’s disease. Neurobiol. Aging 2011, 32, 556.e513–556.e523. [Google Scholar] [CrossRef] [PubMed]
- Aguera-Ortiz, L.; Frank-Garcia, A.; Gil, P.; Moreno, A.; Group, E.S. Clinical progression of moderate-to-severe Alzheimer’s disease and caregiver burden: A 12-month multicenter prospective observational study. Int. Psychogeriatr. 2010, 22, 1265–1279. [Google Scholar] [CrossRef] [PubMed]
- Herman, L.; Atri, A.; Salloway, S. Alzheimer’s Disease in Primary Care: The Significance of Early Detection, Diagnosis, and Intervention. Am. J. Med. 2017, 130, 756. [Google Scholar] [CrossRef] [PubMed]
- Min, J.; Moon, W.J.; Jeon, J.Y.; Choi, J.W.; Moon, Y.S.; Han, S.H. Diagnostic Efficacy of Structural MRI in Patients with Mild-to-Moderate Alzheimer Disease: Automated Volumetric Assessment Versus Visual Assessment. AJR Am. J. Roentgenol. 2017, 208, 617–623. [Google Scholar] [CrossRef] [PubMed]
- Chetelat, G. Neuroimaging Alzheimer’s disease: Early diagnosis, monitoring, and mechanism understanding. Med. Sci. 2011, 27, 193–198. [Google Scholar] [CrossRef]
- Laboratories, K. Alzheimer’s Disease—Homo Sapiens (Human). Available online: http://www.genome.jp/kegg-bin/show_pathway?hsa05010 (accessed on 23 January 2018).
- Wegmann, S.; Bennett, R.E.; Amaral, A.S.; Hyman, B.T. Studying tau protein propagation and pathology in the mouse brain using adeno-associated viruses. Methods Cell Biol. 2017, 141, 307–322. [Google Scholar] [CrossRef] [PubMed]
- Li, J.Q.; Yu, J.T.; Jiang, T.; Tan, L. Endoplasmic reticulum dysfunction in Alzheimer’s disease. Mol. Neurobiol. 2015, 51, 383–395. [Google Scholar] [CrossRef] [PubMed]
- Berridge, M.J. Calcium signalling and Alzheimer’s disease. Neurochem. Res. 2011, 36, 1149–1156. [Google Scholar] [CrossRef] [PubMed]
- Yuan, X.Z.; Sun, S.; Tan, C.C.; Yu, J.T.; Tan, L. The Role of ADAM10 in Alzheimer’s Disease. J. Alzheimers Dis. 2017, 58, 303–322. [Google Scholar] [CrossRef] [PubMed]
- Lee, L.C.; Goh, M.Q.L.; Koo, E.H. Transcriptional regulation of APP by apoE: To boldly go where no isoform has gone before: ApoE, APP transcription and AD: Hypothesised mechanisms and existing knowledge gaps. Bioessays 2017, 39. [Google Scholar] [CrossRef] [PubMed]
- Canudas, J.; Insua, D.; Sarasa, L.; Gonzalez-Martinez, A.; Suarez, M.L.; Santamarina, G.; Pesini, P.; Sarasa, M. Neprilysin is poorly expressed in the prefrontal cortex of aged dogs with cognitive dysfunction syndrome. Int. J. Alzheimers Dis. 2014, 2014, 483281. [Google Scholar] [CrossRef] [PubMed]
- Chen, Y.; Liu, W.; McPhie, D.L.; Hassinger, L.; Neve, R.L. APP-BP1 mediates APP-induced apoptosis and DNA synthesis and is increased in Alzheimer’s disease brain. J. Cell Biol. 2003, 163, 27–33. [Google Scholar] [CrossRef] [PubMed]
- Agostinho, P.; Lopes, J.P.; Velez, Z.; Oliveira, C.R. Overactivation of calcineurin induced by amyloid-beta and prion proteins. Neurochem. Int. 2008, 52, 1226–1233. [Google Scholar] [CrossRef] [PubMed] [Green Version]
- Seo, J.; Kritskiy, O.; Watson, L.A.; Barker, S.J.; Dey, D.; Raja, W.K.; Lin, Y.T.; Ko, T.; Cho, S.; Penney, J.; et al. Inhibition of p25/Cdk5 attenuates tauopathy in mouse and iPSC models of frontotemporal dementia. J. Neurosci. 2017. [Google Scholar] [CrossRef] [PubMed]
- Zhou, X.; Huang, J.; Pan, S.; Xu, M.; He, R.; Ji, Z.; Hu, Y. Neurodegeneration-Like Pathological and Behavioral Changes in an AAV9-Mediated p25 Overexpression Mouse Model. J. Alzheimers Dis. 2016, 53, 843–855. [Google Scholar] [CrossRef] [PubMed]
- Wang, Y.; Veremeyko, T.; Wong, A.H.; El Fatimy, R.; Wei, Z.; Cai, W.; Krichevsky, A.M. Downregulation of miR-132/212 impairs S-nitrosylation balance and induces tau phosphorylation in Alzheimer’s disease. Neurobiol. Aging 2017, 51, 156–166. [Google Scholar] [CrossRef] [PubMed]
- Miszczuk, D.; Debski, K.J.; Tanila, H.; Lukasiuk, K.; Pitkanen, A. Traumatic Brain Injury Increases the Expression of Nos1, Abeta Clearance, and Epileptogenesis in APP/PS1 Mouse Model of Alzheimer’s Disease. Mol. Neurobiol. 2016, 53, 7010–7027. [Google Scholar] [CrossRef] [PubMed]
- Hernandez, F.; Lucas, J.J.; Avila, J. GSK3 and tau: Two convergence points in Alzheimer’s disease. J. Alzheimers Dis. 2013, 33 (Suppl. 1), S141–S144. [Google Scholar] [CrossRef] [PubMed]
- Maqbool, M.; Hoda, N. GSK3 inhibitors in the therapeutic development of diabetes, cancer and Neurodegeneration: Past, present and future. Curr. Pharm. Des. 2017. [Google Scholar] [CrossRef] [PubMed]
- Foster, T.C.; Kyritsopoulos, C.; Kumar, A. Central role for NMDA receptors in redox mediated impairment of synaptic function during aging and Alzheimer’s disease. Behav. Brain Res. 2017, 322, 223–232. [Google Scholar] [CrossRef] [PubMed]
- Lin, C.H.; Huang, Y.J.; Lin, C.J.; Lane, H.Y.; Tsai, G.E. NMDA neurotransmission dysfunction in mild cognitive impairment and Alzheimer’s disease. Curr. Pharm. Des. 2014, 20, 5169–5179. [Google Scholar] [CrossRef] [PubMed]
- Alberdi, E.; Sanchez-Gomez, M.V.; Cavaliere, F.; Perez-Samartin, A.; Zugaza, J.L.; Trullas, R.; Domercq, M.; Matute, C. Amyloid beta oligomers induce Ca2+ dysregulation and neuronal death through activation of ionotropic glutamate receptors. Cell Calcium 2010, 47, 264–272. [Google Scholar] [CrossRef] [PubMed]
- Pchitskaya, E.; Popugaeva, E.; Bezprozvanny, I. Calcium signaling and molecular mechanisms underlying neurodegenerative diseases. Cell Calcium 2017. [Google Scholar] [CrossRef] [PubMed]
- Bojarski, L.; Herms, J.; Kuznicki, J. Calcium dysregulation in Alzheimer’s disease. Neurochem. Int. 2008, 52, 621–633. [Google Scholar] [CrossRef] [PubMed]
- Briggs, C.A.; Chakroborty, S.; Stutzmann, G.E. Emerging pathways driving early synaptic pathology in Alzheimer’s disease. Biochem. Biophys. Res. Commun. 2017, 483, 988–997. [Google Scholar] [CrossRef] [PubMed]
- Corbacho, I.; Berrocal, M.; Torok, K.; Mata, A.M.; Gutierrez-Merino, C. High affinity binding of amyloid beta-peptide to calmodulin: Structural and functional implications. Biochem. Biophys. Res. Commun. 2017, 486, 992–997. [Google Scholar] [CrossRef] [PubMed]
- Shetty, M.S.; Sajikumar, S. Differential involvement of Ca2+/calmodulin-dependent protein kinases and mitogen-activated protein kinases in the dopamine D1/D5 receptor-mediated potentiation in hippocampal CA1 pyramidal neurons. Neurobiol. Learn. Mem. 2017, 138, 111–120. [Google Scholar] [CrossRef] [PubMed] [Green Version]
- Briggs, D.I.; Defensor, E.; Memar Ardestani, P.; Yi, B.; Halpain, M.; Seabrook, G.; Shamloo, M. Role of Endoplasmic Reticulum Stress in Learning and Memory Impairment and Alzheimer’s Disease-Like Neuropathology in the PS19 and APPSwe Mouse Models of Tauopathy and Amyloidosis. eNeuro 2017, 4. [Google Scholar] [CrossRef] [PubMed]
- Zatyka, M.; Da Silva Xavier, G.; Bellomo, E.A.; Leadbeater, W.; Astuti, D.; Smith, J.; Michelangeli, F.; Rutter, G.A.; Barrett, T.G. Sarco(endo)plasmic reticulum ATPase is a molecular partner of Wolfram syndrome 1 protein, which negatively regulates its expression. Hum. Mol. Genet. 2015, 24, 814–827. [Google Scholar] [CrossRef] [PubMed]
- Pottorf, W.J.; Duckles, S.P.; Buchholz, J.N. SERCA function declines with age in adrenergic nerves from the superior cervical ganglion. J. Auton. Pharmacol. 2000, 20, 281–290. [Google Scholar] [CrossRef] [PubMed]
- Halliday, M.; Hughes, D.; Mallucci, G.R. Fine-tuning PERK signaling for neuroprotection. J. Neurochem. 2017. [Google Scholar] [CrossRef] [PubMed]
- Bell, M.C.; Meier, S.E.; Ingram, A.L.; Abisambra, J.F. PERK-opathies: An Endoplasmic Reticulum Stress Mechanism Underlying Neurodegeneration. Curr. Alzheimer Res. 2016, 13, 150–163. [Google Scholar] [CrossRef] [PubMed]
- Lustbader, J.W.; Cirilli, M.; Lin, C.; Xu, H.W.; Takuma, K.; Wang, N.; Caspersen, C.; Chen, X.; Pollak, S.; Chaney, M.; et al. ABAD directly links Abeta to mitochondrial toxicity in Alzheimer’s disease. Science 2004, 304, 448–452. [Google Scholar] [CrossRef] [PubMed]
- Onyango, I.G.; Khan, S.M.; Bennett, J.P., Jr. Mitochondria in the pathophysiology of Alzheimer’s and Parkinson’s diseases. Front. Biosci. (Landmark Ed.) 2017, 22, 854–872. [Google Scholar] [CrossRef] [PubMed]
- Abid, N.B.; Yoon, G.; Kim, M.O. Molecular Cloning and Expression of Osmotin in a Baculovirus-Insect System: Purified Osmotin Mitigates Amyloid-beta Deposition in Neuronal Cells. Sci. Rep. 2017, 7, 8147. [Google Scholar] [CrossRef] [PubMed]
- Shah, S.A.; Yoon, G.H.; Chung, S.S.; Abid, M.N.; Kim, T.H.; Lee, H.Y.; Kim, M.O. Novel osmotin inhibits SREBP2 via the AdipoR1/AMPK/SIRT1 pathway to improve Alzheimer’s disease neuropathological deficits. Mol. Psychiatry 2017, 22, 407–416. [Google Scholar] [CrossRef] [PubMed]
- Badshah, H.; Ali, T.; Kim, M.O. Osmotin attenuates LPS-induced neuroinflammation and memory impairments via the TLR4/NFkappaB signaling pathway. Sci. Rep. 2016, 6, 24493. [Google Scholar] [CrossRef] [PubMed]
- Naseer, M.I.; Ullah, I.; Narasimhan, M.L.; Lee, H.Y.; Bressan, R.A.; Yoon, G.H.; Yun, D.J.; Kim, M.O. Neuroprotective effect of osmotin against ethanol-induced apoptotic neurodegeneration in the developing rat brain. Cell Death Dis. 2014, 5, e1150. [Google Scholar] [CrossRef] [PubMed] [Green Version]


| Gene Name | Reverse Primer Sequence 5′ to 3′ | Forward Primer Sequence 5′ to 3′ |
|---|---|---|
| Adam10 | atcgaatcctgccatttcac | agccagagttgtgcgttttt |
| Abad | gacttccagcgggttatcaa | cagtgtcatgcccactatgc |
| Aph1B | gctgttcaggctcgcatatt | aatcaccatgaatgcccact |
| Apo-E | gtgctgttggtcacattgct | cagtgccgtcagttcttgtg |
| App | ggccctcgagaattacatca | gttcatgcgctcgtagatca |
| Atf6 | ggccagactgttttgctctc | cccatacttctggtggcact |
| Serca1 | tggccgatgataacttctcc | gagcccatcagtcaccaagt |
| Bace1 | tttgtggagatggtggacaa | tacacaccctttcggaggtc |
| Bad | gggatggaggaggagcttag | cccaccaggactggataatg |
| Bid | tcacagacctgctggtgttc | gtctggcaatgttgtggatg |
| Vdcc | cgttctcatcctgctcaaca | tatgctcccaatgacgatga |
| Calm1 | actgggtcagaacccaacag | gttctgccgcactgatgtaa |
| Caln | cagagggtgcttcgattctc | aaggcccacaaatacagcac |
| Casp12 | ttcccaggaacagctgagtt | tcacgtggacaaagcttcag |
| Casp3 | tgtcatctcgctctggtacg | tcccataaatgaccccttca |
| Casp7 | tttgcttactccacggttcc | cacgggatctgcttcttctc |
| Casp8 | ggcctccatctatgacctga | gcagaaagtctgcctcatcc |
| Casp9 | aagaccatggctttgaggtg | aagtccctttcgcagaaaca |
| Cdk5 | gtccatcgacatgtggtcag | acgacgttcaccaaggatgt |
| P25 | cgtccactagtgagctgctg | cccacctcagaggagatgac |
| Cxi | ctctccccagtaccctcgac | gggagtgggcctgaaattag |
| Cxii | cctttgggaaccacagctaa | tcaaagttcccaggaagcag |
| Cxiii | gttcgcagtcatagccacag | tagggccgcgataataaatg |
| Cxiv | gtgtccccactgatgaggag | cagccaaaaccagatgacag |
| Cxv | gaaactggaccaggtggaga | gataccctgggtgttgccta |
| Cycs | gggaggcaagcataagactg | tctgccctttctcccttctt |
| Perk | tggtgactgctatggaccaa | gttccatctgggtgctgaat |
| Fadd | acaatgtggggagagactgg | aggtcagccaccagattcag |
| Fas | ttgcaagacatgtcggaaag | cctgcatggcagttacacac |
| Appbp1 | gcagccagggaagatactca | tcttctccgctgaccagatt |
| Gapdh | aagggctcatgaccacagtc | acacattgggggtaggaaca |
| Gq | cacgctcaagatcccataca | ggctacacggtccaagtcat |
| Nmdar | cagcaggactggtcacagaa | tttgttccccaagagtttgc |
| Gsk3b | gaggagagcccaatgtttca | aatttgctcccttgttggtg |
| Ide | gaggcgttccaaaaacacat | gacagccaacatttcctggt |
| Il1b | gaccttccaggatgaggaca | tccattgaggtggagagctt |
| Ip3r | gaatttccttcgttgccaaa | cgatgcagttctggttctca |
| Ire1a | cccaaatgtgatccgctact | agaatgttgtggggcttcag |
| Lpl | ttttctgggactgaggatgg | gtcaggccagctgaagtagg |
| Lrp1 | gacagcaaacgaggcctaag | acaggggttggtcacttcag |
| Erk | tccttttgagcaccagacct | agcagatgtggtcattgctg |
| Mapt | gtggccaggtggaagtaaaa | gtggagatgtgtccccagac |
| Ncstn | ctgaccactctggctccttc | gctgctgaagttggttcctc |
| Nep | aggcggacaacctctactca | cgaggctggtcaaaatgaat |
| Nos1 | agcacctaccagctcaagga | atagtgatggccgacctgag |
| Plcb1 | catccaggaggtggttcagt | ccctttcatggcttcctgta |
| Psen1 | cctcatggccctggtattta | tcagccatattcaccaacca |
| Pen-2 | cgggtatccaatgaggagaa | gcgagaatgatcacccagaa |
| Ryr3 | gtgcagcctctactcccttg | atgtcctccaccttgtctgg |
| Snca | ggagtgacaacagtggctga | caggcatgtcttccaggatt |
| Tnf | cgtcagccgatttgctatct | cggactccgcaaagtctaag |
© 2019 by the authors. Licensee MDPI, Basel, Switzerland. This article is an open access article distributed under the terms and conditions of the Creative Commons Attribution (CC BY) license (http://creativecommons.org/licenses/by/4.0/).
Share and Cite
Abid, N.B.; Naseer, M.I.; Kim, M.O. Comparative Gene-Expression Analysis of Alzheimer’s Disease Progression with Aging in Transgenic Mouse Model. Int. J. Mol. Sci. 2019, 20, 1219. https://doi.org/10.3390/ijms20051219
Abid NB, Naseer MI, Kim MO. Comparative Gene-Expression Analysis of Alzheimer’s Disease Progression with Aging in Transgenic Mouse Model. International Journal of Molecular Sciences. 2019; 20(5):1219. https://doi.org/10.3390/ijms20051219
Chicago/Turabian StyleAbid, Noman Bin, Muhammad Imran Naseer, and Myeong Ok Kim. 2019. "Comparative Gene-Expression Analysis of Alzheimer’s Disease Progression with Aging in Transgenic Mouse Model" International Journal of Molecular Sciences 20, no. 5: 1219. https://doi.org/10.3390/ijms20051219
APA StyleAbid, N. B., Naseer, M. I., & Kim, M. O. (2019). Comparative Gene-Expression Analysis of Alzheimer’s Disease Progression with Aging in Transgenic Mouse Model. International Journal of Molecular Sciences, 20(5), 1219. https://doi.org/10.3390/ijms20051219