Communication

Molecular Characterization of Non-responders to Chemotherapy in Serous Ovarian Cancer

by
Megan E. McDonald
1,
Erin A. Salinas
2,
Eric J. Devor
3,4,
Andreea M. Newtson
1,
Kristina W. Thiel
3,
Michael J. Goodheart
1,4,
David P. Bender
1,4,
Brian J. Smith
4,5,
Kimberly K. Leslie
3,4 and
Jesus Gonzalez-Bosquet
1,4,*
1
Division of Gynecologic Oncology, Department of Obstetrics and Gynecologic, University of Iowa Hospitals and Clinics, Iowa City, IA 52242, USA
2
Compass Oncology, Portland, OR 97227, USA
3
Department of Obstetrics and Gynecology, University of Iowa Hospitals and Clinics, Iowa City, IA 52242, USA
4
Holden Comprehensive Cancer Center, University of Iowa Hospitals and Clinics, Iowa City, IA 52242, USA
5
Department of biostatistics, University of Iowa College of Public Health, Iowa City, IA 52242, USA
*
Author to whom correspondence should be addressed.
Int. J. Mol. Sci. 2019, 20(5), 1175; https://doi.org/10.3390/ijms20051175
Submission received: 25 January 2019 / Revised: 2 March 2019 / Accepted: 3 March 2019 / Published: 7 March 2019
(This article belongs to the Special Issue Data Analysis and Integration in Cancer Research)

Abstract

:
Nearly one-third of patients with high-grade serous ovarian cancer (HGSC) do not respond to initial treatment with platinum-based therapy. Genomic and clinical characterization of these patients may lead to potential alternative therapies. Here, the objective is to classify non-responders into subsets using clinical and molecular features. Using patients from The Cancer Genome Atlas (TCGA) dataset with platinum-resistant or platinum-refractory HGSC, we performed a genome-wide unsupervised cluster analysis that integrated clinical data, gene copy number variations, gene somatic mutations, and DNA promoter methylation. Pathway enrichment analysis was performed for each cluster to identify the targetable processes. Following the unsupervised cluster analysis, three distinct clusters of non-responders emerged. Cluster 1 had overrepresentation of the stage IV disease and suboptimal debulking, under-expression of miRNAs and mRNAs, hypomethylated DNA, “loss of function” TP53 mutations, and the overexpression of genes in the PDGFR pathway. Cluster 2 had low miRNA expression, generalized hypermethylation, MUC17 mutations, and significant activation of the HIF-1 signaling pathway. Cluster 3 had more optimally cytoreduced stage III patients, overexpression of miRNAs, mixed methylation patterns, and “gain of function” TP53 mutations. However, the survival for all clusters was similar. Integration of genomic and clinical data from patients that do not respond to chemotherapy has identified different subgroups or clusters. Pathway analysis further identified the potential alternative therapeutic targets for each cluster.

1. Introduction

Epithelial ovarian cancer is the fifth leading cause of cancer death among women in the United States and it has the highest mortality rate of all gynecologic cancers [1]. The majority of patients present with advanced disease at diagnosis. While most of the patients respond to the initial combination treatment of surgical debulking and platinum-based chemotherapy, nearly one-third of patients will not respond. Significant effort has been expended to define platinum resistance in epithelial ovarian cancers at both the histologic and biologic levels. For instance, increased chemoresistance has been described in low grade tumors [2] and in mucinous and clear cell histologic subtypes [3,4]. Epithelial ovarian cancer patients with germline and/or somatic BRCA mutations have improved survival, which is likely due to increased sensitivity to platinum-based DNA damming chemotherapy [5]. Various mechanisms for platinum resistance have been described, both spontaneous and acquired [6,7,8,9,10], though the exact mechanism for resistance is potentially tumor-dependent.
Despite this improved understanding of platinum resistance on the molecular level, clinical outcomes remain poor for ovarian cancer patients. Recently published data from The Cancer Genome Atlas (TCGA) high-grade serous ovarian cancer (HGSC) dataset showed that responders to initial chemotherapy experience a more than two year increase in median overall survival when compared to non-responders (p < 10−14) [11]. Previous studies have used epithelial ovarian cancer patients’ serum biomarker data to predict the response to initial chemotherapy with an area under the curve (AUC) of 70–77%. When combined with clinical data, the classification capacity in these studies could increase the AUC to 91% [12,13]. However, these prediction models are limited in their clinical application due to the heterogeneity of histologic subtype and stage, as well as the lack of validation in independent datasets. In a previously published prediction model using the TCGA dataset, we identified a 34-gene signature that predicts chemosensitivity specifically in HGSC, with an AUC approaching 80%. This 34-gene signature was then validated in six independent gene expression datasets [14].
However, as our ability to predict chemo-response becomes more accurate, the lack of alternative or adjuvant therapies for patients who are predicted to fail standard first-line platinum-based therapies has become acutely apparent. Through the integration of clinical and molecular data, our objective in this pilot study was to characterize the HGSC patients that do not respond to initial chemotherapy, which would, in turn, inform the design of personalized treatment combinations.

2. Results

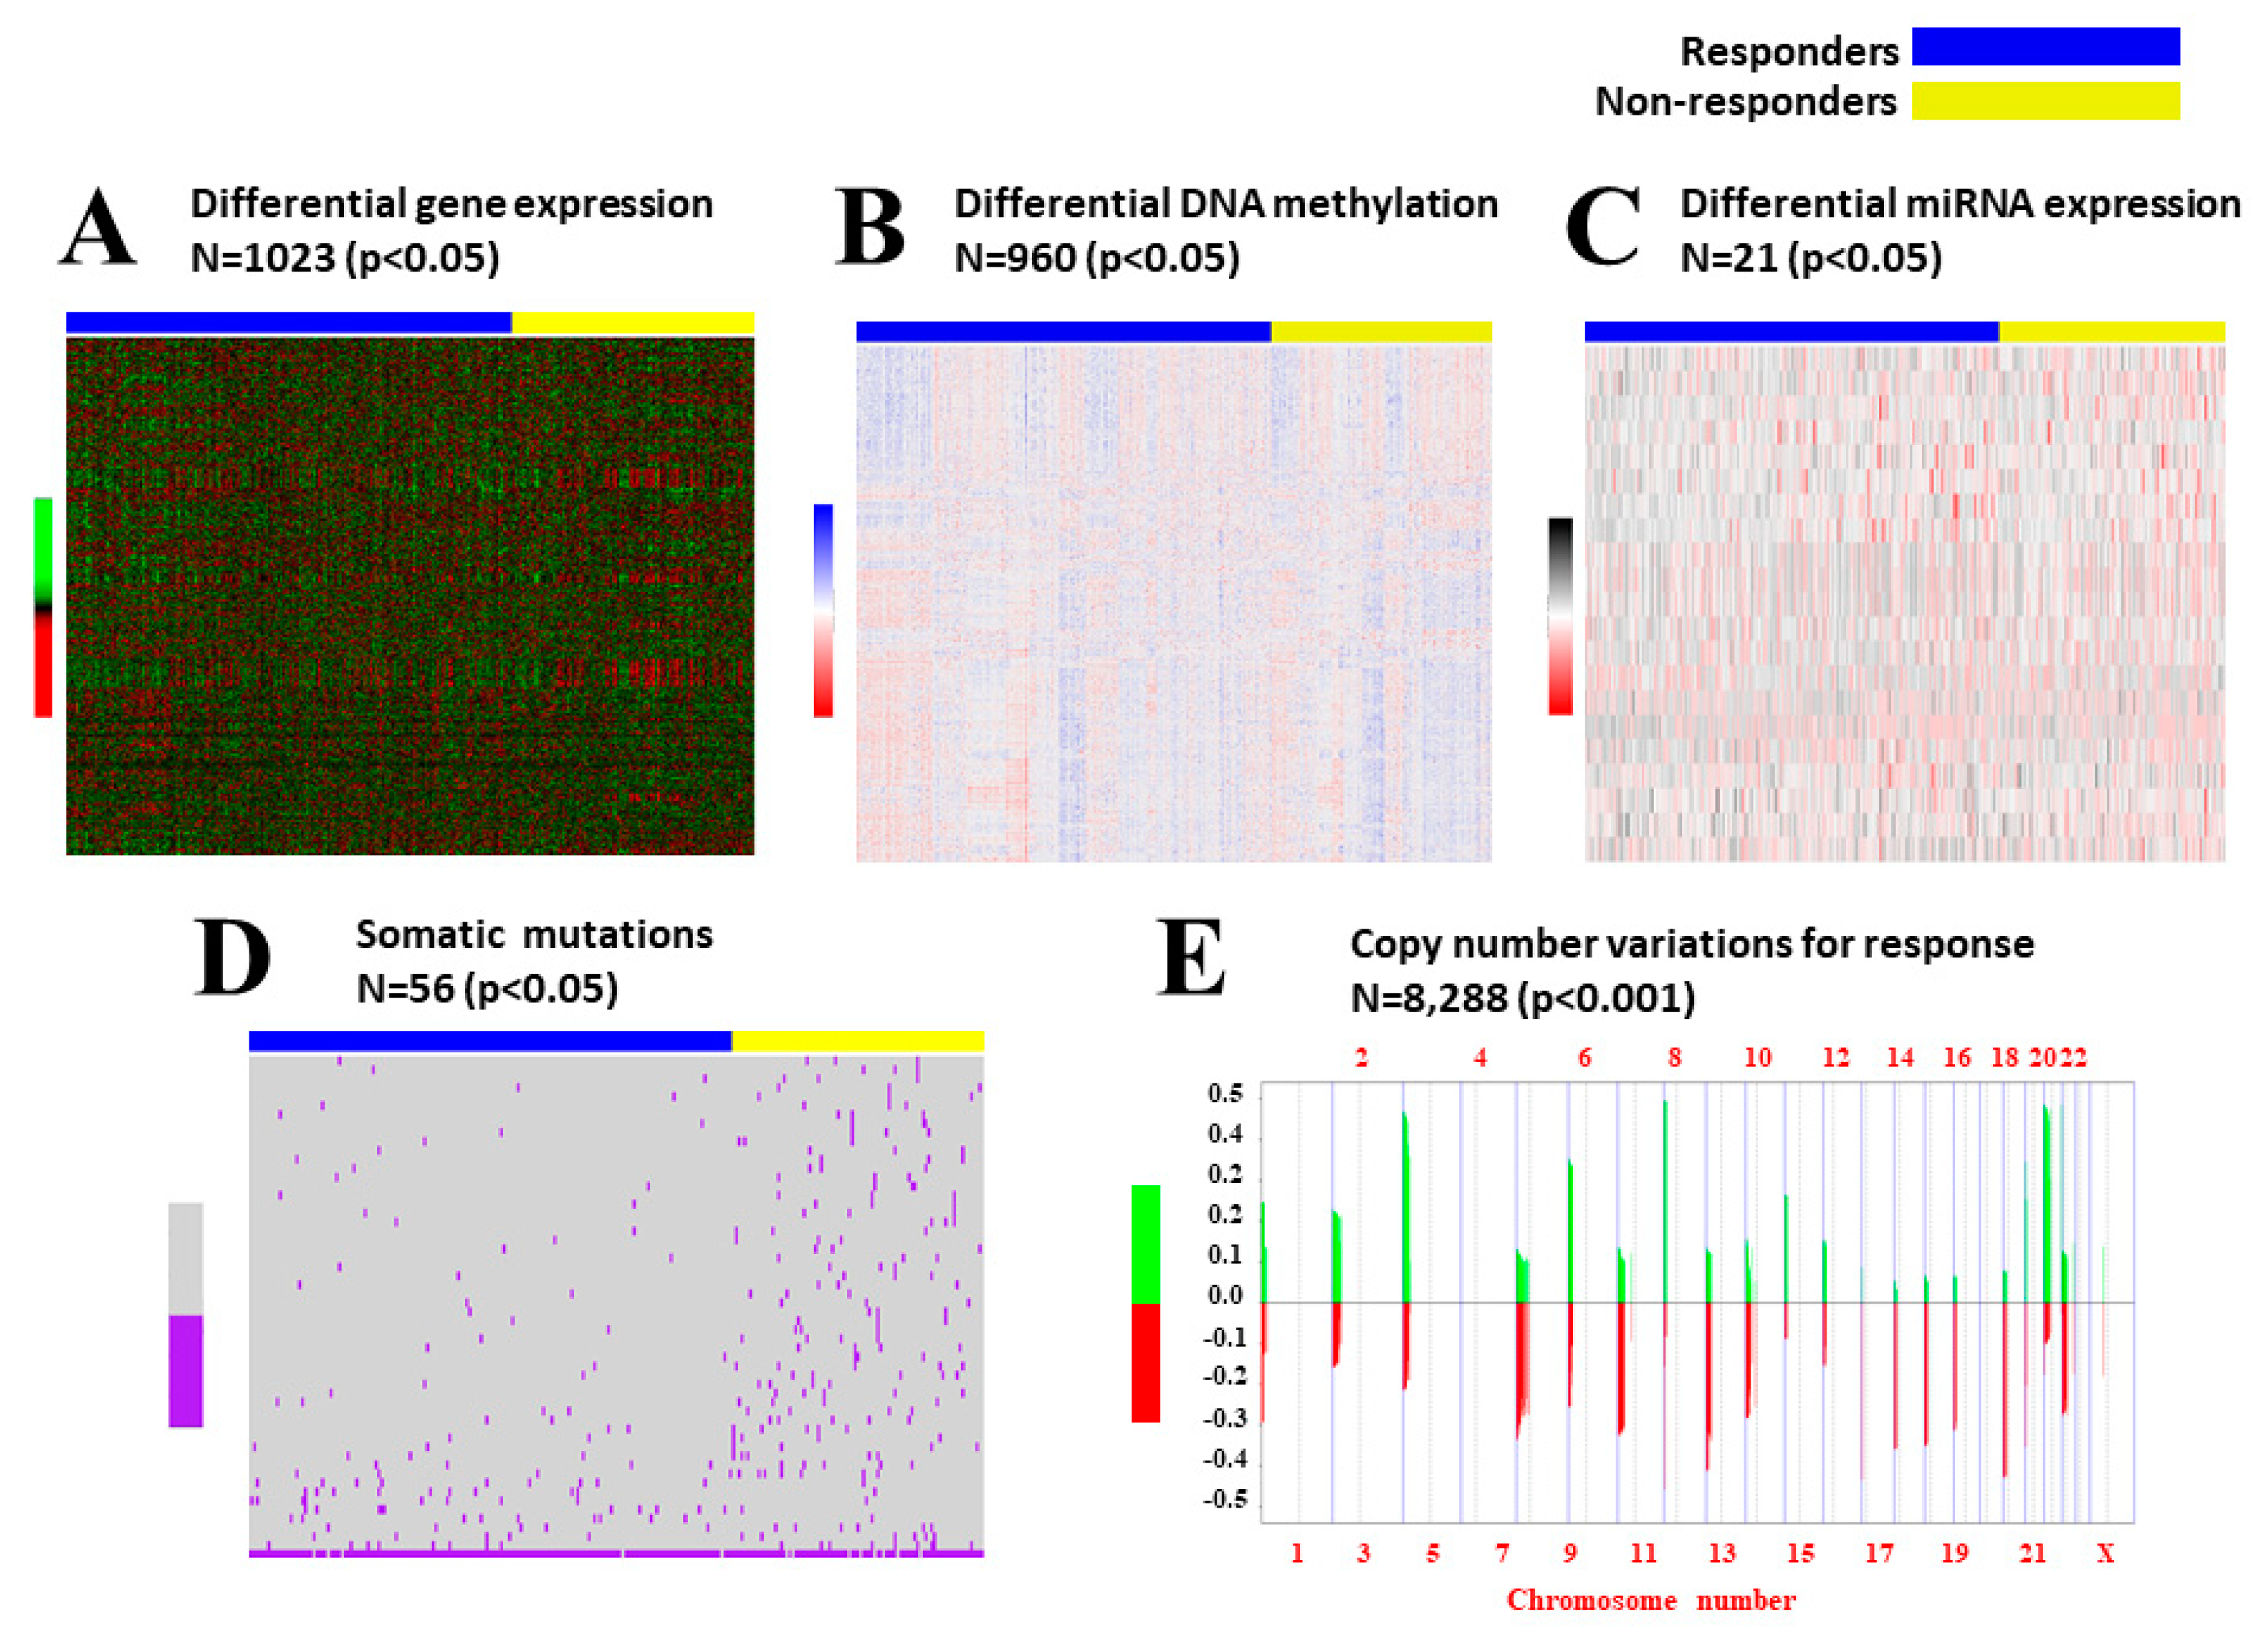
2.1. Data Preprocessing

Evaluation of clinical data revealed that non-responders were more often diagnosed at a later stage (p = 0.01) and had suboptimal surgical outcomes (p < 0.001), but there were no differences in histological grade or usage of platinum-based chemotherapy when compared with responders. In Table 1 we described clinical characteristics of all non-responders. Patients were categorized according to the clusters that they belonged following the analysis with the integrative cluster method, iClusterPlus. None of the clinical characteristics were statistically significant between the three groups, and they were therefore not accounted for in the clustering process.
Results of the univariate analyses between responder and non-responder groups for all types of biological data are represented in Figure 1. All of the significant variables between groups were used for clustering analysis: 1023 differentially expressed genes, 960 differentially methylated promoters, 21 differentially expressed miRNAs, 56 somatic mutations, and more than 8000 gene copy number alterations (CNA). Initial evaluation with the clustering tool demonstrated that the miRNA variables did not influence the clustering process; thus, only the other four classes of biological data were included in the final analysis: gene expression, DNA methylation, somatic mutations, and gene copy number alteration.

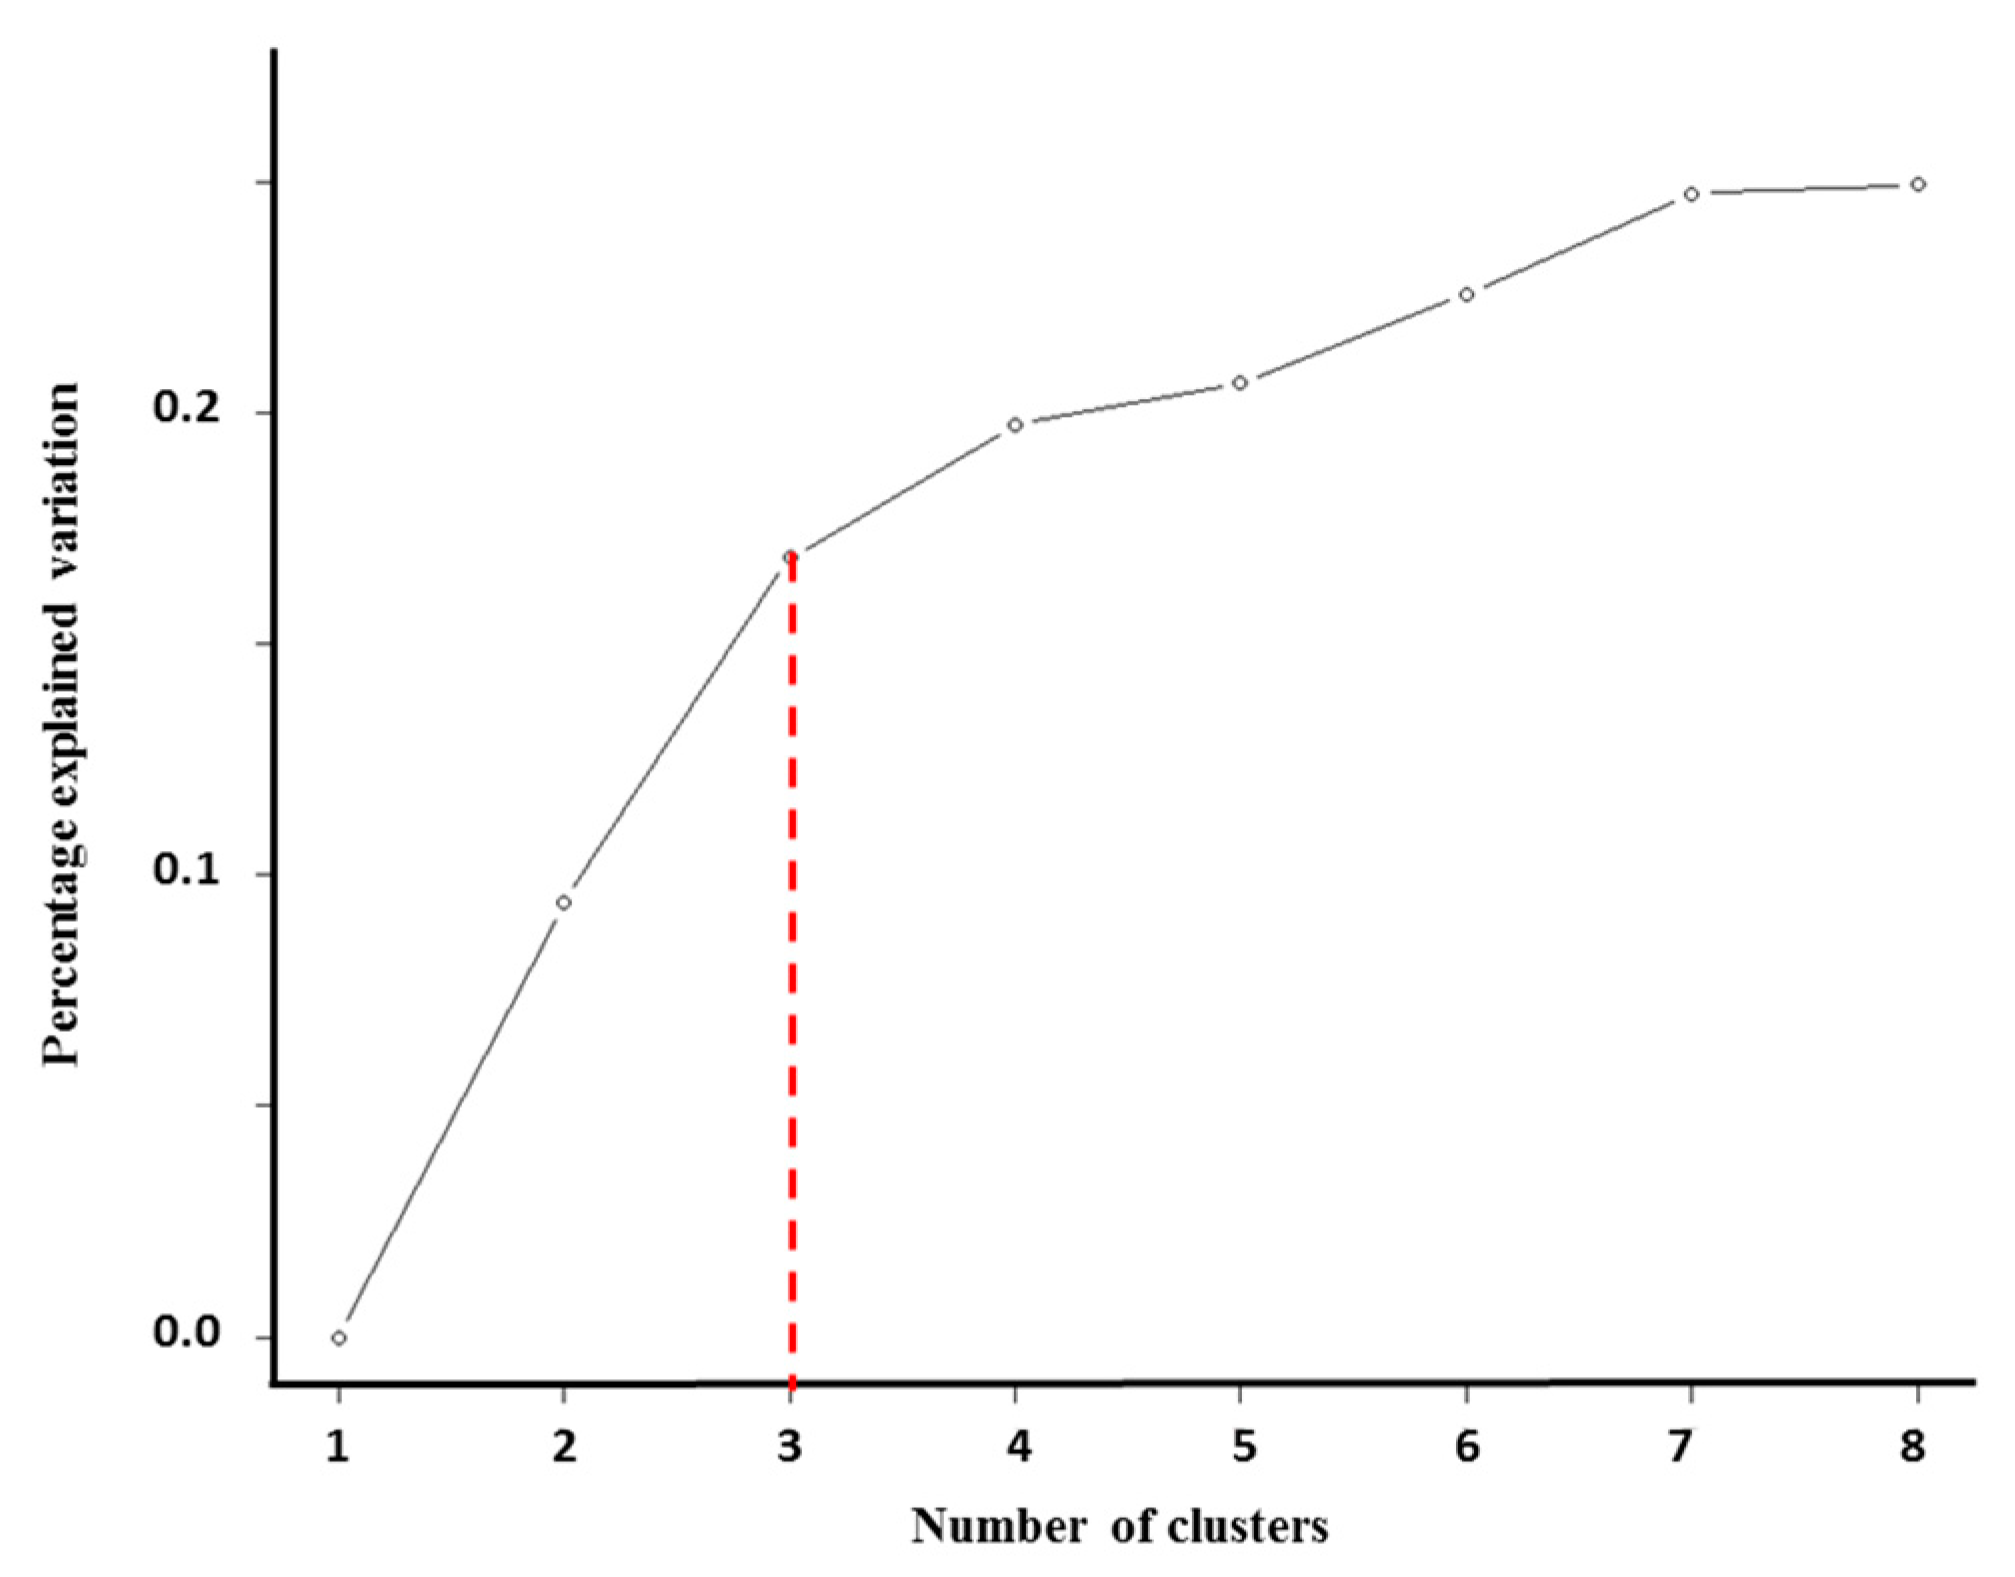
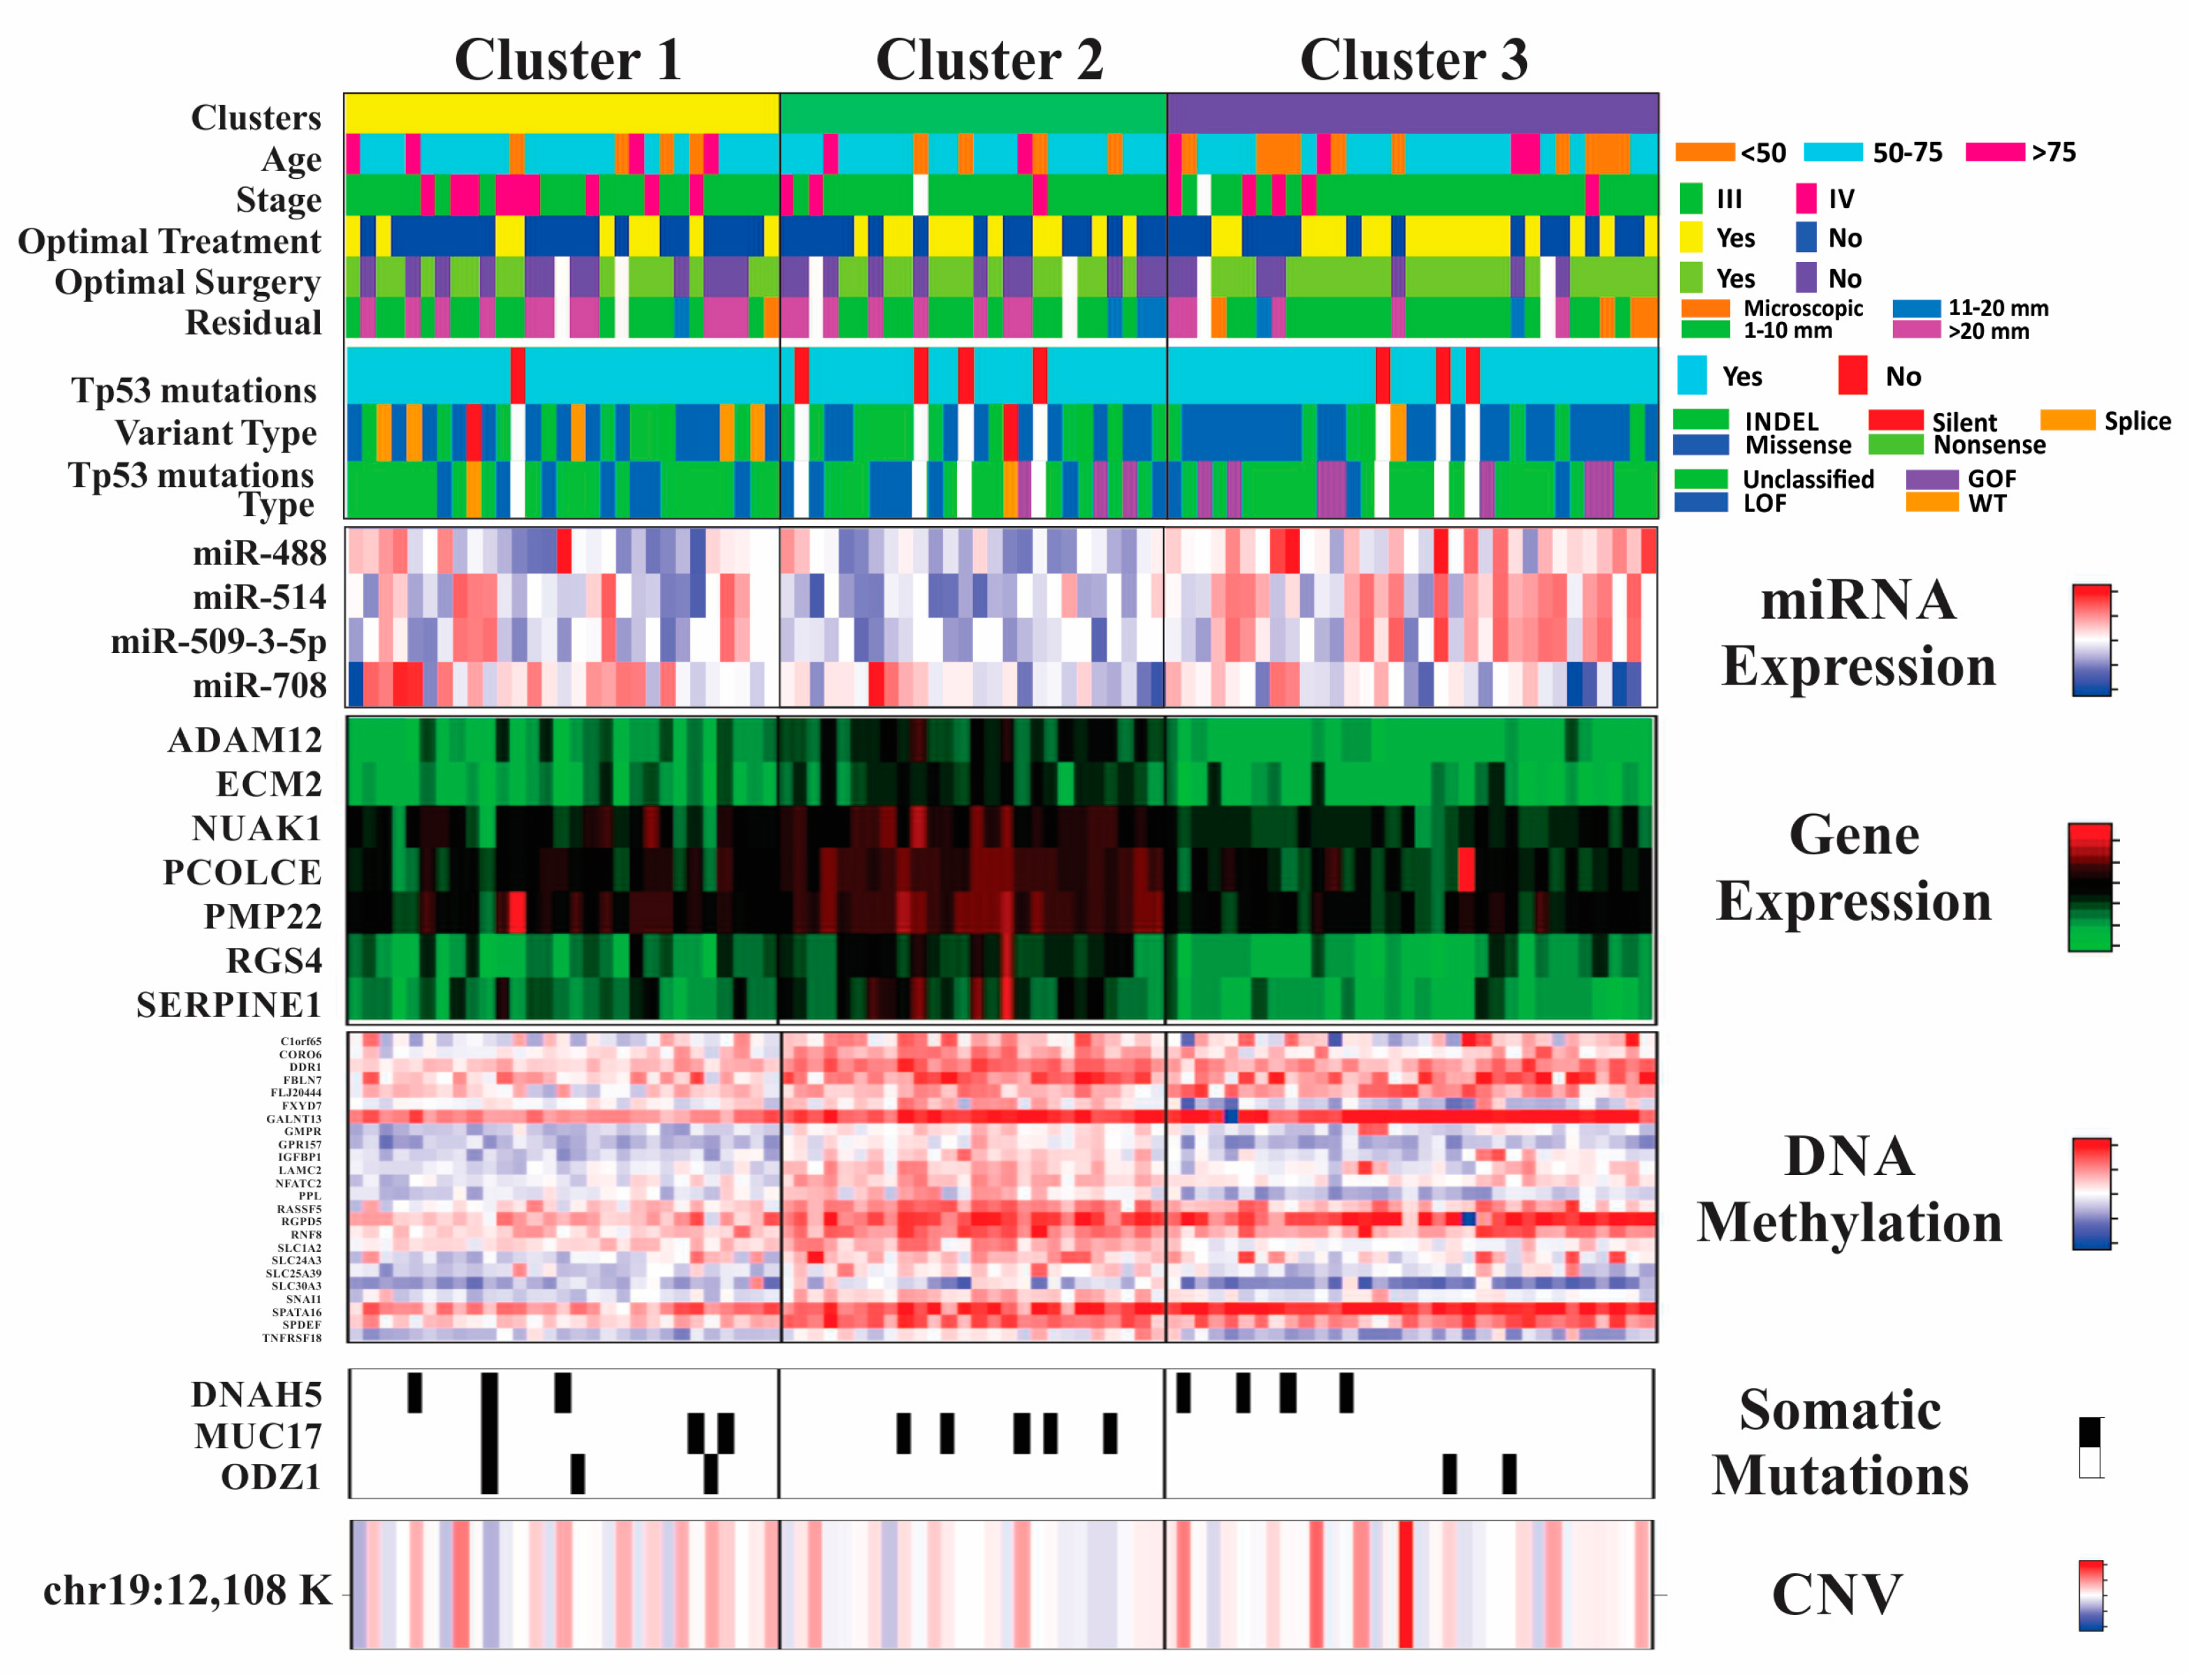
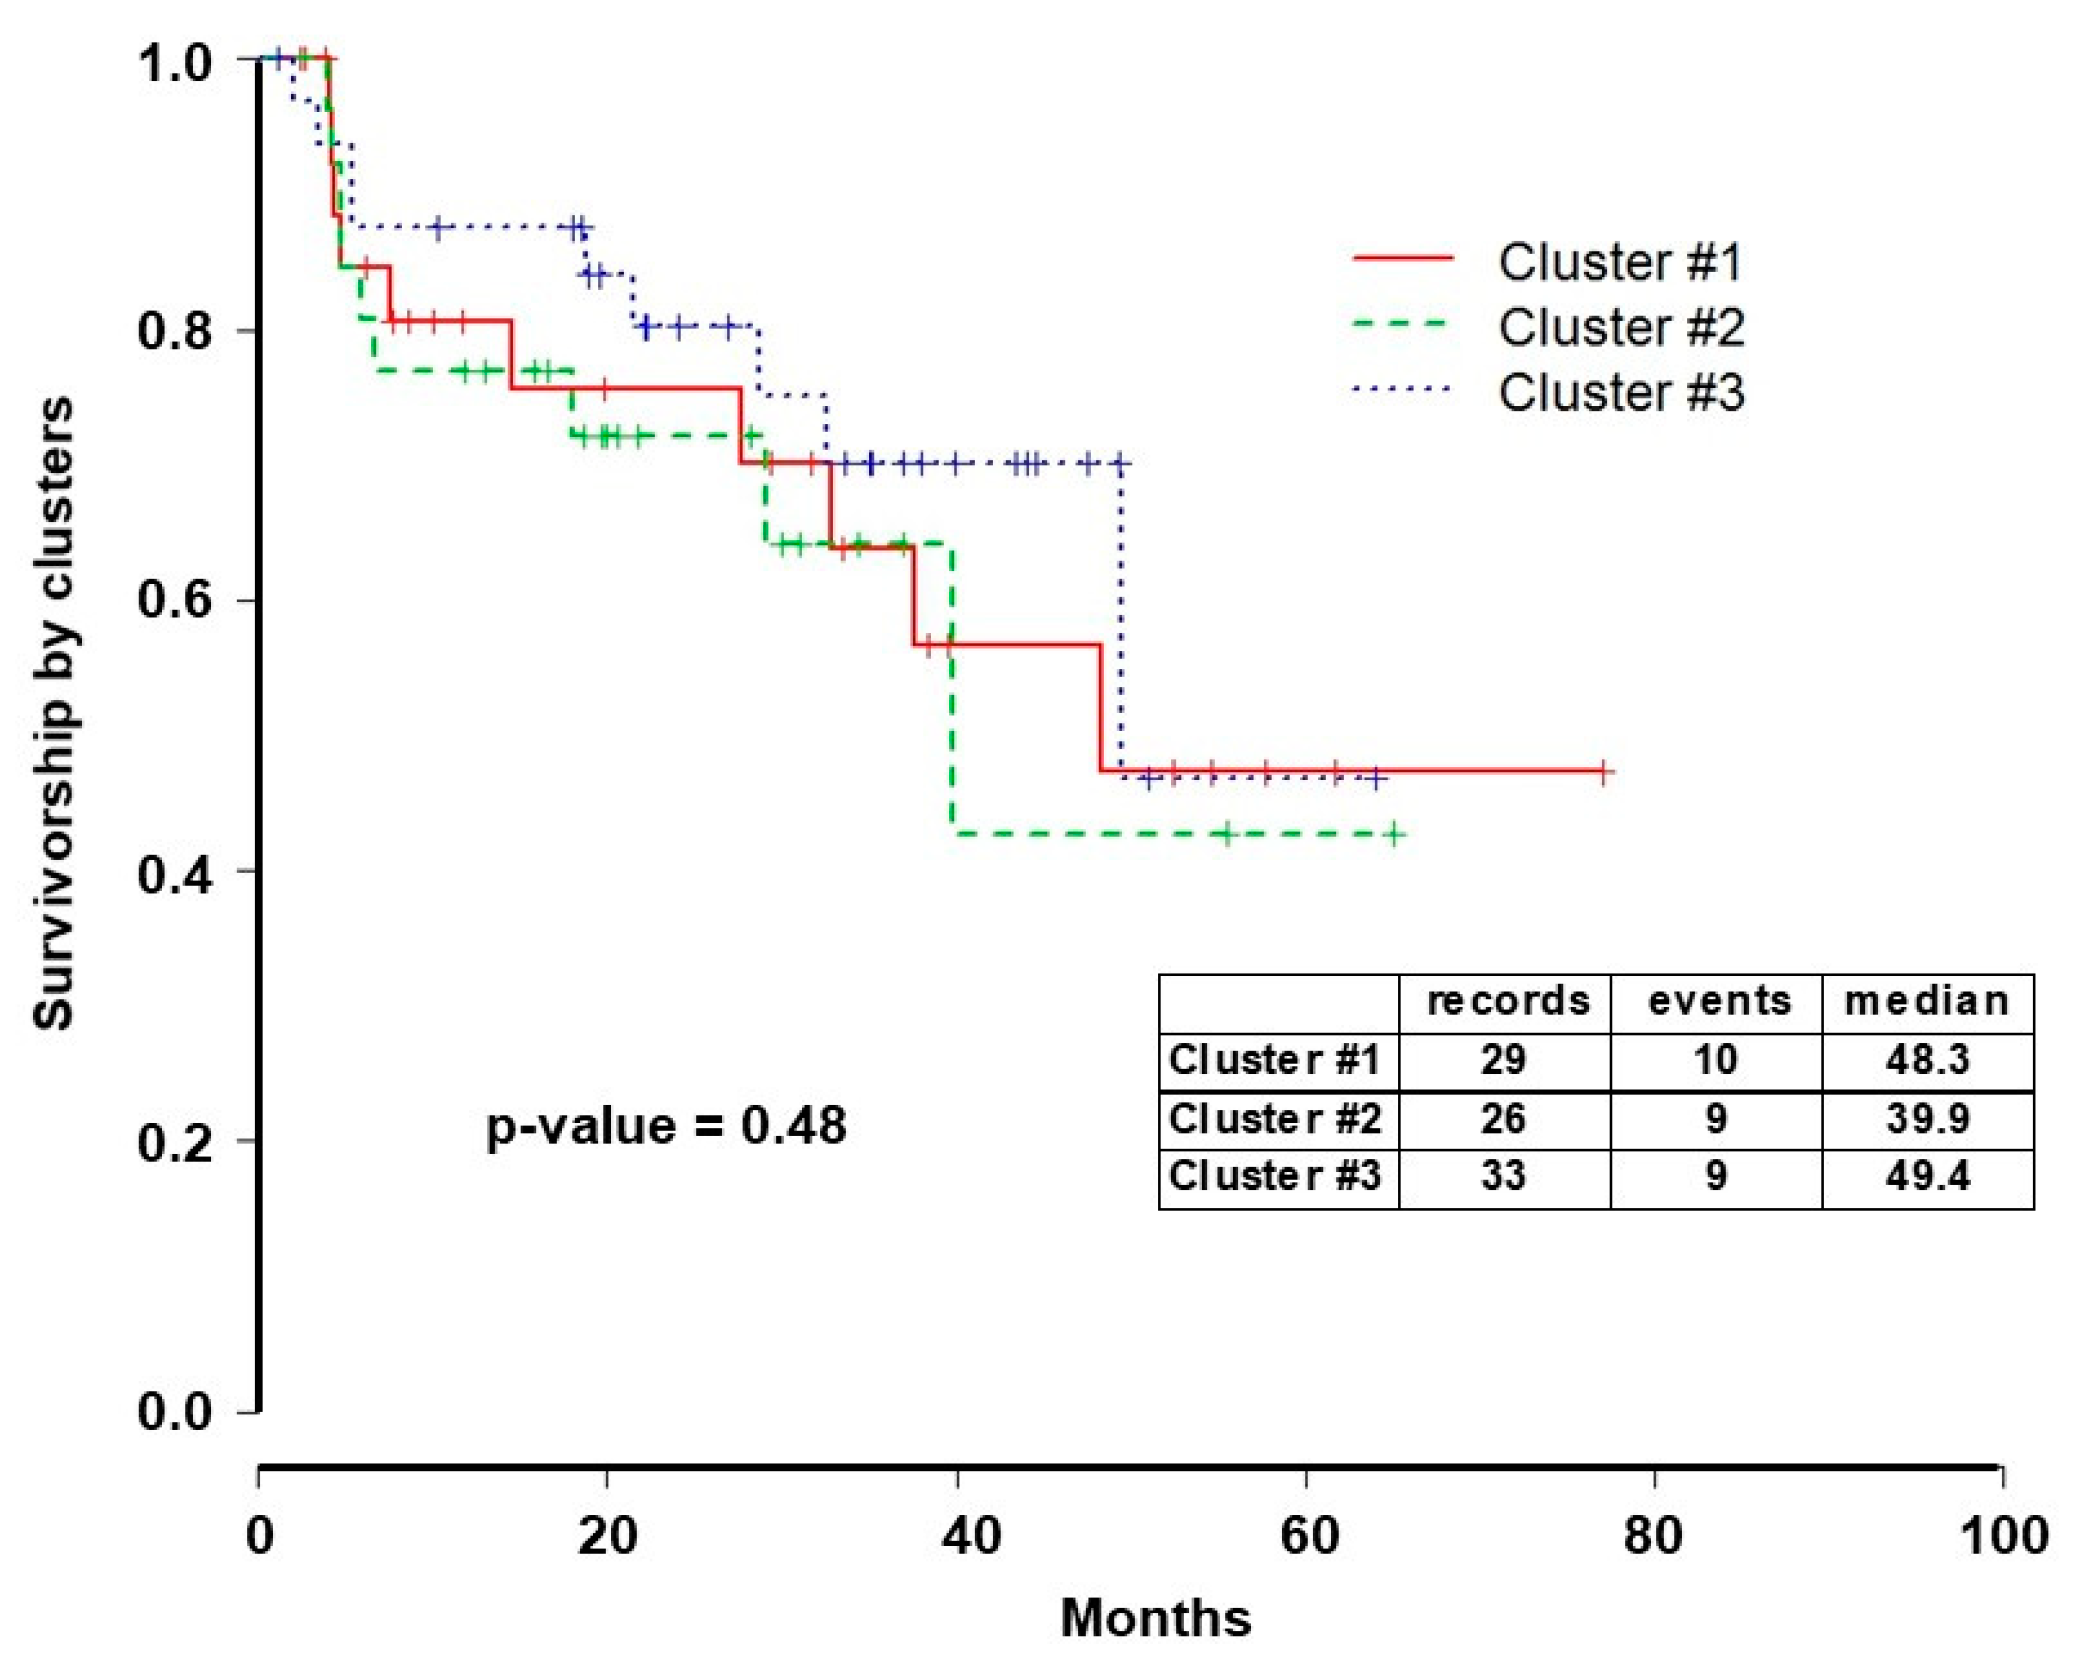
2.2. Integrative iClusterPlus Analysis

Eighty-eight non-responders from TCGA who had complete information for outcome, gene expression, mutation analysis, gene copy number, and DNA methylation were included in the cluster analysis. The optimization of the clustering method identified three differentiated clusters within non-responders (Figure 2). To build the final model, we used a threshold, or cut-off value, which selected the most discriminative features for the three-cluster model solution. The threshold was the 95th percentile. Only those features that passed this threshold were included in the representation of the final three-cluster model. Clinical information, including surgical outcomes along with type of TP53 somatic mutation, and independently significant miRNAs were added to each cluster in a supervised manner for further characterization (Figure 3).
A significant portion of Cluster 1 patients had > 2cm of residual visible disease following their primary debulking surgery. Additionally, they more often received suboptimal initial treatment. When classifying the TP53 somatic mutations within each cluster, the most loss-of-function TP53 mutations were seen in Cluster 1. Low levels of miRNA expression, significant hypomethylation, a high rate of somatic mutations, and CNA at chromosome 19 further characterized cluster 1.
Cluster 2 patients have mixed clinical characteristics and types of TP53 mutations. However, this group has extremely low levels of miRNA expression and higher expression of representative genes, as well as greater DNA hypermethylation, when compared to Cluster 1 and 3 patients. Further, unlike Clusters 1 and 3, there were no somatic mutations in the DNAH5 and ODZ1. Cluster 2 patients were more often diagnosed at stage III, received optimal primary treatment, and had optimal cytoreductive surgery, with the greatest percentage of completely cytoreduced patients as compared to other clusters. Cluster 3 patients had the greatest number of “oncogenic” gain-of-function (GOP) TP53 mutations. Cluster 3 was further characterized by high miRNA expression and DNA hypermethylation.

2.3. Pathway Enrichment Analysis

Pathway analysis findings were significant for the overrepresentation of the platelet derived growth factor receptor (PDGFR) in different pathways in Cluster 1 (Table 2). Overrepresentation of the HIF-1 signaling pathway was seen in Cluster 2; the Wnt/β-catenin pathway was close but not statistically significant in this cluster (p-value = 0.089). Pathways that are involved in cellular senescence were found to be overrepresented in Cluster 3. Despite significant variation in clinical and molecular profiles between the clusters, survival differences were not observed among clusters (Figure 4).

3. Discussion

While understanding the biologic mechanism for platinum resistance in ovarian cancer is extremely valuable, this information has not yet been translated into effective therapeutic strategies. To date, the most widely used molecular inhibitors in the treatment of ovarian cancer are the VEGF inhibitor bevacizumab and poly (ADP-ribose) polymerase (PARP) inhibitors. Even with the incorporation of these drugs into the accepted treatment paradigm for ovarian cancers, molecular analysis of tumors is not routine. Here, our goal was not to assess the mechanism of platinum resistance but, rather, to characterize non-responders. Our unsupervised cluster analysis of HGSC patients that did not respond to primary platinum-based chemotherapy revealed three distinct groups.
Even though specific clusters did not predict survival, unique differences between the clusters could eventually be used for treatment planning. For example, non-responders in Cluster 1 were more often diagnosed at stage IV and receive suboptimal treatment. From the progression-free survival (PFS) and overall survival (OS) results of ICON7 and GOG 218, we now know that patients with poor prognosis disease, defined in the studies as those with stage IV disease, inoperable stage III disease, or suboptimally debulked stage III disease, have a slightly higher PFS and OS advantage with the addition of bevacizumab to standard chemotherapy [16,17].
We hypothesized that the combination of cluster analysis, clinical and mutational characteristics, and pathway analyses may reveal some of the biology behind each cluster. Indeed, pathway analysis of molecular characteristics can be used to gain insight into the common biological processes that contribute to disease pathophysiology for each cluster [18]. For example, Cluster 1 seems to overrepresent pathways that are involved in growth factor signaling (PDGFR and VEGF), which contributes to cell proliferation. Pathways that regulate cellular survival, particularly in the setting of stress (HIF-1 signaling pathway and cellular senescence), dominate Cluster 2. Finally, the significantly altered pathway in Cluster 3 was related to cellular senescence. Not only do these distinct alterations hint at the potential mechanisms of chemoresistance, but they can also be used to suggest alternative treatments to override the dominant signaling pathways.
Since Cluster 1 tumors have an overrepresentation of growth factor signaling pathways, a logical treatment choice for these patients would be a tyrosine kinase or angiokinase inhibitor. Indeed, a recent phase 3 trial using nintedanib (an oral triple angiokinase inhibitor of VEGF receptor, PDGFR, and fibroblast growth factor receptor), in addition to platinum based chemotherapy showed improved PFS for ovarian cancer (17.2 months vs 16.6 months; p = 0.024) [19]. Additionally, a recent phase II trial for platinum-resistant ovarian cancer patients has identified a group of patients with increased PFS after treatment with nintedanib [20]. In ICON6, the use of cediranib, another oral angiokinase inhibitor that targets VEGFR and PDGFR, in addition to platinum-based chemotherapy for platinum sensitive, recurrent ovarian cancer showed a PFS benefit of almost three months (p < 0.0001) [21]. Through the identification of Cluster 1 patients prior to initial treatment, we could potentially single out those patients that are likely to benefit from the addition of angiokinase inhibitors or bevacizumab to chemotherapy in the front-line setting and potentially improve survival.
The overrepresented pathways in Cluster 2 are involved in cell survival. Notably, the HIF-1 signaling pathway is intimately related to the PI3K/AKT/mTOR pathway, which is one of the most important signaling pathways in cell survival [22]. In pre-clinical studies, the chemoresistant ovarian cancer cells are highly sensitive to mTOR inhibitors [23]. However, Phase II trials in ovarian cancer, including resistant cases, have demonstrated a diverse range of responses to mTOR inhibitors, such as temsirolimus [24], indicating that better criteria are necessary to determine which patients are the best candidates for mTOR inhibitors. Our study may shed insight into this important clinical question. In the pathway enrichment analysis of Cluster 2, the Wnt/β-catenin signaling pathway was not significant (p-value = 0.09), but cellular senescence was (p-value = 0.001). It has been reported that Wnt signaling antagonizes oncogene-induced cellular senescence as a tumor suppression mechanism in vivo [25]. Suppressing Wnt signaling pathway may improve in response to treatment in some tumors. Not only are multiple Wnt inhibitors under preclinical development, but Wnt inhibitors, such as LGK974 and OMP18R5, have entered phase 1 clinical trials for solid tumors with aberrant Wnt signaling [26], and PRI-724 is currently being used in a phase II trial in metastatic colon cancer [27]. Additionally, recent phase 1 evaluation of the Wnt/β-catenin signaling pathway within melanoma has shown that overactivation of the Wnt pathway conveys resistance to immunotherapy with anti-PD-L1 monoclonal antibody [28], a treatment that has been recently extrapolated for use in gynecologic tumors [29,30].
The most significantly overrepresented pathway in Cluster 3 was the cellular senescence pathway. In cancer transformation, the cell needs to bypass cellular senescence to become immortal [31]. TP53, which is a key tumor suppressor gene, is one of the most well-known components of this pathway. Gain-of-function TP53 mutations were most frequent in Cluster 3 patients. In addition to targeted agents that are focused on the reactivation of null TP53, there are many investigational compounds that induce gain-of-function (GOF) mutant TP53 degradation, such as histone deacetylase (HDAC) inhibitors [32]. As described by Yan et al., the activity of HDAC inhibitors extended to decreasing not only GOF TP53, but also wild-type TP53 expression, indicating that knowledge of the mutant type of TP53 is critically important before the application of these targeted therapies [33].
This study is circumscribed by available TCGA data and the potential systematic biases from retrospective data involving selected patients. Therefore, before we can apply this classification model to patients with advanced stage HGSC and design new alternative treatments, it is necessary to validate the classification in a prospective study and within other, representative datasets. We are currently recruiting patients and processing tumors with this in mind. However, despite these limitations, our study has successfully classified patients that failed initial chemotherapy for HGSC based on clinical and molecular characteristics and postulated new targeted treatment strategies for patients with very poor outcomes that have few therapeutic options.

4. Material and Methods

4.1. Outcomes Definition

Patients were categorized as responders or non-responders. The responders were defined as those with progression-free survival six months after the completion of six cycles of platinum-based chemotherapy. Non-responders were those who had progressed during the first platinum-based chemotherapy (platinum-refractory) or those who recurred within six months of treatment completion (platinum-resistant) [34,35,36]. Data from 450 patients with serous epithelial ovarian, fallopian tube, or primary peritoneal cancer were extracted from TCGA. The clinical characteristics of the study cohort are shown in Table 1. There was a total of 292 responder patients and 158 non-responders.

4.2. Source of Data

TCGA genomic data, including copy number variation, single nucleotide polymorphisms (SNPs), miRNA expression, gene expression (mRNA), and DNA methylation, as well as clinical and outcome information, were downloaded, normalized, formatted, and organized for the analysis, in accordance with the precepts of the TCGA data sharing agreements. All data collection and processing, including the consenting process, were performed after approval by the University of Iowa Institutional Review Board and they were in accord with the TCGA Human Subjects Protection and Data Access Policies, adopted by the National Cancer Institute (NCI) and the National Human Genome Research Institute (NHGRI).

4.2.1. Copy Number Alterations (CNA)

Samples from Agilent Human Genome CGH Microarray 244A (Agilent Technologies, Santa Clara, CA) were processed and DNA sequences were aligned to NCBI Build 36 version of the human genome. Circular Binary Segmentation was used to identify the regions with an altered copy number in each chromosome [37]. The copy number at a particular genomic location was computed based on the segmentation mean log ratio data. We found regions with frequent CNA among all the samples by performing genomic identification of significant targets in cancer (or GISTIC) analysis [38]. The significance of CNA at a particular genomic location was determined based on false discovery rate (FDR), as previously described [39]. A total of 16,918 chromosomal loci were included in the analysis. CNA was available for 447 patients (CR = 290, IR = 157).

4.2.2. Mutation Analysis

Somatic mutation detection, calling, annotation, and validation have been extensively described elsewhere [39]. Somatic mutation information resulting from Illumina Genome Analyzer DNA Sequencing GAIIx platform (Illumina Inc., San Diego, CA) was downloaded and formatted for analysis. Mutation information was downloaded from TCGA Data Portal (Level 3, i.e., validated somatic mutations). Somatic mutation information was available from 171 samples from patients with CR and 89 with IR. For those patients, there were 6716 unique genes that presented some types of validated somatic mutation. These included: frame shift insertions and deletions, in-frame insertions or deletions, missense, nonsense and nonstop mutations, silence, splice site, and translation start site mutations.

4.2.3. Gene Expression

Raw gene expression data were downloaded from the TCGA Data Portal (Level 1), extracted, loaded, and normalized and annotated with the National Center for Biotechnology Information (NCBI) Build 36 of the human genome. There were 450 (CR = 292, IR = 158) Affymetrix HT Human Genome U133 arrays with gene expression and clinical information about the chemo-response. A total of 12,718 genes passed the filtering criteria for percentage of values missing (<50%) and they were included in the analysis.

4.2.4. DNA Methylation

DNA methylation data with beta-values and methylated (M) and unmethylated (U) intensities were downloaded from the TCGA Data Portal (Level 2), extracted, loaded, and normalized. There were 438 (CR = 286, IR = 152) unique DNA-methylation of Illumina Infinium Human DNA Methylation 27 (Illumina Inc., San Diego, CA, USA) arrays from HGSC with clinical information regarding chemo-response. Differential DNA methylation of gene promoters was computed based on beta-values. The beta-values for each sample and locus were calculated as (M/(M+U)) [39]. A total of 14,473 DNA methylation probes passed filtering criteria for percentage of values missing (<50%) and they were included in the analysis.

4.2.5. MicroRNA (miRNA) Expression

Raw miRNA expression data were downloaded from the TCGA Data Portal (Level 1), extracted, loaded, and normalized with the analytical software, BRB-ArrayTools. There were 448 (CR = 290, IR158) Agilent Human miRNA Microarray Rel12.0 (Agilent Technologies Inc., Santa Clara, CA, USA) arrays from HGSC with clinical information regarding chemo-response [39]. A total of 619 miRNAs passed filtering criteria for the percentage of values missing (<50%) and they were included in the analysis.

4.3. Statistical Analysis

4.3.1. Variable Selection

Our objective was to characterize HGSC patients that do not respond to initial chemotherapy by clustering clinical and biological data. Initially, we selected those variables that were associated with the defined outcome (non-response to chemotherapy) for all types of data: clinical, gene and miRNA expression, CNA, somatic mutations and DNA methylation. Variables that were not different between responders and non-responders do not inform the characterization of non-responder patients.
For a selection of variables that are associated with non-response, we performed a univariate two-sided t-test analysis, comparing the groups of chemo-response (responders versus non-responders) with respect to differential gene expression, DNA methylation, miRNA expression (cut off for significance p-value < 0.05), and CNA (p-value < 0.001). Logistic regression analyses were performed to determine the association between chemo-response, somatic gene mutations, and clinicopathological variables (cut off value for significance p < 0.05). A more stringent cut-off p-value was chosen for CNA (with elevated number of variables and overlap between them) to reduce false positives and minimize features in the cluster analysis. For all biological comparisons, 10,000 random permutations were performed to determine the p values. Significant variables in univariate analyses were included in the integrative cluster analysis, or iClusterPlus [40].

4.3.2. iClusterPlus Analysis

Only using data from the non-responder group, an unsupervised cluster analysis was performed with the iClusterPlus framework within the R statistical software package. The goal of this method is to generate a classification of tumors (or clusters) by capturing patterns from diverse classes of genomic data. The tumors were only clustered from non-responders. Initially, data from all biological classes were introduced in the model to optimize the clustering analysis. During the optimization process, no miRNAs made a significant contribution to the clustering solution; so, it was concluded that miRNA expression was not relevant to the clustering process. The remaining four biological/genomic classes were introduced for the final clustering analysis: gene expression, CNA, somatic mutations, and DNA methylation. All variables that were found to be significant in the univariate analysis were used. A total of 88 patients with information for all classes of biological data were used for the final analysis.
Before performing the final iClusterPlus analysis, we optimized or tuned the parameters to be applied. First, we determined the number of clusters (k) by repeatedly partitioning the samples into a learning and a test set. Subsequently, we evaluated the degree of agreement between the predicted and the observed cluster assignment [40]. For results visualization, we plotted the number of clusters vs. percent of explained variation. The optimal k is the point at which the curve of the percent explained variation levels off [15]. Afterwards, for each k, we used Bayesian information criteria to select the best sparse model with the optimal combination of penalty parameters, or lambdas (ʎ) [40]. We ran the final model with the combination of optimized number of clusters (k), penalty parameters (ʎ), and all classes of variables. Finally, we selected the top features (95th percentile) that were based on lasso coefficient estimates for the k-cluster solution.
Important clinical information, including demographic data, stage, surgical, and treatment information, along with TP53 mutation status was added to the representation of each cluster. The TP53 mutations were grouped into three categories based on predicted functional consequence: gain-of-function (GOF), loss-of-function (LOF), or wildtype (WT). The GOF mutations were those that have been shown to cause an oncogenic phenotype: P151S, Y163C, R175H, L194R, Y220C, R248Q, R248W, R273C, R273H, R273L, and R282W [41]; LOF mutations were those that resulted in the lack of protein expression and WT mutations were those that did not alter the amino acid sequence of TP53. The remaining mutations were single missense mutations, or “variants of unknown significance”, in which the functional effect of the mutation is currently not known [42]. Residual disease after surgery was recorded in centimeters. Patients with residual disease >1 cm in largest diameter after surgery had suboptimal surgery. Optimal treatment was considered to be the sum of optimal surgery with the administration of six cycles of platinum-based chemotherapy.
Because miRNA expression did not contribute to the clustering process, in the representation of results, we only added miRNAs that were independently associated with chemo-response in the multivariate analysis. This analysis was performed using additive logistic regression modeling with backward elimination.

4.3.3. Pathway Analysis

To further characterize the molecular characteristics of each resulting cluster, a pathway enrichment analysis was performed using KEGG and clusterProfiler [18,43]. All of the analyses were performed using R environment for statistical computing and graphics (www.r-project.org) [44].

5. Conclusions

The integration of genomic and clinical data is a variable-based approach to cluster non-responders into distinct categories. Subsequent pathway analysis of the components of these clusters may be used to identify the potential alternative therapeutic targets and strategies for each cluster.

Author Contributions

M.E.M., E.A.S., and A.M.N. were involved in assembling the patient cohort. M.J.G. is responsible for assembling and maintaining the tumor bank utilized for this study. K.K.L. is one of the senior investigators overseeing this project, with D.P.B., and is the recipient of the N.I.H. grants that partially funded the study. B.J.S. and K.W.T. assisted with the biostatistics. M.E.M. was the major contributor in writing the manuscript; and E.A.S., D.P.B. and A.M.N. participated in editing the initial manuscript. E.J.D. interpreted pathway analysis and assessed possible targeted therapies for resulting cluster, in conjunction with K.W.T., J.G.B. is the senior investigator overseeing this project, analyzed and interpreted TCGA data, and was a major contributor in writing the manuscript. All authors read and approved the final manuscript.

Funding

This work was supported in part by the NIH grant R01 CA99908 and R01 CA184101 to Kimberly K. Leslie, and the basic research fund from the Department of Obstetrics & Gynecology at the University of Iowa.

Acknowledgments

We would like to thank “TCGA Research Network” for generating, curating and providing clinical data.

Conflicts of Interest

Dr. Kristina W. Thiel is a co-owner of Immortagen, Inc. All other authors certify that they have no affiliations with or involvement in any organization or entity with any financial interest (such as honoraria; educational grants; participation in speakers’ bureaus; membership, employment, consultancies, stock ownership, or other equity interest; and expert testimony or patent-licensing arrangements), or non-financial interest (such as personal or professional relationships, affiliations, knowledge or beliefs), or conflicts of interest in the subject matter or materials discussed in this manuscript.

Abbreviations

HGSCHigh-grade serous ovarian cancer
TCGAThe Cancer Genome Atlas
AUCArea under the (receiver operating characteristic) curve
CNAGene copy number alteration
miRNAMicro RNA
KClusters
PFSProgression-free survival
OSOverall survival
HDACHistone deacetylase
GOFGain-of-function
LOFLoss-of-function
WTWildtype
GOGGynecologic Oncology Group
ICONInternational Collaborative Ovarian Neoplasm
KEGGKyoto Encyclopedia of Genes and Genomes

Appendix A

Table A1. Clinical-molecular characteristics from the resulting cluster analysis in Figure 3. The order of the variables is the same than in the figure.
ClinicalAge
Stage
Optimal treatment
Optimal surgery
Residual
TP53Mutation status
Variant type
TP53 Mutation type
Gene expressionADAM12
ECM2
NUAK1
PCOLCE
PMP22
RGS4
SERPINE1
MethylationC1orf65
CORO6
DDR1
FBLN7
FLJ20444
FXYD7
GALNT13
GMPR
GPR157
IGFBP1
LAMC2
NFATC2
PPL
RASSF5
RGPD5
RNF8
SLC1A2
SLC24A3
SLC25A39
SLC30A3
SNAI1
SPATA16
SPDEF
TNFRSF18
MutationsDNAH5
MUC17
ODZ1
Copy number alterationChr19: 12,108,685-12,180,988

References

  1. American Cancer Society, Cancer Facts & Figures 2014; American Cancer Society: Atlanta, GA, USA, 2014.
  2. Levanon, K.; Crum, C.; Drapkin, R. New insights into the pathogenesis of serous ovarian cancer and its clinical impact. J. Clin. Oncol. 2008, 26, 5284–5293. [Google Scholar] [CrossRef] [PubMed]
  3. Alexandre, J.; Ray-Coquard, I.; Selle, F.; Floquet, A.; Cottu, P.; Weber, B.; Falandry, C.; Lebrun, D.; Pujade-Lauraine, E. Gineco, Mucinous advanced epithelial ovarian carcinoma: Clinical presentation and sensitivity to platinum-paclitaxel-based chemotherapy, the GINECO experience. Ann. Oncol. 2010, 21, 2377–2381. [Google Scholar] [CrossRef] [PubMed]
  4. Katagiri, A.; Nakayama, K.; Rahman, M.T.; Rahman, M.; Katagiri, H.; Nakayama, N.; Ishikawa, M.; Ishibashi, T.; Iida, K.; Kobayashi, H.; et al. Loss of ARID1A expression is related to shorter progression-free survival and chemoresistance in ovarian clear cell carcinoma. Mod. Pathol. 2012, 25, 282–288. [Google Scholar] [CrossRef] [PubMed]
  5. Yang, D.; Khan, S.; Sun, Y.; Hess, K.; Shmulevich, I.; Sood, A.K.; Zhang, W. Association of BRCA1 and BRCA2 mutations with survival, chemotherapy sensitivity, and gene mutator phenotype in patients with ovarian cancer. JAMA 2011, 306, 1557–1565. [Google Scholar] [CrossRef] [PubMed]
  6. Galluzzi, L.; Vitale, I.; Senovilla, L.; Eisenberg, T.; Carmona-Gutierrez, D.; Vacchelli, E.; Robert, T.; Ripoche, H.; Jagemann, N.; Paccard, C.; et al. Independent transcriptional reprogramming and apoptosis induction by cisplatin. Cell Cycle 2012, 11, 3472–3480. [Google Scholar] [CrossRef] [PubMed] [Green Version]
  7. Borst, P.; Rottenberg, S.; Jonkers, J. How do real tumors become resistant to cisplatin? Cell Cycle 2008, 7, 1353–1359. [Google Scholar] [CrossRef] [PubMed] [Green Version]
  8. Godwin, A.K.; Meister, A.; O’Dwyer, P.J.; Huang, C.S.; Hamilton, T.C.; Anderson, M.E. High resistance to cisplatin in human ovarian cancer cell lines is associated with marked increase of glutathione synthesis. Proc. Natl. Acad. Sci. USA 1992, 89, 3070–3074. [Google Scholar] [CrossRef] [PubMed]
  9. Johnson, S.W.; Laub, P.B.; Beesley, J.S.; Ozols, R.F.; Hamilton, T.C. Increased platinum-DNA damage tolerance is associated with cisplatin resistance and cross-resistance to various chemotherapeutic agents in unrelated human ovarian cancer cell lines. Cancer Res. 1997, 57, 850–856. [Google Scholar] [PubMed]
  10. Johnson, S.W.; Swiggard, P.A.; Handel, L.M.; Brennan, J.M.; Godwin, A.K.; Ozols, R.F.; Hamilton, T.C. Relationship between platinum-DNA adduct formation and removal and cisplatin cytotoxicity in cisplatin-sensitive and -resistant human ovarian cancer cells. Cancer Res. 1994, 54, 5911–5916. [Google Scholar] [PubMed]
  11. Gonzalez Bosquet, J.; Marchion, D.C.; Chon, H.; Lancaster, J.M.; Chanock, S. Analysis of chemotherapeutic response in ovarian cancers using publically available high-throughput data. Cancer Res. 2014, 74, 3902–3912. [Google Scholar] [CrossRef] [PubMed]
  12. Oikonomopoulou, K.; Li, L.; Zheng, Y.; Simon, I.; Wolfert, R.L.; Valik, D.; Nekulova, M.; Simickova, M.; Frgala, T.; Diamandis, E.P. Prediction of ovarian cancer prognosis and response to chemotherapy by a serum-based multiparametric biomarker panel. Br. J. Cancer 2008, 99, 1103–1113. [Google Scholar] [CrossRef] [PubMed]
  13. Zheng, Y.; Katsaros, D.; Shan, S.J.; de la Longrais, I.R.; Porpiglia, M.; Scorilas, A.; Kim, N.W.; Wolfert, R.L.; Simon, I.; Li, L.; et al. A multiparametric panel for ovarian cancer diagnosis, prognosis, and response to chemotherapy. Clin. Cancer Res. 2007, 13, 6984–6992. [Google Scholar] [CrossRef] [PubMed]
  14. Gonzalez Bosquet, J.; Newtson, A.M.; Chung, R.K.; Thiel, K.W.; Ginader, T.; Goodheart, M.J.; Leslie, K.K.; Smith, B.J. Prediction of chemo-response in serous ovarian cancer. Mol. Cancer 2016, 15, 66. [Google Scholar] [CrossRef] [PubMed]
  15. Shen, R.; Olshen, A.B.; Ladanyi, M. Integrative clustering of multiple genomic data types using a joint latent variable model with application to breast and lung cancer subtype analysis. Bioinformatics 2009, 25, 2906–2912. [Google Scholar] [CrossRef] [PubMed] [Green Version]
  16. Perren, T.J.; Swart, A.M.; Pfisterer, J.; Ledermann, J.A.; Pujade-Lauraine, E.; Kristensen, G.; Carey, M.S.; Beale, P.; Cervantes, A.; Kurzeder, C.; et al. A phase 3 trial of bevacizumab in ovarian cancer. N. Engl. J. Med. 2011, 365, 2484–2496. [Google Scholar] [CrossRef] [PubMed]
  17. Burger, R.A.; Brady, M.F.; Bookman, M.A.; Fleming, G.F.; Monk, B.J.; Huang, H.; Mannel, R.S.; Homesley, H.D.; Fowler, J.; Greer, B.E.; et al. Incorporation of bevacizumab in the primary treatment of ovarian cancer. N. Engl. J. Med. 2011, 365, 2473–2483. [Google Scholar] [CrossRef] [PubMed]
  18. Yu, G.; Wang, L.G.; Han, Y.; He, Q.Y. clusterProfiler: An R package for comparing biological themes among gene clusters. Omics A J. Integr. Biol. 2012, 16, 284–287. [Google Scholar] [CrossRef] [PubMed]
  19. Du Bois, A.; Kristensen, G.; Ray-Coquard, I.; Reuss, A.; Pignata, S.; Colombo, N.; Denison, U.; Vergote, I.; Del Campo, J.M.; Ottevanger, P.; et al. Standard first-line chemotherapy with or without nintedanib for advanced ovarian cancer (AGO-OVAR 12): A randomised, double-blind, placebo-controlled phase 3 trial. Lancet Oncol. 2016, 17, 78–89. [Google Scholar] [CrossRef]
  20. Davidson, B.A.; Squatrito, R.; Duska, L.R.; Havrilesky, L.J.; Schwager, N.; McCollum, M.; Arapovic, S.; Secord, A.A. Phase II evaluation of nintedanib in the treatment of bevacizumab-resistant persistent/recurrent ovarian, fallopian tube, or primary peritoneal carcinoma. J. Clin. Oncol. 2016, 34 (Suppl. 15), TPS5601. [Google Scholar] [CrossRef]
  21. Ledermann, J.A.; Embleton, A.C.; Raja, F.; Perren, T.J.; Jayson, G.C.; Rustin, G.J.; Kaye, S.B.; Hirte, H.; Eisenhauer, E.; Vaughan, M.; et al. Cediranib in patients with relapsed platinum-sensitive ovarian cancer (ICON6): A randomised, double-blind, placebo-controlled phase 3 trial. Lancet 2016, 387, 1066–1074. [Google Scholar] [CrossRef]
  22. Aziz, A.U.R.; Farid, S.; Qin, K.; Wang, H.; Liu, B. PIM Kinases and Their Relevance to the PI3K/AKT/mTOR Pathway in the Regulation of Ovarian Cancer. Biomolecules 2018, 8, 7. [Google Scholar] [CrossRef] [PubMed]
  23. Choi, H.J.; Heo, J.H.; Park, J.Y.; Jeong, J.Y.; Cho, H.J.; Park, K.S.; Kim, S.H.; Moon, Y.W.; Kim, J.S.; An, H.J. A novel PI3K/mTOR dual inhibitor, CMG002, overcomes the chemoresistance in ovarian cancer. Gynecol. Oncol. 2019. [Google Scholar] [CrossRef] [PubMed]
  24. Mabuchi, S.; Kuroda, H.; Takahashi, R.; Sasano, T. The PI3K/AKT/mTOR pathway as a therapeutic target in ovarian cancer. Gynecol. Oncol. 2015, 137, 173–179. [Google Scholar] [CrossRef] [PubMed]
  25. Adams, P.D.; Enders, G.H. Wnt-signaling and senescence: A tug of war in early neoplasia? Cancer Biol. Ther. 2008, 7, 1706–1711. [Google Scholar] [CrossRef] [PubMed]
  26. Smith, D.C.; Rosen, L.S.; Chugh, R.; Goldman, J.W.; Xu, L.; Kapoun, A.; Brachmann, R.K.; Dupont, J.; Stagg, R.J.; Tolcher, A.W.; et al. First-in-human evaluation of the human monoclonal antibody vantictumab (OMP-18R5; anti-Frizzled) targeting the WNT pathway in a phase I study for patients with advanced solid tumors. J. Clin. Oncol. 2013, 31 (Suppl. 15), 2540. [Google Scholar]
  27. Combination Chemotherapy and Bevacizumab with Or without PRI-724 in Treating Patients with Newly Diagnosed Metastatic Colorectal Cancer. Available online: https://www.cancer.gov/about-cancer/treatment/clinical-trials/intervention/C95894 (accessed on 28 February 2019).
  28. Spranger, S.; Bao, R.; Gajewski, T.F. Melanoma-intrinsic beta-catenin signalling prevents anti-tumour immunity. Nature 2015, 523, 231–235. [Google Scholar] [CrossRef] [PubMed]
  29. Varga, A.; Piha-Paul, S.; Ott, P.A.; Mehnert, J.M.; Berton-Rigaud, D.; Morosky, A.; Yang, P.; Ruman, J.; Matei, D. Pembrolizumab in patients with programmed death ligand 1-positive advanced ovarian cancer: Analysis of KEYNOTE-028. Gynecol. Oncol. 2019, 152, 243–250. [Google Scholar] [CrossRef] [PubMed]
  30. Hamanishi, J.; Mandai, M.; Ikeda, T.; Minami, M.; Kawaguchi, A.; Murayama, T.; Kanai, M.; Mori, Y.; Matsumoto, S.; Chikuma, S.; et al. Safety and Antitumor Activity of Anti-PD-1 Antibody, Nivolumab, in Patients With Platinum-Resistant Ovarian Cancer. J. Clin. Oncol. 2015, 33, 4015–4022. [Google Scholar] [CrossRef] [PubMed]
  31. Fridman, A.L.; Tainsky, M.A. Critical pathways in cellular senescence and immortalization revealed by gene expression profiling. Oncogene 2008, 27, 5975–5987. [Google Scholar] [CrossRef] [PubMed] [Green Version]
  32. Li, D.; Marchenko, N.D.; Moll, U.M. SAHA shows preferential cytotoxicity in mutant p53 cancer cells by destabilizing mutant p53 through inhibition of the HDAC6-Hsp90 chaperone axis. Cell Death Differ. 2011, 18, 1904–1913. [Google Scholar] [CrossRef] [PubMed] [Green Version]
  33. Yan, W.; Liu, S.; Xu, E.; Zhang, J.; Zhang, Y.; Chen, X.; Chen, X. Histone deacetylase inhibitors suppress mutant p53 transcription via histone deacetylase 8. Oncogene 2013, 32, 599–609. [Google Scholar] [CrossRef] [PubMed]
  34. Friedlander, M.L.; Stockler, M.R.; Butow, P.; King, M.T.; McAlpine, J.; Tinker, A.; Ledermann, J.A. Clinical trials of palliative chemotherapy in platinum-resistant or -refractory ovarian cancer: Time to think differently? J. Clin. Oncol. 2013, 31, 2362. [Google Scholar] [CrossRef] [PubMed]
  35. Therasse, P.; Arbuck, S.G.; Eisenhauer, E.A.; Wanders, J.; Kaplan, R.S.; Rubinstein, L.; Verweij, J.; Van Glabbeke, M.; van Oosterom, A.T.; Christian, M.C.; et al. New guidelines to evaluate the response to treatment in solid tumors. European Organization for Research and Treatment of Cancer, National Cancer Institute of the United States, National Cancer Institute of Canada. J. Natl. Cancer Inst. 2000, 92, 205–216. [Google Scholar] [CrossRef] [PubMed]
  36. Friedlander, M.; Butow, P.; Stockler, M.; Gainford, C.; Martyn, J.; Oza, A.; Donovan, H.S.; Miller, B.; King, M. Symptom control in patients with recurrent ovarian cancer: Measuring the benefit of palliative chemotherapy in women with platinum refractory/resistant ovarian cancer. Int. J. Gynecol. Cancer 2009, 19 (Suppl. 2), S44–S48. [Google Scholar] [CrossRef] [PubMed]
  37. Olshen, A.B.; Venkatraman, E.S.; Lucito, R.; Wigler, M. Circular binary segmentation for the analysis of array-based DNA copy number data. Biostatistics 2004, 5, 557–572. [Google Scholar] [CrossRef] [PubMed]
  38. Beroukhim, R.; Getz, G.; Nghiemphu, L.; Barretina, J.; Hsueh, T.; Linhart, D.; Vivanco, I.; Lee, J.C.; Huang, J.H.; Alexander, S.; et al. Assessing the significance of chromosomal aberrations in cancer: Methodology and application to glioma. Proc. Natl. Acad. Sci. USA 2007, 104, 20007–20012. [Google Scholar] [CrossRef] [PubMed] [Green Version]
  39. Cancer Genome Atlas Research Network. Integrated genomic analyses of ovarian carcinoma. Nature 2011, 474, 609–615. [Google Scholar] [CrossRef] [PubMed] [Green Version]
  40. Mo, Q.; Wang, S.; Seshan, V.E.; Olshen, A.B.; Schultz, N.; Sander, C.; Powers, R.S.; Ladanyi, M.; Shen, R. Pattern discovery and cancer gene identification in integrated cancer genomic data. Proc. Natl. Acad. Sci. USA 2013, 110, 4245–4250. [Google Scholar] [CrossRef] [PubMed]
  41. Brachova, P.; Mueting, S.R.; Devor, E.J.; Leslie, K.K. Oncomorphic TP53 Mutations in Gynecologic Cancers Lose the Normal Protein:Protein Interactions with the microRNA Microprocessing Complex. J. Cancer 2014, 5, 506–516. [Google Scholar]
  42. Brachova, P.; Mueting, S.R.; Carlson, M.J.; Goodheart, M.J.; Button, A.M.; Mott, S.L.; Dai, D.; Thiel, K.W.; Devor, E.J.; Leslie, K.K. TP53 oncomorphic mutations predict resistance to platinum and taxanebased standard chemotherapy in patients diagnosed with advanced serous ovarian carcinoma. Int. J. Oncol. 2015, 46, 607–618. [Google Scholar] [CrossRef] [PubMed]
  43. Kanehisa, M.; Goto, S.; Kawashima, S.; Okuno, Y.; Hattori, M. The KEGG resource for deciphering the genome. Nucleic Acids Res. 2004, 32, D277–D280. [Google Scholar] [CrossRef] [PubMed]
  44. Friedman, J.; Hastie, T.; Tibshirani, R. Regularization Paths for Generalized Linear Models via Coordinate Descent. J. Stat. Softw. 2010, 33, 1–22. [Google Scholar] [CrossRef] [PubMed]
Figure 1. Univariate Analysis between Responders and Non-Responders. Heatmaps and graphics of molecular variables that were different between groups of responders and non-responders, with color codes and significance levels for each class of data. These variables were used for the integrative cluster analysis with iClusterPlus: (A) Differentially expressed genes; (B) Differentially methylated promoters; (C) Differentially expressed miRNAs; (D) Somatic mutations; (E) Altered gene copy numbers: green means gain of copy number, red is loss of copy number.
Ijms 20 01175 g001
Figure 2. Optimization of cluster number. To assess the number of clusters we plotted the number of tested clusters vs. percent of explained variation. Optimal k or cluster number is the point at which percent of explained variation begins to level off after initial rapid ascent. Here, k = 3 [15].
Ijms 20 01175 g002
Figure 3. Clinical-molecular characteristics of the three clusters. At the top are the different clusters: 1 in yellow, 2 in green, 3 in purple. Below them are the clinical profiles with the variable in the left margin (age, stage, optimal treatment, optimal surgery and residual disease after surgery) and the color-code for each category in the right margin. Underneath clinical information there is a representation of TP53 somatic mutation features: presence or status, variant, and mutation type. The last five heatmaps represent the top molecular features with specific color codes for their respective values at the right margin. Only molecular features that were most discriminating for this three-cluster model and passed a selection with a threshold value of > 95th percentile were included in the representation of the final 3-cluster model. Names of all features are detailed in Appendix A.
Ijms 20 01175 g003
Figure 4. Survival analysis by clusters. Kaplan–Meier survival curves of the three clusters from iClusterPlus analysis showed no differences by log-rank analysis (p = 0.48).
Ijms 20 01175 g004
Table 1. Clinical characteristics of 88 non-responder HSGC patients. Non-responders were divided by their resulting clusters after the iClusterPlus analysis. All of the clinical characteristics were not statistically different between the resulting clusters.
Cluster #1Cluster #2Cluster #3p-Value
Number of Patients292633
Average Age (years)6159570.149
Grade 0.744
Grade 2243
Grade 3 272128
Stage 0.081
Stage II001
Stage III202227
Stage IV935
Surgical Outcome 0.079
Optimal (<1 cm)151324
Suboptimal (>1 cm)12107
Residual Disease 0.136
Microscopic104
Macroscopic262327
Optimal Treatment 0.063
Optimal (Surgery + 6 cycles)91118
Suboptimal201515
Chemotherapy 0.151
Platinum2925 *31 **
Platinum +Taxane272431
Non-responders were those who had progressed during the first platinum-based chemotherapy (platinum-refractory) or those who recurred within 6 months of treatment completion (platinum-resistant). * One patient had no information about drugs delivered; all other had initial platinum-based chemotherapy. ** Two patients had no information about drugs delivered; all other had initial platinum-based chemotherapy.
Table 2. Pathway Enrichment Analysis. Given a list of genes, the pathway enrichment analysis using the Kyoto Encyclopedia of Genes and Genomes (KEGG) database will select those pathways that are overrepresented in the gene list for each one of the clusters. It will also compute a p-value for the resulting pathways. * Statistically non-significant.
KEGG IDDescriptionp-ValueGene ID
Cluster 1
hsa04510Focal Adhesion<0.001COL1A2/COL5A1/COMPATGA5/PDGFRA
hsa05214Glioma0.015PDGFR1/PDGFRB/IGF1
hsa05218Melanoma0.019PDGFR1/PDGFRB/IGF1
hsa05215Prostate Cancer0.034PDGFR1/PDGFRB/IGF1
hsa04540Gap Junction0.034PDGFR1/PDGFRB/PRKX
hsa05414Dilated cardiomyopathy0.034ITGA5/PRKX/IGF1
hsa04512ECM-Receptor Interaction0.005COL1A2/COL5A1/COMP/ITGA5
hsa04270Vascular Smooth Muscle Contraction0.013ACTG2/CALD1/EDNRA/PRKX
Cluster 2
hsa04218Cellular senescence0.001NFATC2/RASSF5/SERPINE1/FBXW11
hsa04066HIF-1 signaling pathway0.040SERPINE1/EGLN1
hsa00450Seleno-compound metabolism0.053 *TXNRD2
hsa0 1040Biosynthesis of unsaturated fatty acids0.083 *SCD5
hsa04390Hippo signaling pathway0.086 *SERPINE1/FBXW11
hsa04310Wnt signaling pathway0.089 *NFATC2/FBXW11
Cluster 3
hsa04218Cellular senescence0.003NFATC2/RASSF5/SERPINE1
hsa00512Mucin type O-glycan biosynthesis0.056 *GALNT13

