Heme Oxygenase 1 Impairs Glucocorticoid Receptor Activity in Prostate Cancer

 ,
,  , , and
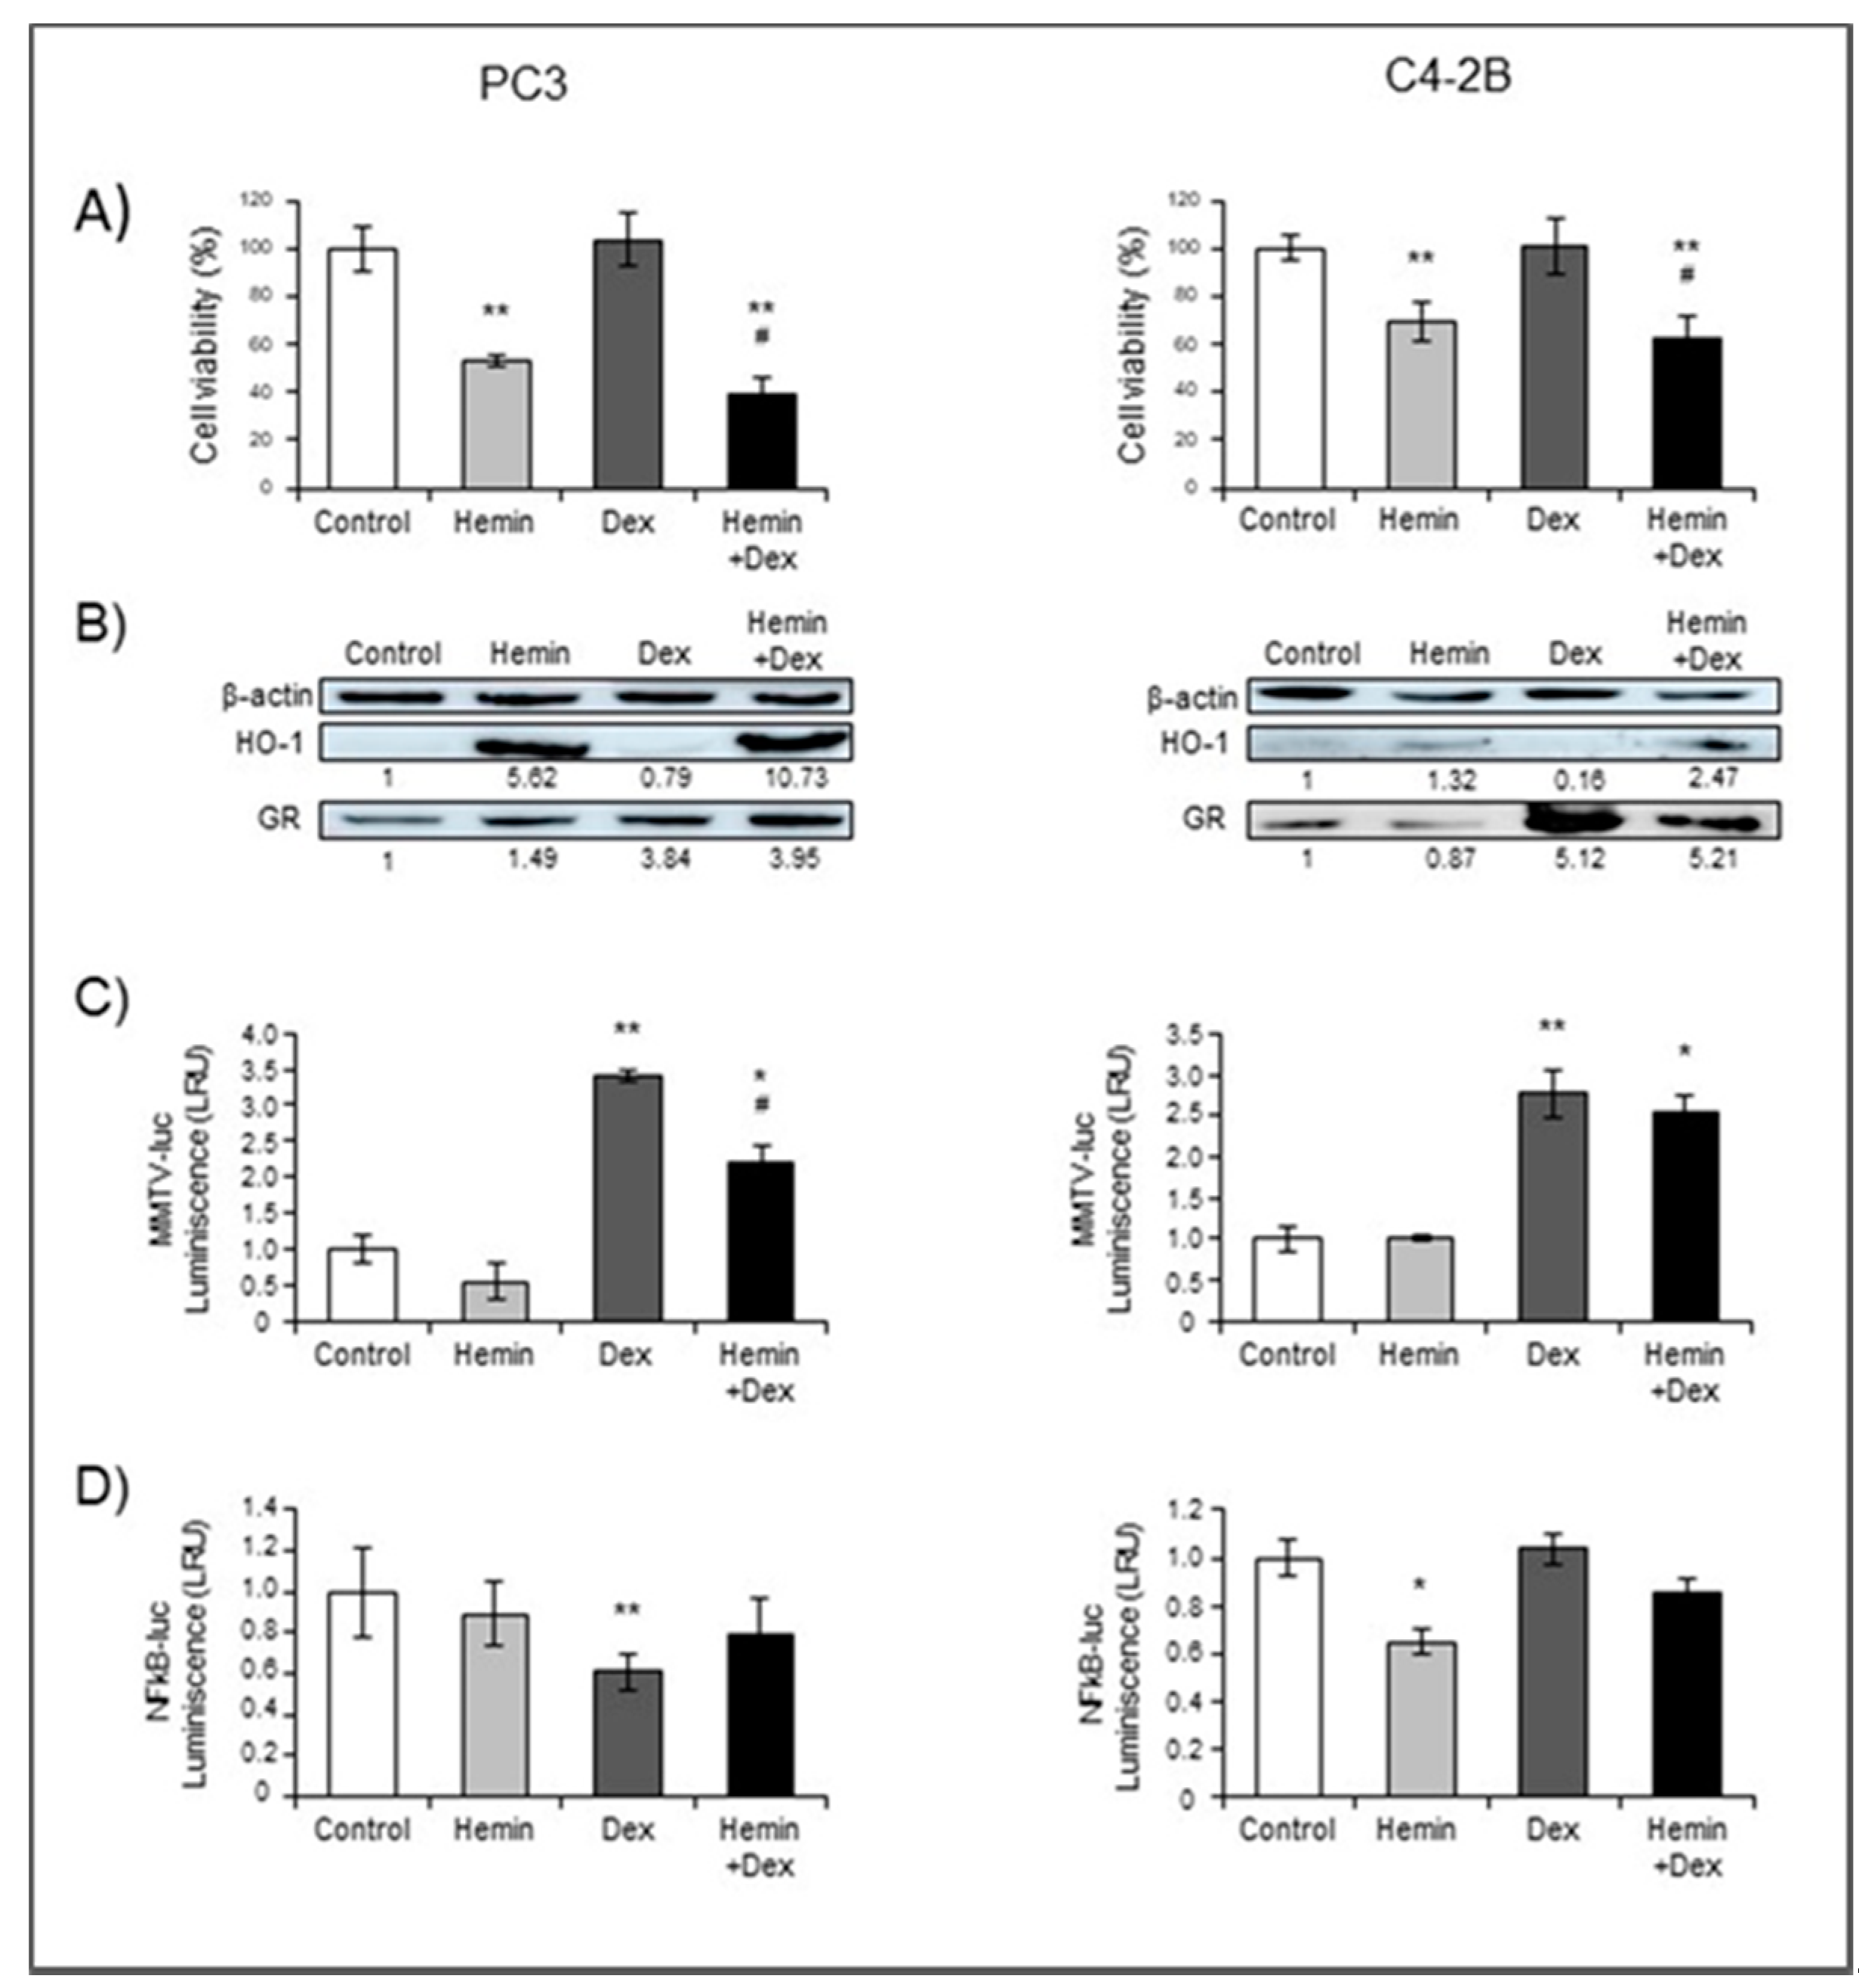
Abstract
:1. Introduction
2. Results
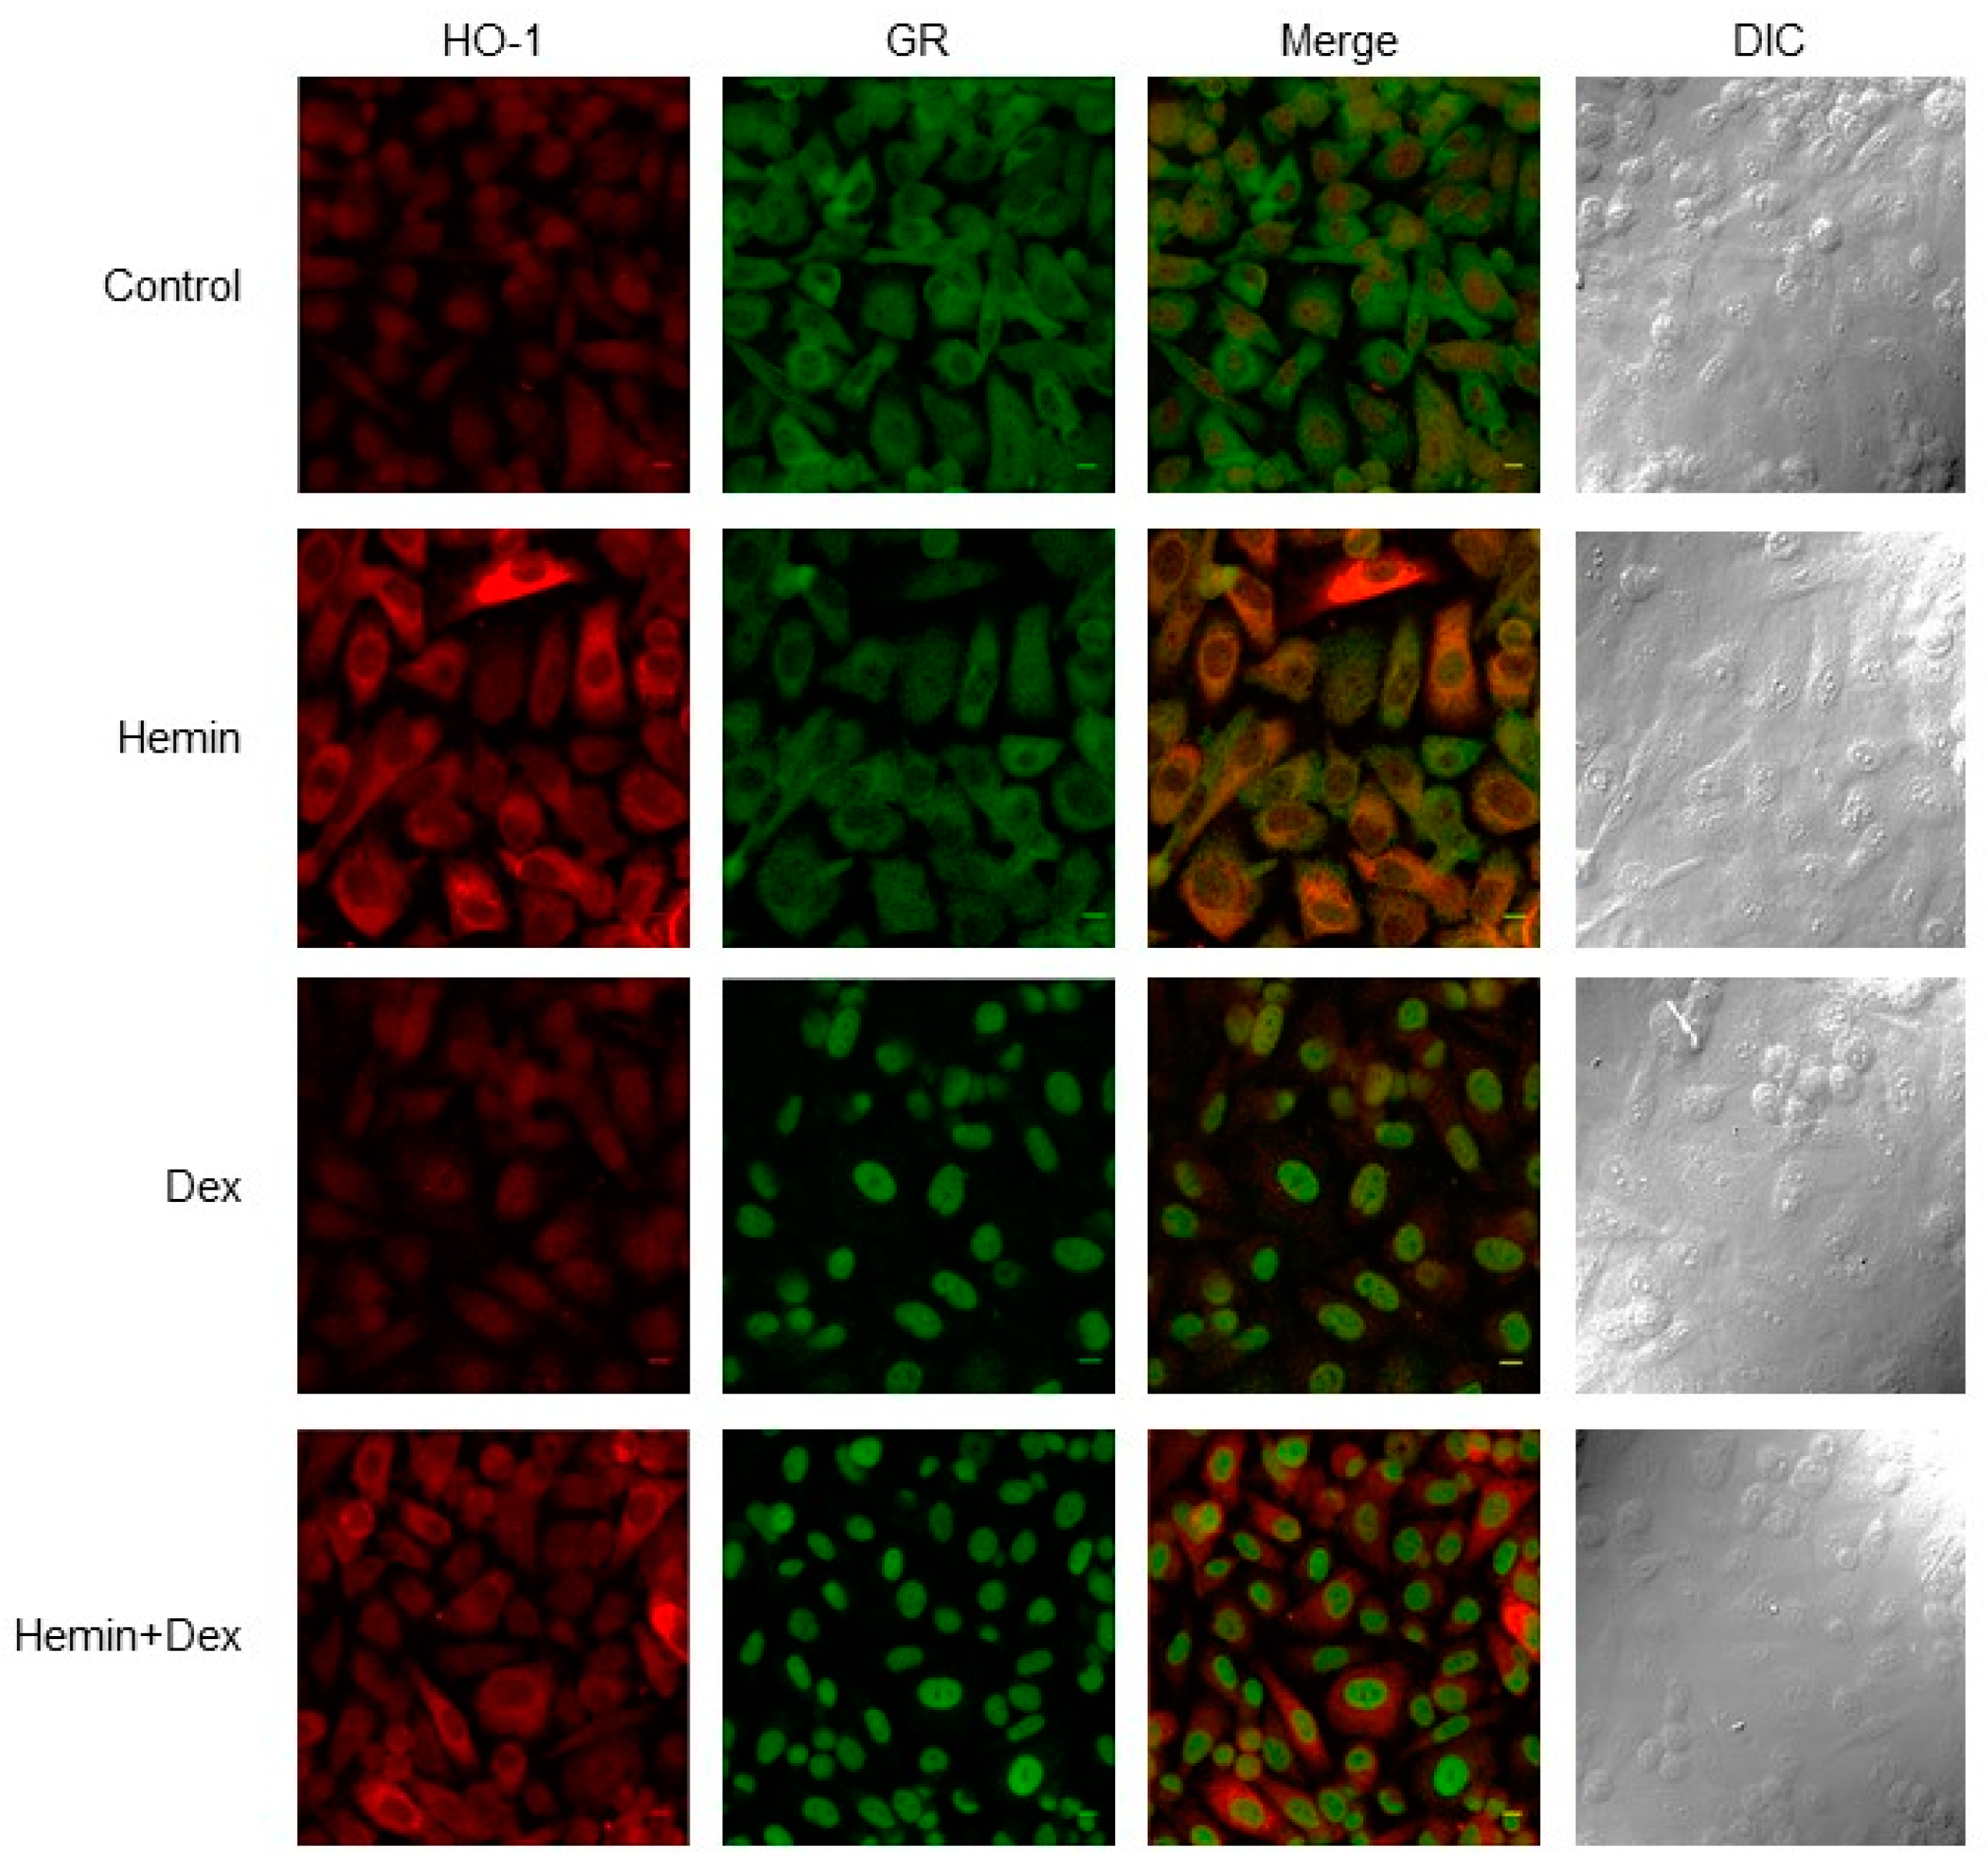
2.1. NR3C1 Expression and Signaling is Modulated by Hemin Treatment
2.2. Identification of Glucocorticoid Response Elements in HO-1 Proximal Promoter
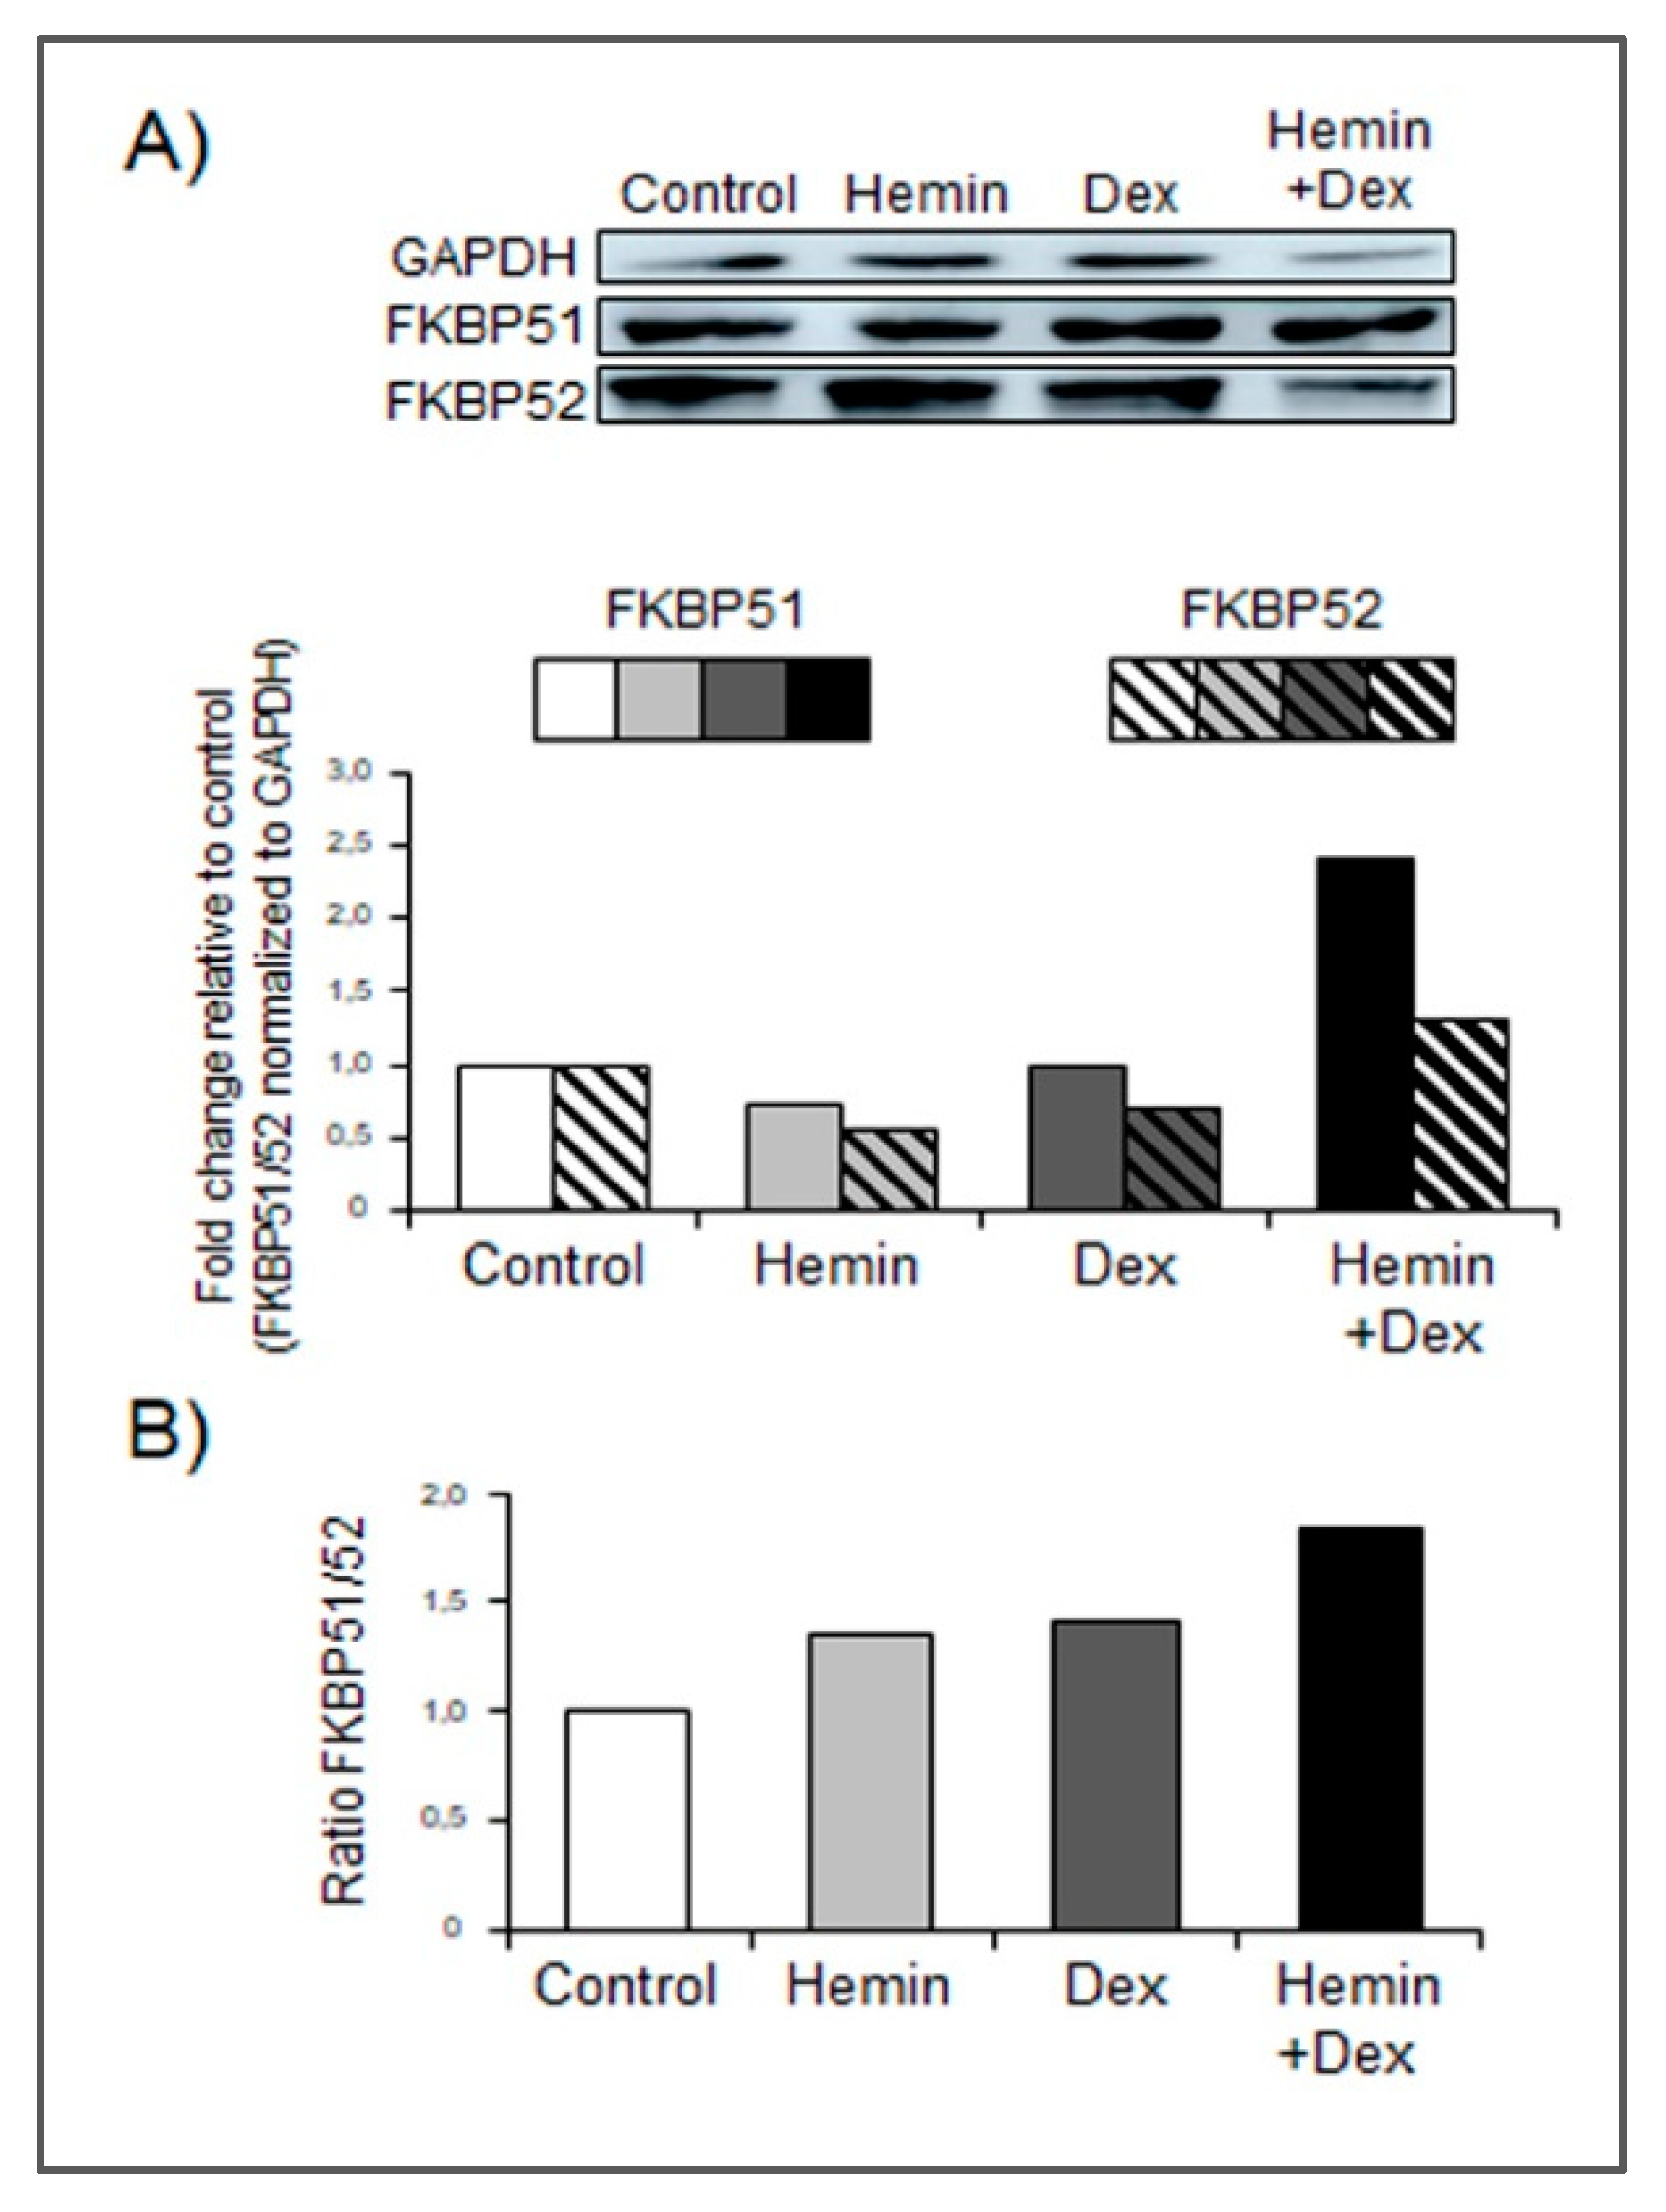
2.3. Hemin Treatment Increases FKBP51 Expression in the Presence of Dexamethasone
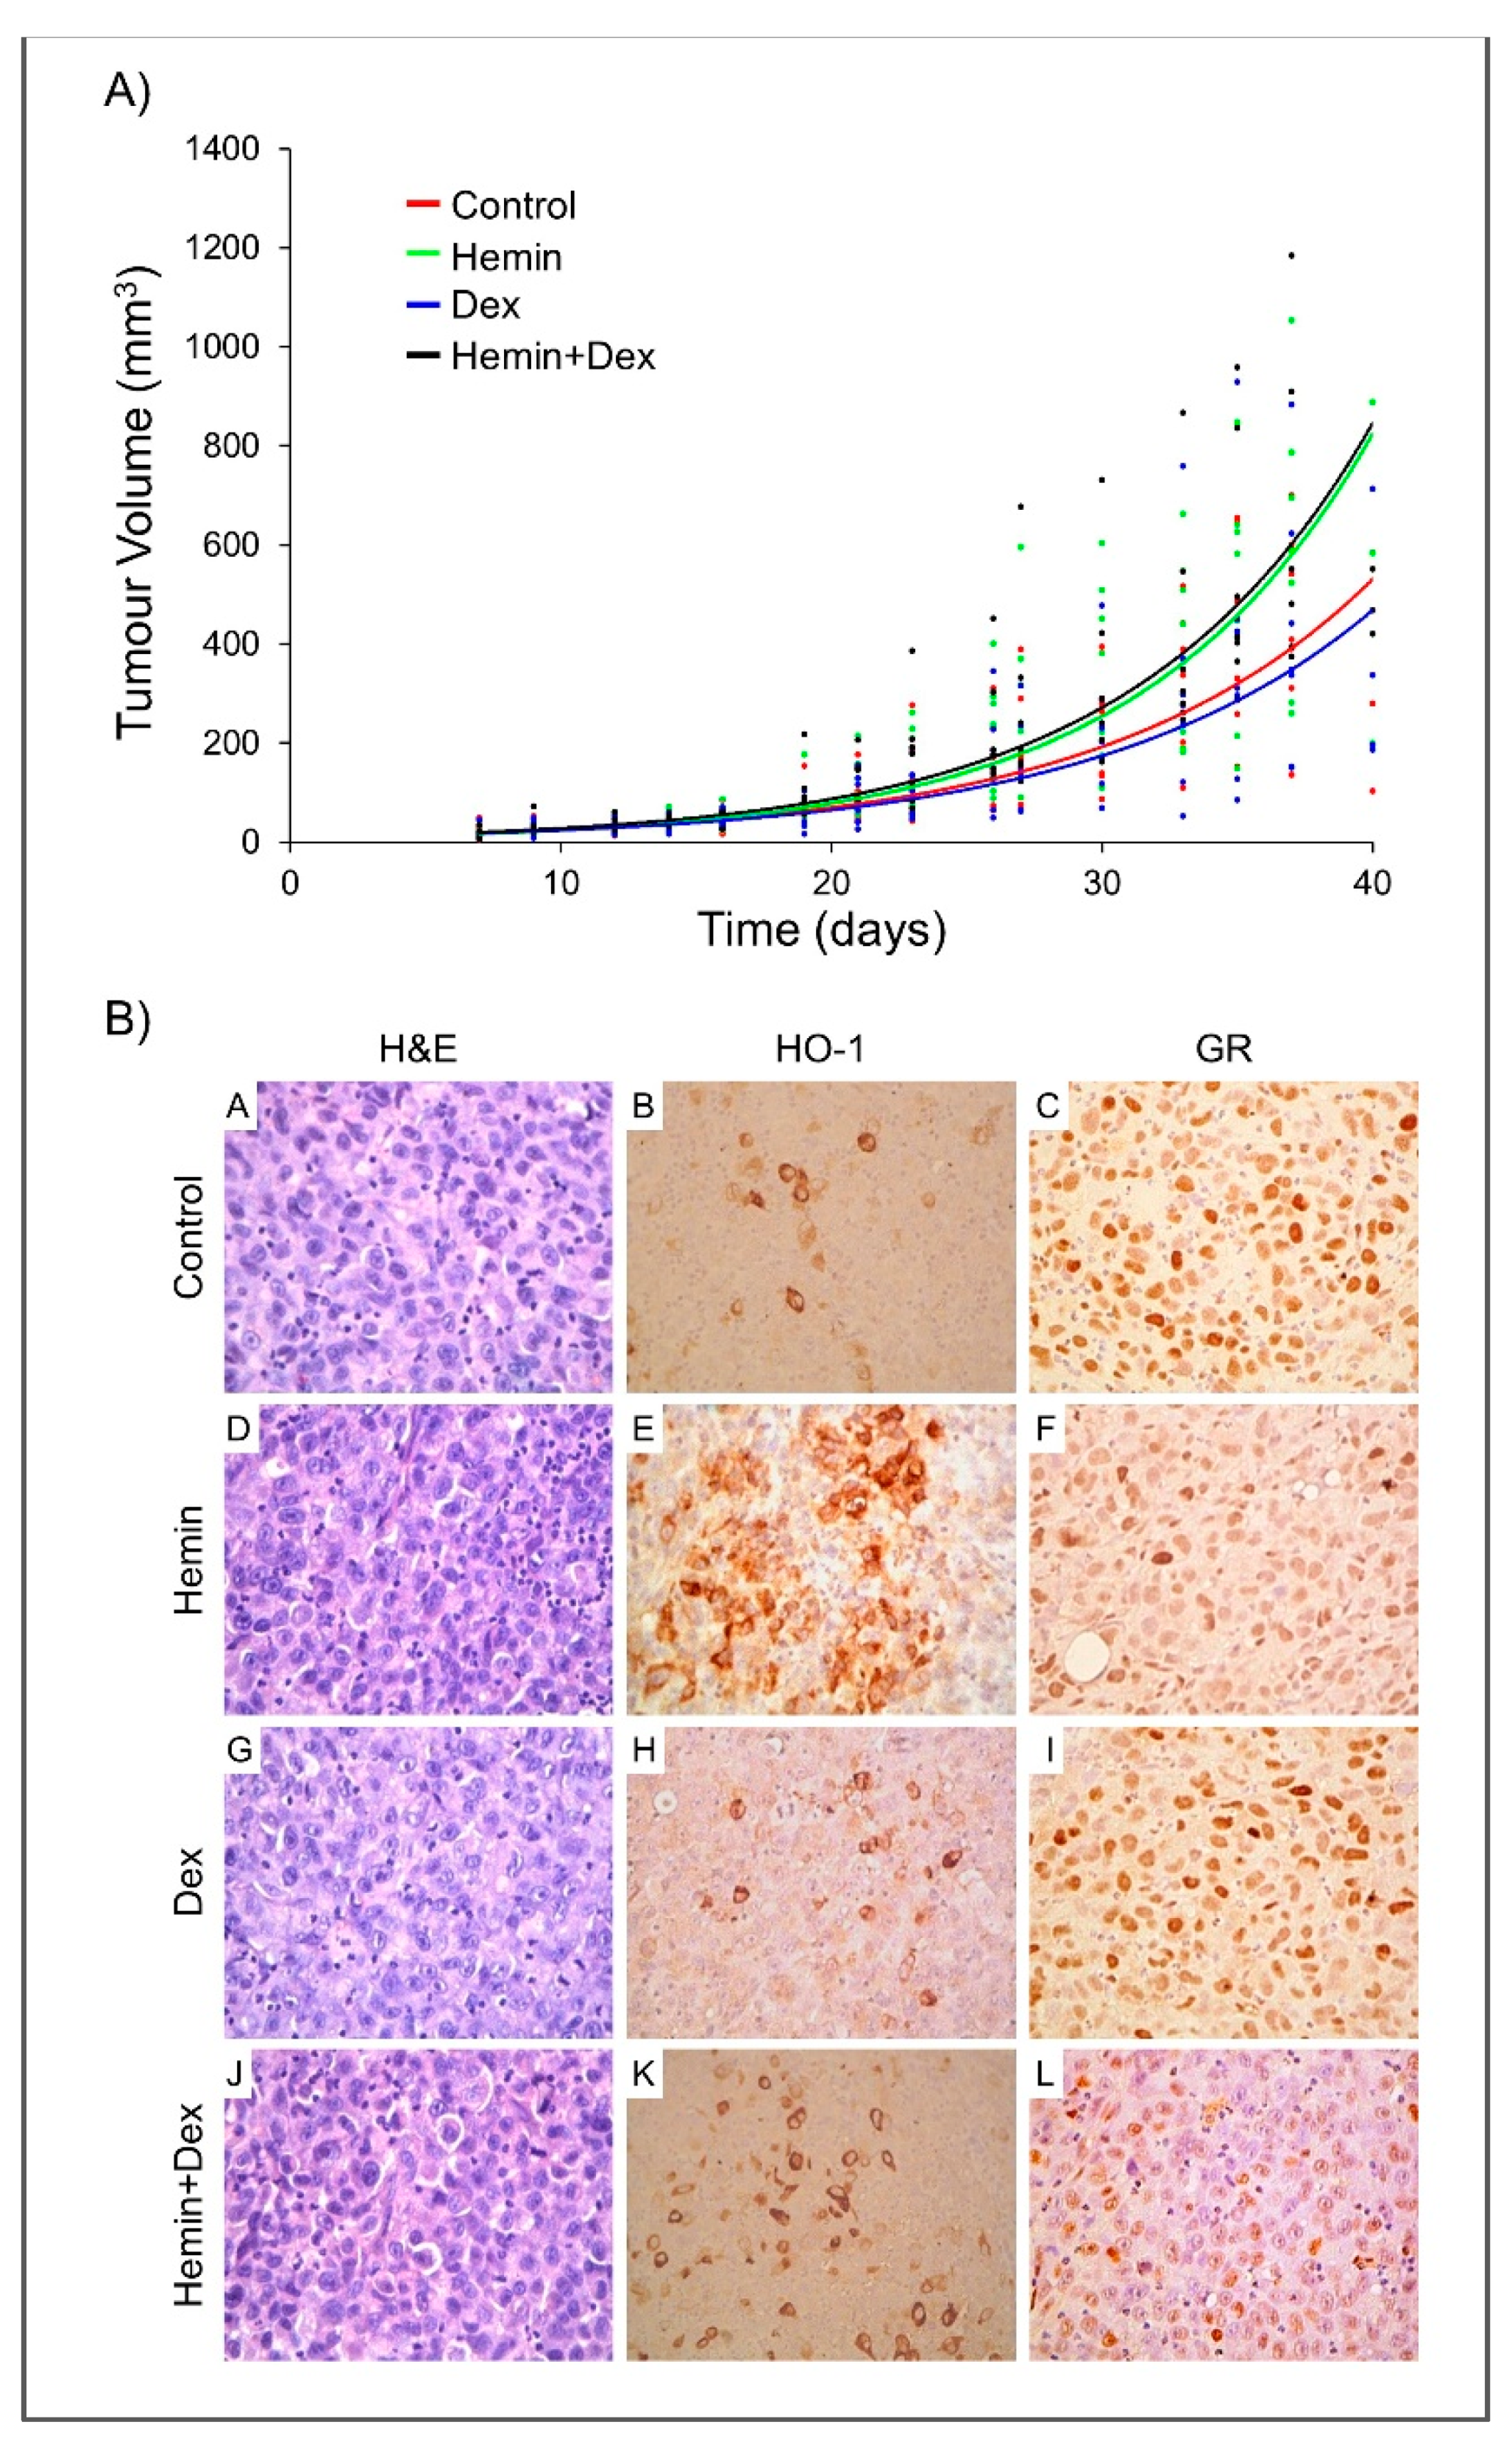
2.4. Study of Hemin and/or Dexamethasone Treatment in PC3 Xenografts
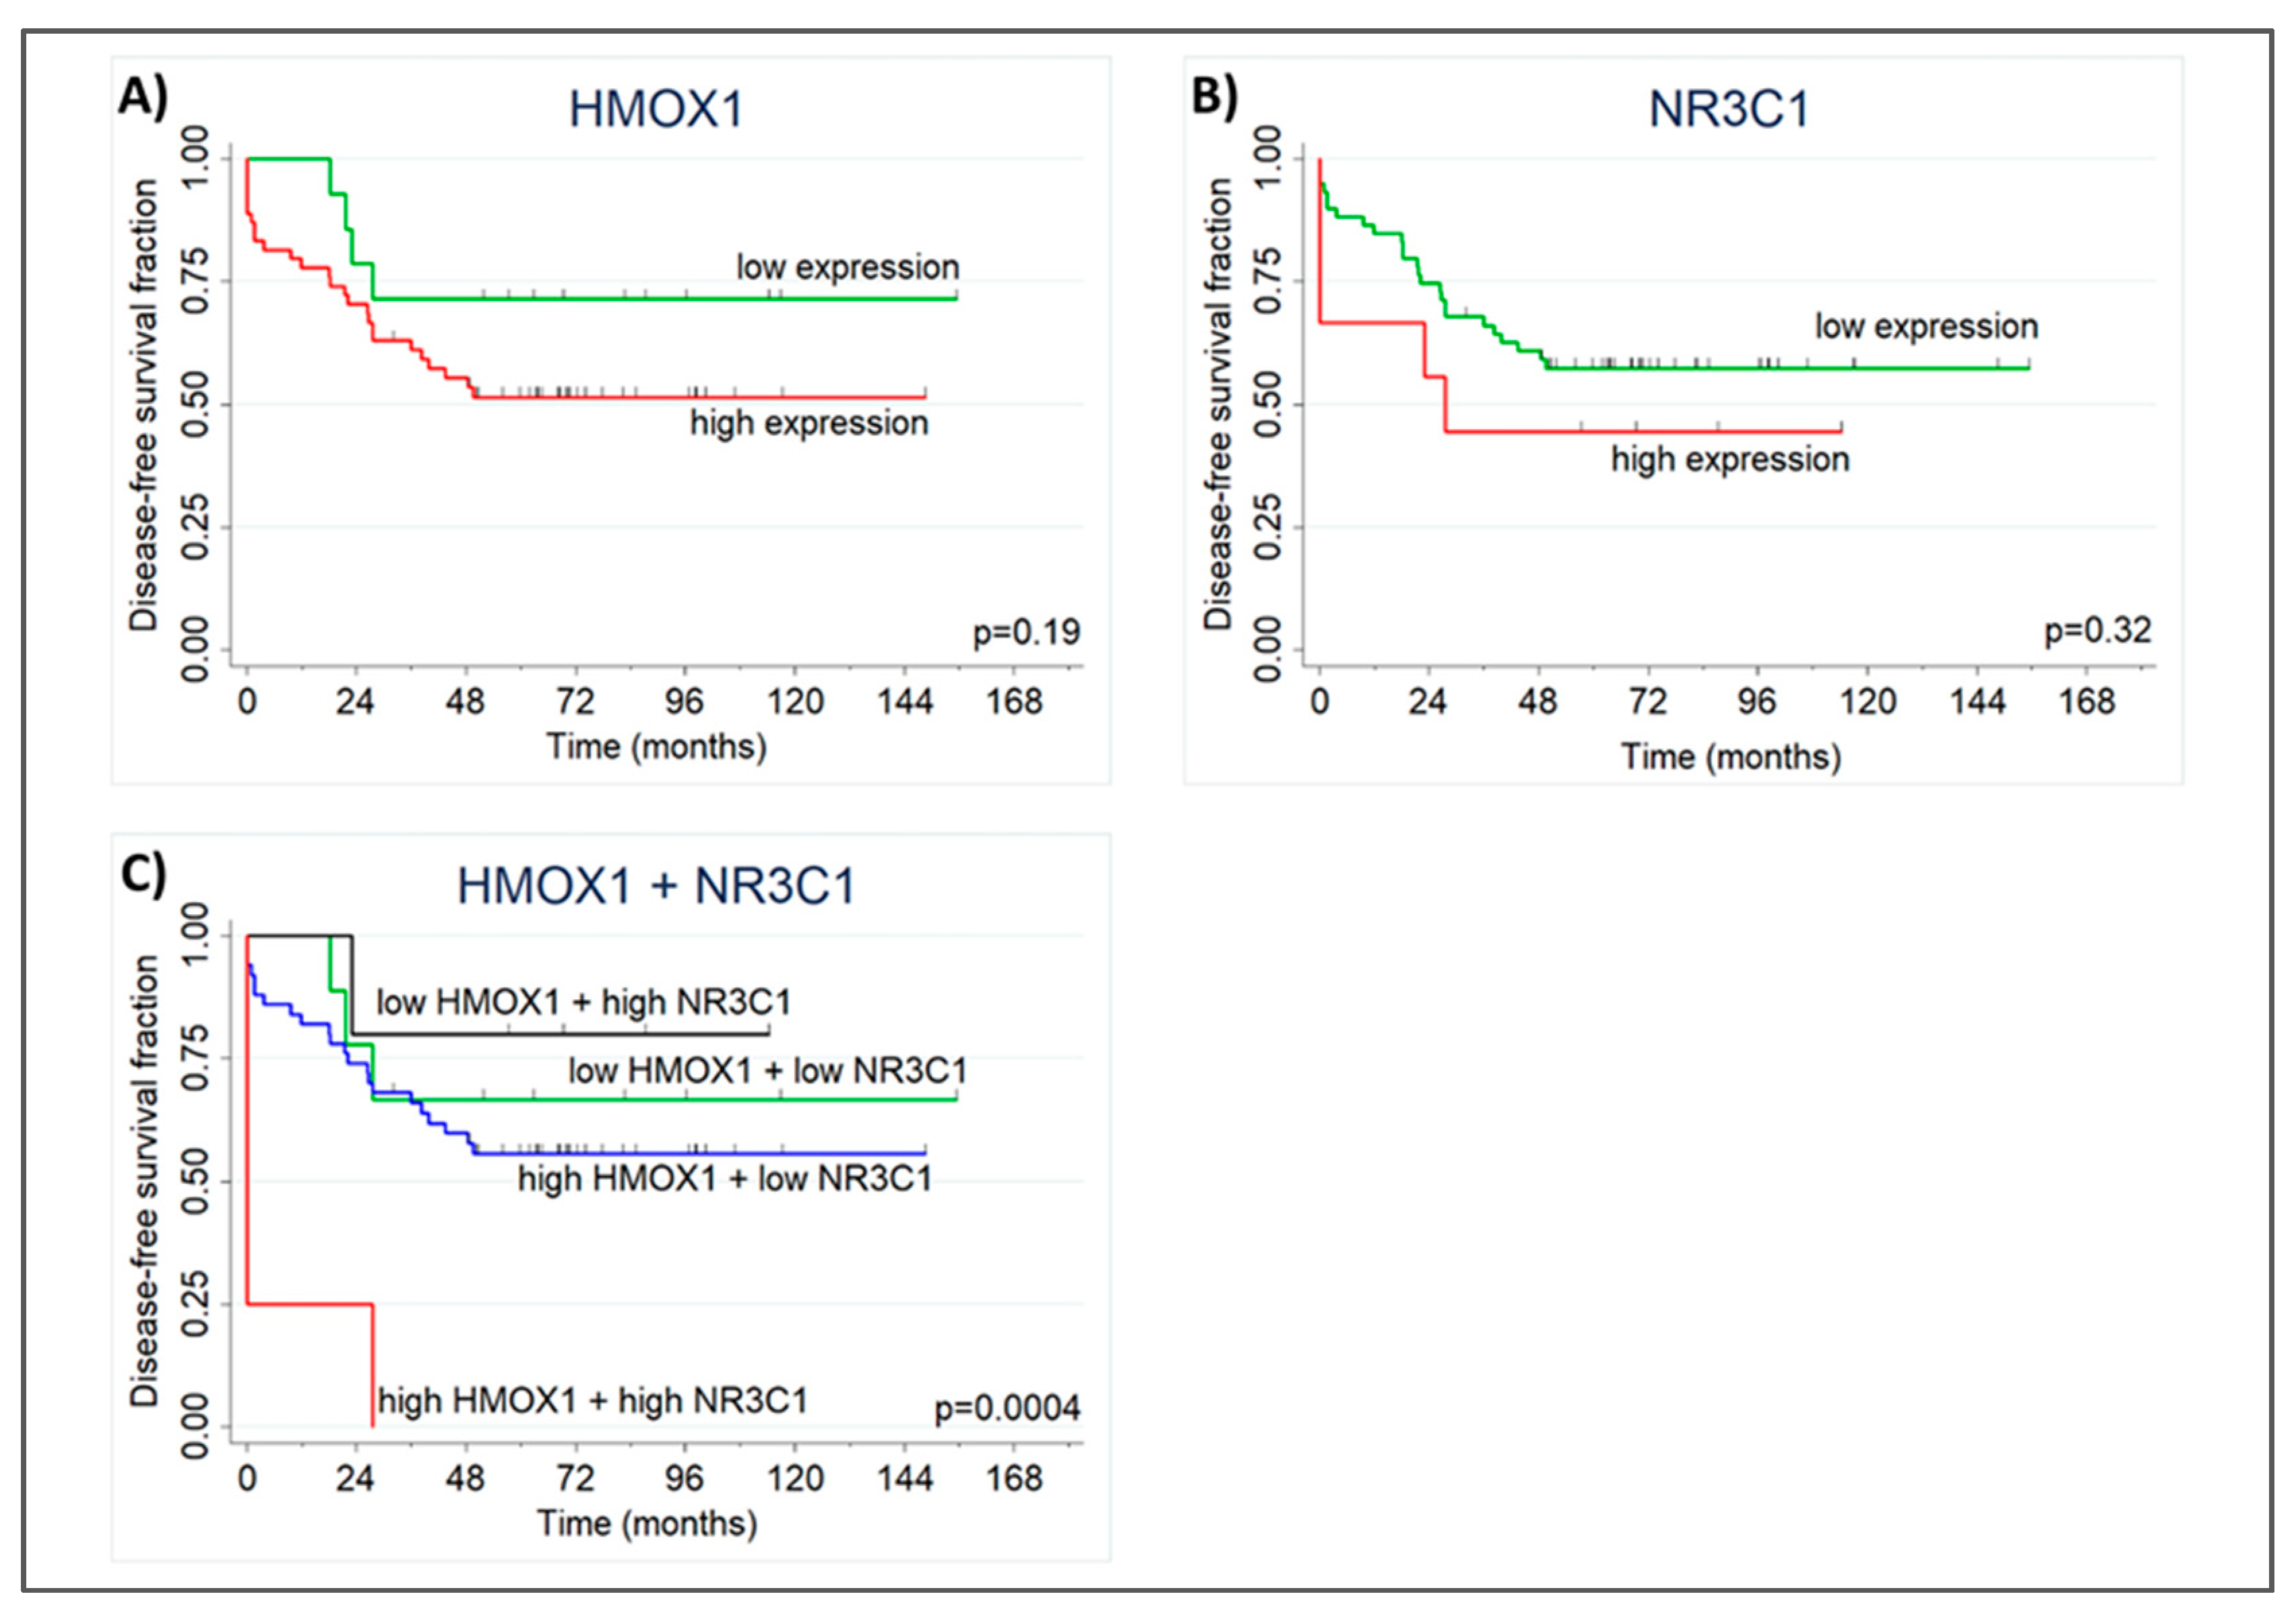
2.5. High NR3C1 and HMOX1 Expression Reduces PCa-patient Disease-Free Survival
3. Discussion
4. Materials and Methods
4.1. In Vitro Experiments
4.1.1. Cell Culture and Treatments
4.1.2. Transfections and Luciferase Reporter Assay
4.1.3. RNA Isolation and Reverse Transcription–Quantitative PCR (RTqPCR)
4.1.4. Immunoblot Analysis and Antibodies
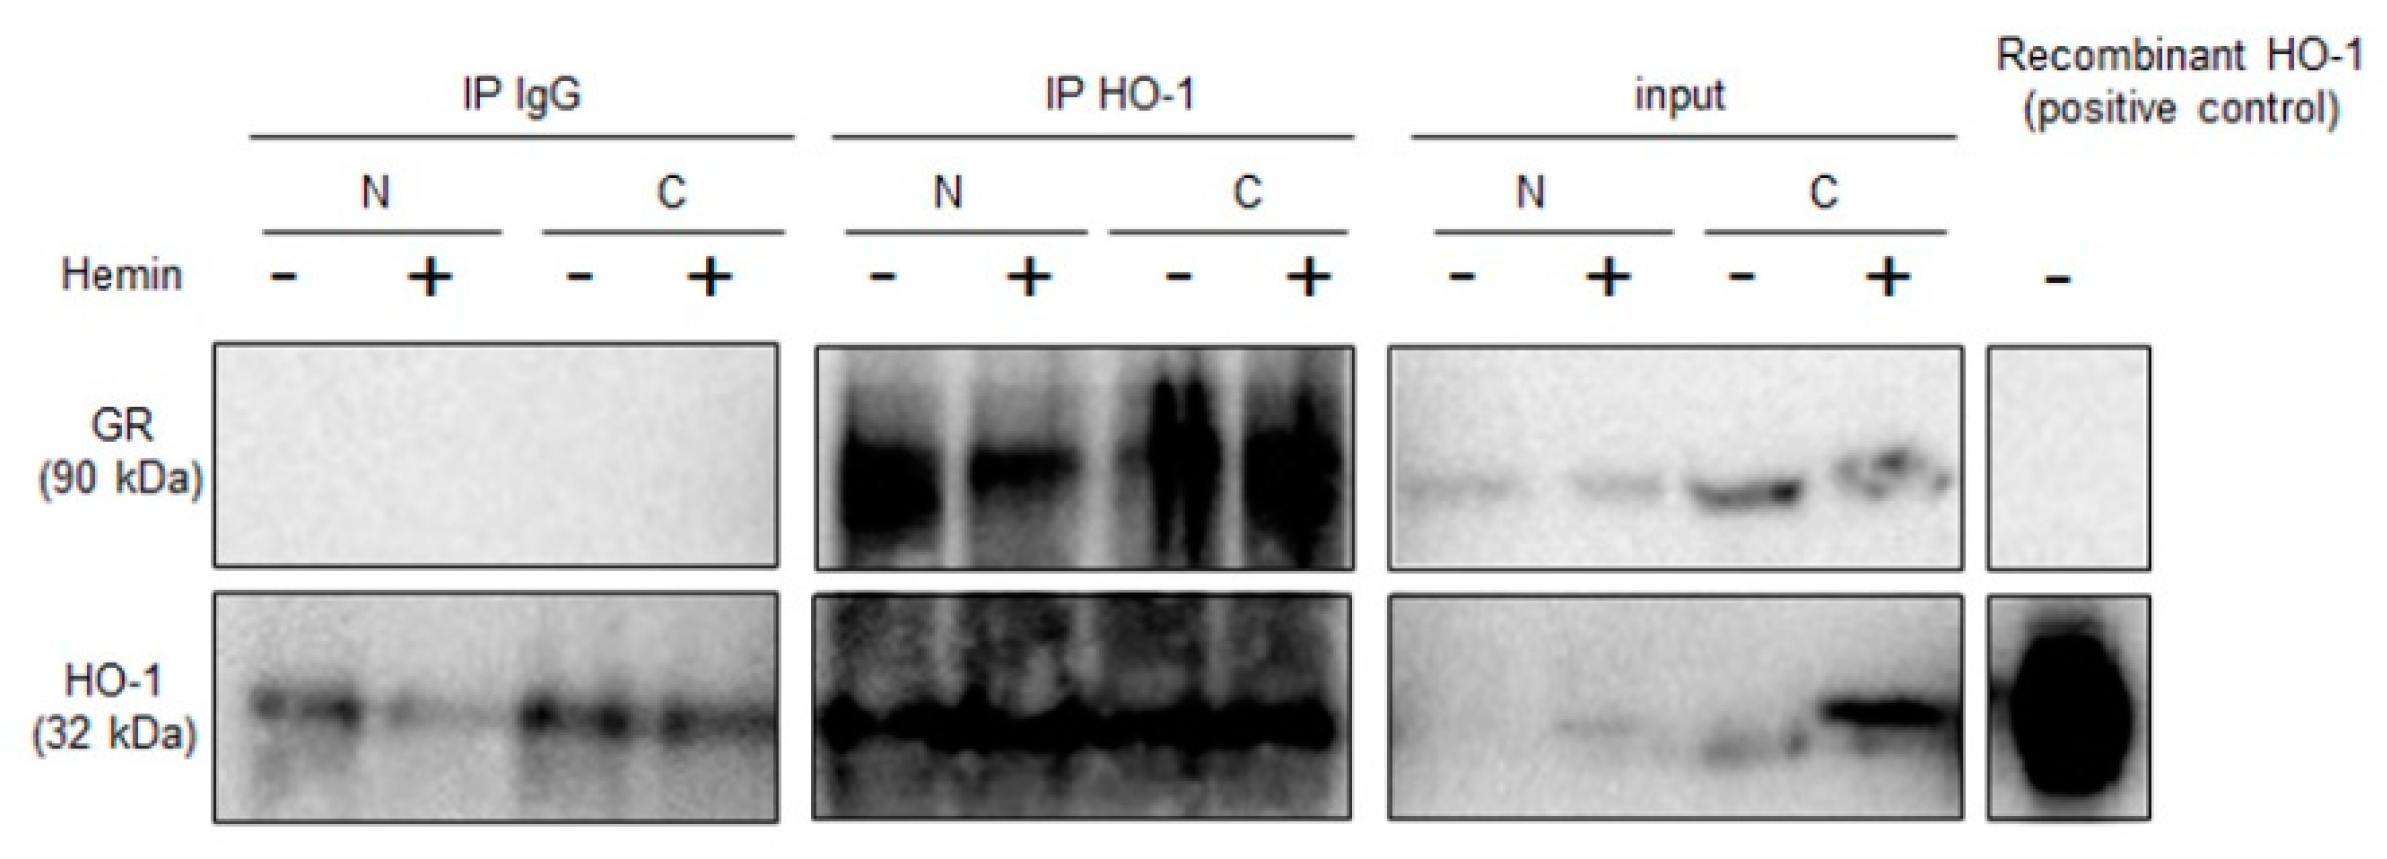
4.1.5. Co-Immunoprecipitation
4.1.6. Immunofluorescence and Microscopy
4.1.7. Statistical Analysis
4.2. In Vivo Experiments
4.2.1. Human PCa Xenograft Model
4.2.2. Immunohistochemical Analyses
4.2.3. Statistical Analysis
4.3. In Silico Analyses
4.3.1. HMOX1 Promoter Analysis
4.3.2. Analysis of Human Tumor Samples
Supplementary Materials
Author Contributions
Acknowledgments
Conflicts of Interest
References
- Galigniana, M.D.; Echeverria, P.C.; Erlejman, A.G.; Piwien-Pilipuk, G. Role of molecular chaperones and TPR-domain proteins in the cytoplasmic transport of steroid receptors and their passage through the nuclear pore. Nucleus 2010, 1, 299–308. [Google Scholar] [CrossRef] [PubMed] [Green Version]
- Arora, V.K.; Schenkein, E.; Murali, R.; Subudhi, S.K.; Wongvipat, J.; Balbas, M.D.; Shah, N.; Cai, L.; Efstathiou, E.; Logothetis, C.; et al. Glucocorticoid receptor confers resistance to antiandrogens by bypassing androgen receptor blockade. Cell 2013, 155, 1309–1322. [Google Scholar] [CrossRef] [PubMed]
- Shah, N.; Wang, P.; Wongvipat, J.; Karthaus, W.R.; Abida, W.; Armenia, J.; Rockowitz, S.; Drier, Y.; Bernstein, B.E.; Long, H.W.; et al. Regulation of the glucocorticoid receptor via a BET-dependent enhancer drives antiandrogen resistance in prostate cancer. eLife 2017, 6. [Google Scholar] [CrossRef] [PubMed] [Green Version]
- Xie, N.; Cheng, H.; Lin, D.; Liu, L.; Yang, O.; Jia, L.; Fazli, L.; Gleave, M.E.; Wang, Y.; Rennie, P.; et al. The expression of glucocorticoid receptor is negatively regulated by active androgen receptor signaling in prostate tumors. Int. J. Cancer 2015, 136, E27–E38. [Google Scholar] [CrossRef] [PubMed]
- Jozkowicz, A.; Was, H.; Dulak, J. Heme oxygenase-1 in tumors: Is it a false friend? Antioxid. Redox Signal. 2007, 9, 2099–2117. [Google Scholar] [CrossRef] [PubMed]
- Gueron, G.; De Siervi, A.; Ferrando, M.; Salierno, M.; De Luca, P.; Elguero, B.; Meiss, R.; Navone, N.; Vazquez, E.S. Critical role of endogenous heme oxygenase 1 as a tuner of the invasive potential of prostate cancer cells. Mol. Cancer Res. 2009, 7, 1745–1755. [Google Scholar] [CrossRef] [PubMed]
- Ferrando, M.; Gueron, G.; Elguero, B.; Giudice, J.; Salles, A.; Leskow, F.C.; Jares-Erijman, E.A.; Colombo, L.; Meiss, R.; Navone, N.; et al. Heme oxygenase 1 (HO-1) challenges the angiogenic switch in prostate cancer. Angiogenesis 2011, 14, 467–479. [Google Scholar] [CrossRef] [PubMed]
- Elguero, B.; Gueron, G.; Giudice, J.; Toscani, M.A.; De Luca, P.; Zalazar, F.; Coluccio-Leskow, F.; Meiss, R.; Navone, N.; De Siervi, A.; et al. Unveiling the association of STAT3 and HO-1 in prostate cancer: Role beyond heme degradation. Neoplasia 2012, 14, 1043–1056. [Google Scholar] [CrossRef] [PubMed]
- Gandini, N.A.; Fermento, M.E.; Salomon, D.G.; Blasco, J.; Patel, V.; Gutkind, J.S.; Molinolo, A.A.; Facchinetti, M.M.; Curino, A.C. Nuclear localization of heme oxygenase-1 is associated with tumor progression of head and neck squamous cell carcinomas. Exp. Mol. Pathol. 2012, 93, 237–245. [Google Scholar] [CrossRef] [PubMed]
- Hsu, F.F.; Yeh, C.T.; Sun, Y.J.; Chiang, M.T.; Lan, W.M.; Li, F.A.; Lee, W.H.; Chau, L.Y. Signal peptide peptidase-mediated nuclear localization of heme oxygenase-1 promotes cancer cell proliferation and invasion independent of its enzymatic activity. Oncogene 2015, 34, 2360–2370. [Google Scholar] [CrossRef] [PubMed]
- Sacca, P.; Meiss, R.; Casas, G.; Mazza, O.; Calvo, J.C.; Navone, N.; Vazquez, E. Nuclear translocation of haeme oxygenase-1 is associated to prostate cancer. Br. J. Cancer 2007, 97, 1683–1689. [Google Scholar] [CrossRef] [PubMed] [Green Version]
- Tibullo, D.; Barbagallo, I.; Giallongo, C.; La Cava, P.; Parrinello, N.; Vanella, L.; Stagno, F.; Palumbo, G.A.; Li Volti, G.; Di Raimondo, F. Nuclear translocation of heme oxygenase-1 confers resistance to imatinib in chronic myeloid leukemia cells. Curr. Pharm. Des. 2013, 19, 2765–2770. [Google Scholar] [CrossRef] [PubMed]
- Lutton, J.D.; da Silva, J.L.; Moqattash, S.; Brown, A.C.; Levere, R.D.; Abraham, N.G. Differential induction of heme oxygenase in the hepatocarcinoma cell line (Hep3B) by environmental agents. J. Cell. Biochem. 1992, 49, 259–265. [Google Scholar] [CrossRef] [PubMed]
- Lavrovsky, Y.; Drummond, G.S.; Abraham, N.G. Downregulation of the human heme oxygenase gene by glucocorticoids and identification of 56b regulatory elements. Biochem. Biophys. Res. Commun. 1996, 218, 759–765. [Google Scholar] [CrossRef] [PubMed]
- Deramaudt, T.B.; da Silva, J.L.; Remy, P.; Kappas, A.; Abraham, N.G. Negative regulation of human heme oxygenase in microvessel endothelial cells by dexamethasone. Proc. Soc. Exp. Biol. Med. 1999, 222, 185–193. [Google Scholar] [CrossRef] [PubMed]
- Vallelian, F.; Schaer, C.A.; Kaempfer, T.; Gehrig, P.; Duerst, E.; Schoedon, G.; Schaer, D.J. Glucocorticoid treatment skews human monocyte differentiation into a hemoglobin-clearance phenotype with enhanced heme-iron recycling and antioxidant capacity. Blood 2010, 116, 5347–5356. [Google Scholar] [CrossRef] [PubMed] [Green Version]
- Duzgun, A.; Bedir, A.; Ozdemir, T.; Nar, R.; Kilinc, V.; Salis, O.; Alacam, H.; Gulten, S. Effect of dexamethasone on unfolded protein response genes (MTJ1, Grp78, Grp94, CHOP, HMOX-1) in HEp2 cell line. Indian J. Biochem. Biophys. 2013, 50, 505–510. [Google Scholar] [PubMed]
- Deroo, B.J.; Rentsch, C.; Sampath, S.; Young, J.; DeFranco, D.B.; Archer, T.K. Proteasomal inhibition enhances glucocorticoid receptor transactivation and alters its subnuclear trafficking. Mol. Cell. Biol. 2002, 22, 4113–4123. [Google Scholar] [CrossRef] [PubMed]
- Silva, C.M.; Powell-Oliver, F.E.; Jewell, C.M.; Sar, M.; Allgood, V.E.; Cidlowski, J.A. Regulation of the human glucocorticoid receptor by long-term and chronic treatment with glucocorticoid. Steroids 1994, 59, 436–442. [Google Scholar] [CrossRef]
- Gueron, G.; Giudice, J.; Valacco, P.; Paez, A.; Elguero, B.; Toscani, M.; Jaworski, F.; Leskow, F.C.; Cotignola, J.; Marti, M.; et al. Heme-oxygenase-1 implications in cell morphology and the adhesive behavior of prostate cancer cells. Oncotarget 2014, 5, 4087–4102. [Google Scholar] [CrossRef] [PubMed] [Green Version]
- Paez, A.V.; Pallavicini, C.; Schuster, F.; Valacco, M.P.; Giudice, J.; Ortiz, E.G.; Anselmino, N.; Labanca, E.; Binaghi, M.; Salierno, M.; et al. Heme oxygenase-1 in the forefront of a multi-molecular network that governs cell-cell contacts and filopodia-induced zippering in prostate cancer. Cell Death Dis. 2016, 7, e2570. [Google Scholar] [CrossRef] [PubMed]
- Wochnik, G.M.; Ruegg, J.; Abel, G.A.; Schmidt, U.; Holsboer, F.; Rein, T. FK506-binding proteins 51 and 52 differentially regulate dynein interaction and nuclear translocation of the glucocorticoid receptor in mammalian cells. J. Biol. Chem. 2005, 280, 4609–4616. [Google Scholar] [CrossRef] [PubMed]
- Denny, W.B.; Valentine, D.L.; Reynolds, P.D.; Smith, D.F.; Scammell, J.G. Squirrel monkey immunophilin FKBP51 is a potent inhibitor of glucocorticoid receptor binding. Endocrinology 2000, 141, 4107–4113. [Google Scholar] [CrossRef] [PubMed]
- Galigniana, M.D.; Erlejman, A.G.; Monte, M.; Gomez-Sanchez, C.; Piwien-Pilipuk, G. The hsp90-FKBP52 complex links the mineralocorticoid receptor to motor proteins and persists bound to the receptor in early nuclear events. Mol. Cell. Biol. 2010, 30, 1285–1298. [Google Scholar] [CrossRef] [PubMed]
- Loboda, A.; Damulewicz, M.; Pyza, E.; Jozkowicz, A.; Dulak, J. Role of Nrf2/HO-1 system in development, oxidative stress response and diseases: An evolutionarily conserved mechanism. Cell. Mol. Life Sci. 2016, 73, 3221–3247. [Google Scholar] [CrossRef] [PubMed]
- Namani, A.; Li, Y.; Wang, X.J.; Tang, X. Modulation of NRF2 signaling pathway by nuclear receptors: Implications for cancer. Biochim. Biophys. Acta 2014, 1843, 1875–1885. [Google Scholar] [CrossRef] [PubMed] [Green Version]
- Kratschmar, D.V.; Calabrese, D.; Walsh, J.; Lister, A.; Birk, J.; Appenzeller-Herzog, C.; Moulin, P.; Goldring, C.E.; Odermatt, A. Suppression of the Nrf2-dependent antioxidant response by glucocorticoids and 11beta-HSD1-mediated glucocorticoid activation in hepatic cells. PLoS ONE 2012, 7, e36774. [Google Scholar] [CrossRef] [PubMed]
- Iguchi, K.; Toyama, T.; Ito, T.; Shakui, T.; Usui, S.; Oyama, M.; Iinuma, M.; Hirano, K. Antiandrogenic activity of resveratrol analogs in prostate cancer LNCaP cells. J. Androl. 2012, 33, 1208–1215. [Google Scholar] [CrossRef] [PubMed]
- Puhr, M.; Hoefer, J.; Eigentler, A.; Ploner, C.; Handle, F.; Schaefer, G.; Kroon, J.; Leo, A.; Heidegger, I.; Eder, I.; et al. The Glucocorticoid Receptor Is a Key Player for Prostate Cancer Cell Survival and a Target for Improved Antiandrogen Therapy. Clin. Cancer Res. 2018, 24, 927–938. [Google Scholar] [CrossRef] [PubMed]
- Dorff, T.B.; Crawford, E.D. Management and challenges of corticosteroid therapy in men with metastatic castrate-resistant prostate cancer. Ann. Oncol. 2013, 24, 31–38. [Google Scholar] [CrossRef] [PubMed]
- Tuttle, R.M.; Loop, S.; Jones, R.E.; Meikle, A.W.; Ostenson, R.C.; Plymate, S.R. Effect of 5-alpha-reductase inhibition and dexamethasone administration on the growth characteristics and intratumor androgen levels of the human prostate cancer cell line PC-3. Prostate 1994, 24, 229–236. [Google Scholar] [CrossRef] [PubMed]
- Yano, A.; Fujii, Y.; Iwai, A.; Kageyama, Y.; Kihara, K. Glucocorticoids suppress tumor angiogenesis and in vivo growth of prostate cancer cells. Clin. Cancer Res. 2006, 12, 3003–3009. [Google Scholar] [CrossRef] [PubMed]
- Jaworski, F.M.; Gentilini, L.D.; Gueron, G.; Meiss, R.P.; Ortiz, E.G.; Berguer, P.M.; Ahmed, A.; Navone, N.; Rabinovich, G.A.; Compagno, D.; et al. In Vivo Hemin Conditioning Targets the Vascular and Immunologic Compartments and Restrains Prostate Tumor Development. Clin. Cancer Res. 2017, 23, 5135–5148. [Google Scholar] [CrossRef] [PubMed] [Green Version]
- Halin Bergstrom, S.; Nilsson, M.; Adamo, H.; Thysell, E.; Jernberg, E.; Stattin, P.; Widmark, A.; Wikstrom, P.; Bergh, A. Extratumoral Heme Oxygenase-1 (HO-1) Expressing Macrophages Likely Promote Primary and Metastatic Prostate Tumor Growth. PLoS ONE 2016, 11, e0157280. [Google Scholar] [CrossRef] [PubMed]
- Nemeth, Z.; Li, M.; Csizmadia, E.; Dome, B.; Johansson, M.; Persson, J.L.; Seth, P.; Otterbein, L.; Wegiel, B. Heme oxygenase-1 in macrophages controls prostate cancer progression. Oncotarget 2015, 6, 33675–33688. [Google Scholar] [CrossRef] [PubMed] [Green Version]
- Livak, K.J.; Schmittgen, T.D. Analysis of relative gene expression data using real-time quantitative PCR and the 2(-Delta Delta C(T)) Method. Methods 2001, 25, 402–408. [Google Scholar] [CrossRef] [PubMed]
- Workman, P.; Balmain, A.; Hickman, J.A.; McNally, N.J.; Rohas, A.M.; Mitchison, N.A.; Pierrepoint, C.G.; Raymond, R.; Rowlatt, C.; Stephens, T.C.; et al. UKCCCR guidelines for the welfare of animals in experimental neoplasia. Lab. Anim. 1988, 22, 195–201. [Google Scholar] [CrossRef] [PubMed]
- Bailey, T.L.; Boden, M.; Buske, F.A.; Frith, M.; Grant, C.E.; Clementi, L.; Ren, J.; Li, W.W.; Noble, W.S. MEME SUITE: Tools for motif discovery and searching. Nucleic Acids Res. 2009, 37, W202–W208. [Google Scholar] [CrossRef] [PubMed]
- Liu, T.; Ortiz, J.A.; Taing, L.; Meyer, C.A.; Lee, B.; Zhang, Y.; Shin, H.; Wong, S.S.; Ma, J.; Lei, Y.; et al. Cistrome: An integrative platform for transcriptional regulation studies. Genome Biol. 2011, 12, R83. [Google Scholar] [CrossRef] [PubMed]
- Sandelin, A.; Alkema, W.; Engstrom, P.; Wasserman, W.W.; Lenhard, B. JASPAR: An open-access database for eukaryotic transcription factor binding profiles. Nucleic Acids Res. 2004, 32, D91–D94. [Google Scholar] [CrossRef] [PubMed]
- Long, Q.; Xu, J.; Osunkoya, A.O.; Sannigrahi, S.; Johnson, B.A.; Zhou, W.; Gillespie, T.; Park, J.Y.; Nam, R.K.; Sugar, L.; et al. Global transcriptome analysis of formalin-fixed prostate cancer specimens identifies biomarkers of disease recurrence. Cancer Res. 2014, 74, 3228–3237. [Google Scholar] [CrossRef] [PubMed]

© 2019 by the authors. Licensee MDPI, Basel, Switzerland. This article is an open access article distributed under the terms and conditions of the Creative Commons Attribution (CC BY) license (http://creativecommons.org/licenses/by/4.0/).
Share and Cite
Leonardi, D.B.; Anselmino, N.; Brandani, J.N.; Jaworski, F.M.; Páez, A.V.; Mazaira, G.; Meiss, R.P.; Nuñez, M.; Nemirovsky, S.I.; Giudice, J.; et al. Heme Oxygenase 1 Impairs Glucocorticoid Receptor Activity in Prostate Cancer. Int. J. Mol. Sci. 2019, 20, 1006. https://doi.org/10.3390/ijms20051006
Leonardi DB, Anselmino N, Brandani JN, Jaworski FM, Páez AV, Mazaira G, Meiss RP, Nuñez M, Nemirovsky SI, Giudice J, et al. Heme Oxygenase 1 Impairs Glucocorticoid Receptor Activity in Prostate Cancer. International Journal of Molecular Sciences. 2019; 20(5):1006. https://doi.org/10.3390/ijms20051006
Chicago/Turabian StyleLeonardi, Daiana B., Nicolás Anselmino, Javier N. Brandani, Felipe M. Jaworski, Alejandra V. Páez, Gisela Mazaira, Roberto P. Meiss, Myriam Nuñez, Sergio I. Nemirovsky, Jimena Giudice, and et al. 2019. "Heme Oxygenase 1 Impairs Glucocorticoid Receptor Activity in Prostate Cancer" International Journal of Molecular Sciences 20, no. 5: 1006. https://doi.org/10.3390/ijms20051006
APA StyleLeonardi, D. B., Anselmino, N., Brandani, J. N., Jaworski, F. M., Páez, A. V., Mazaira, G., Meiss, R. P., Nuñez, M., Nemirovsky, S. I., Giudice, J., Galigniana, M., Pecci, A., Gueron, G., Vazquez, E., & Cotignola, J. (2019). Heme Oxygenase 1 Impairs Glucocorticoid Receptor Activity in Prostate Cancer. International Journal of Molecular Sciences, 20(5), 1006. https://doi.org/10.3390/ijms20051006