The Evolution and Biocatalysis of FAD2 Indicate Its Correlation to the Content of Seed Oil in Plants

 ,
,
Abstract
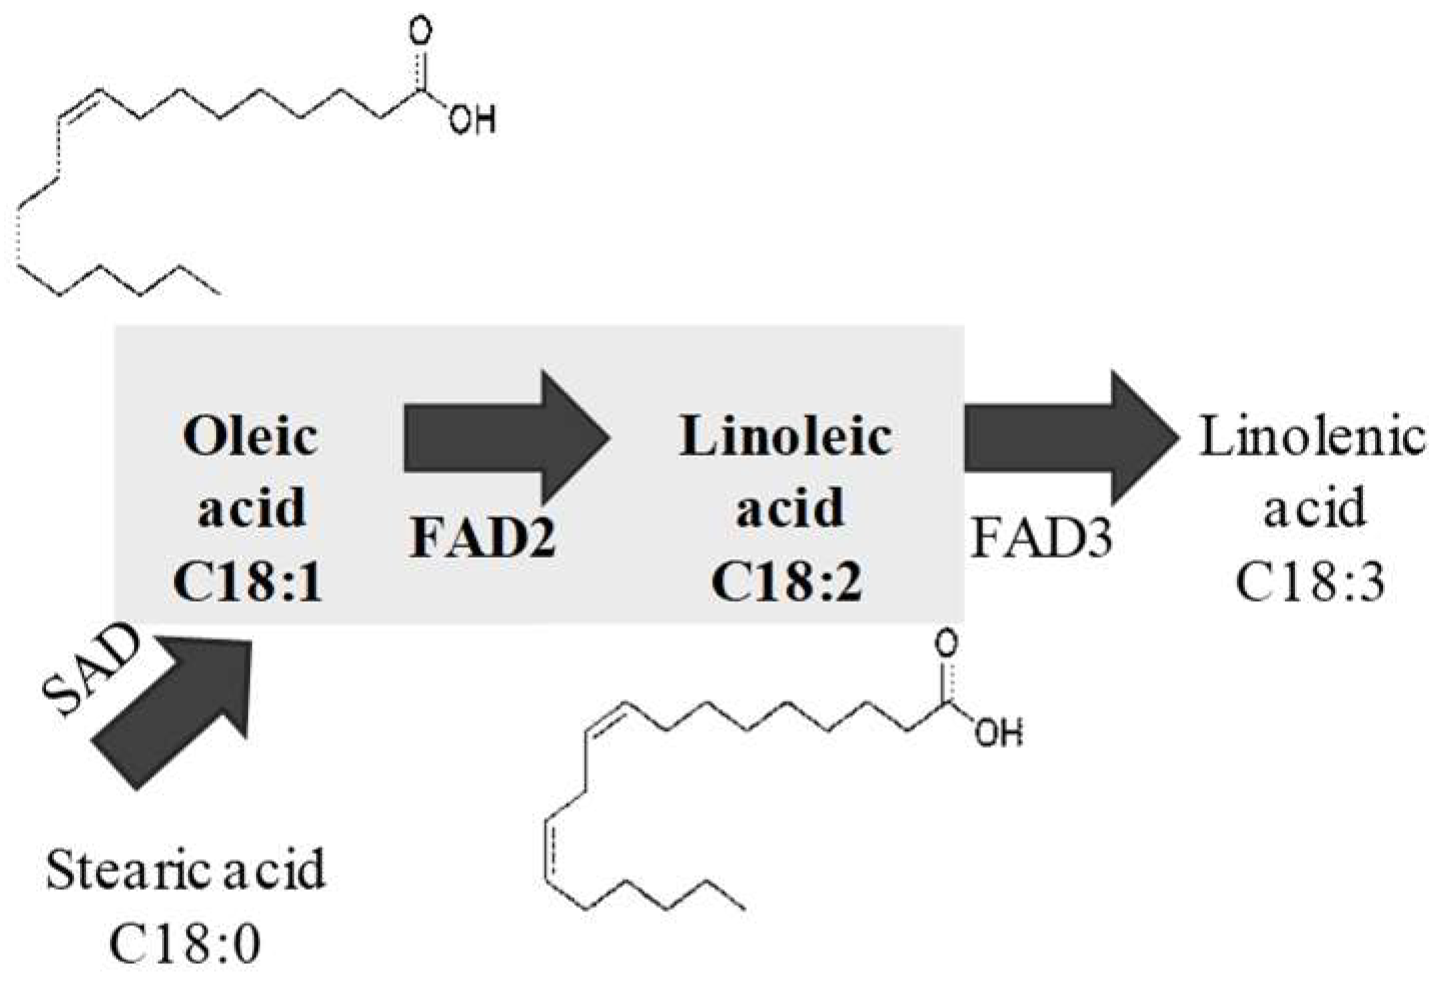
:1. Introduction
2. Results
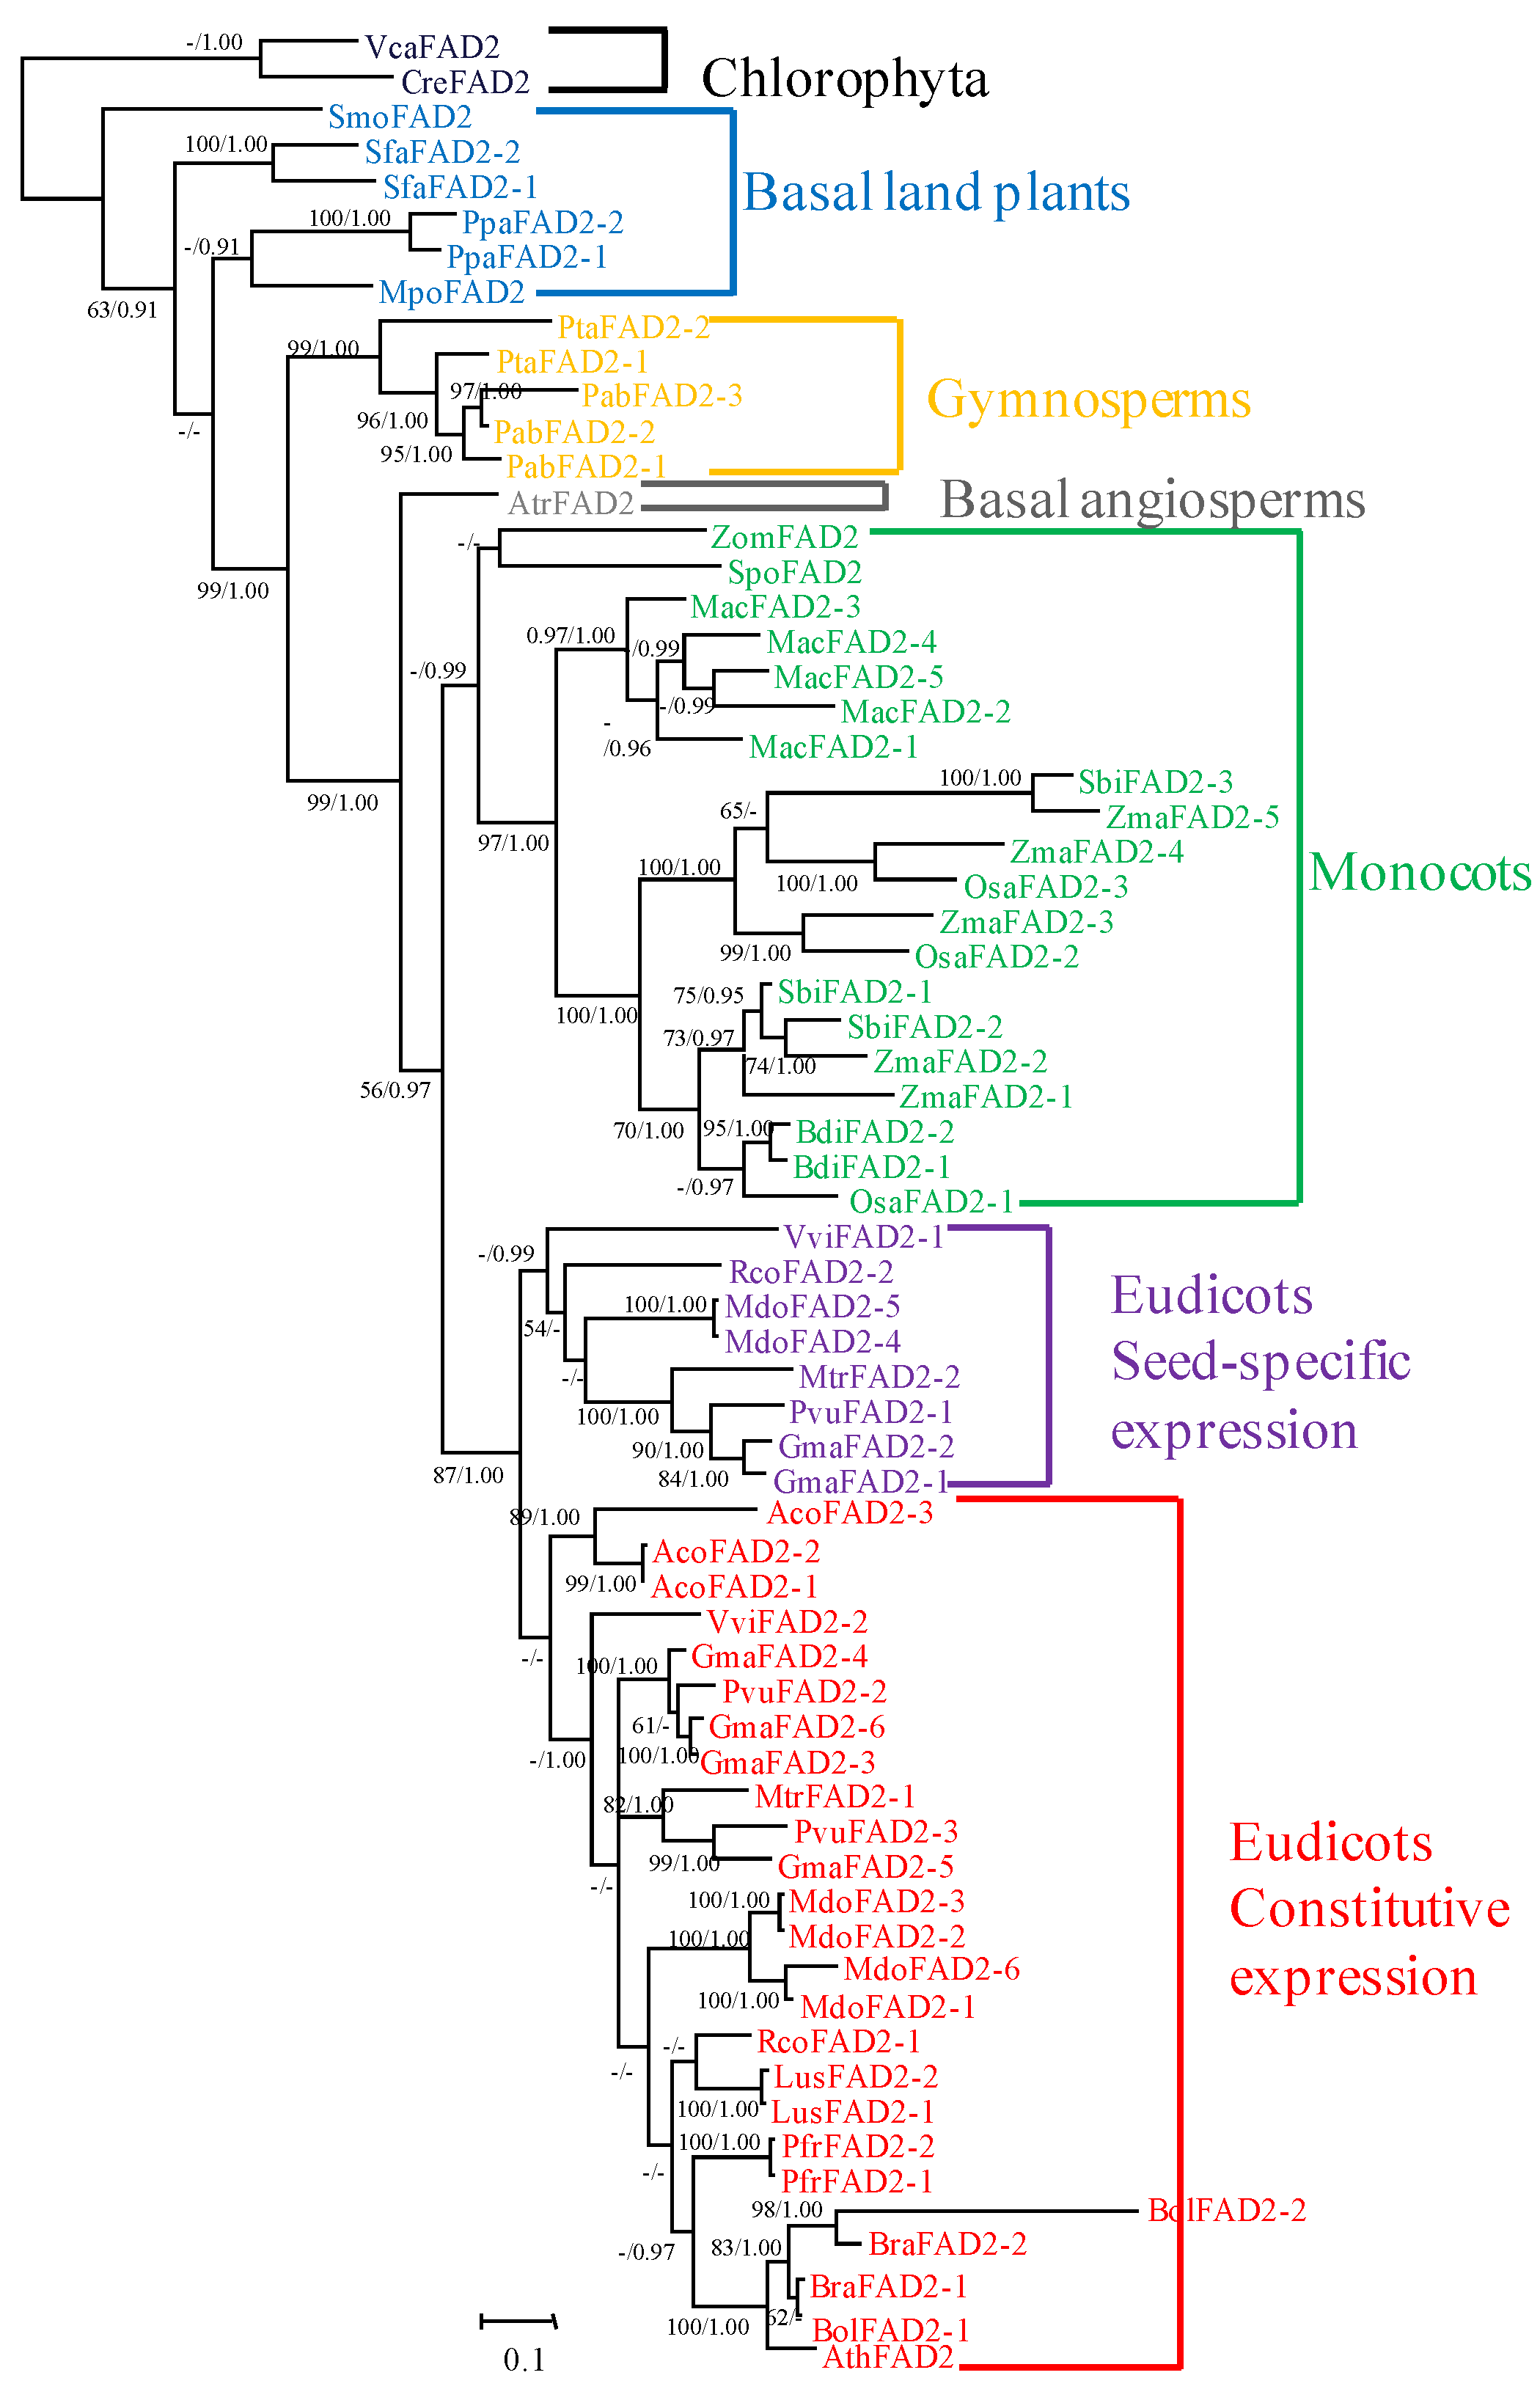
2.1. Phylogenetic Relationship of the FAD2 Gene Family
2.2. Gene Structures of FAD2 Genes
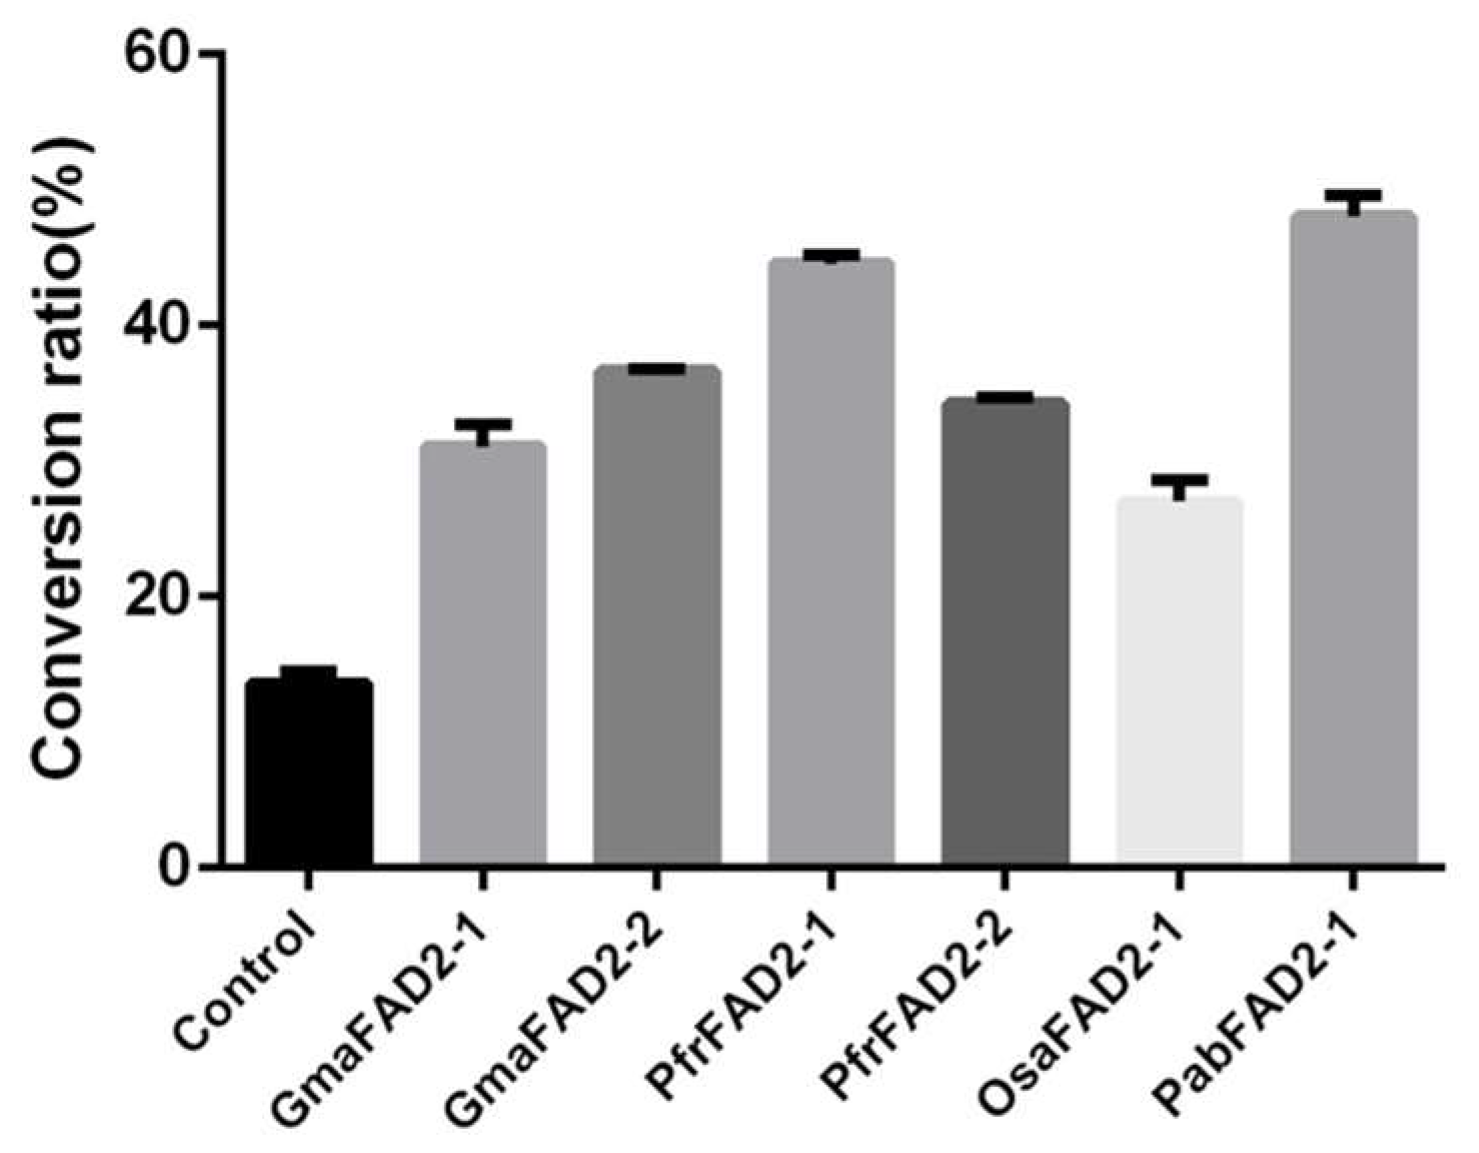
2.3. The Catalytic Activity of FAD2 across the Seed Plants
2.4. Site 143 Confers the Activity of GmaFAD2s
3. Discussion
4. Materials and Methods
4.1. Phylogenetic Analysis
4.2. Identification of Gene Structures and Protein Motifs
4.3. Ancestral States Reconstruction of Intron Numbers
4.4. Plant Materials and Gene Clone
4.5. Expression in S. cerevisiae
4.6. Fatty Acids Analysis
5. Conclusions
Supplementary Materials
Author Contributions
Funding
Conflicts of Interest
Abbreviations
| FAD2 | fatty acid desaturase 2 |
| SAD | stearic acid desaturase |
| OA | oleic acid |
| LA | linoleic acid |
| ALA | α-linolenic acid |
| SC-Ura | minimal medium plates lacking uracil |
| FAMEs | fatty acid methyl esters |
| GC-MS | gas chromatography-mass spectrometer |
| FID | flame ionization detector |
References
- Dyer, J.M.; Stymne, S.; Green, A.G.; Carlsson, A.S. High value oils from plants. Plant J. 2010, 54, 640–655. [Google Scholar] [CrossRef] [PubMed]
- Dar, A.A.; Choudhury, A.R.; Kancharla, P.K.; Arumugam, N. The FAD2 gene in plants: Occurrence, regulation, and role. Front. Plant Sci. 2017, 8, 1789. [Google Scholar] [CrossRef] [PubMed]
- Morales-Cedillo, F.; González-Solís, A.; Gutiérrez-Angoa, L. Plant lipid environment and membrane enzymes: The case of the plasma membrane H-ATPase. Plant Cell Rep. 2014, 34, 617–629. [Google Scholar] [CrossRef] [PubMed]
- Zhang, J.; Liu, H.; Sun, J.; Li, B.; Zhu, Q.; Chen, S. Arabidopsis fatty acid desaturase fad2 is required for salt tolerance during seed germination and early seedling growth. PLoS ONE 2012, 7, e30355. [Google Scholar] [CrossRef]
- Kitta, K.; Ebihara, M.; Iizuka, T. Variations in lipid content and fatty acid composition of major non-glutinous rice cultivars in Japan. J. Food Compos. Anal. 2005, 18, 269–278. [Google Scholar] [CrossRef]
- Jellum, M.D. Fatty acid composition of corn oil of parental inbreds and reciprocal crosses. J. Hered. 1966, 7, 243–244. [Google Scholar] [CrossRef]
- Pham, A.T.; Shannon, J.G.; Bilyeu, K.D. Combinations of mutant FAD2 and FAD3 genes to produce high oleic acid and low linolenic acid soybean oil. Theor. Appl. Genet. 2012, 125, 503–515. [Google Scholar] [CrossRef]
- Elbeltagi, H.E.S.; Mohamed, A.A. Variations in fatty acid composition, glucosinolate profile and some phytochemical contents in selected oil seed rape (Brassica napus L.) cultivars. Grasas Aceites 2010, 61, 143–150. [Google Scholar]
- Chi, X.; Yang, Q.; Pan, L. Isolation and characterization of fatty acid desaturase genes from peanut (Arachis hypogaea L.). Plant Cell Rep. 2011, 30, 1393–1404. [Google Scholar] [CrossRef]
- Pérez-Vich, B.; Velasco, L.; Fernández-Martínez, J.M. Determination of seed oil content and fatty acid composition in sunflower through the analysis of intact seeds, husked seeds, meal and oil by near-infrared reflectance spectroscopy. J. Am. Oil Chem. Soc. 1998, 75, 547–555. [Google Scholar] [CrossRef]
- Radovanovic, N.; Thambugala, D.; Duguid, S. Functional characterization of flax fatty acid desaturase FAD2 and FAD3 isoforms expressed in yeast reveals a broad diversity in activity. Mol. Biotechnol. 2014, 56, 609–620. [Google Scholar] [CrossRef] [PubMed]
- Lee, K.R.; Lee, Y.; Kim, E.H. Functional identification of oleate 12-desaturase and ω-3 fatty acid desaturase genes from Perilla frutescens, var. frutescens. Plant Cell Rep. 2016, 35, 1–15. [Google Scholar] [CrossRef] [PubMed]
- Carrier, D.J.; Cunningham, J.E.; Hogge, L.R. Gas chromatographic-mass spectrometric characterization of some fatty acids from white and interior spruce. J. Chromatogr. A. 1995, 715, 317–324. [Google Scholar] [CrossRef]
- Rueda, A.; Seiquer, I.; Olalla, M.; Giménez, R.; Lara, L.; Cabrera-Vique, C. Characterization of fatty acid profile of argan oil and other edible vegetable oils by gas chromatography and discriminant analysis. J. Chem. 2014, 2014, 1–8. [Google Scholar] [CrossRef]
- Guan, L.L.; Hou, K.; Chen, J.W.; Xu, Y.W.; Wu, W. Phylogeny and functional divergence of ω-6 and ω-3 fatty acid desaturase families. Hereditas 2013, 35, 643–654. [Google Scholar] [CrossRef] [PubMed]
- Nayeri, F.D.; Yarizade, K. Bioinformatics study of delta-12 fatty acid desaturase 2 (FAD2) gene in oilseeds. Mol. Biol. Rep. 2014, 41, 5077–5087. [Google Scholar] [CrossRef] [PubMed]
- Okuley, J.; Lightner, J.; Feldmann, K. Arabidopsis fad2 gene encodes the enzyme that is essential for polyunsaturated lipid synthesis. Plant Cell 1994, 6, 147. [Google Scholar] [CrossRef]
- Hernández, M.L.; Mancha, M.; Martínez-Rivas, J.M. Molecular cloning and characterization of genes encoding two microsomal oleate desaturases (FAD2) from olive. Phytochemistry 2005, 66, 1417–1426. [Google Scholar] [CrossRef]
- Pirtle, I.L.; Kongcharoensuntorn, W.; Nampaisansuk, M. Molecular cloning and functional expression of the gene for a cotton Δ-12 fatty acid desaturase (FAD2). Biochim. Biophys. Acta 2001, 1522, 122–129. [Google Scholar] [CrossRef]
- Xiong, X.; Guan, C.; Li, X. Cloning and sequencing of a cDNA sequence encoding FAD2 from Brassica napus. J. Hunan Agric. University 2002, 28, 97–99. [Google Scholar]
- Li, L.; Wang, X.; Gai, J. Molecular cloning and characterization of a novel microsomal oleate desaturase gene from soybean. J. Plant Physiol. 2007, 164, 1516–1526. [Google Scholar] [CrossRef] [PubMed]
- Khadake, R.M.; Ranjekar, P.K.; Harsulkar, A.M. Cloning of a novel omega-6 desaturase from flax (Linum usitatissimum L.) and its functional analysis in Saccharomyces cerevisiae. Mol. Biotech. 2009, 42, 168–174. [Google Scholar] [CrossRef] [PubMed]
- Martibez-Rivas, J.M.; Sperling, P.; Luhs, W.; Heinz, E. Spatial and temporal regulation of three different microsomal oleate desaturase genes (FAD2) from normal-type and high-oleic varieties of sunflower (Helianthus annuus L.). Mol. Breeding 2001, 8, 159–168. [Google Scholar] [CrossRef]
- Dierking, E.; Bilyeu, K. New sources of soybean seed meal and oil composition traits identified through TILLING. BMC Plant Biol. 2009, 9, 89. [Google Scholar] [CrossRef] [PubMed]
- Pham, A.T.; Lee, J.D.; Shannon, J.G. Mutant alleles of FAD2-1A and FAD2-1B combine to produce soybeans with the high oleic acid seed oil trait. BMC Plant Biol. 2010, 10, 195. [Google Scholar] [CrossRef] [PubMed]
- Buhr, T.; Sato, S.; Ebrahim, F.; Xing, A.; Zhou, Y.; Mathiesen, M.; Schweiger, B.; Kinney, A.; Staswick, P.; Clemente, T. Ribozyme termination of RNA transcripts down-regulate seed fatty acid genes in transgenic soybean. Plant J. 2002, 30, 155–163. [Google Scholar] [CrossRef] [PubMed] [Green Version]
- Graef, G.; LaVallee, B.; Tenopir, P.; Tat, M.; Schweiger, B.; Kinney, A.; Gerpen, J.; Clemente, T. A high-oleic-acid and low-palmitic-acid soybean: Agronomic performance and evaluation as a feedstock for biodiesel. Plant Biotech J. 2009, 7, 411–421. [Google Scholar] [CrossRef] [PubMed]
- Patel, M.; Jung, S.; Moore, K. High-oleate peanut mutants result from a MITE insertion into the FAD2 gene. Theor Appl. Genet. 2004, 108, 1492–1502. [Google Scholar] [CrossRef] [PubMed]
- Okuzaki, A.; Ogawa, T.; Koizuka, C. CRISPR/Cas9-mediated genome editing of the fatty acid desaturase 2 gene in Brassica napus. Plant Physiol. Biochem. 2018, 131, 63–69. [Google Scholar] [CrossRef] [PubMed]
- Long, W.; Hu, M.; Gao, J.; Chen, S.; Zhang, J.; Cheng, L.; Pu, H. Identification and functional analysis of two new mutant BnFAD2 alleles that confer elevated oleic oil acid content in rapeseed. Front Genet. 2018, 9, 399. [Google Scholar] [CrossRef] [PubMed]
- Zhou, Z.; Wang, M.J.; Zhao, S.T. Changes in freezing tolerance in hybrid poplar caused by up- and down-regulation of PtFAD2 gene expression. Transgenic Res. 2010, 19, 647–654. [Google Scholar] [CrossRef] [PubMed]
- Kargiotidou, A.; Deli, D.; Galanopoulou, D.; Tsaftaris, A.; Farmaki, T. Low temperature and light regulate delta 12 fatty acid desaturases (FAD2) at a transcriptional level in cotton (Gossypium hirsutum). J. Exp. Bot. 2008, 59, 2043–2056. [Google Scholar] [CrossRef] [PubMed]
- Shanklin, J.; Achim, C.; Schmidt, H.; Fox, B.G.; Munck, E. Mössbauer studies of alkane omega-hydroxylase: Evidence for a diiron cluster in an integral membrane enzyme. Proc. Natl. Acad. Sci. USA 1997, 94, 2981–2986. [Google Scholar] [CrossRef] [PubMed]
- Wang, H.; Klein, M.G.; Zou, H.; Lane, W.; Snell, G.; Levin, I.; Li, K.; Sang, K.L. Crystal structure of human stearoyl-coenzyme A desaturase in complex with substrate. Nat. Struct. Mol. Biol. 2015, 22, 581–585. [Google Scholar] [CrossRef] [PubMed]
- Katju, V.; Lynch, M. The structure and early evolution of recently arisen gene duplicates in the Caenorhabditis elegans genome. Genetics 2003, 165, 1793–1803. [Google Scholar]
- Kim, M.J.; Kim, H.J.; Shin, J.S.; Chung, C.H.; Ohlrogge, J.B.; Suh, M.C. Seed-specific expression of sesame microsomal oleic acid desaturase is controlled by combinatorial properties between negative cis-regulatory elements in the SeFAD2 promoter and enhancers in the 5’UTR intron. Mol. Genet. Genomics. 2006, 276, 351–368. [Google Scholar] [CrossRef]
- Kim, M.J.; Kim, J.K.; Shin, J.S.; Suh, M.C. The SebHLH transcription factor mediates trans-activation of the SeFAD2 gene promoter through binding to E- and G-box elements. Plant Mol. Biol. 2007, 64, 453–466. [Google Scholar] [CrossRef]
- Hall, T.A. BioEdit: A user-friendly biological sequence alignment editor and analysis program for Windows 95/98/NT. Nuc. Acids Symp. Series 1999, 41, 95–98. [Google Scholar]
- Guindon, S.; Gascuel, O. A simple, fast, and accurate algorithm to estimate large phylogenies by maximum likelihood. Syst. Biol. 2003, 52, 696–704. [Google Scholar] [CrossRef]
- Huelsenbeck, J.P.; Ronquist, F. MRBAYES: Bayesian inference of phylogenetic trees. Bioinformatics 2001, 17, 754–755. [Google Scholar] [CrossRef] [Green Version]
- Tamura, K.; Stecher, G.; Peterson, D.; Filipski, A.; Kumar, S. MEGA6: Molecular evolutionary genetics analysis version 6.0. Mol. Biol. Evol. 2013, 30, 2725–2729. [Google Scholar] [CrossRef] [PubMed]
- Bailey, T.L.; Bodén, M.; Buske, F.A.; Frith, M.; Grant, C.E.; Clementi, L.; Ren, J.; Li, W.W.; Noble, W.S. MEME SUITE: Tools for motif discovery and searching. Nucleic Acids Res. 2009, 37, 202–208. [Google Scholar] [CrossRef] [PubMed]
- Maddison, W.P.; Maddison, D.R. Mesquite: A modular system for evolutionary analysis. Evolution 2008, 62, 1103–1118. [Google Scholar]
- Gietz, R.D.; Schiestl, R.H.; Williems, A.R.; Woods, R.A. Studies on the transformation of intact yeast cells by the LiAc/SSDNA/PEG procedure. Yeast 1995, 11, 355–360. [Google Scholar] [CrossRef] [PubMed]
- Kandhro, A.; Sherazi, S.T.; Mahesar, S.A.; Bhanger, M.I.; Younis, T.M.; Rauf, A. GC-MS quantification of fatty acid profile including trans FA in the locally manufactured margarines of pakistan. Food Chem. 2008, 109, 207–211. [Google Scholar] [CrossRef] [PubMed]


| Fatty Acid Composition (%) | |||||
|---|---|---|---|---|---|
| Seed Plants | Oleic Acid (C18:1) | Linoleic Acid (C18:2) | Linolenic Acid (C18:3) | Total Oil (dry weight %) | References |
| Oryza sativa | 31.1–41 | 31–38.5 | 0.9–1.6 | 2.76–3.91 | [5] |
| Zea mays | 22.9–45.5 | 36.2–62.3 | 0.69–1.6 | 3.5–6.5 | [6] |
| Glycine max | 23 | 54 | 8 | 15–20 | [7] |
| Brassica napus L | 56.3–58.7 | 10.5–13.7 | 8.8–10.3 | 30–45 | [8] |
| Arachis hypogaea L | 36–67 | 15–43 | - | 50 | [9] |
| Helianthus annuusL | 41.5 | 41.5 | - | 37.8 | [10] |
| Linum usitatissimum L | 10.0–12.4 | 10.1–16.4 | 53.4–65.8 | 36.6–44.9 | [11] |
| Perilla frutescens | 11.2 | 13.8 | 66 | 40 | [12] |
| Picea abies | 17–18 | 47–49 | 24–26 | 41–49 | [13] |
© 2019 by the authors. Licensee MDPI, Basel, Switzerland. This article is an open access article distributed under the terms and conditions of the Creative Commons Attribution (CC BY) license (http://creativecommons.org/licenses/by/4.0/).
Share and Cite
Zhao, M.; Wang, W.; Wei, L.; Chen, P.; Peng, L.; Qin, Z.; Yuan, F.; Wang, Z.; Ying, X. The Evolution and Biocatalysis of FAD2 Indicate Its Correlation to the Content of Seed Oil in Plants. Int. J. Mol. Sci. 2019, 20, 849. https://doi.org/10.3390/ijms20040849
Zhao M, Wang W, Wei L, Chen P, Peng L, Qin Z, Yuan F, Wang Z, Ying X. The Evolution and Biocatalysis of FAD2 Indicate Its Correlation to the Content of Seed Oil in Plants. International Journal of Molecular Sciences. 2019; 20(4):849. https://doi.org/10.3390/ijms20040849
Chicago/Turabian StyleZhao, Man, Wenyi Wang, Lei Wei, Peng Chen, Li Peng, Zhen Qin, Fengjie Yuan, Zhao Wang, and Xiangxian Ying. 2019. "The Evolution and Biocatalysis of FAD2 Indicate Its Correlation to the Content of Seed Oil in Plants" International Journal of Molecular Sciences 20, no. 4: 849. https://doi.org/10.3390/ijms20040849